Article

PSO-BP-Based Morphology Prediction Method for DED Remanufactured Deposited Layers

School of Mechanical Engineering, Shenyang University of Technology, No. 111, Shenliao West Road, Tiexi District, Shenyang 110870, China
*
Author to whom correspondence should be addressed.
Sustainability 2023, 15(8), 6437; https://doi.org/10.3390/su15086437
Submission received: 19 March 2023 / Revised: 6 April 2023 / Accepted: 7 April 2023 / Published: 10 April 2023

Abstract

:
Directed energy deposition is a typical laser remanufacturing technology, which can effectively repair failed parts and extend their service life, and has been widely used in aerospace, metallurgy, energy and other high-end equipment key parts remanufacturing. However, the repair quality and performance of the repaired parts have been limited by the morphological and quality control problems of the process because of the formation mechanism and process of the deposition. The main reason is that the coupling of multiple process parameters makes the deposited layer morphology and surface properties difficult to be accurately predicted, which makes it difficult to regulate the process. Thus, the deposited layer forming mechanism and morphological properties of directed energy deposition were systematically analyzed, the height and width of multilayer deposition layers were taken as prediction targets, and a PSO-BP-based model for predicting the morphology of directed energy deposited layers was settled. The weights and thresholds of Back Propagation (BP) neural networks were optimized using a Particle Swarm Optimization (PSO) algorithm, the predicted values of deposited layer morphology for different process parameters were obtained, and the problem of low accuracy of deposited layer morphology prediction due to slow convergence and poor uniformity of the solution set of traditional optimization models was addressed. Remanufacturing experiments were conducted, and the experimental results showed that the deposited layer morphology prediction model proposed in this paper has a high prediction accuracy, with an average prediction error of 1.329% for the layer height and 0.442% for the layer width. The research of the paper provided an effective way to control the morphology and properties of the directed energy deposition process. A valuable contribution is made to the field of laser remanufacturing technology, and significant implications are held for various industries such as aerospace, metallurgy, and energy.

1. Introduction

In recent years, directed energy deposition (LDED) has emerged as a promising technology for remanufacturing in various fields [1,2]. However, the quality of remanufactured parts using LDED has not met the expected standards. The formation of uneven surfaces, deformation, and cracking of the deposited layer has been identified as a major issue that impedes the advancement and applicability of LDED technology in high-precision and advanced fields.
Several factors, such as laser power, scanning speed, and powder flow rate, among others, can influence the quality of the layer deposited, as stated in [3]. The factors are interdependent and pose significant challenges to achieving optimal quality control. Predicting the height and width of the coating during the remanufacturing process and adjusting the process parameters accordingly can lead to higher-quality coatings [4].
Due to the complex nonlinear relationship between process parameters and the deposited layer during directed energy deposition, it is difficult to find an accurate mathematical model that reflects its inherent laws. However, some in-depth research has been conducted to address this issue.
Some scholars employ experiments to investigate the impact of various laser process parameters on the quality indicators of deposited layers. Tanigawa D. et al. [5] studied the effect of laser beam profile on the deposited layer, using a flat-top contour model to suppress the generation of droplets. Compared with the Gaussian contour model, the surface was smoother, and the dilution rate was effectively controlled. Jelvani S. et al. [6] investigated the impact of the key parameters on the geometric characteristics of single-track deposits. They acquired LADMD deposits with minimum defects and controlled geometric accuracy. A process map was created to optimize the process parameters for Inconel 718 in the LADMD process. Erfanmanesh, M. et al. [7] developed a processing map that shows the optimum parameters for the directed energy deposition process of WC-12Co powder on AISI 321 stainless steel by regression method (RA). A study conducted by Aghili et al. [8] utilized regression analysis to predict the correlation between processing parameters and the geometrical properties of single-line deposited layers. They developed a processing window for the directed energy deposition of the Cr3C2-NiCr powder mixture on the TiAl substrate. Li X B. et al. [9] studied the influence law of tilt angle on the morphology of directed energy deposition through geometric parameters and the profile of the directed energy deposition. Amine T. et al. [10,11] studied the multilayer direct laser deposition (DLD), and modifying the process parameters and cooling rate was demonstrated to cause diverse impacts on the microstructure morphology and property values of the deposited layer. Ali E. [12] analyzed the influence of laser process parameters on the structure of the deposited layer and determined the best process parameters of laser processing by orthogonal experiments. Armin P. et al. [13] studied the influence of laser process parameters on the quality of deposited layer geometry. Jaritngam, P. et al. [14,15] studied surface characteristics and machining performance of titanium alloy equipment, thus laying a foundation for quality control in the laser processing of titanium alloy materials. Tan H. et al. [16] elucidated the reason for the abnormal formation height at both ends of the deposited layer and proposed a laser beam stalling method to address this issue.
Some scholars also conduct simulation analysis of the quality of deposited layers by establishing simulation models: Reddy L. et al. [17] established a model to investigate the influence of laser technological parameters on the dilution rate during the deposited process. Through model prediction, an appropriate dilution rate was calculated to ensure excellent performance of the deposited. El Cheikh H. et al. [18] studied two models for predicting the form and geometric features of single laser track cross-sections. Results showed that the laser track geometry could be reproduced in all the areas experimentally explored. Wang X L. et al. [19] created a theoretical model to predict the clad geometry of the initial deposition layer in the LMD process based on the chosen process parameters. Onwubolu G C. et al. [20] identified laser scattering as the culprit for the decrease in laser energy during directed energy deposition and proposed a scheme to control laser energy. Marimuthu S. et al. [21] developed a numerical model based on a computational fluid dynamic formulation, which optimized laser polishing parameters and reduced surface roughness from 10.2 μm to 2.4 μm. Wang, J. H. et al. [22,23] introduced a new method to measure powder distribution density and established a model of laser energy attenuation by defining the effective number of powder particles, thus accurately predicting the powder effective utilization rate and single deposited layer thickness in the laser solid forming process.
Nearly all of the aforementioned research on laser process parameters relies heavily on experiments. Most of them mentioned that the key parameters affecting the quality of the formed deposited layers are laser power, scanning speed, and powder feeding speed, among others. However, the impact of other parameters (such as shielding gas, carrier gas flow rate, powder feeding diameter, etc.) cannot be ignored during the experiment, but it is difficult to fully explain and reduce experimental errors. This can lead to two consequences:
  • Simulation results differ significantly from experimental results.
  • The generalizability of the process conclusions obtained varies depending on the additive manufacturing equipment used.
In recent years, scholars have gradually started to develop artificial neural networks or intelligent algorithms to predict the quality of deposited layers. For example, Xu, Z. M. et al. [24] suggested a model forecast the surface quality of directed energy deposition parts, which covers the deposited layer’s width, depth, and dilution rate, based on an improved learning algorithm, improving measurement precision with a maximum relative error of 2.14% between predicted and real values. Alimardani, M. et al. [25] developed a predictive model using a neural network and fuzzy control algorithm to predict and control the height of the directed energy deposition layer. Varol, T et al. [26] studied a feed-forward back-propagation ANN to predict the coating thickness of Fe-Al intermetallic coatings; the mean absolute percentage error (MAPE) for the predicted values didn’t exceed 7.46%. Gao JL et al. [27] established a BPNN model to predict the molten pool temperature and processing quality of the deposited layer under the combination of five new process parameters groups, established the prediction relationships between the deposition input parameters and processing status parameters, geometric morphology and mechanical property parameters. Li HY et al. [28] found that the relationship between the cladding process parameters and the two-dimensional morphology of the cladding layer can be roughly reflected by the back-propagation algorithm; the error rate is 10–20%.
Previous research using neural networks has been able to achieve basic predictions of deposited layer quality. However, there are some limitations to using neural networks for this purpose.
  • The training of neural networks often requires a large amount of experimental work, which can be time-consuming and costly.
  • Using neural networks to predict the quality of deposited layers can suffer from slow convergence and the tendency to get stuck in local minima.
To address the aforementioned limitations, a particle swarm optimization neural network model is proposed in this study. The model investigates the key process parameters that affect the quality of the deposited layer. A BP neural network model is established to predict the height and width of the deposited layer, with laser power, powder flow rate, and scanning speed as input parameters. The particle swarm optimization algorithm is utilized to optimize the network’s weights and thresholds, thereby improving the training speed and prediction accuracy of the network. The problem of slow convergence and poor uniformity of solution sets in traditional optimization models, which can lead to the low prediction accuracy of the morphology of the deposited layer, can be addressed.

2. Methods

2.1. Directed Energy Deposition

2.1.1. Quality Connotation of Directed Energy Deposition

The quality of deposited layers in directed energy deposition is characterized by forming accuracy, quality defects, and mechanical properties [29].
Forming accuracy is a critical aspect of evaluating the quality of the deposit, which is typically determined by the height, width, and surface smoothness of the deposited layer. The accuracy of height and width not only affects the surface finish but also impacts the dilution rate and adhesion properties of the deposited layer to the substrate. The choice of process parameters in directed energy deposition, including laser power, scanning speed, powder flow rate, and overlap ratio, is the main factor that affects forming accuracy [30,31].
The quality defects in deposited layers are often manifested as the presence of pores and cracks formed during the deposited process. During the process, the deposited layer is formed at high temperatures and fused with the substrate [32]. However, upon cooling, the difference in thermal expansion coefficients between the two can create inner tensile stresses, which, if too great, can lead to cracks in the deposited layer.
The mechanical properties mainly depend on the mechanical properties of the cladding powder [33]. Therefore, when selecting the cladding powder, it is important to consider factors such as thermal expansion coefficient, elastic model, hardness, tensile strength, and wear resistance [34].
The quality defects and mechanical properties of the deposited layer are often related to the selection of the deposited material [18,35]. Therefore, this paper focuses on predicting the forming accuracy of the deposited layer, specifically the height and width, as they are important indicators of quality and are affected by the selection of the deposited material.

2.1.2. Analysis of Influencing Factors of Deposited Layer Quality

The quality of the deposited layer is affected by plenty of parameters, including laser power, powder flow rate, scanning speed, overlap ratio, preheating temperature, etc. In this paper, laser power, powder flow rate, and scanning speed, which have a great influence on the quality of the deposited layer, are selected as the research objects.
These parameters can be adjusted to optimize the cladding process and achieve the desired results in terms of forming accuracy, quality defects, and mechanical properties of the deposited layer. Other parameters, such as overlap ratio and preheating temperature, can also play a significant role in the quality of the cladding process and should be carefully considered when designing a cladding process.
  • Effect of the laser power on deposited layer quality
Within a certain range, the height of the deposited increases with increasing laser power. Therefore, more powder enters the molten pool, which is beneficial to increase the height of the coating. However, when the laser power is too high, the temperature gradient in the molten pool will change the internal surface tension of the liquid, thereby destroying the balance between the surface tension of the liquid metal in the molten pool and its own gravity. After the equilibrium state is broken, the liquid metal flows down the sides of the molten pool. When the molten pool becomes wider and shallower, the two-reach equilibrium again, which causes the deposited height to decrease. The width of the deposited increases as the laser power increases because greater laser power will result in a larger size molten pool.
  • Effect of the scanning speed on deposited layer quality
The faster the scanning speed, the lower the deposited height. This is because the scanning speed largely represents the laser energy effect, which determines the amount of powder melting per unit of time. The faster the scanning speed, the less powder enters the molten pool per unit of time. The shorter the interaction time between the beam, powder, and substrate, the less energy is absorbed by the powder and substrate, and the less the powder is melted, resulting in a reduction in the height of the coating. The width of the deposit also decreases as the scanning speed increases. In addition to the reason that increasing the scanning speed will reduce the melted powder, the faster scanning speed will also make the laser energy absorbed by the substrate and powder insufficient, resulting in a smaller size of the molten pool and deposited width.
  • Effect of the powder flow rate on deposited layer quality
The height and width of the deposited layer various follow the flow rating of the powder. This is because an increase in the powder flow rate results in more powder entering the molten pool and melting per unit of time, thereby increasing the height and width of the coating layer. However, an excessively high powder flow rate may lead to insufficient melting and solidification of the powder, making it difficult for the powder to adhere to the substrate. This can significantly affect the accuracy and quality of the formed layer and may even cause processing failure.

2.2. Construction of Directed Energy Deposition Layer Quality Model Based on PSO-BP Neural Network

2.2.1. Construction of PSO-BP Network

To achieve higher accuracy in predicting the quality of the deposited layer in directed energy deposition, a neural network with strong abilities in nonlinear function approximation, fault tolerance, adaptive learning, and parallel information processing is necessary due to the complex and nonlinear relationship between process parameters and the deposited layer. However, neural networks have the drawbacks of slower convergence speed and a tendency to fall into a locally optimal solution easily. To enhance the model accuracy, the BP neural network’s weight and threshold were optimized using a particle swarm optimization algorithm. Figure 1 illustrates the flowchart of the entire particle swarm optimization BP neural network.
  • Determine the structure and particle dimensions of the neural network
Multiple factors affect the deposited layer’s quality. This study focuses on three key process parameters: laser power, scanning speed, and powder feeding speed. These input layer variables significantly impact the quality of the deposited layer. Therefore, the number of input layer nodes is set to 3. The output layer variables include the height and width of the deposited layer, which are the key indicators that determine the quality of the deposited layer. Thus, the number of nodes in the output layer is 2. The number of nodes in the hidden layer of the neural network is generally determined by the following two formulas.
n = I + O + a
n = 2 I + 1
In the formula, n is the number of hidden layer nodes; I is the number of input layer nodes (input layer variables); O is the number of output layer nodes (output layer variables); a is a constant between 0 and 10.
The neural network in this study has three input layer nodes and two output layer nodes, and the number of hidden layer nodes ranges from 7 to 12 according to the two formulas mentioned earlier. After actual verification, the optimal number of hidden layer nodes is found to be ten, resulting in the most accurate network prediction. The structure of the neural network is depicted in Figure 2.
Therefore, the number of weights of the neural network is 3 × 10 + 10 × 2 = 50, with a total of 50 weights; the number of thresholds is 10 + 2 = 12, with a total of 12 thresholds. The dimension of the particle swarm algorithm is 50 + 12 = 62.
  • Setting of particle swarm algorithm parameters
The parameters of the initial particle swarm algorithm include the initial velocity and position of the particles, and the range of the velocity and position of the particles is [−1, 1]. The acceleration factor c1 = c2 = 2, and the maximum number of iterations is 100. In actual application, the value cannot be too high. So the accuracy is set to be 10−6 to prevent the predicted value from being too close to the actual value and losing the prediction elasticity accuracy.
Figure 1. Flow chart of BP neural network for particle swarm optimization.
Sustainability 15 06437 g001
  • Determination of fitness function
The process of updating weights and thresholds in the BP network aims to minimize training errors. To achieve this, the mean square error is utilized as the fitness function in the particle swarm optimization algorithm. Here is the fitness function for the particle swarm:
Figure 2. Structure diagram of neural network.
Sustainability 15 06437 g002
E = 1 n k = 1 n ( Y k O k ) 2
In the formula, n is the number of training samples; Yk is the actual output value of the sample; Ok is the predicted output value of the network.
  • Update the speed and position of particles to generate new populations.
  • Update the individual optimal value Pb and global optimal value Gb of the particles, and then proceed to the next step when the maximum iteration times are reached; otherwise, return to the previous step to continue the iteration.
  • Map the global optimal value Pg generated in the previous step to the weight and threshold of the BP neural network. Perform network training to further update weights and thresholds until the error meets the accuracy requirements.
  • Use test samples to check the accuracy of network prediction.

2.2.2. Deposited Layer Quality Control System

The model diagram of the directed energy deposition quality closed-loop control system is presented in Figure 3. The closed-loop control system comprises a deposited layer quality prediction model and industrial computer-directed energy deposition equipment, such as the host, laser head, and powder feeder. During the directed energy deposition process, the laser power, powder feeding speed, scanning speed, and other process parameter information are received by the prediction model to forecast the quality of the deposited layer. The prediction information is received, and the process parameters of the directed energy deposition equipment are adjusted through the controller to complete the closed-loop control of the quality of the directed energy deposition layer by the industrial computer. By continuously modifying the directed energy deposition process parameters, the system is capable of producing higher-quality deposited layers.

3. Case Study

3.1. Formation of the Deposited Layer

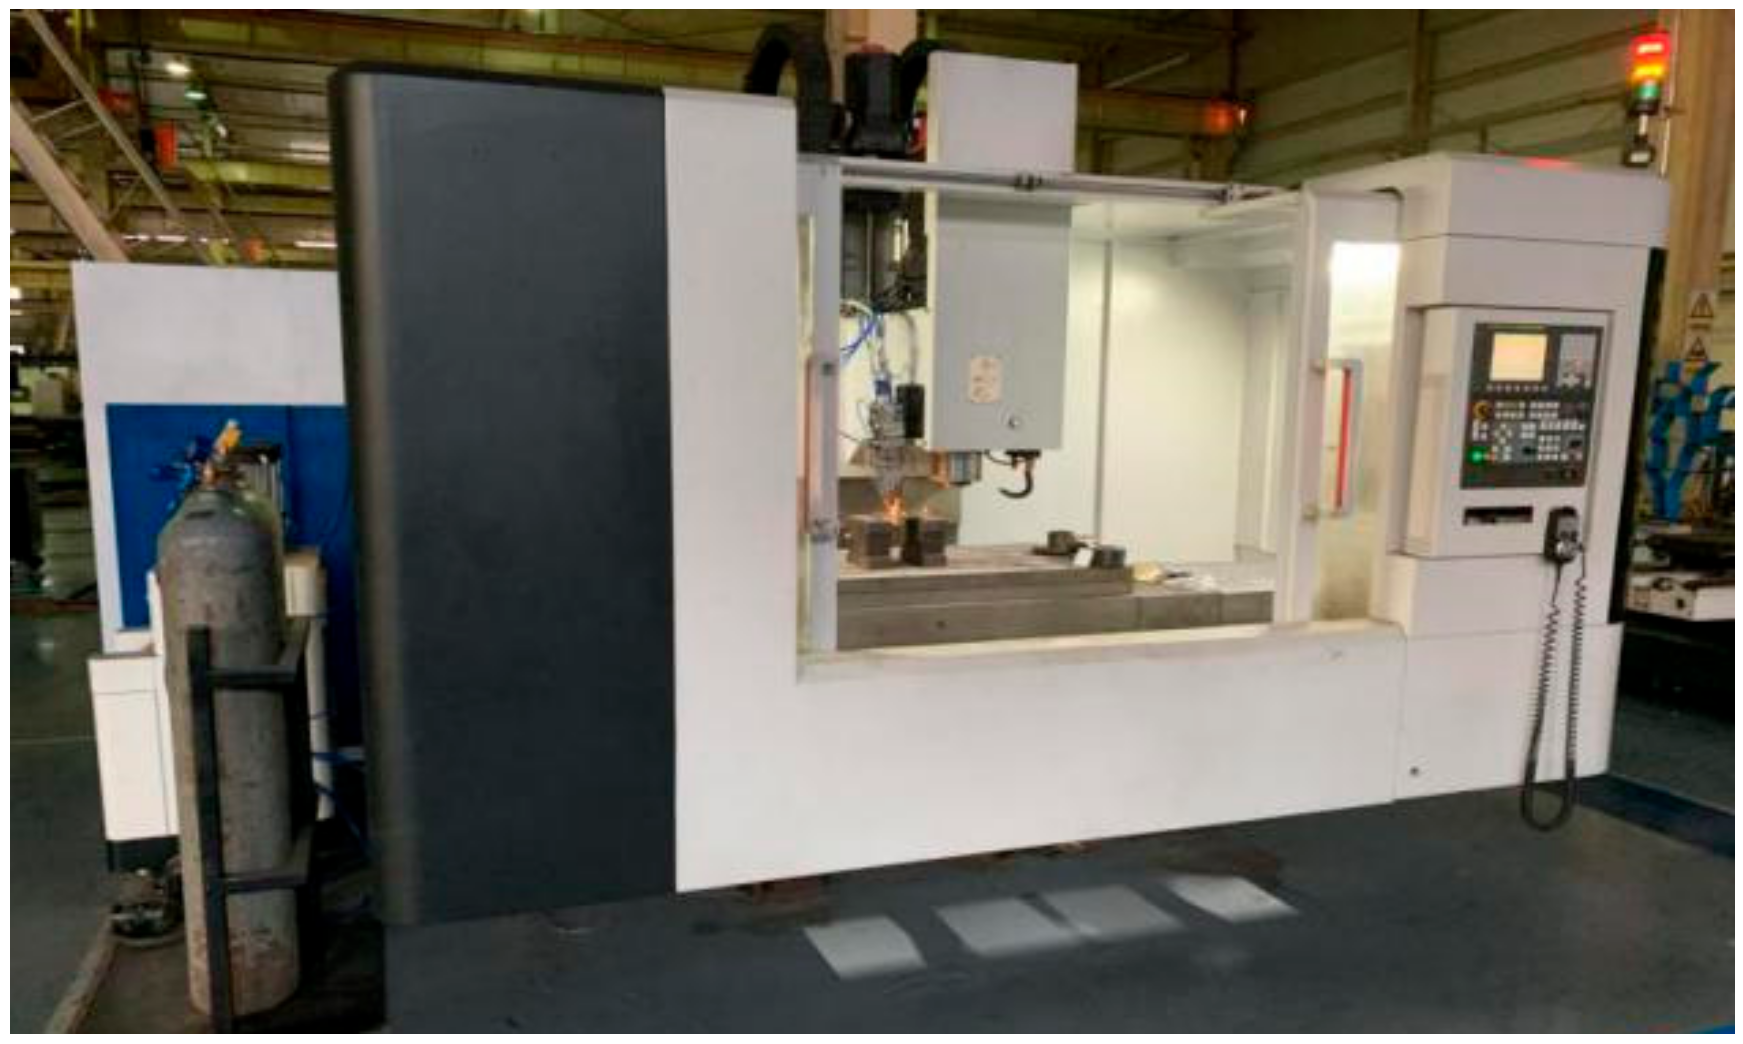
The experimental equipment is metal 3D printing equipment that has been modified based on a vertical machining center. This equipment offers the high precision of the machining center, as seen in Figure 4. It is equipped with an IPG fiber laser that can output a maximum power of 1000 W. The powder feeder used is a double-bin negative-pressure powder feeder. The processing head is an RC52-directed energy deposition head with a focal length of 300 mm and a focal spot of 0.6 mm. The main machine is a vertical machining center produced by the Shenyang machine tool, which has an X-axis positioning accuracy of 0.012 mm and a Y/Z-axis positioning accuracy of 0.01 mm.
The deposited powder is Fe304 alloy powder, and its composition is shown in Table 1. The 45# steel plate of 200 mm × 200 mm × 10 mm is selected as the substrate.
The laser power, powder flow rate, and scanning speed, which have a great influence on the deposited quality, are selected as three factors in the deposited orthogonal experiment. To ensure that the experiment was within the working range of the available equipment, five commonly used experimental levels were chosen for each factor. The experimental parameters are detailed in Table 2, and the deposited length is 50 mm. The entire experiment was conducted under argon protection with a carrier gas flow rate of 5 L/min.
The deposited layer obtained from the experiment is shown in Figure 5.

3.2. Experimental Data Acquisition

The OLY-MNX image processing software was utilized to measure the height and width of the deposited layer, as depicted in Figure 6. In this figure, H0 and W0 represent the height and width, respectively. A total of 25 sets of sample data were collected through the experiment.
To improve the accuracy of the prediction model, it is necessary to normalize the sample data before training. This is because the units and magnitudes of each item in the sample data are different. Normalization helps to transform the value range of the data to [−1, 1]. The formula for data normalization is as follows:
X = 2 X i X min X max X min 1
where X′ is the normalized data; Xi is the initial data; Xmin is the minimum value in the same group of data; Xmax is the maximum value in the same group of data. Similarly, the predicted values of the model need to be reversely normalized.

4. Results

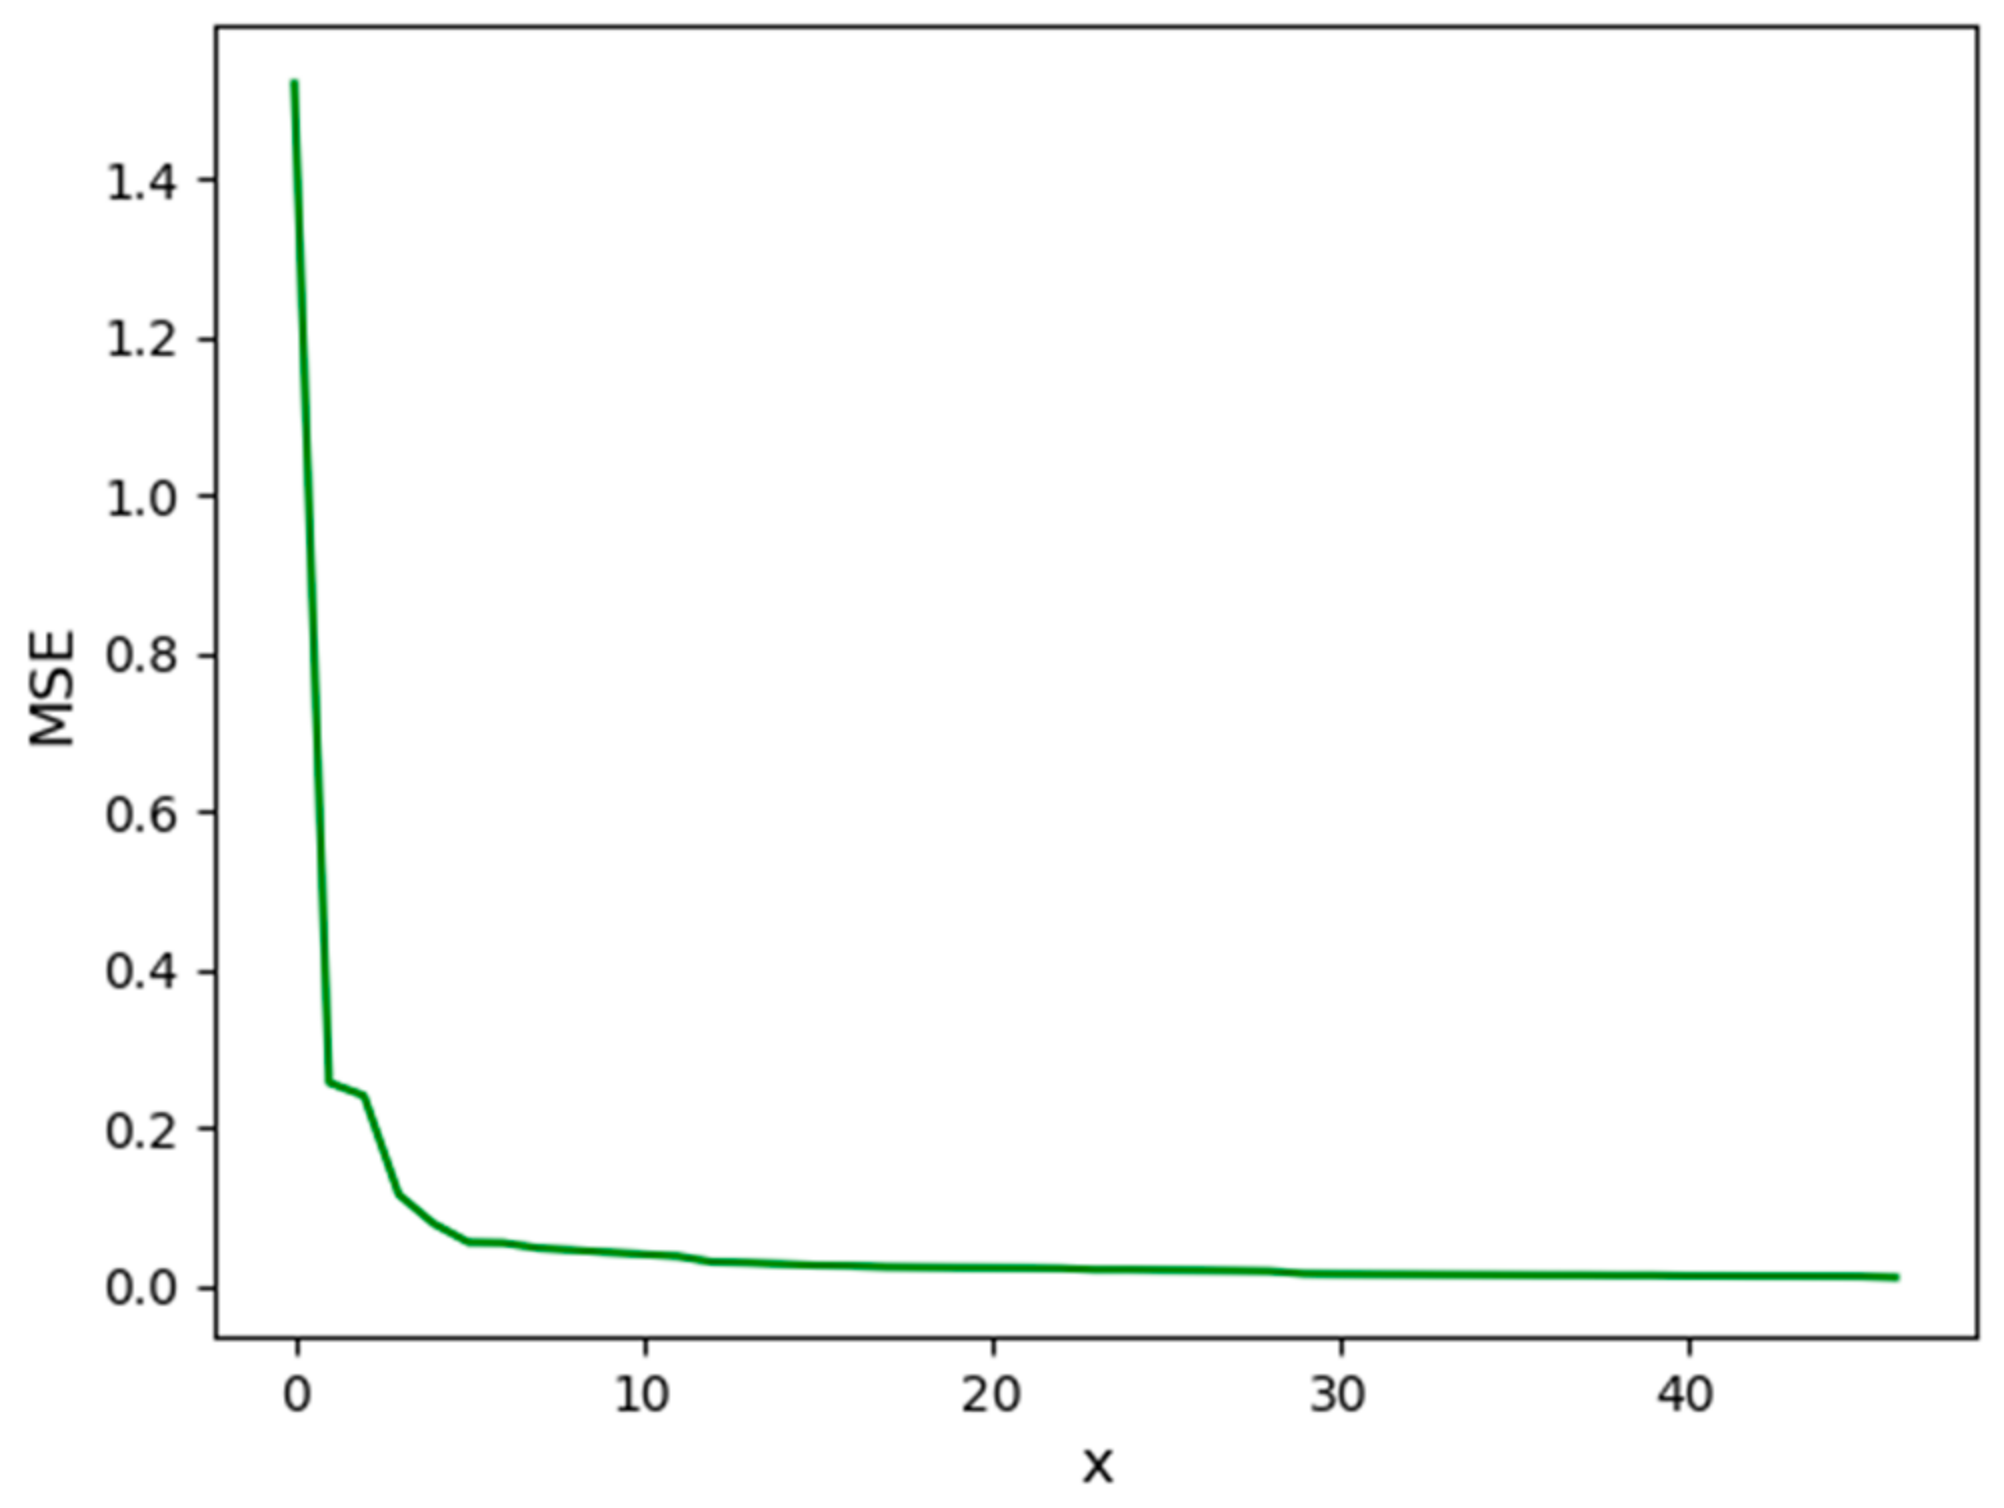
The study utilized 120 sets of data obtained from experiments, with 100 of them being used as training samples and the remaining 20 as test samples. The detailed dataset of 120 groups of DED experiments can be found in the Supplementary Materials. The data was then fed into the proposed model for training, and the curve of the mean square error of the network with iteration times is depicted in Figure 7. As shown in the figure, the mean square error of the particle swarm optimization neural network gradually decreases with an increase in the number of iteration times. Additionally, the training outcomes for the deposited layer height and deposited layer width samples are presented in Figure 8 and Figure 9, respectively.
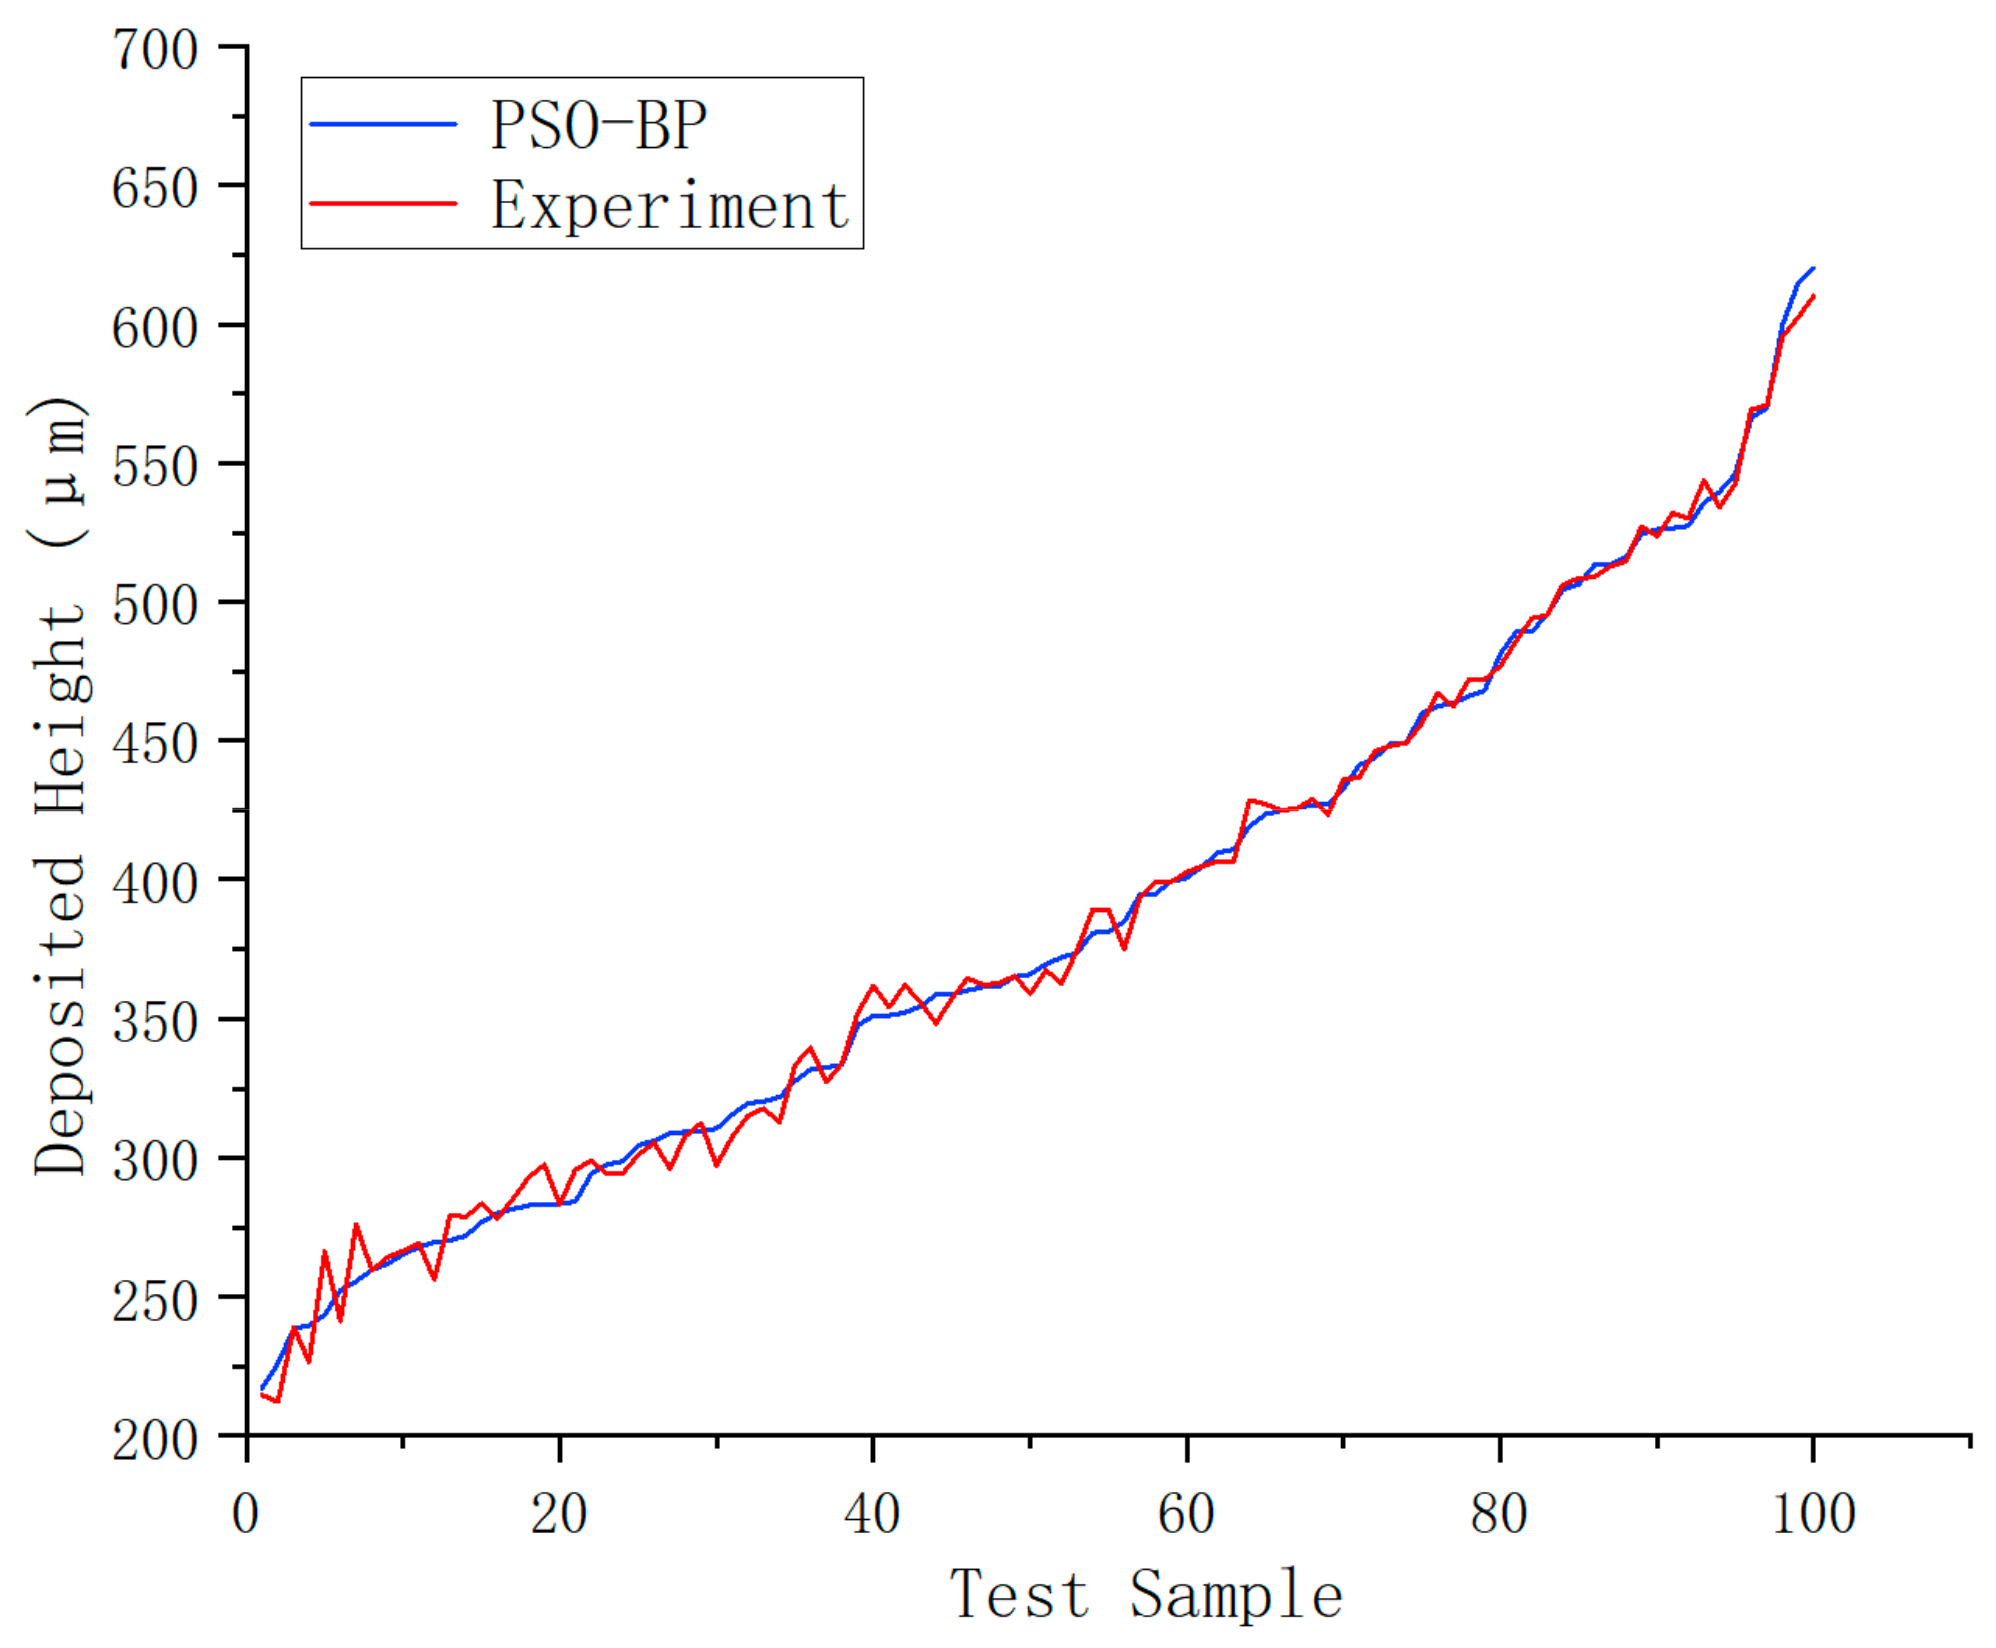
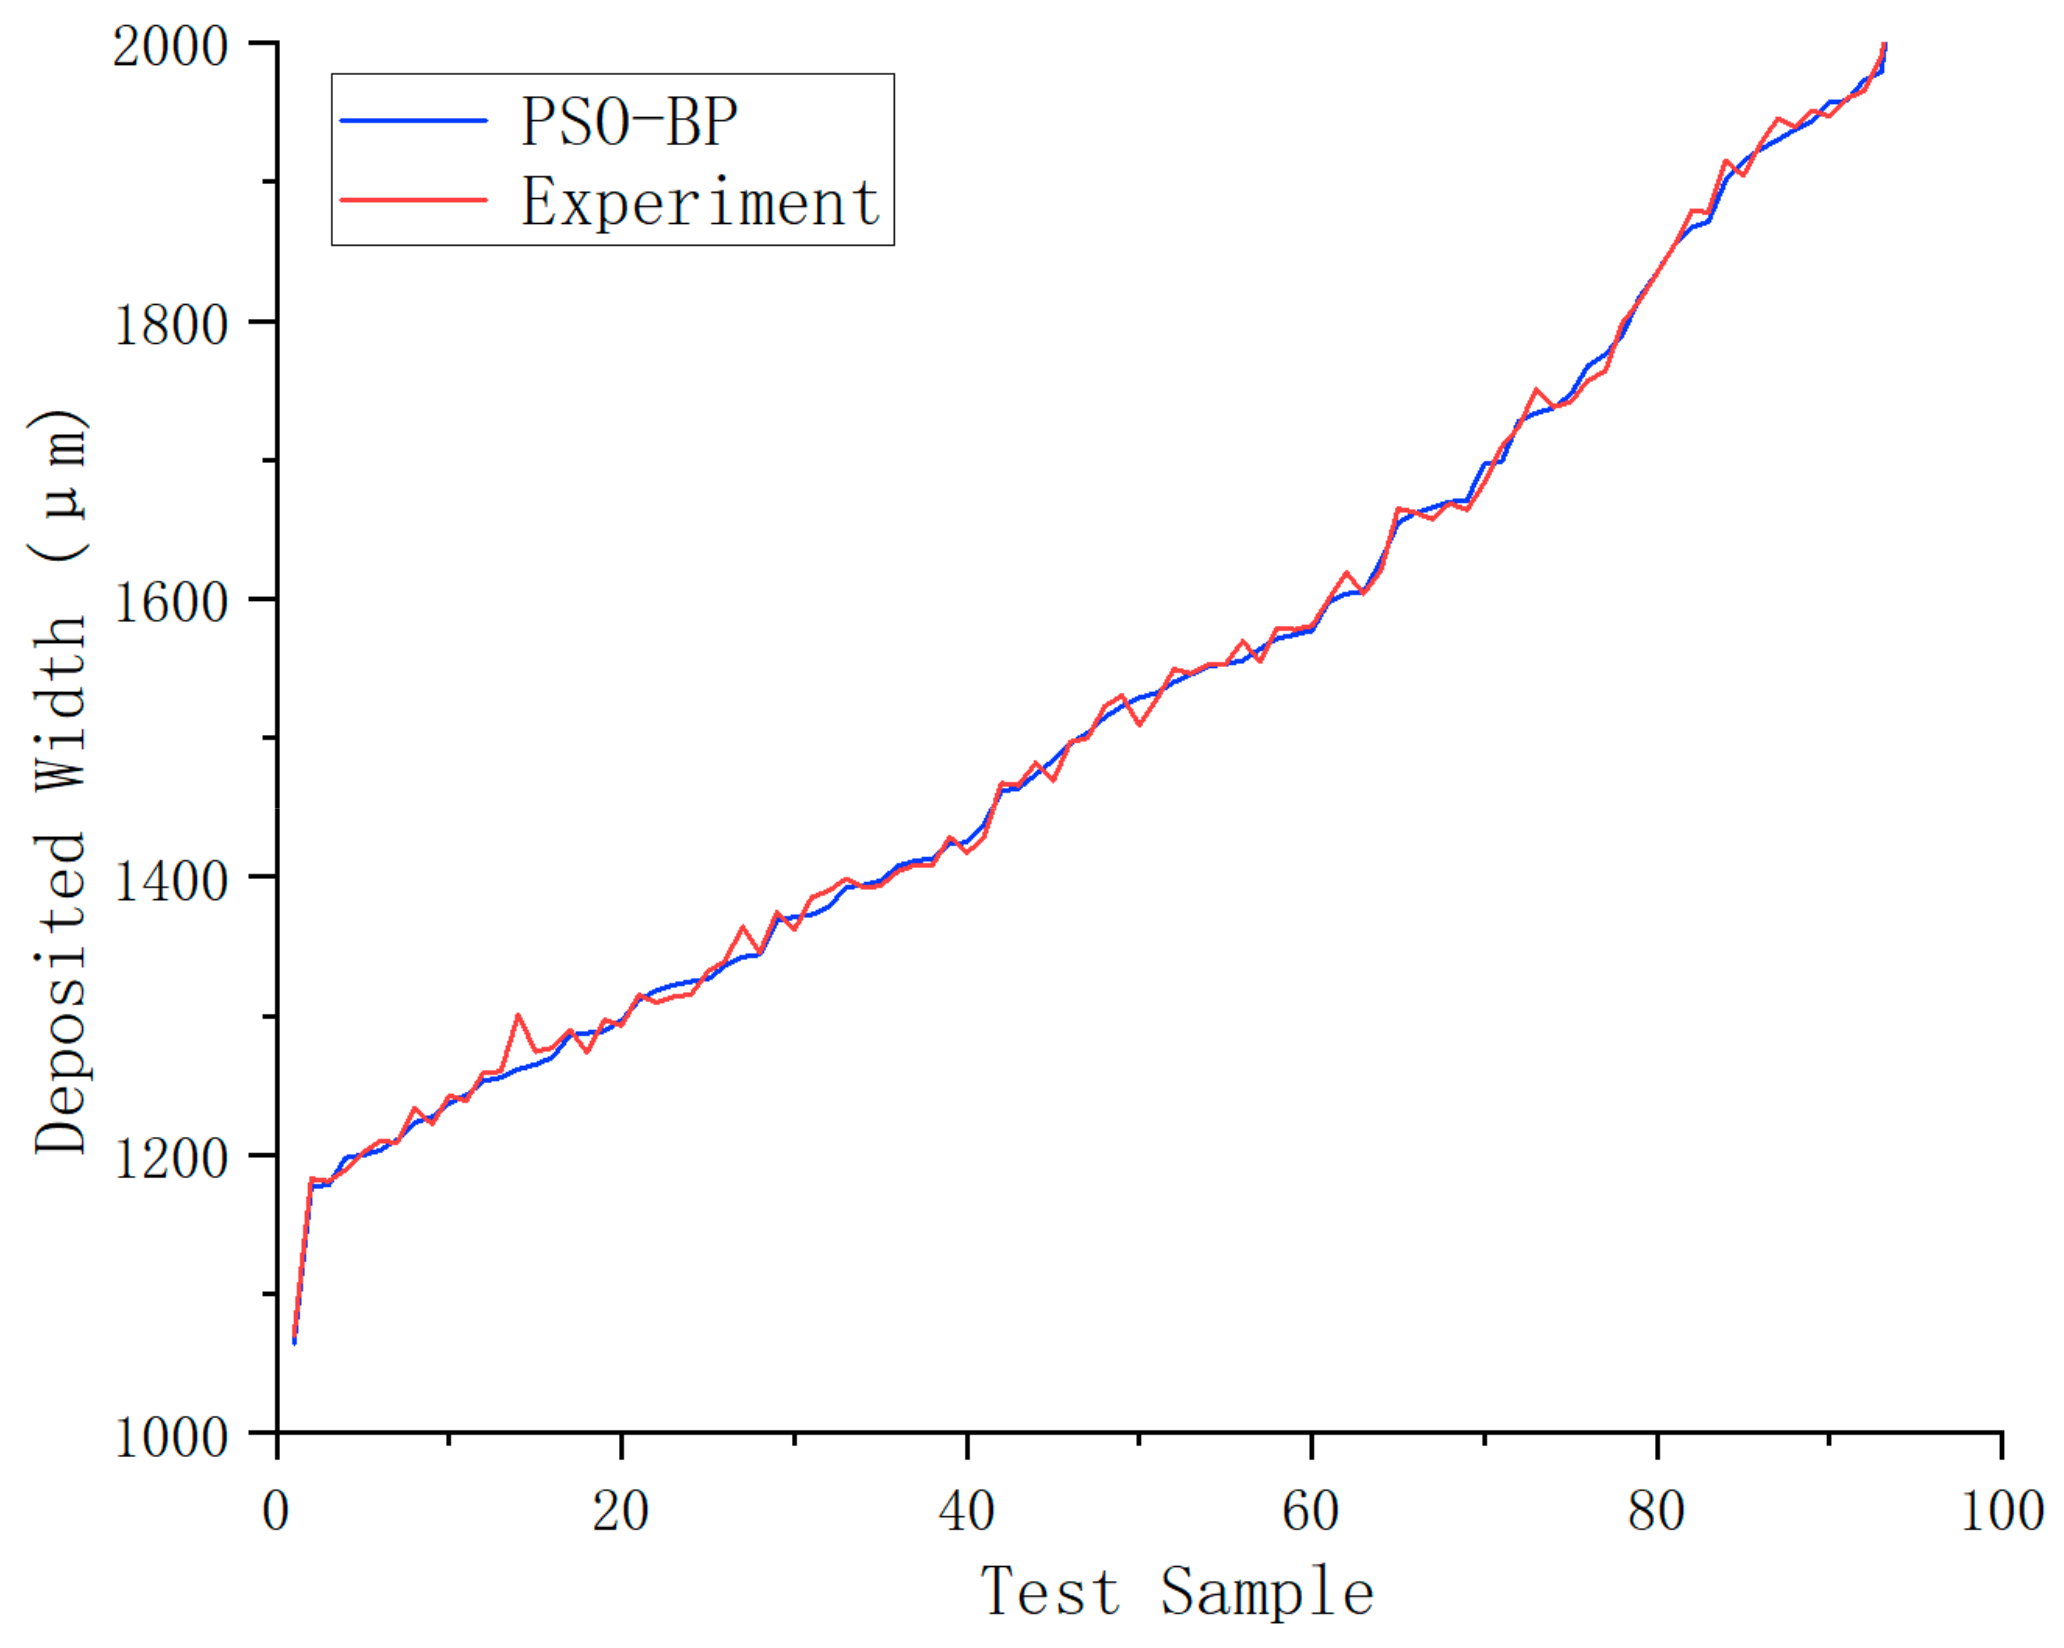
To verify the accuracy of the model’s predictions, the test samples were input, consisting of the remaining 20 sets of data. The predicted values for deposited layer height and width are presented in Figure 10 and Figure 11, respectively.
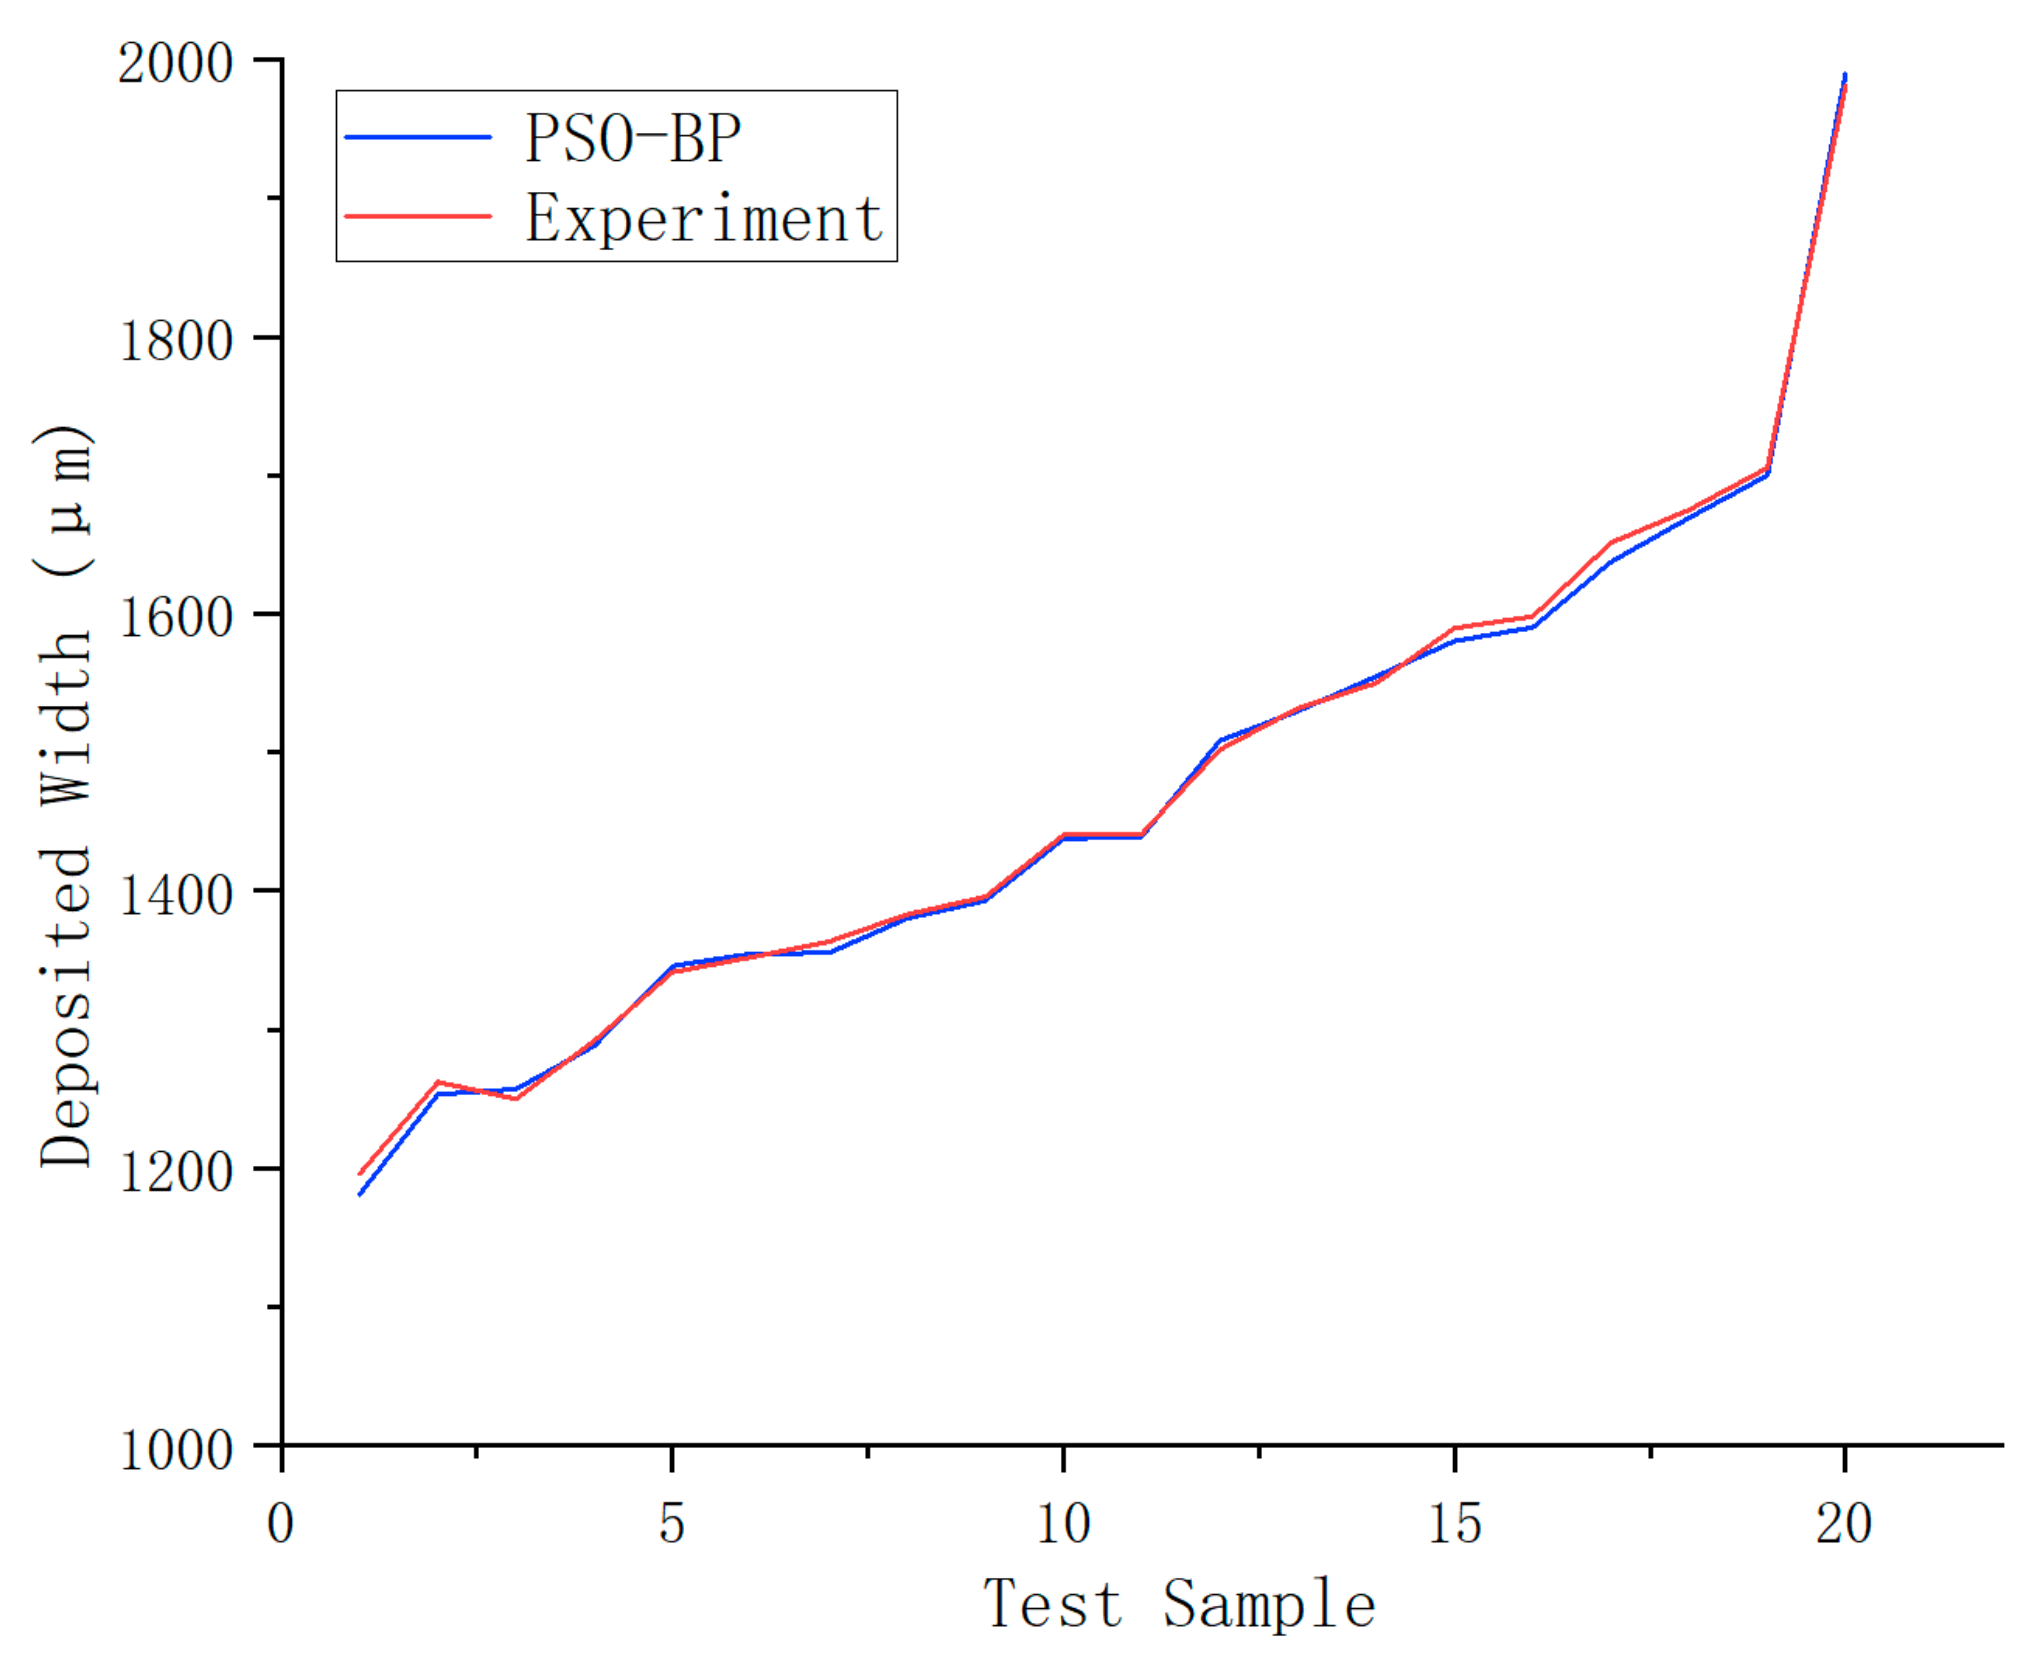
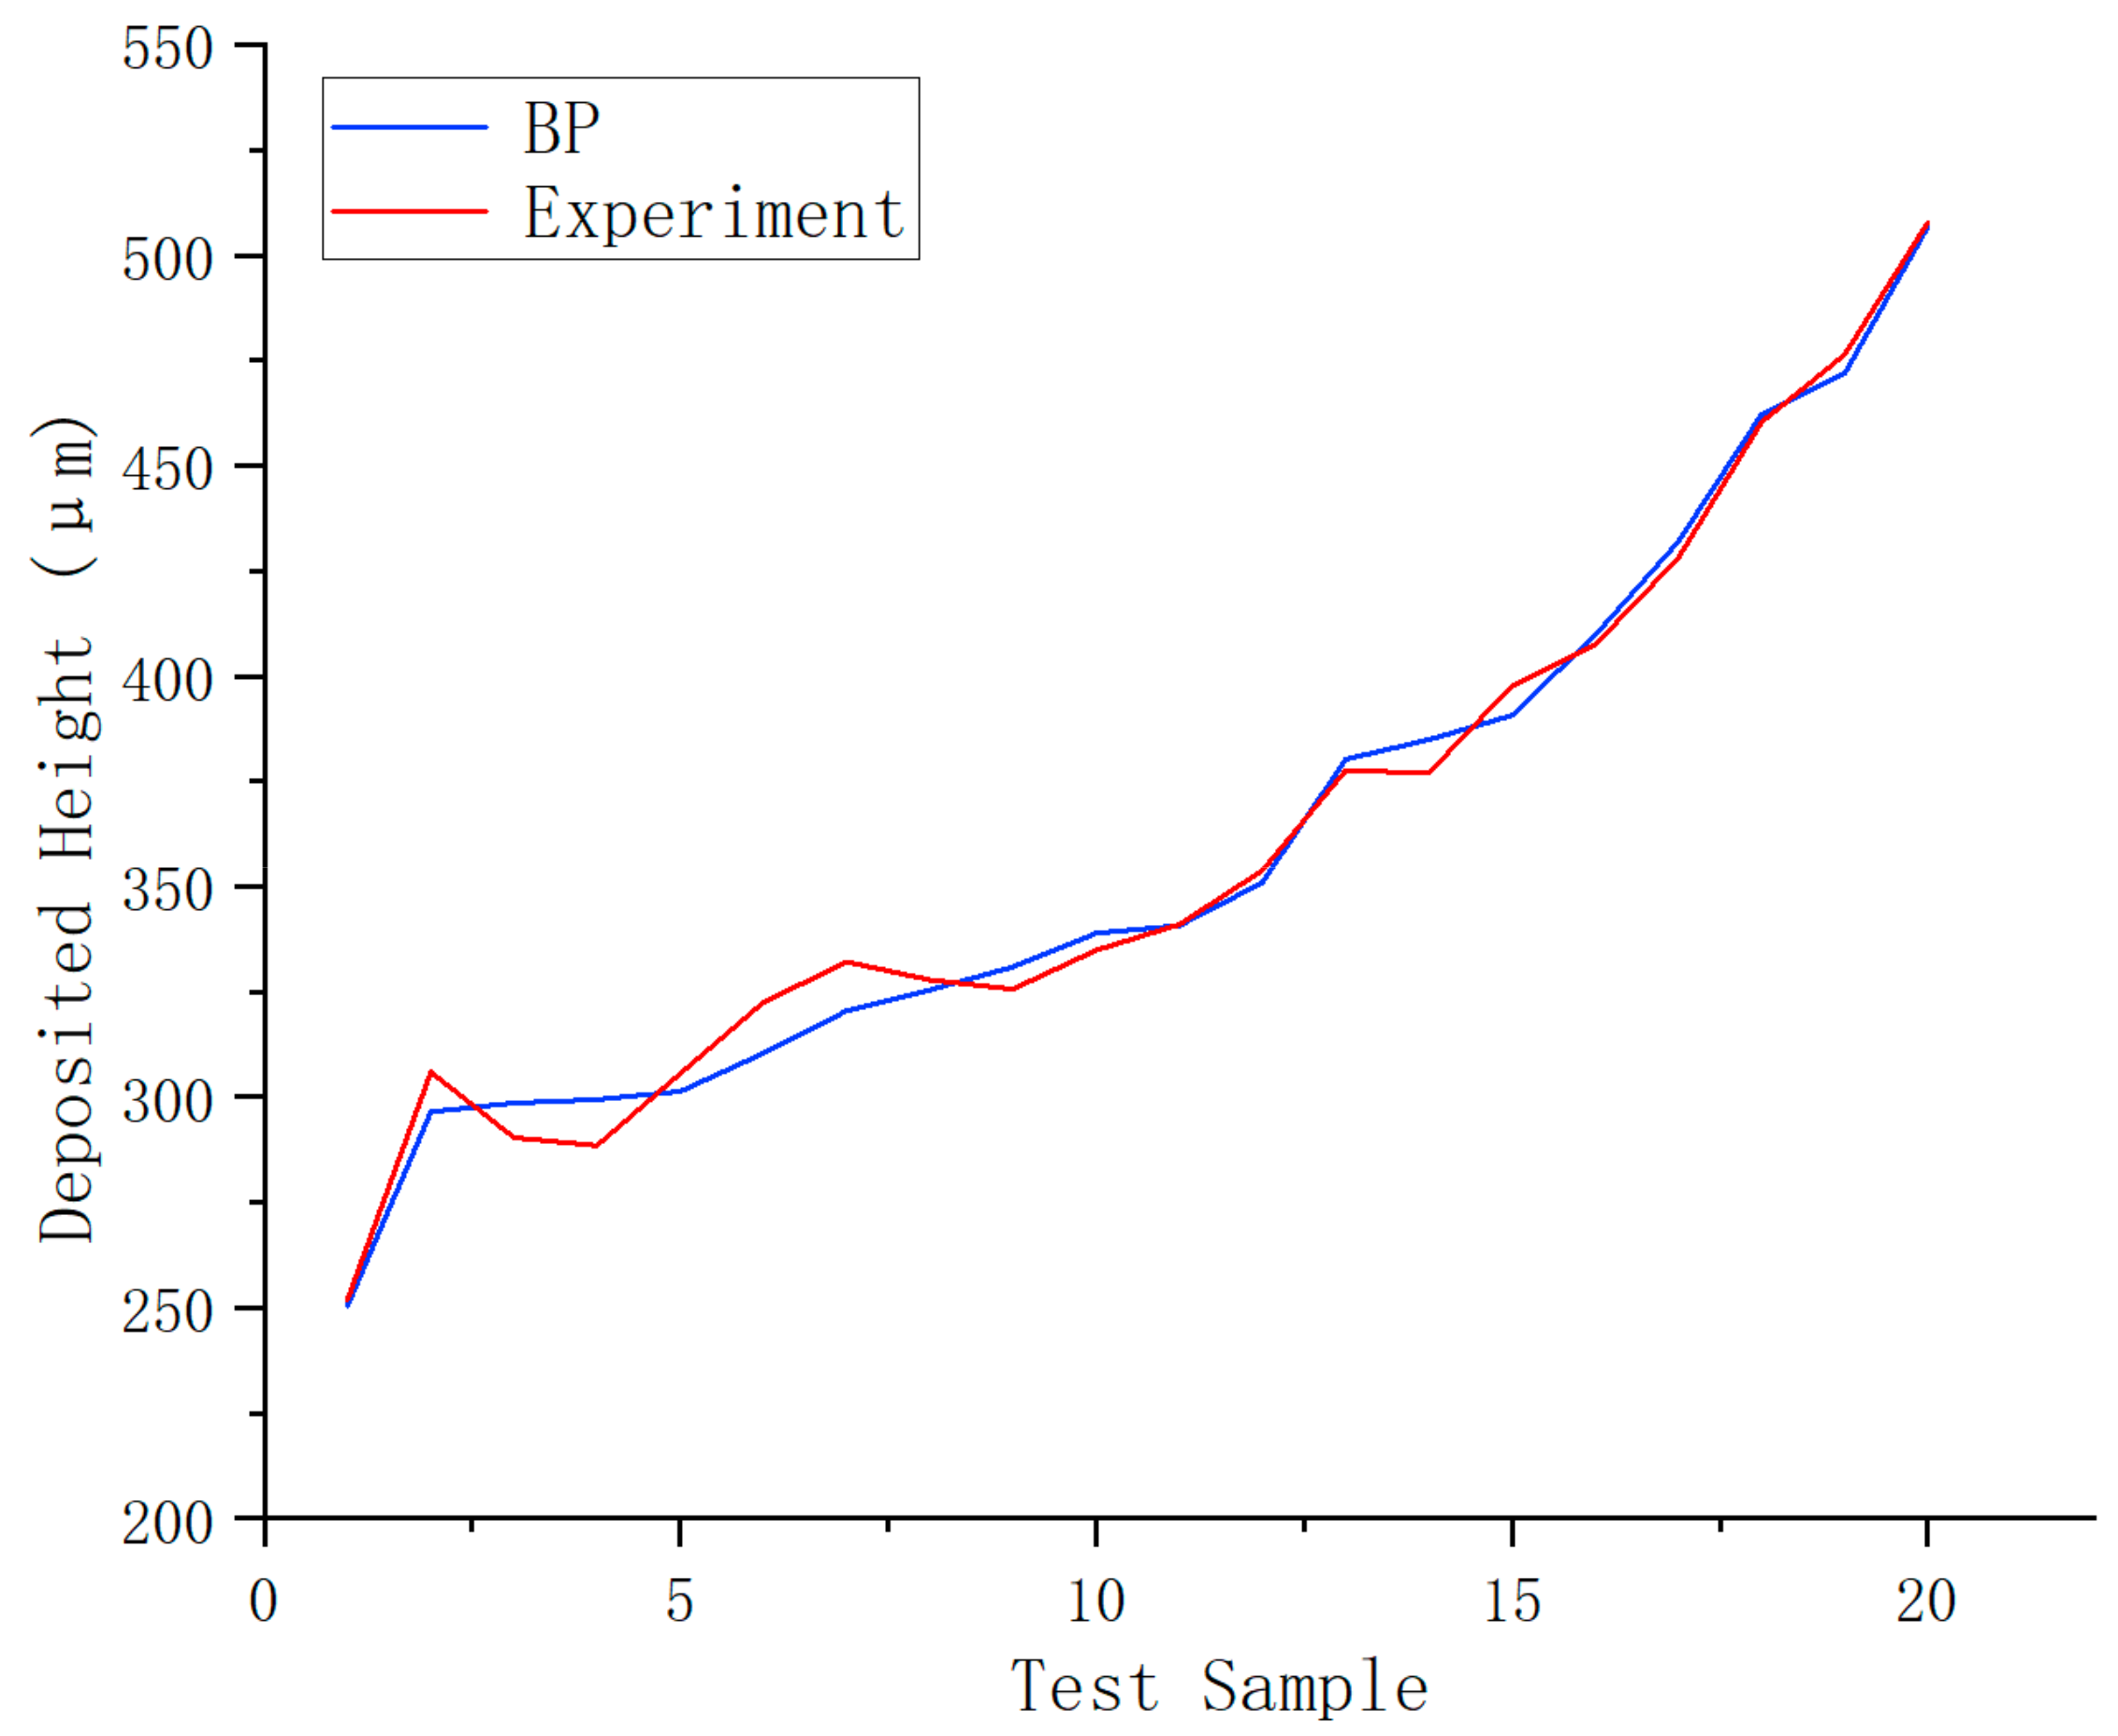
The PSO-BP neural network and BP neural network were both trained and tested using the same data samples. The mean values of multiple experiments were used to plot the prediction results for deposited layer height and width, shown in Figure 12 and Figure 13.
Comparing the predicted results with the actual values in the test samples, it can be concluded that the PSO-BP neural network model achieved a maximum relative error of 2.606% for the height of the deposited layer, a minimum relative error of 0.395%, and an average relative error of 1.329%. For the width of the deposited layer, the predicted maximum relative error was 0.831%, the minimum relative error was 0.107%, and the average relative error was 0.442%.
To verify the effectiveness of the proposed PSO-BP algorithm, we compared the prediction errors of sediment layer height and width by BP, GA-BP, GWO-BP, CNN, and RNN networks. Their statistical indexes, including AAE, MSE, and VAF, were calculated to evaluate the algorithms. The evaluation results are shown in Table 3 and Table 4.

5. Discussion

The study proposed a novel method for predicting the quality of deposited layers based on a particle swarm optimization-optimized BP neural network. A prediction model for deposited layer height and width was constructed using laser power, scanning speed, and powder feeding speed as inputs. The model was trained and tested using samples obtained from directed energy deposition experiments. The results showed that the average relative error of the predicted deposited layer height was 1.329%, and the average relative error of deposited layer width was 0.442%. In comparison, the unoptimized network had an average error of 4.314% for height and 2.052% for width.
Compared to the feed-forward back-propagation ANN proposed in reference [25] with a prediction error of 7.46%, and the back-propagation algorithm proposed in reference [27] with a prediction error of 10–20%, the particle swarm optimization-based BP neural network proposed in this paper can reduce the prediction errors of sediment layer height and width by 2.985% and 1.61%, respectively. Compared to other neural networks and optimization algorithms, the proposed PSO-BP model also exhibits higher accuracy. Overall, the proposed method proved to be effective in improving the accuracy of the prediction model and has significant potential in practical applications.

6. Conclusions

The paper presents a method for predicting the quality of deposited layers based on a combination of particle swarm optimization and BP neural network. This approach has been shown to be effective in addressing the issue of morphological and quality control problems in directed energy deposition. The research conducted in this paper makes a valuable contribution to the field of laser remanufacturing technology and has significant implications for various industries such as aerospace, metallurgy, and energy.
The primary challenge in directed energy deposition is the difficulty in accurately predicting the morphology and surface properties of the deposited layer due to the coupling of multiple process parameters. The proposed method provides an effective way to control the morphology and properties of the directed energy deposition process. The PSO-BP-based model for predicting the morphology of directed energy deposited layers has been shown to significantly improve the accuracy of the predictions. The results of the experiments conducted in this paper demonstrate that the particle swarm optimization method is more effective, reducing the height error of the deposited layer by 2.985% and the width error by 1.61%.
The effectiveness of the proposed method has important implications for closed-loop control of laser processing. The ability to accurately predict the morphology and surface properties of the deposited layer can improve the repair quality and performance of remanufactured parts. The high applicability of the method to deposited powder of other materials further enhances its potential impact in various industries.
In conclusion, the proposed method represents a significant advancement in the field of laser remanufacturing technology. The PSO-BP-based model for predicting the morphology of directed energy deposited layers has been shown to be highly accurate, and its effectiveness has important implications for closed-loop control of laser processing. The ability to accurately predict the morphology and surface properties of the deposited layer has significant implications for improving the repair quality and performance of remanufactured parts.
However, this study still has the following limitations: Neural network models generally require a minimum of 80 sets of data for training, but due to process limitations, it is difficult to obtain a large number of process-quality coupling data for DED through experiments. This paper benefited from the stability of the DED additive manufacturing equipment and achieved high accuracy in the neural network model training using only 20 sets of experimental data. If higher accuracy is required, a huge amount of experimental data is needed.
For future research, the following suggestions are recommended:
  • Selecting appropriate neural networks and optimization algorithms can help further improve the prediction accuracy of the model.
  • In addition to the morphology of the sediment layer, its mechanical properties, internal defects, and other quality indicators are also important. Neural networks can be further developed to conduct in-depth research in these areas.

Supplementary Materials

The following supporting information can be downloaded at: https://www.mdpi.com/article/10.3390/su15086437/s1, Table S1: The dataset of 120 groups of DED experiments.

Author Contributions

Z.W. and X.J. designed the PSO-BP neural network. B.S., G.Y. and W.L. collected the directed energy deposition data from the experiments. T.L., Z.N. and R.Z. performed the experiment. All authors have read and agreed to the published version of the manuscript.

Funding

This work was supported by [2016 Green Manufacturing System Integration Project of Ministry of Industry and Information Technology of China] under Grant [201675514], [Research on the Theory and Method of Quality Intelligent Control in the Remanufacturing Process of Waste Mechanical and Electrical Products] under Grant [51305279], [Program for the Top Young Innovative Talents of Liaoning Revitalization Talent Program] under Grant [XLYC1807211], [Liaoning Provincial Department of Education Project] under Grant [LJKQZ20222299], and [Program for the Top Young and Middle-aged Innovative Talents of Shenyang] under Grant [RC190148].

Institutional Review Board Statement

Not applicable.

Informed Consent Statement

Not applicable.

Data Availability Statement

The data presented in this study are available in Supplementary Materials.

Conflicts of Interest

The authors declare no conflict of interest.

References

  1. Jiang, X.Y.; Song, B.X.; Li, L.; Dai, M.; Zhang, H. The customer satisfaction-oriented planning method for redesign parameters of used machine tools. Int. J. Prod. Res. 2019, 57, 1146–1160. [Google Scholar] [CrossRef]
  2. Jiang, X.Y.; Li, J.Z.; Lu, Y.T.; Tian, G. Design of Reverse Logistics Network for Remanufacturing Waste Machine Tools Based on Multi-Objective Gray Wolf Optimization Algorithm. IEEE Access 2020, 8, 141046–141056. [Google Scholar] [CrossRef]
  3. Zhao, J.X.; Wang, G.; Wang, X.Y.; Luo, H.; Wang, L.; Rong, Y. Multicomponent multiphase modeling of dissimilar laser cladding process with high-speed steel on medium carbon steel. Int. J. Heat Mass Transf. 2020, 148, 118990. [Google Scholar] [CrossRef]
  4. Li, Z.N.; Chen, C.Z.; He, Q.S. Influence of Cu on microstructure and wear resistance of TiC/TiB/TiN reinforced composite coating fabricated by laser cladding. Mater. Chem. Phys. 2012, 133, 741–745. [Google Scholar] [CrossRef]
  5. Tanigawa, D.; Funada, Y.; Abe, N.; Tsukamoto, M.; Hayashi, Y.; Yamazaki, H.; Tatsumi, Y.; Yoneyama, M. Suppression of dilution in Ni-Cr-Si-B alloy cladding layer by controlling diode laser beam profile. Opt. Laser Technol. 2018, 99, 326–332. [Google Scholar] [CrossRef]
  6. Jelvani, S.; Razavi, R.S.; Barekat, M.; Dehnavi, M. Empirical-Statistical Modeling and Prediction of Geometric Characteristics for Laser-Aided Direct Metal Deposition of Inconel 718 Superalloy. Met. Mater. Int. 2020, 5, 668–681. [Google Scholar] [CrossRef]
  7. Erfanmanesh, M.; Abdollah-Pour, H.; Mohammadian-Semnani, H.; Shoja-Razavi, R. An empirical-statistical model for laser cladding of WC-12Co powder on AISI 321 stainless steel. Opt. Laser Technol. 2017, 97, 180–186. [Google Scholar] [CrossRef]
  8. Aghili, S.E.; Shamanian, M. Investigation of powder fed laser cladding of NiCr-chromium carbides single-tracks on titanium aluminide substrate. Opt. Laser Technol. 2019, 119, 105652. [Google Scholar] [CrossRef]
  9. Li, X.B.; Li, T.; Shi, B.W.; Wang, D.; Adnan, M.; Lu, H. The influence of substrate tilt angle on the morphology of laser cladding layer. Surf. Coat. Technol. 2020, 391, 125706. [Google Scholar] [CrossRef]
  10. Amine, T.; Newkirk, J.W.; Liou, F. Investigation of effect of process parameters on multilayer builds by direct metal deposition. Appl. Therm. Eng. 2014, 73, 500–511. [Google Scholar] [CrossRef]
  11. Amine, T.; Newkirk, J.W.; Liou, F. Methodology for Studying Effect of Cooling Rate During Laser Deposition on Microstructure. J. Mater. Eng. Perform. 2015, 24, 3129–3136. [Google Scholar] [CrossRef]
  12. Emamian, A.; Farshidianfar, M.H.; Khajepour, A. Thermal monitoring of microstructure and carbide morphology in direct metal deposition of Fe-Ti-C metal matrix composites. J. Alloy. Compd. 2017, 207, 20–28. [Google Scholar] [CrossRef]
  13. Palavra, A.; Coelho, B.N.; Hosson, J.T.M.; Lima, M.S.F.; Carvalho, S.M.; Costa, A.R. Laser surface treatment for enhanced titanium to carbon fiber-reinforced polymer adhesion. J. Braz. Soc. Mech. Sci. Eng. 2017, 39, 2917–2924. [Google Scholar] [CrossRef]
  14. Jaritngam, P.; Tangwarodomnukun, V.; Qi, H.; Dumkum, C. Surface and subsurface characteristics of laser polished Ti6Al4V titanium alloy. Opt. Laser Technol. 2020, 126, 106102. [Google Scholar] [CrossRef]
  15. Dumkum, C.; Jaritngam, P.; Tangwarodomukun, V. Surface characteristics and machining performance of TiAlN-, TiN- and AlCrN-coated tungsten carbide drills. Proc. Inst. Mech. Eng. Part B J. Eng. Manuf. 2019, 233, 1075–1086. [Google Scholar] [CrossRef]
  16. Tan, H.; Chen, J.; Zhang, F.Y.; Lin, X.; Huang, W. Process analysis for laser solid forming of thin-wall structure. Int. J. Mach. Tools Manuf. 2010, 39, 376–381. [Google Scholar] [CrossRef]
  17. Reddy, L.; Preston, S.P.; Shipway, P.H.; Davis, C.; Hussain, T. Process parameter optimisation of laser clad iron based alloy: Predictive models of deposition efficiency, porosity and dilution. Surf. Coat. Technol. 2018, 349, 198–207. [Google Scholar] [CrossRef]
  18. El Cheikh, H.; Courant, B.; Branchu, S.; Hascoët, J.-Y.; Guillén, R. Analysis and prediction of single laser tracks geometrical characteristics in coaxial laser cladding process. Opt. Laser Eng. 2012, 50, 413–422. [Google Scholar] [CrossRef] [Green Version]
  19. Wang, X.L.; Deng, D.W.; Hu, Y.B.; Liu, Z.-C. Analytical modeling and experimental investigation of laser clad geometry. Opt. Eng. 2017, 56, 1212–1220. [Google Scholar] [CrossRef]
  20. Onwubolu, G.C.; Davim, J.P.; Oliveira, C.; Cardoso, A. Prediction of clad angle in laser cladding by power using response surface methodology and scatter search. Opt. Laser Technol. 2011, 39, 1130–1134. [Google Scholar] [CrossRef]
  21. Marimuthu, S.; Triantaphyllou, A.; Antar, M.; Wimpenny, D.; Morton, H.; Beard, M. Laser polishing of selective laser melted components. Int. J. Mach. Tools Manuf. 2015, 95, 97–104. [Google Scholar] [CrossRef] [Green Version]
  22. Wang, J.H.; Han, F.Z.; Ying, W.S. Prediction and verification of the single cladding layer thickness for laser solid forming. In Proceedings of the International Conference on Advanced Functional Materials And Composites (Icafmc2018), Barcelona, Spain, 5–7 September 2018; p. 24. [Google Scholar]
  23. Wang, J.H.; Han, F.Z.; Chen, S.F.; Ying, W.-s. A novel model of laser energy attenuation by powder particles for laser solid forming. Int. J. Mach. Tools Manuf. 2019, 145, 103440. [Google Scholar] [CrossRef]
  24. Xu, Z.M.; Wu, H.B.; Hong, Z.H. Quality prediction of laser cladding based on evolutionary neural network. Appl. Mech. Mater. 2011, 44–47, 1012–1017. [Google Scholar] [CrossRef]
  25. Alimardani, M.; Toyserkani, E. Prediction of laser solid freeform fabrication using neuro-fuzzy method. Appl. Soft Comput. 2008, 8, 316–323. [Google Scholar] [CrossRef]
  26. Varol, T.; Canakci, A.; Ozsahin, S.; Erdemir, F.; Ozkaya, S. Artificial neural network-based prediction technique for coating thickness in Fe-Al coatings fabricated by mechanical milling. Part. Sci. Technol. 2018, 36, 742–750. [Google Scholar] [CrossRef]
  27. Gao, J.L.; Wang, C.; Hao, Y.B.; Wang, X.; Zhao, K.; Ding, X. Prediction of molten pool temperature and processing quality in laser metal deposition based on back propagation neural network algorithm. Opt. Laser Technol. 2022, 155, 108363. [Google Scholar] [CrossRef]
  28. Li, H.Y.; Chen, H.; Wu, Y.; Yong, C.; Wei, Y. Prediction of two-dimensional topography of laser cladding based on neural network. Int. J. Mod. Phys. B 2019, 33, 1940034. [Google Scholar]
  29. Weglowski, M.S.; Blacha, S.; Phillips, A. Electron beam welding—Techniques and trends—Review. Vacuum 2016, 130, 72–79. [Google Scholar] [CrossRef]
  30. Tian, Y.S.; Chen, C.Z.; Li, S.T.; Huo, Q.H. Research progress on laser surface modification of titanium alloys. Appl. Surf. Sci. 2005, 242, 177–184. [Google Scholar] [CrossRef]
  31. Liu, H.; Ge, C.; Zhou, W.; Zhou, W. Research progress on crack control of laser clad composite coating. Heat Treat. Met. 2018, 8, 228–232. [Google Scholar]
  32. Liu, J.L.; Yu, H.J.; Chen, C.Z.; Weng, F.; Dai, J. Research and development status of laser cladding on magnesium alloys: A review. Opt. Lasers Eng. 2017, 93, 195–210. [Google Scholar] [CrossRef]
  33. Gaumann, M.; Henry, S.; Cleton, F.; Wagnière, J.-D.; Kurz, W. Epitaxial laser metal forming: Analysis of microstructure formation. Mater. Sci. Eng. A-Struct. Mater. Prop. Microstruct. Process. 1999, 271, 232–241. [Google Scholar] [CrossRef]
  34. Wang, Z.Q.; Palmer, T.A.; Beese, A.M. Effect of processing parameters on microstructure and tensile properties of austenitic stainless steel 304L made by directed energy deposition additive manufacturing. Acta Mater. 2016, 110, 226–235. [Google Scholar] [CrossRef] [Green Version]
  35. Dai, D.H.; Gu, D.D. Influence of thermodynamics within molten pool on migration and distribution state of reinforcement during selective laser melting of AlN/AlSi 10Mg composites. Int. J. Mach. Tools Manuf. 2016, 100, 14–24. [Google Scholar] [CrossRef]
Figure 3. Directed energy deposition quality control system.
Sustainability 15 06437 g003
Figure 4. Remanufacturing equipment.
Sustainability 15 06437 g004
Figure 5. Orthogonal experimental deposited layers.
Sustainability 15 06437 g005
Figure 6. Morphology of deposited layer.
Sustainability 15 06437 g006
Figure 7. Mean square error curve.
Sustainability 15 06437 g007
Figure 8. Training effect of deposited height.
Sustainability 15 06437 g008
Figure 9. Training effect of deposited width.
Sustainability 15 06437 g009
Figure 10. Prediction effect of deposited height.
Sustainability 15 06437 g010
Figure 11. Prediction effect of deposited width.
Sustainability 15 06437 g011
Figure 12. BP neural network height prediction value.
Sustainability 15 06437 g012
Figure 13. BP neural network width prediction value.
Sustainability 15 06437 g013
Table 1. Composition of Fe304 alloy powder.
CCrSiNiMnFe
Fe3040.0318.00.1100.3
Table 2. Experimental factor level table.
Laser Power (W)Powder Flow Rate (mm/min)Scanning Speed (g/min)
6002406
7003608
80048010
90060012
100072014
Table 3. Comparison of deposited height prediction indicators for several neural networks and algorithms.
Prediction ErrorAAEMSEVAF
PSO-BP1.329%6.4867.6599.67%
BP4.314%21.121116.1592.88%
GA-BP2.692%13.81328.3198.81%
GWO-BP3.475%17.38617.2597.30%
CNN1.816%9.71145.5698.62%
RNN2.247%11.68277.1897.59%
Table 4. Comparison of deposited width prediction indicators for several neural networks and algorithms.
Prediction ErrorAAEMSEVAF
PSO-BP0.442%8.2799.5399.92%
BP2.052%34.041489.2197.94%
GA-BP1.348%25.85887.1998.01%
GWO-BP1.533%27.911098.1398.92%
CNN0.795%15.08350.0999.11%
RNN0.584%9.69263.6199.68%
Disclaimer/Publisher’s Note: The statements, opinions and data contained in all publications are solely those of the individual author(s) and contributor(s) and not of MDPI and/or the editor(s). MDPI and/or the editor(s) disclaim responsibility for any injury to people or property resulting from any ideas, methods, instructions or products referred to in the content.