Review

A Bibliometric Review of Household Carbon Footprint during 2000–2022

1
College of Geography and Remote Sensing Sciences, Xinjiang University, Urumqi 830046, China
2
Key Laboratory of Wisdom City and Environment Modeling of Higher Education Institute, Urumqi 830046, China
3
Institute of Water Science, Beijing Normal University, Beijing 100875, China
*
Author to whom correspondence should be addressed.
Sustainability 2023, 15(7), 6138; https://doi.org/10.3390/su15076138
Submission received: 25 February 2023 / Revised: 23 March 2023 / Accepted: 28 March 2023 / Published: 3 April 2023

Abstract

:
With the increasing contribution of household carbon footprint to the global carbon footprint, household carbon footprint as a critical component of future carbon reduction has become a research hotspot to mitigate global warming and maintain sustainable economic development. The Web of Science (WOS) database is the literature data source. The literature on household carbon footprint is analyzed with the help of the visualization software CiteSpace. The collected data are analyzed using bibliometric analysis tools for knowledge base analysis, cooperative network analysis, and knowledge evolution analysis to grasp the developmental pulse of household carbon footprint. The findings show that the co-citation analysis reveals that household carbon footprint research has a clear knowledge base and shows a clear trend over time. The classic literature lays the foundation for subsequent diversified and interdisciplinary articles. The subsequent research hotspots show apparent inheritance and development characteristics, with many diversified and interdisciplinary studies appearing after 2008. Based on the three-level cooperation network analysis, household carbon footprint research has a clear structure of research cooperation network. Cross-institution and cross-country articles collaborate frequently; most authors tend to co-author articles, and there are still a small number of authors who write independently, among which China, Chinese institutions, and Chinese authors make significant contributions. Developed countries represented by the U.S. have chosen cross-region cooperation at the macro level through multifaceted research. The co-word and journal overlay analyses reveal that household carbon footprint research encompasses various research topics. The apparent shift of keywords within each research phase directly proves that household carbon footprint research is gradually developing into an interdisciplinary and diversified homogeneous field. This paper analyzes the evolution of household carbon footprint in detail and composes the basic knowledge which can provide a reliable reference for subsequent scholars.

1. Introduction

According to the Assessment Reports issued by The Intergovernmental Panel on Climate Change (IPCC) since 1990, the gradual increase in global temperature over the past 100 years has been accompanied by sea level rise, polar ice melt, and abnormal and extreme weather and climate events, placing significant pressure on the environmental protection and economic development of countries around the world [1,2,3,4]. As the global temperature rises, experts and scholars from various countries are increasingly studying the causes of temperature rise [5,6]. Aleixandre-Tudó et al. [7] claim that anthropogenic driving factor is the leading cause of global temperature rise and climate change in most regions, with specific elements including the economic growth effect [8,9], energy intensity effect [10,11], urbanization rate [12,13], population factor [14,15], etc. In order to quantify the specific impact of carbon emissions or greenhouse gases on global warming, the concept of the carbon footprint was generated [16].
The carbon footprint measures carbon dioxide emissions or greenhouse gas emissions in terms of carbon dioxide equivalents [17]. The definition of carbon footprint has yet to be defined in a uniform concept internationally. For example, Edwards-Jones et al. [18] define carbon footprint as the total greenhouse gas emissions from the production and consumption of goods, and Barthelmie et al. [19] define carbon footprint as the direct and indirect CO2 emissions from energy consumption (including transport) within geographical boundaries. Hertwich and Peters [20] define carbon footprint as the greenhouse gas emissions from the production and consumption of goods and services, and IPCC [21] defines carbon footprint as an estimate of the emissions and absorption of CO2, N2O, CH4, HFCS, SF6 and PFCS from human activities in a country. The British Standards Institution [22] defines carbon footprint as a product or service’s total life-cycle greenhouse gas emissions. Scholars and organizations define the carbon footprint according to different types of greenhouse gases and different research subjects. Generally, they agree that the carbon footprint is the greenhouse gas emissions caused by human activities. This paper adopts the definition of Wiedmann and Minx [23] based on a review of national studies. On the one hand, the carbon footprint is the total amount of CO2 emitted by a product or service system throughout its life cycle. On the other hand, it is the total amount of CO2 emitted directly and indirectly during an activity, including individuals, organizations, governments, and industries. With the acceptance of the carbon footprint as a scientific measurement tool by governments, organizations, and institutions, it has gradually penetrated various research areas and enriched related research. Nation/region-level carbon footprints represent a macro perspective for different research scales. For example, Thapa et al. [24] studied the impact on the carbon footprint of the use of methods including composting and anaerobic digestion for food waste in Canada. Wolfson et al. [25] looked into the impact of the dietary patterns of adults in the United States on their carbon footprint. There are state/city-level carbon footprints representing a meso perspective. For example, Bian et al. [26] used Qingdao city as an example to study the impact of the municipal solid waste disposal process on carbon footprint under different disposal modes. Yang et al. [27] took the Guanzhong urban agglomeration as an example to explore the influencing factors of carbon footprint. There are organization/company-level carbon footprints representing a micro perspective. For example, Kiehle et al. [28] used a hybrid model to calculate the carbon footprint of the University of Oulu as an example, extending the database of carbon footprint calculation methods. Eslamidoost et al. [29] calculated carbon emissions from sources in one of the largest gas refineries in the Middle East. Patel et al. [30] analyzed the environmental impact of household resource consumption. In the face of the increasingly severe warming environment, experts and scholars have involved carbon footprints in their respective research fields to explore the carbon emissions in each field to develop tailored solutions to curb global warming.
As preferences for high-carbon-emitting goods and services increase in sectors such as household and residence, the demand regarding household consumption is overgrowing, with Weber and Matthews [31] indicating that over 80% of carbon emissions in the US are closely linked to household consumption, and this could exceed 120% if the implicit carbon emissions carried in imported products are taken into account. In China, energy consumption and consumption of goods and services by the household sector gradually account for 50% of domestic carbon emissions, and carbon reduction by the household sector will be the leading force in helping China achieve the goal of “carbon neutrality” and “carbon peak” [32]. In the world, around 72% of carbon emissions are generated by household consumption [33], and household carbon footprint represents a significant portion of the global carbon footprint. As a feasible direction to mitigate global warming and maintain sustainable economic development, household carbon footprint has become a research hotspot. Household carbon footprint studies are diverse, with Christis et al. [34] working on calculating household carbon footprints accurately, Pottier [35] and Chai et al. [36] working on decomposing the driving factors of household carbon emissions, Yao et al. [37] working to determine the household carbon footprint growth trends, and Shigetomi et al. [38] working on scenario projections of household carbon footprints. Despite its late start as a research hotspot, the household carbon footprint is overgrowing, with a wealth of research, diverse areas of interest, and a wide range of research methods. As a result, the rapidly evolving household carbon footprint has made it difficult for budding scholars to grasp its development, understand the research history, and capture the hot frontiers [39]. In this paper, to address the above issues, we use bibliometric analysis to analyze the development of household carbon footprint quantitatively, sort out the knowledge base of household carbon footprint, and collate the hot frontiers of household carbon footprint.
How reducing household carbon footprint as an essential part of future carbon reduction is bound to attract significant attention from the research community. As technology advances and living standards improve, the increasing preference of household consumers for high-carbon emitting goods and services is increasing the household carbon footprint, which makes the future of household carbon reduction alarming. Therefore, households’ high carbon footprint consumption preferences and the severe carbon emission reality will become a great challenge for household carbon footprint research. Finding a path to meet the household consumption demand without excessively increasing the household carbon footprint will become a long-term issue for researchers. Therefore, this paper analyses the literature in the field of household carbon footprint with the help of the visualization software CiteSpace. Using the Web of Science (WOS) database as the source of literature data, the bibliometric analysis tool is used to analyze the collected data for knowledge base analysis, cooperation network analysis, and knowledge evolution analysis to grasp the development of household carbon footprint and provide a reference for subsequent research. The second part of this paper focuses on the advantages of CiteSpace software for metrological analysis, detailing the process of collecting, filtering, and processing data. Section 3 focuses on the co-citation, cluster, and burst analysis of the household carbon footprint literature, with the help of CiteSpace software, to capture the knowledge base of household carbon footprint. Section 4 captures cooperation within the field at three levels by analyzing nation/region cooperation networks at the macro level, institution cooperation networks at the meso level, and author cooperation networks at the micro level. Section 5 further summarizes the evolution of research hotspots and predicts future research directions with the help of co-word analysis and journal overlay maps analysis. Finally, the deficiencies are pointed out based on the summary of the research content of this paper. This paper can help not only current researchers understand the evolution of household carbon footprint and sort out the essential knowledge but also guide new researchers to understand household carbon footprint quickly, capture the research frontiers and hot spots, and quickly join the field.

2. Methods and Materials

In collecting international literature related to household carbon footprint, publications included in the core collection of the WOS (Web of Science) database were selected to ensure scientific validity and authoritativeness. This paper uses the CiteSpace measurement tool to conduct a bibliometric analysis of the collected data, focusing on the study’s quantitative and qualitative aspects.

2.1. Methods

This study mainly uses a combination of bibliometric analysis and visual knowledge mapping methods to systematically and comprehensively review the development history of household carbon footprint and predict the frontier hotspots. Among them, bibliometric analysis was first proposed by Broadus in 1987 in a journal [40], and Ball [41] argues that bibliometrics is a result of the pressure to make arguments in scientific research and is a beneficial tool for quantifying academic results and evaluating academic performance, for which bibliometric analysis of the literature is necessary. After half a century of baptism, succession, and development by subsequent scholars, bibliometric analysis is now widely used in various fields [42], which enables people to segment the content of a specific field while indicating the development line of the field revealing emerging hotspots and future development directions [43]. Since the CiteSpace knowledge visualization software was developed by Dr. Chaomei Chen in 2004, it has emerged as a new force and has become one of the most popular tools for knowledge mapping [44]. The CiteSpace visualization software can analyze quantitatively by calculating the correlation, centrality, and burstiness among nodes and constructing cooperation network mapping [45], cluster analysis networks [46], and journal overlay maps to qualitatively grasp the development pulse and hotspots [47], and it is widely used in review articles [48]. This study imported raw literature data from the Web of Science (WOS) database into CiteSpace in plain text format (.txt) for collation and analysis. Given the various ways of CiteSpace mapping, this paper mainly uses seven methods, co-citation analysis, cluster analysis, timeline, and time zone analysis to grasp the knowledge base, co-author/institution/country/region cooperation network analysis, burstiness analysis, intermediary centrality analysis to construct cooperation network, co-word analysis, and journal overlay maps analysis to understand the knowledge evolution. The specific analysis process is shown in Figure 1.

2.2. Materials

The publication data collected in this paper were obtained from the Science Citation Index Expanded (SCI-EXPANDED) and Social Sciences Citation Index (SSCI) of the Web of Science Core Collection. WOS, the world’s leading citation database, contains records of papers from the world’s most influential journals (including open access journals) as well as conference proceedings literature and books, with titles of some publications dating back to 1900. Diaz et al. [49], Chen et al. [50], Sarkar et al. [51], and other scholars have chosen WOS as the database to conduct bibliometric studies on the relevant data they have obtained. In this paper, the advanced search function option of WOS was used to set the search formula TS = household* and (“carbon footprint*” or ((CO2 or carbon dioxide or GHG or “ greenhouse* gas*”) and (emit* or emission* or accounting*))) for precise search, and the data were searched from 1 January 2000 to 3 October 2022. The literature type was selected as thesis, review paper, and online publication, and 3042 items were initially obtained. This study mainly addresses the following questions. (1) What are household carbon footprint research subjects in different periods? (2) How are the cooperation characteristics between countries, regions, institutions, and authors in household carbon footprint? (3) How do discipline characteristics evolve in household carbon footprint? The detailed data collection setup is shown in Table 1.
In order to ensure the accuracy of the data, for the initial collection of 3042 data for manual screening, there are four main criteria for judging whether the main research object is the household carbon footprint, including the latter. Does it describe the effectiveness of a technique, method, policy, model, etc.? Is the household carbon footprint only used as a knowledge context? Is it focused on the relationship between households and their carbon footprint? The data judging criteria are shown in Table 2. According to the above four criteria, this study checked the title, abstract, keywords, and article content of 3042 articles. Firstly, this study checks whether the article title directly matches the household carbon footprint and makes a judgment on the article by quickly browsing its abstract and keywords for a perfect match. For articles whose titles are too complex to determine the content of their research, quickly browse their abstracts and keywords, and focus on whether the content of their articles is related to the household carbon footprint. For articles where the three significant pieces of information—title, abstract, and keywords—are difficult to judge, go through the research process, conclusions, and discussions of the article in detail and make a judgment. Criterion 1 is mainly used to examine the article title and research content; criterion 2 is mainly used to check the conclusion and discussion of the article; criterion 3 is mostly found in the abstract section or Section 1 as the research background information; and criterion 4 is mainly used to grasp the article as a whole. According to the above screening steps and 4 significant criteria, 754 articles meet the requirements of this paper, and 2288 articles do not meet the requirements of this paper. The screened qualified data are imported into CiteSpace in plain text form (.txt) for conducting analysis.
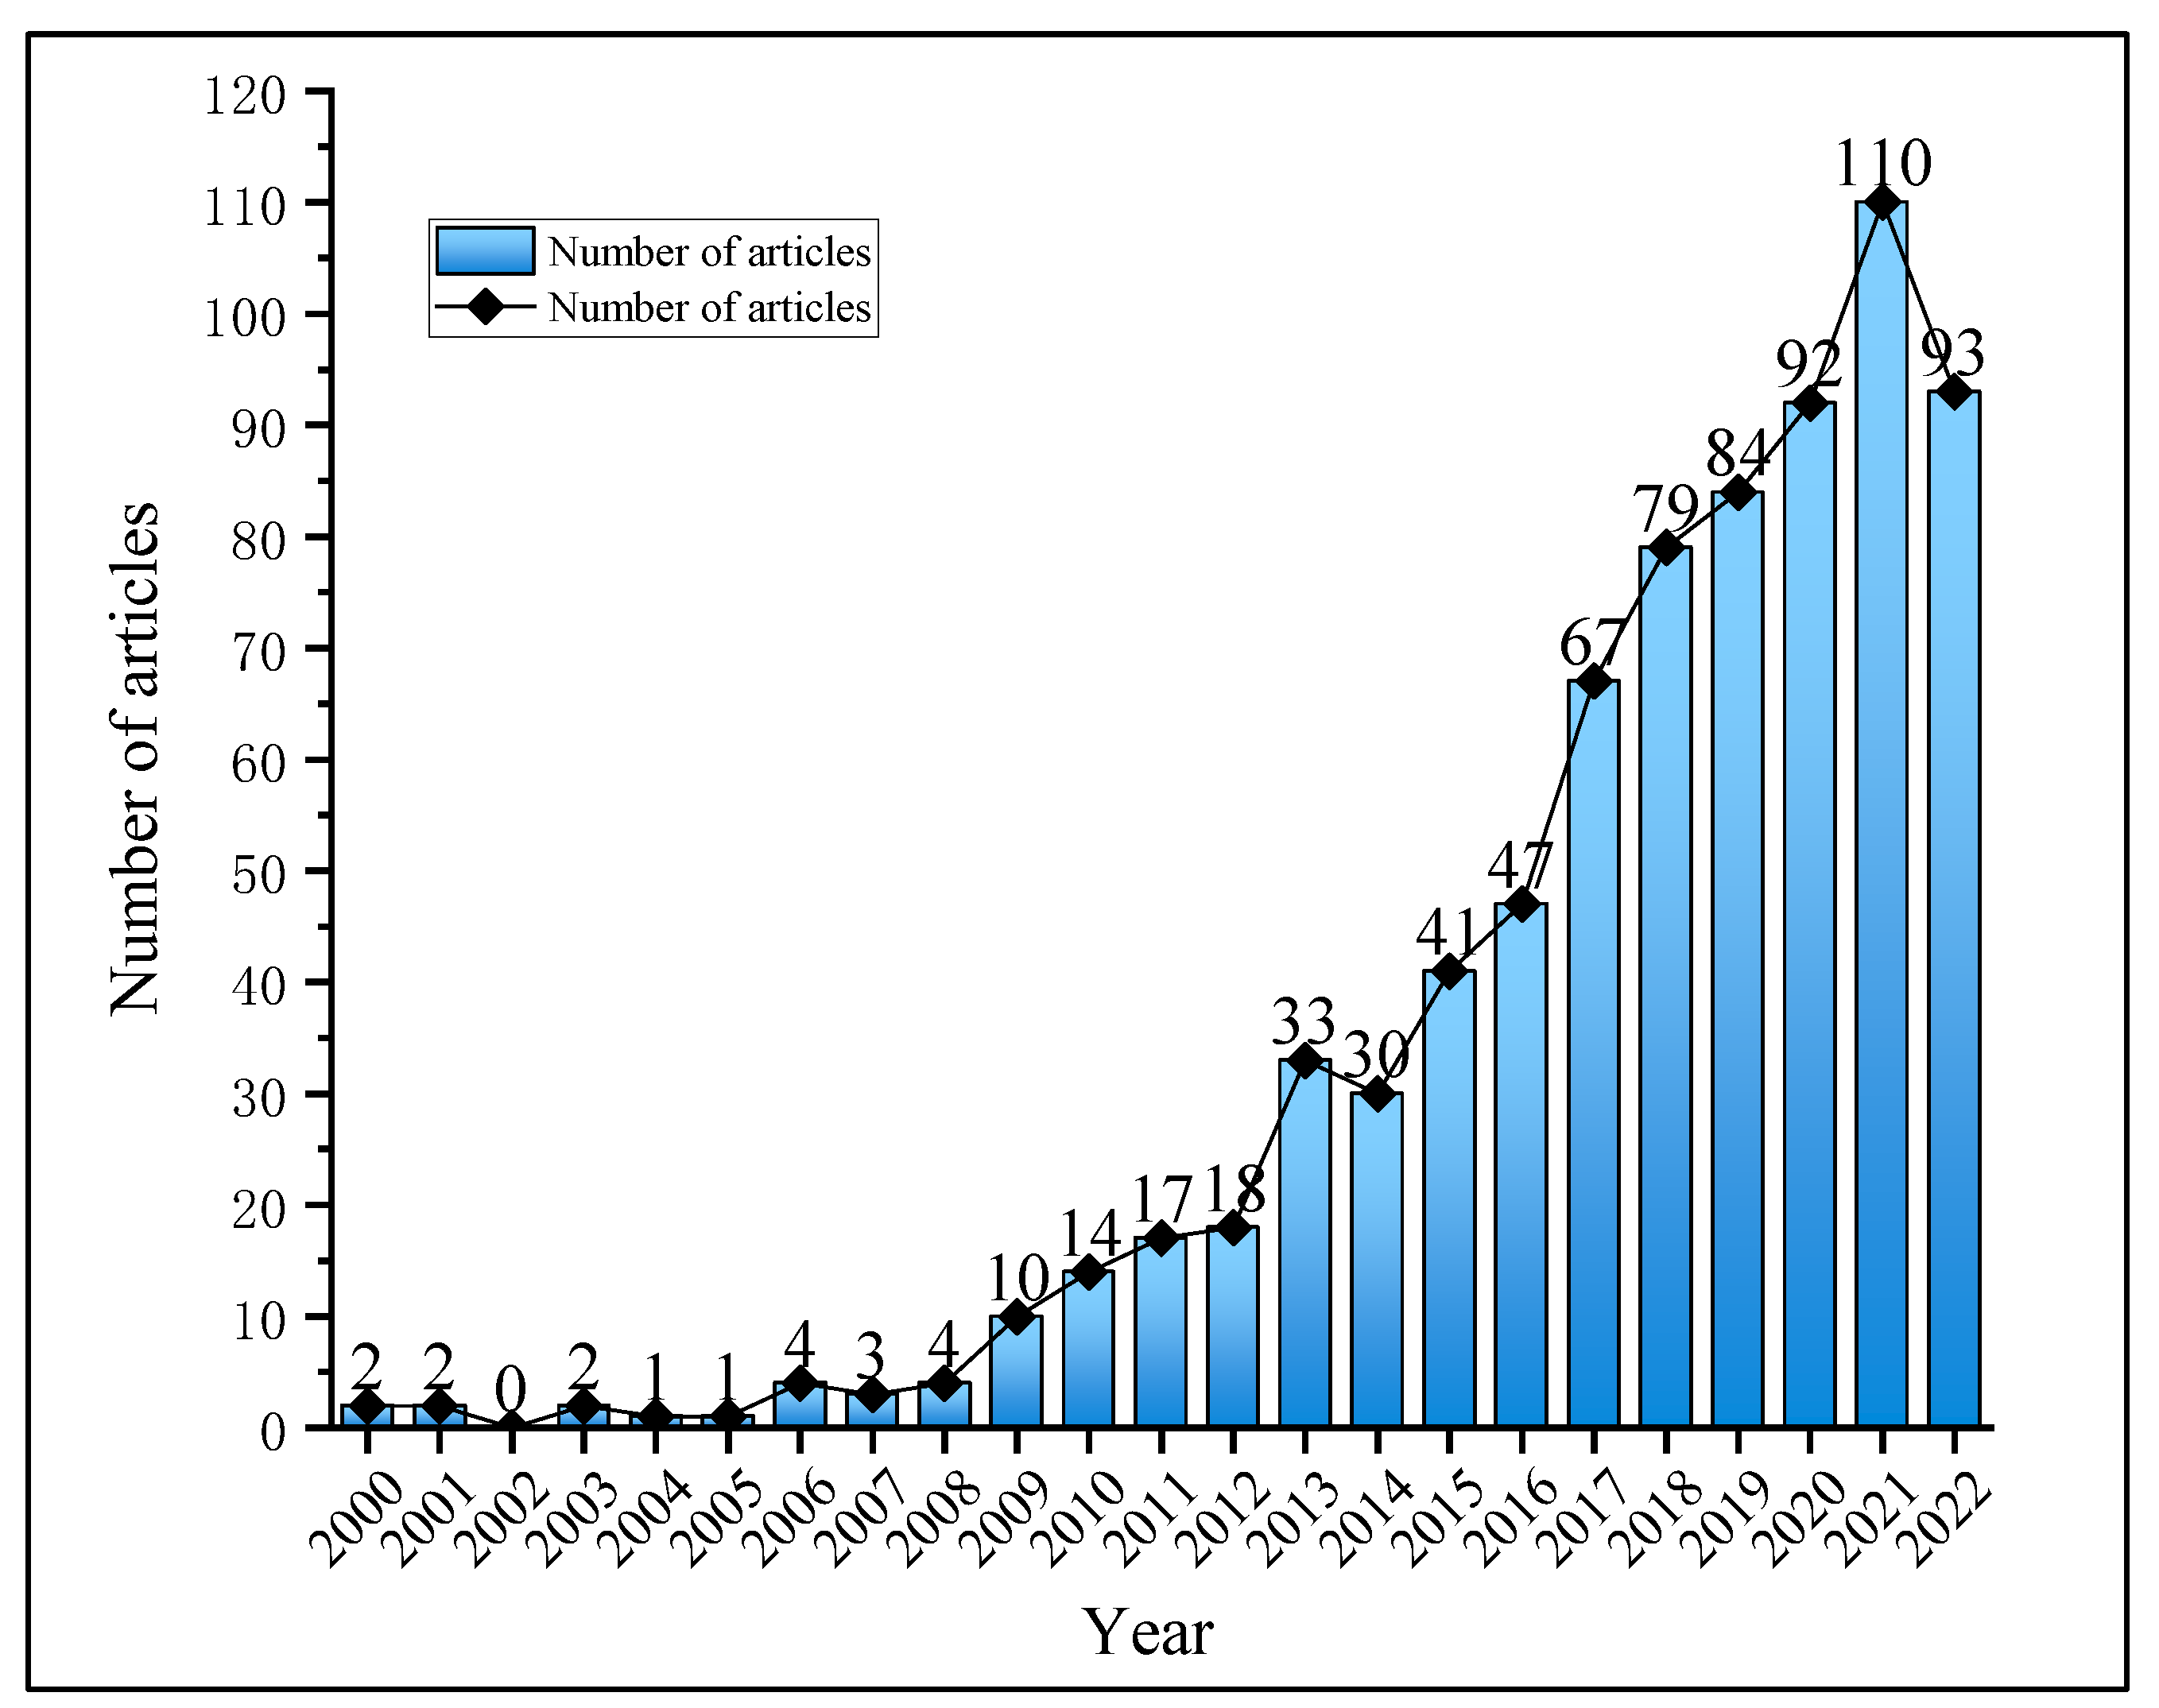
Figure 2 illustrates the growth trend of articles on household carbon footprint. Based on the number of articles published per year, this paper divides the development of household carbon footprint into three stages: initial stage, rapid development stage, and high development stage. In the initial stage (2000–2008), the number of articles published per year was less than five, indicating that household carbon footprint did not attract widespread attention in the scientific community at this time. In the rapid development stage (2009–2016), the number of articles published has increased several times compared with the previous stage. However, the number still does not exceed 50 per year, indicating that some perceptive researchers have captured the importance of household carbon footprint for global warming at this time. The number of articles in the high development stage (2017–2022) is on an apparent upward trend (it should be noted that the number of articles in 2022 is only 93 because the data search deadline of this paper is 3 October 2022, and the number of articles in 2022 will still continue to rise according to the trend of articles in previous years), which indicates that with the in-depth development of carbon footprint research, household carbon footprint, as an essential part of it, has received more and more attention. Experts and scholars in various fields have involved household carbon footprint in their research scope. One of the contributions of this study is to sort out the research trends of household carbon footprints in three stages and to show the research focus and cooperation lineage in each phase.

3. Analysis of the Knowledge Base of Household Carbon Footprint

3.1. Co-Citation Analysis

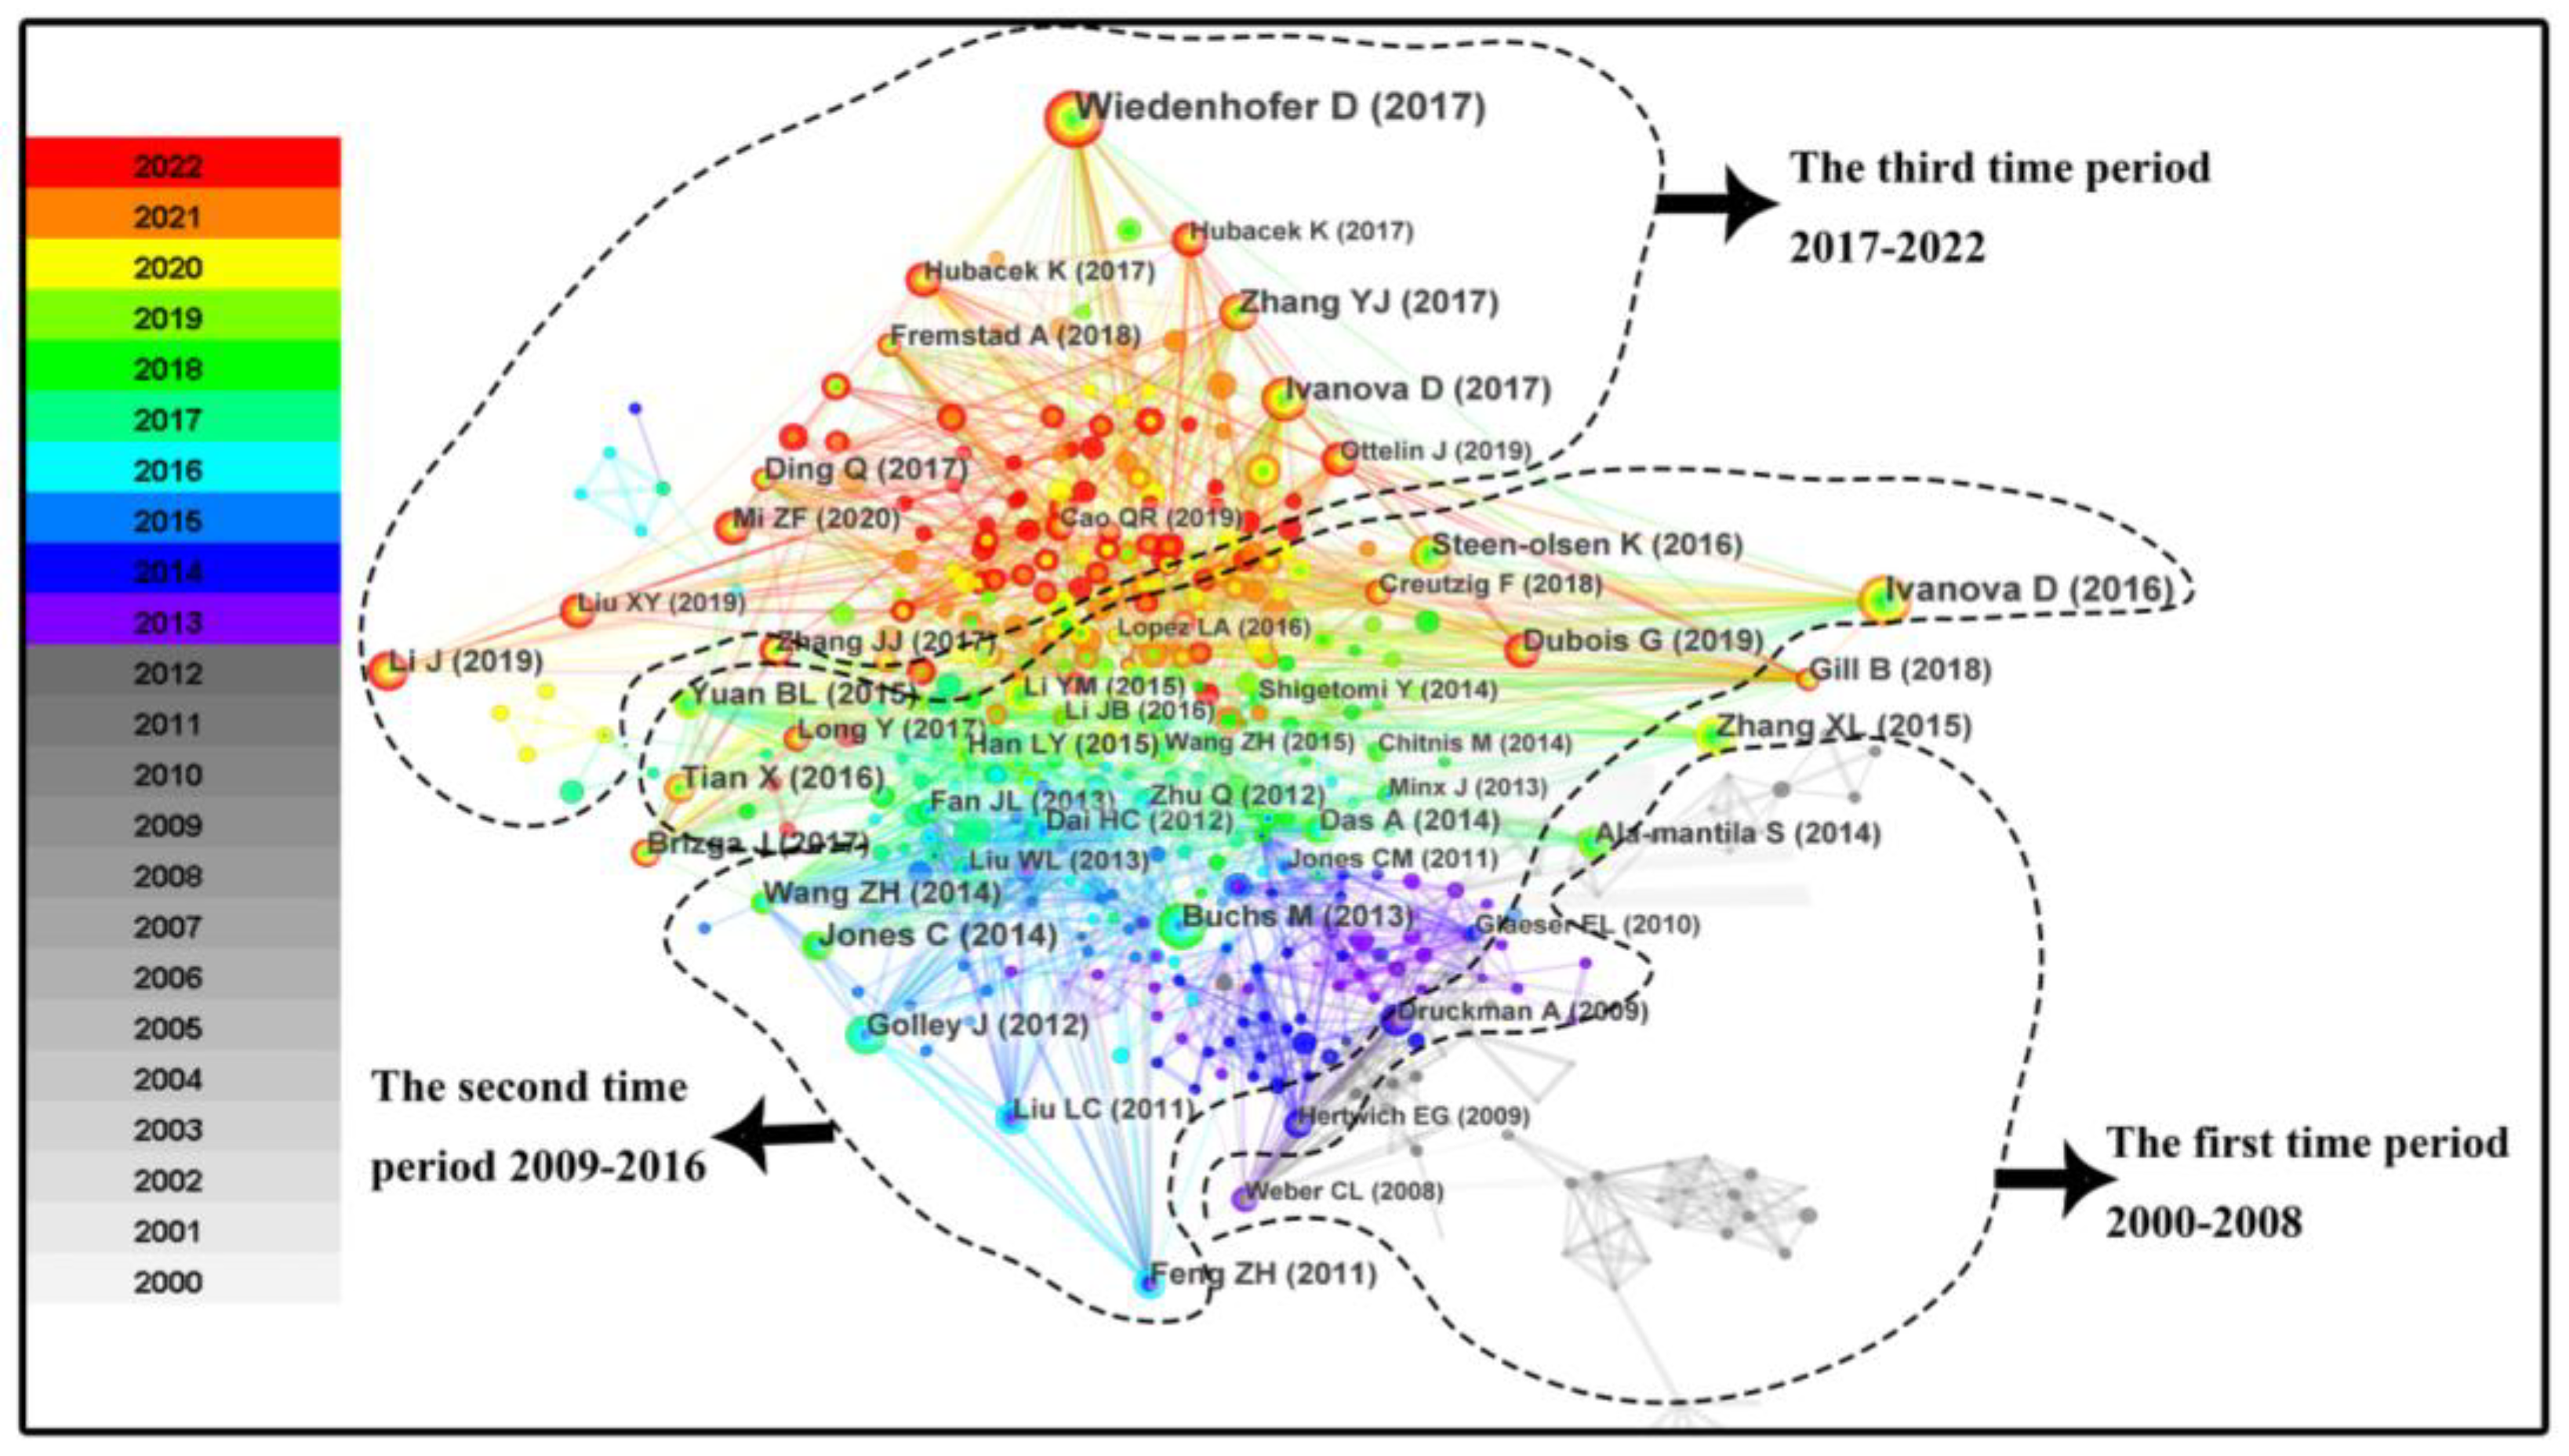
Co-citation analysis, as a significant feature of CiteSpace software, mainly refers to the co-citation relationship between articles A and B if they appear in the reference list of article C or multiple articles simultaneously [64]. CiteSpace allows co-citation analysis of all cited literature, which in turn explores the target topic’s knowledge base, topic distribution, and research frontiers [65]. In order to grasp the knowledge base of household carbon footprint, this paper adopts co-citation analysis to set up the obtained data, ensures the accuracy of data by manually screening literature information one by one, and ensures the rationality of co-citation network by setting up the function of CiteSpace software. The specific setting steps are as follows: Time Span = 2000.01–2022.10 (Years Per Slice = 1), Node Types = Reference, Links Strength = Cosine, Links Scope = Within Slices, Selection Criteria g-index(k = 20), Top N = 50, Top N% = 10%. No pruning was used for co-cited networks. The formed co-citation network is shown in Figure 3. In total, 26,862 valid documents were detected in the process, accounting for 100%, with Nodes = 715 and Links = 2911 in the cooperation network. The color of the nodes from gray to red indicates the period from 2000–2022; the redder the node color means the more recent the publication; the larger the diameter of the node means the more co-citations of the literature; and the denser the linkage around the node means that it is closely connected with the surrounding nodes, the more influential the node is.
As can be seen in Figure 3, the research on household carbon footprint is divided into three main periods from bottom to top, indicating that the research on household carbon footprint has a clear evolutionary lineage and relevant knowledge base. Since the primary nodes in the original picture are superimposed on each other, it is not easy to distinguish the node names. Figure 3 appropriately adjusts the node positions based on the original picture to better grasp the vein structure. The first period for household carbon footprint research is 2000–2008, and the literature within this period is shown in Figure 3 as a gray structure in the lower right corner, which can also represent the first part of the co-citation network. The first part of the structure does not have a prominent core article, and its research themes are each focused but overall interconnected, with the more critical nodes being Druckman & Jackson, Ramaswami, and Weber CL. Druckman and Jackson [66] focused on the consumption profile and carbon emissions of different household types in the United Kingdom to inform the development of rational low-carbon policies in the country. Ramaswami et al. [67] measured carbon emissions with the help of a hybrid life cycle approach. Weber et al. [68] assessed the impact of China on climate change by calculating its carbon emissions, and their research topics focused on household carbon footprint calculation, policy-making, and climate impact assessment. This is mainly because climate problems such as global temperature increase, frequent occurrence of extreme weather or climate phenomena, and sea level rise have gradually intensified. Climate problems have become the background reason for scholars to devote themselves to the field of household carbon footprint. Hence, the research topics during this period are mostly climate-related, and the research contents naturally include more macroscopic perspectives such as carbon footprint calculation and policy formulation. The second time period for household carbon footprint research is 2009–2016, and the literature within this time period is shown in Figure 3 as gray with blue and purple in the lower middle part, representing the second part of the co-citation network. The second part is based on Feng, Liu, and Druckman as important nodes. Using a consumption lifestyle approach, Feng et al. [69] argues for the role of income level on carbon emissions by comparing the energy demand and carbon emissions generated by consumption among urban and rural residents of different income levels in different regions. Liu et al. [70] used the input–output approach to calculate the carbon emissions resulting from the growth of direct and indirect consumption of urban and rural residents in China and encouraged residents to consume low carbon intensive products and thus reduce carbon emissions. Druckman and Jackson [71] construct a socio-economic classification framework based on a multi-regional input–output (MRIO) model applicable to the United Kingdom to calculate the carbon emissions generated by United Kingdom household consumption. The second part of the research topic focuses on various methods of calculating carbon emissions including life cycle approach, input–output approach, etc. to analyze the driving factors behind household carbon emissions. This is mainly because the research in the previous stage was mainly from a macro perspective, but with the development of time, the household carbon footprint was naturally subdivided with different research contents, research fields, and research directions, and the most prominent one is that the research contents are more detailed as the research area is narrowed. More representative of these are the emergence of scholars who focus on exploring the driving factors behind the carbon footprint of different types/regions of households [72,73,74], the analysis of the carbon footprint associated with housing [75,76,77], and the analysis of the carbon footprint of urban and rural households [70,78].
The third period for the household carbon footprint study is 2017–2022. The literature within this period is shown in Figure 3 as yellow, green, and red in the center upper section, representing the third part of the co-citation network. The nodes in Section 3 are denser and colored chiefly in red, indicating that such articles were published close to 2022, and that the articles in this section are more likely to contain research frontiers. This section features Wiedenhofer as the central node, and Wiedenhofer et al. [32] use the Gini coefficient to analyze the inequality of household carbon footprints within China. The third part of the study has no specific theme. The research in this stage inherits the content of the previous two stages, including both the macro perspective of climate and policy development and the development of new research directions: for example, sustainable development [79,80], aging impact [81,82], household carbon reduction potential [83,84], household food waste impact [85,86], household carbon footprint inequality [87,88], consumption-based perspective household carbon footprint [89,90], direct/indirect household carbon footprint [91,92], and other emerging research elements.
Table 3 shows the list of articles with a high number of citations in the field of household carbon footprint, among which only 1 article was cited more than 50 times. Wiedenhofer was cited 77 times, the most cited article within the field of household carbon footprint. Wiedenhofer et al. [32] analyzed explicitly in the article the imbalance of household carbon footprint within China. The second- and third-ranked articles are by the same author, Ivanova D, with 49 and 38 citations, respectively. Ivanova et al. [93] specifically analyzed the impact of household consumption on greenhouse gas emissions in their article, concluding that transportation, shelter, and food are the essential environmental consumption categories. Ivanova et al. [94], in their article, compiled an inventory of carbon footprints related to household consumption for 177 regions in 27 EU countries, contributing to the promotion of local decisions based on consumer behavior. In terms of the content of high-frequency cited articles, most of them are related to the factors influencing household carbon footprint [95], consumption perspective [96], and carbon footprint inequality [97], which correspond precisely to the rapid development stage and high development stage research directions. Regarding time distribution, most high-frequency cited articles were published in the second period (2009–2016). Six articles are distributed in the rapid development phase, indicating that the articles in the rapid development phase lay the knowledge foundation for subsequent studies. While the most cited articles were published in 2017, the third period indicates that the research frontier of household carbon footprint is included within this phase.

3.2. Clusters and Timeline Views

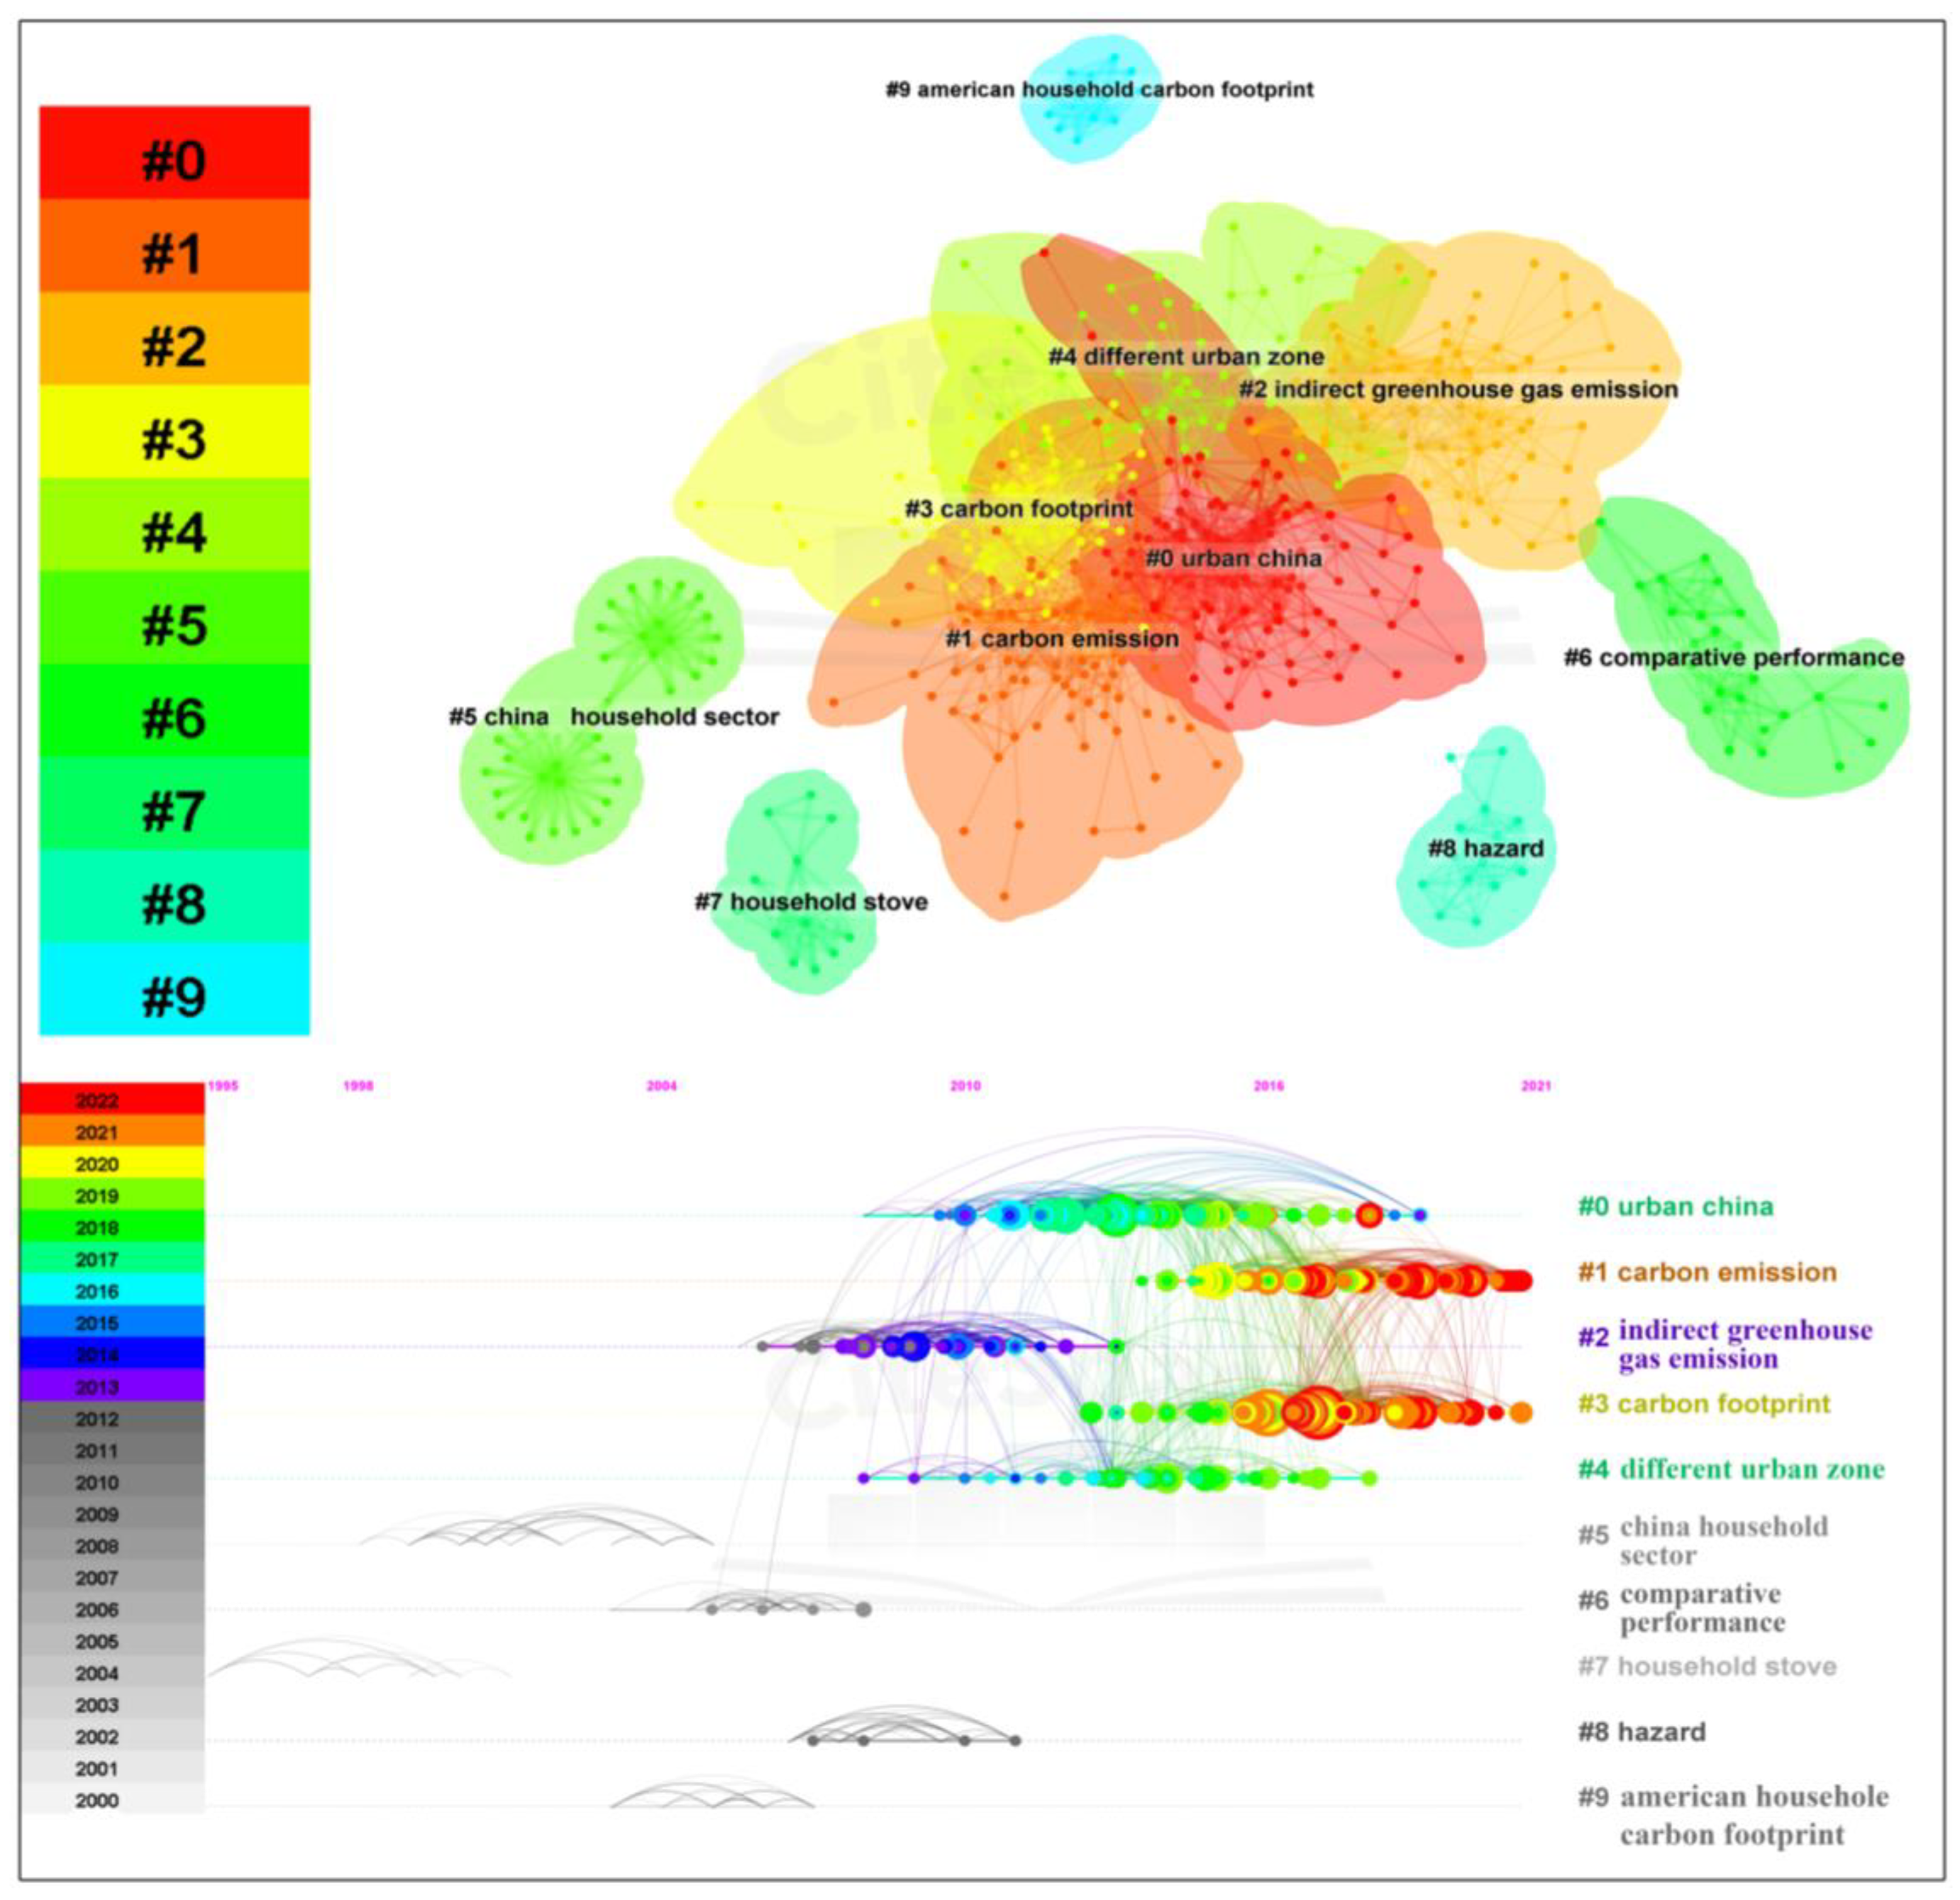
On the co-citation network analysis figure, this paper further takes advantage of the automatic cluster identification function of CiteSpace software, setting Extract Cluster Labels = Use Titles, showing cluster labels by log-likelihood ratio, and initially getting 87 clusters. In order to analyze the primary cluster distribution time and content, this paper sets to show the 10 clusters with the largest K value. The specific cluster distribution is shown in Figure 4, and the information is shown in Table 4. The Cluster ID in Table 4 represents the ranking of the clusters. The smaller the Cluster ID is, the larger its ranking contains the more content, and Size indicates the number of contents contained in the clusters [100]. The Silhouette contour coefficient is used to describe the similarity between a target for the cluster in which the target is located and other clusters. A larger value indicates a better match with the cluster and a better clustering effect and vice versa. Generally, the clustering is better when S > 0.7 [101]. As can be seen in Table 4, the S-values of the 10 clusters selected in this paper are > 0.8, indicating that the clustering effect is ideal. Mean (year) indicates the average time of occurrence of this cluster, and Top Terms (LLR) names the cluster labels using the Log-Likelihood Ratio (LLR) algorithm, which maximizes the cluster features in carbon footprint studies [51].
As can be seen in Table 4, cluster #0 (urban China) has an average publication year of 2013 and distributes in the rapid development stage of household carbon footprint. With more than 100 articles, cluster #2 is the carbon emission with 94 articles and an average publication year of 2018, and it distributes in the high development stage of household carbon footprint. The number of articles in the third, fourth, and fifth clusters is 80, 77, and 57, respectively. It can be seen that the top five clusters contain more articles than other clusters, and the articles are published in the rapid and high development stage. The number of articles they publish reflects the annual growth trend of household carbon footprint articles. The lowest ranking cluster is American household carbon footprint, which contains only 13 articles with an average publication year of 2005 and is distributed in the initial stage of household carbon footprint. Notably, cluster #5 (China household sector) and cluster #8 (household stove) were published in 2001 and 2000 on average, which is the beginning year of the development of household carbon footprint, suggesting that the earlier studies are related to household stoves, while the latest research frontier should be closely related to cluster #1 (carbon emission).
The upper part of Figure 4 shows the co-citation cluster analysis, and the lower part shows the time axis view. From the upper left corner of Figure 4, it can be seen that the clustering modularity (M) of this clustering profile is 0.7292, and the modularity is an essential index to measure the good or lousy clustering effect. Generally speaking, its value size positively correlates with the good or lousy clustering effect, and M > 0.3 means that the clustering effect is good [102]. Therefore, the clustering effect of Figure 4 is good and has a reference value. In Figure 4, clusters #0, #1, #2, #3, and #4 are closely linked together; cluster #6 and cluster #2 are separated by a small distance, and clusters #5, #7, #8, and #9 are not linked to each other and are far apart, which indicates that the clusters that far apart have their distinctive research areas, and the closely linked clusters have partial succession and development in their research contents.
According to the legend in the lower left corner of the timeline view, the color from gray to red indicates the time from 2000 to 2022. The presence of a high number of red circles on the timeline of clusters #1 and #3 indicates that the carbon emission and carbon footprint represent the research frontier of household carbon footprint, which is consistent with the average year of publication in Table 4 and with the content of the critical nodes of literature in the third phase of the household carbon footprint co-citation network.

3.3. Burst Analysis

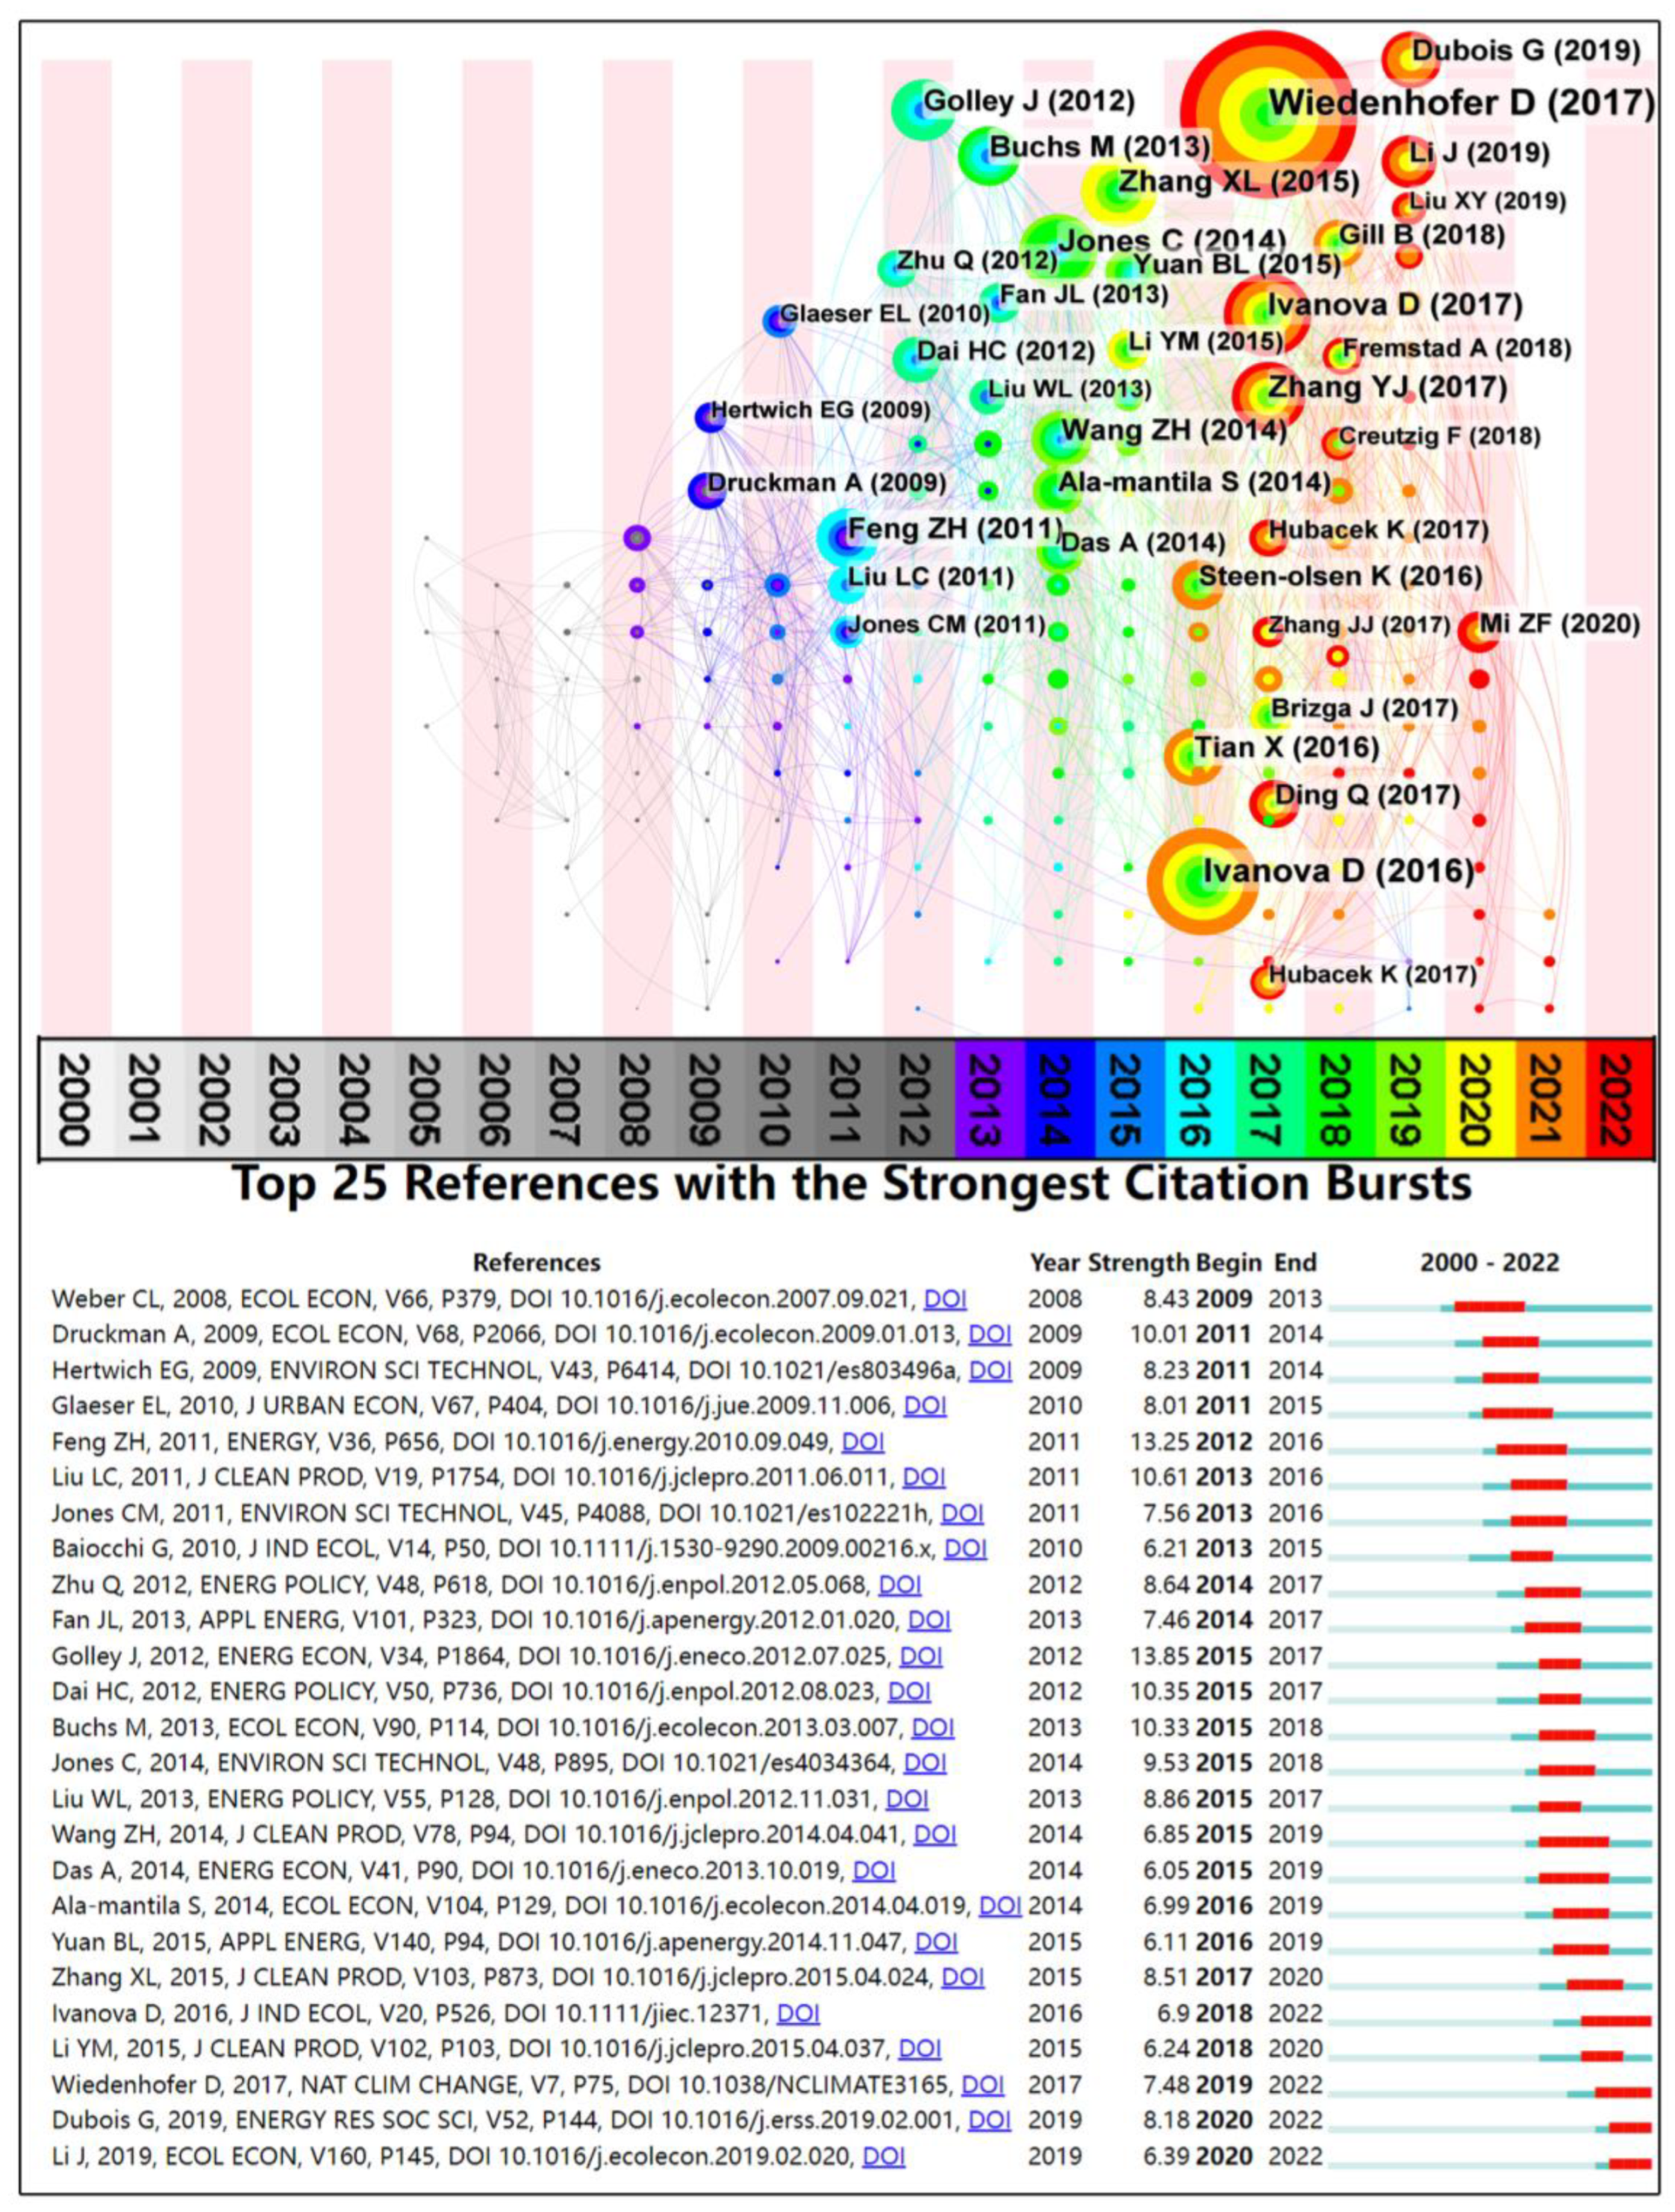
Based on the analysis of the timeline view, this paper further uses the time zone view to show the specific distribution of the household carbon footprint co-citation structure, as shown in Figure 5 (upper). The display of the time zone view is mainly based on the time (year). The time zone view can show both the co-citation structure and the different clusters in a single distribution map, facilitating a new perspective on the household carbon footprint research context. As seen in Figure 5 (upper), the co-citation structure of the household carbon footprint is presented from left to right, from gray to red, with articles published closer to 2022. Based on the default node labels displayed as a time zone view, the household carbon footprint co-citation structure is divided into two main parts: the first half and the second half. The starting node label in the second half shows that 2008 was a significant turning point in carbon footprint research, which is consistent with the previous analysis.
To explore the role of each significant node in the development of household carbon footprint research, this study obtained the 25 articles with the highest burst values through Burst Detection. They are arranged from top to bottom according to burst time (lower part of Figure 5), and the article with the highest burst value is Golley [97] (burst = 13.85), followed by Feng [69] (Strength = 13.25). By analyzing the burstiness and time zone views, six high-frequency burst articles appeared in the time zone diagram, all appearing in the rapid development phase. This indicates that the most frequently cited important articles in household carbon footprint research were published between 2009 and 2012. The results of such articles were repeatedly cited as the knowledge base for subsequent research in the field. From this, two possible inferences can be drawn: the articles written during the rapid development stage of household carbon footprint were full of content and solid results, recognized by most scholars, and could be used as the basis for subsequent studies, leading to the phenomenon of repeated citations. Since 2009, there have been significant research breakthroughs in carbon footprint studies, which may be related to cross-field integration and diversification of research fields.

4. Cooperation Network Analysis

The cooperation network analysis function of CiteSpace software allows for three levels of analysis of the literature on household carbon footprint: micro-level co-author network analysis, meso-level cooperation network analysis, and macro-level nation/region cooperation network analysis. From these three perspectives, we can capture the high-frequency cooperation authors, high-frequency cooperation institutions, and high-frequency cooperation regions/countries and clarify the cooperation relationship of authors, institutions, and countries/regions in household carbon footprint.

4.1. Co-Author Network Analysis

The content of the original software base setup is followed, where Node Types = Author, to generate a cooperation network of authors in the field of household carbon footprint. A list of the top four scholars with the strongest burst values was generated based on the co-author network and the co-author network graph (middle). The list of the top four scholars with the strongest outbreak values (upper right) and the co-author information list (lower right) were integrated into Figure 6.
According to the co-author network mapping, some authors in household carbon footprint collaborate more frequently. However, most authors in this field tend to write independently and collaborate less with others. Combined with the list of co-author information, it is initially known that authors in the rapid and high development stages are more inclined to co-author articles, among which Zhang L is the top-ranked prolific author in household carbon footprint, with a total of 17 co-authored articles. The first article was published in 2017, and this author’s content primarily relates to the comparative analysis of urban and rural household carbon footprint and factors influencing household carbon footprint. A total of 10 authors with more than 10 collaborations can be described as prolific authors, with the most prolific authors’ first articles published in 2015 and later and only Zhang J’s first co-authored article published in 2000. This is consistent with the trend of postings in Figure 2 and the analysis of high-frequency citations in Table 3. Burstiness is used to detect the change in citations of a topic over a specific period, the decline and rise of the topic [100]. The list of the top four scholars with the strongest burst values is the most prolific authors in this field; all four of them are at the stage of high household carbon footprint development, and their bursts are of short duration. Zhang H has burst = 4.0376, the highest, but the number of cooperation is relatively low with Count = 33. It is in the center of the cooperation network and is one of the critical nodes. Wang Y has the earliest burst and the most extended duration of 2017–2020; Zhang L has the latest burst in 2020, and Wang X has the shortest duration of 2019–2020. The co-author network mapping shows that most authors with high publication volume are Chinese scholars, indicating that Chinese researchers contribute more to developing household carbon footprint. Based on the list of co-author information, most Chinese scholars have devoted themselves to the field of household carbon footprint late and have a shorter overall research time. They have worked more closely with domestic scholars and have yet to be closely involved in international cooperation networks. Yue et al. [39] and Zhao et al. [101] also found this cooperation characteristic of Chinese scholars in their articles, which may be related to language, cultural practices, geopolitics, and economic base.

4.2. Analysis of Institution Cooperation Network

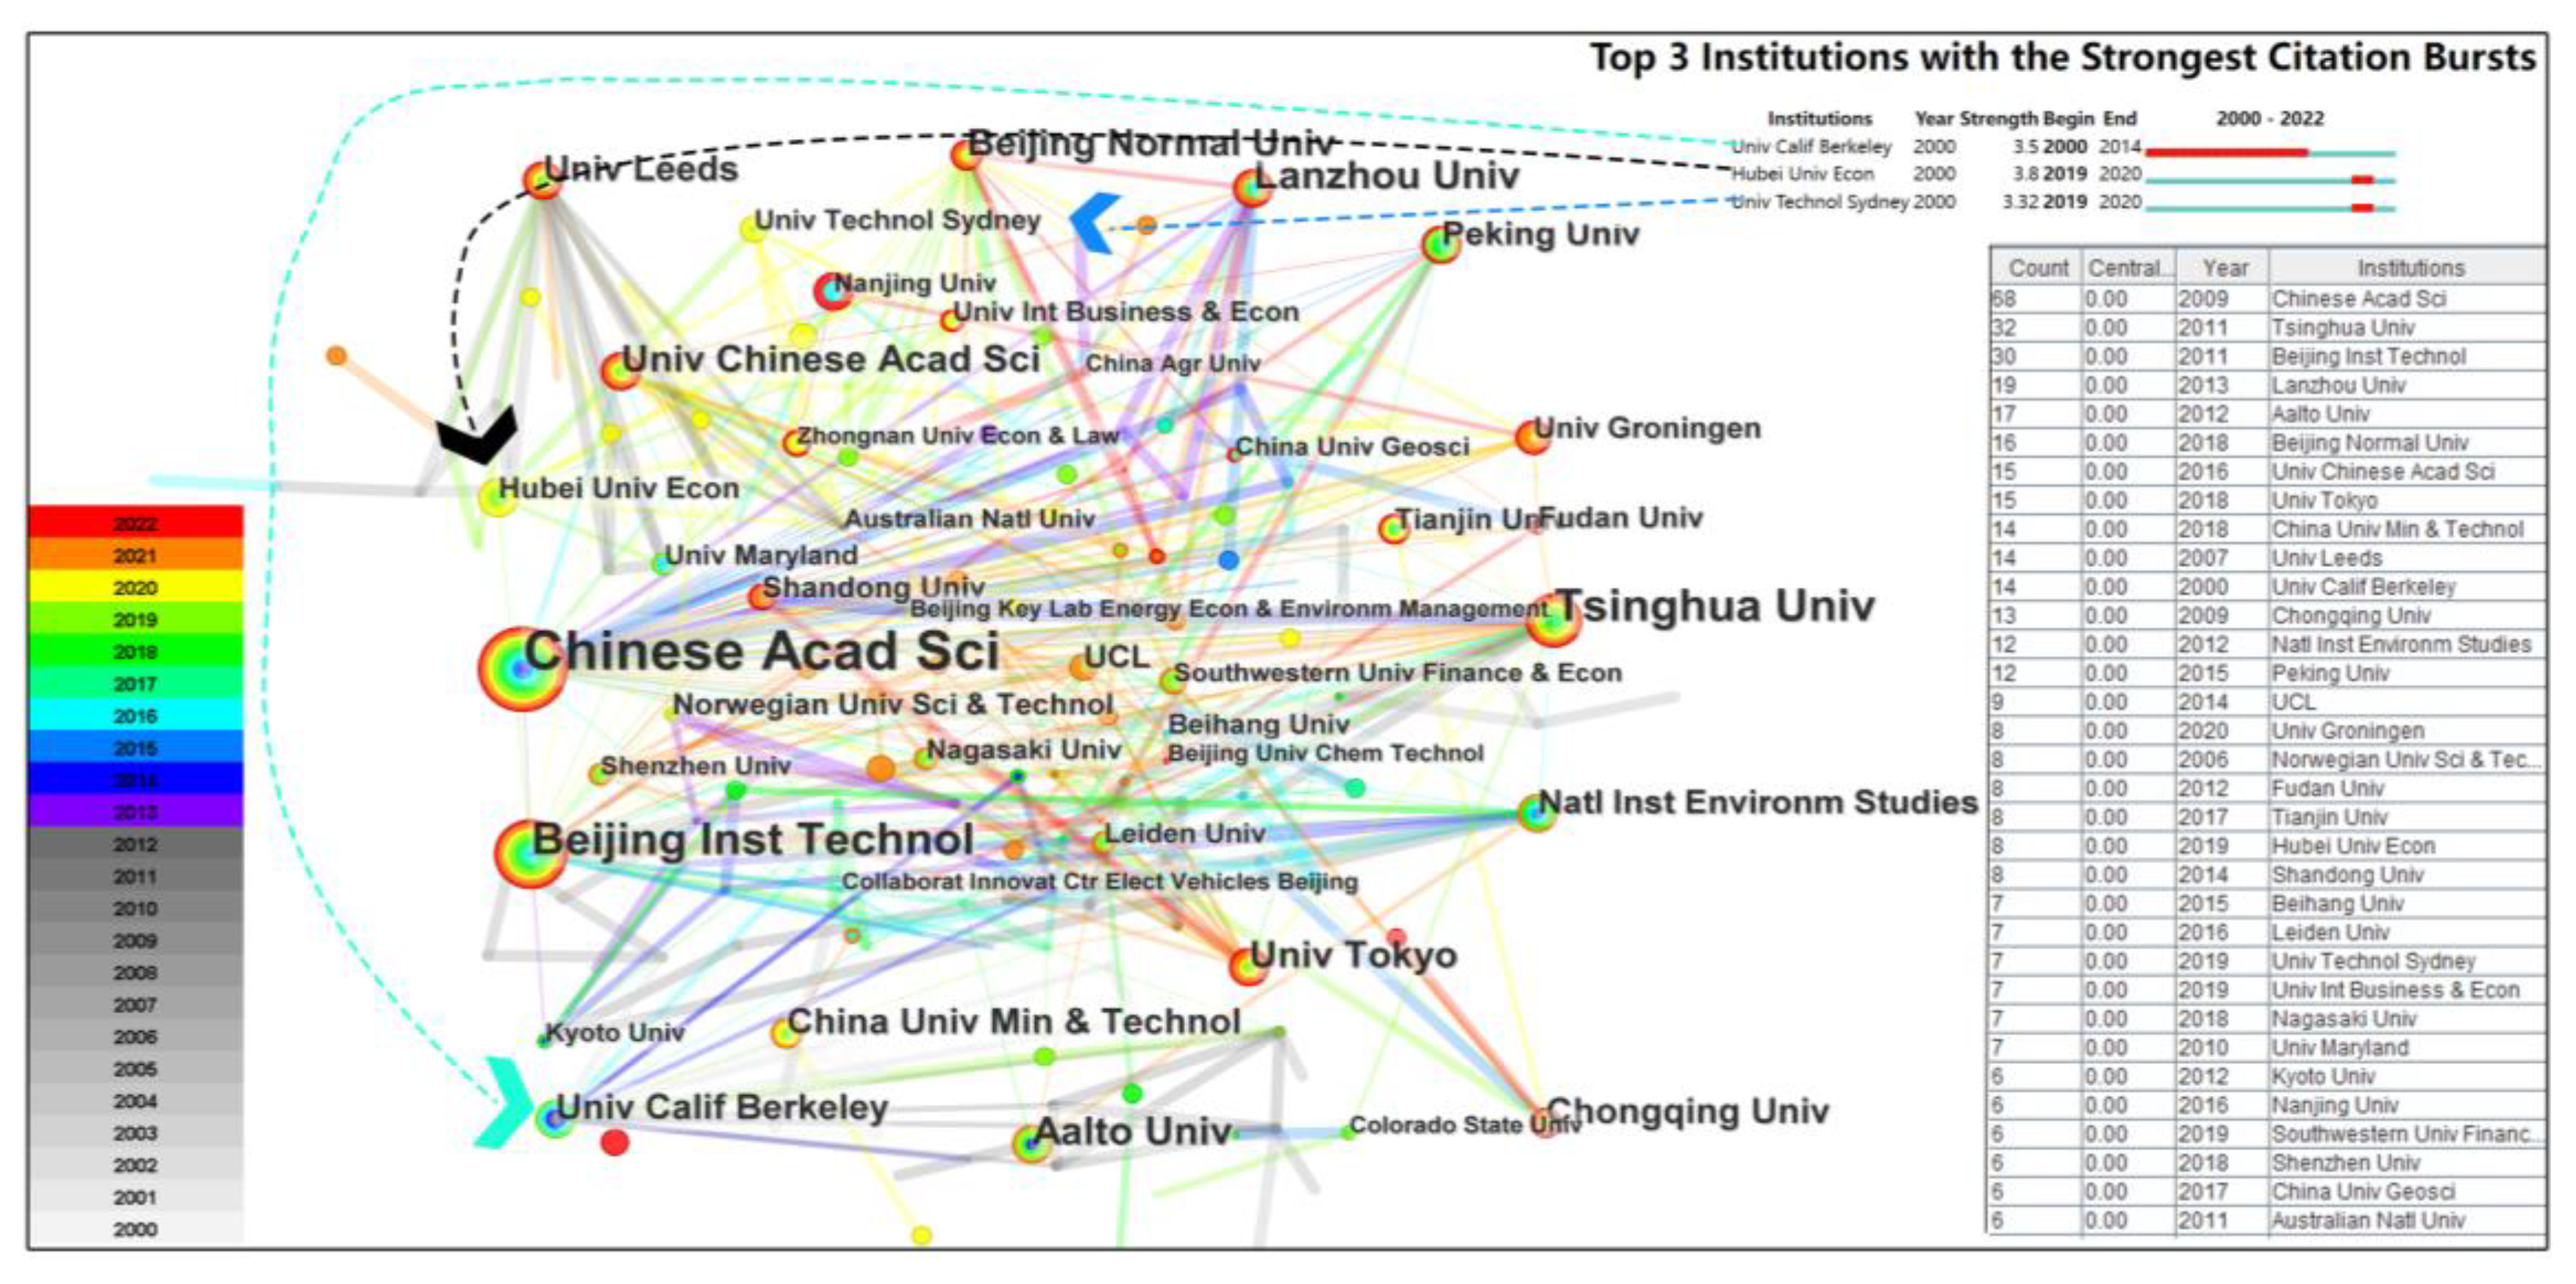
The original software base setup content was followed, where Node Types = Institution, to generate the institution cooperation network of household carbon footprint. Integrate the institution cooperation network (upper right) with the institution cooperation information (lower right) list in Figure 7. Because of the close cooperation and large nodes of each major high-producing institution in the figure, the list of institutional cooperation information is arranged from highest to lowest according to the number of cooperative articles of each institution in order to be able to grasp the institutional cooperation network clearly and move some node positions. There are 14 institutions with more than 10 collaborative articles, and these 14 institutions can be regarded as high-producing institutions. Chinese Academy of Sciences (CAS) ranks 1st among high-producing institutions with 68 collaborative articles. The number of its published articles exceeds the sum of the number of articles issued by Tsinghua University, which ranks 2nd, and Beijing Institute of Technology, which ranks third. However, CAS entered the field of household carbon footprint research late. Its first published article in 2009, which was in the rapid development stage, mainly measured the black carbon emission factor and organic carbon emission factor in Chinese household coal combustion and made recommendations for carbon emission reduction in China concerning the carbon emission factor [102]. Then, the trend of the number of published articles by CAS showed a folding increase. According to the time of the first paper publication, only the University of California, Berkeley, was the first among the 14 highly productive institutions to put in the research, from which Smith et al. [103] published the first paper on household carbon footprint in 2000, where they focused on the impact of household stoves on greenhouse gases, taking India as an example. The remaining institutions were all dedicated to research after 2006, and most of them published their first articles in the rapid development phase. Among them, the University of Tokyo and China University of Mining and Technology were the latest to publish their first publications in 2018 and were in a high development stage. Among the 14 high-producing institutions by nation/region, 9 are from China, with the rest from Finland, Japan, the United States, and the United Kingdom. According to the type of institution, there is only 1 National Institute of Environmental Studies among the 14 high-producing institutions. The rest are all university institutions, indicating that schools are still the leading force in the field of research. The institution cooperation network shows that only the University of Leeds and the China University of Mining and Technology are more distant from the cooperative center network among the 14 high-producing institutions. The ones that produce cooperation with Leeds University are generally university institutions with a small number of publications, and the only two institutions that produce cooperation with China University of Mining and Technology are Shanghai Jiao Tong University and Jiangsu Energy Economic Management Base, so these two nodes are far from the central network. The remaining 12 high-producing institutions are located at the center of the network and are closely interconnected.

4.3. Analysis of Nation/Region Cooperation Network

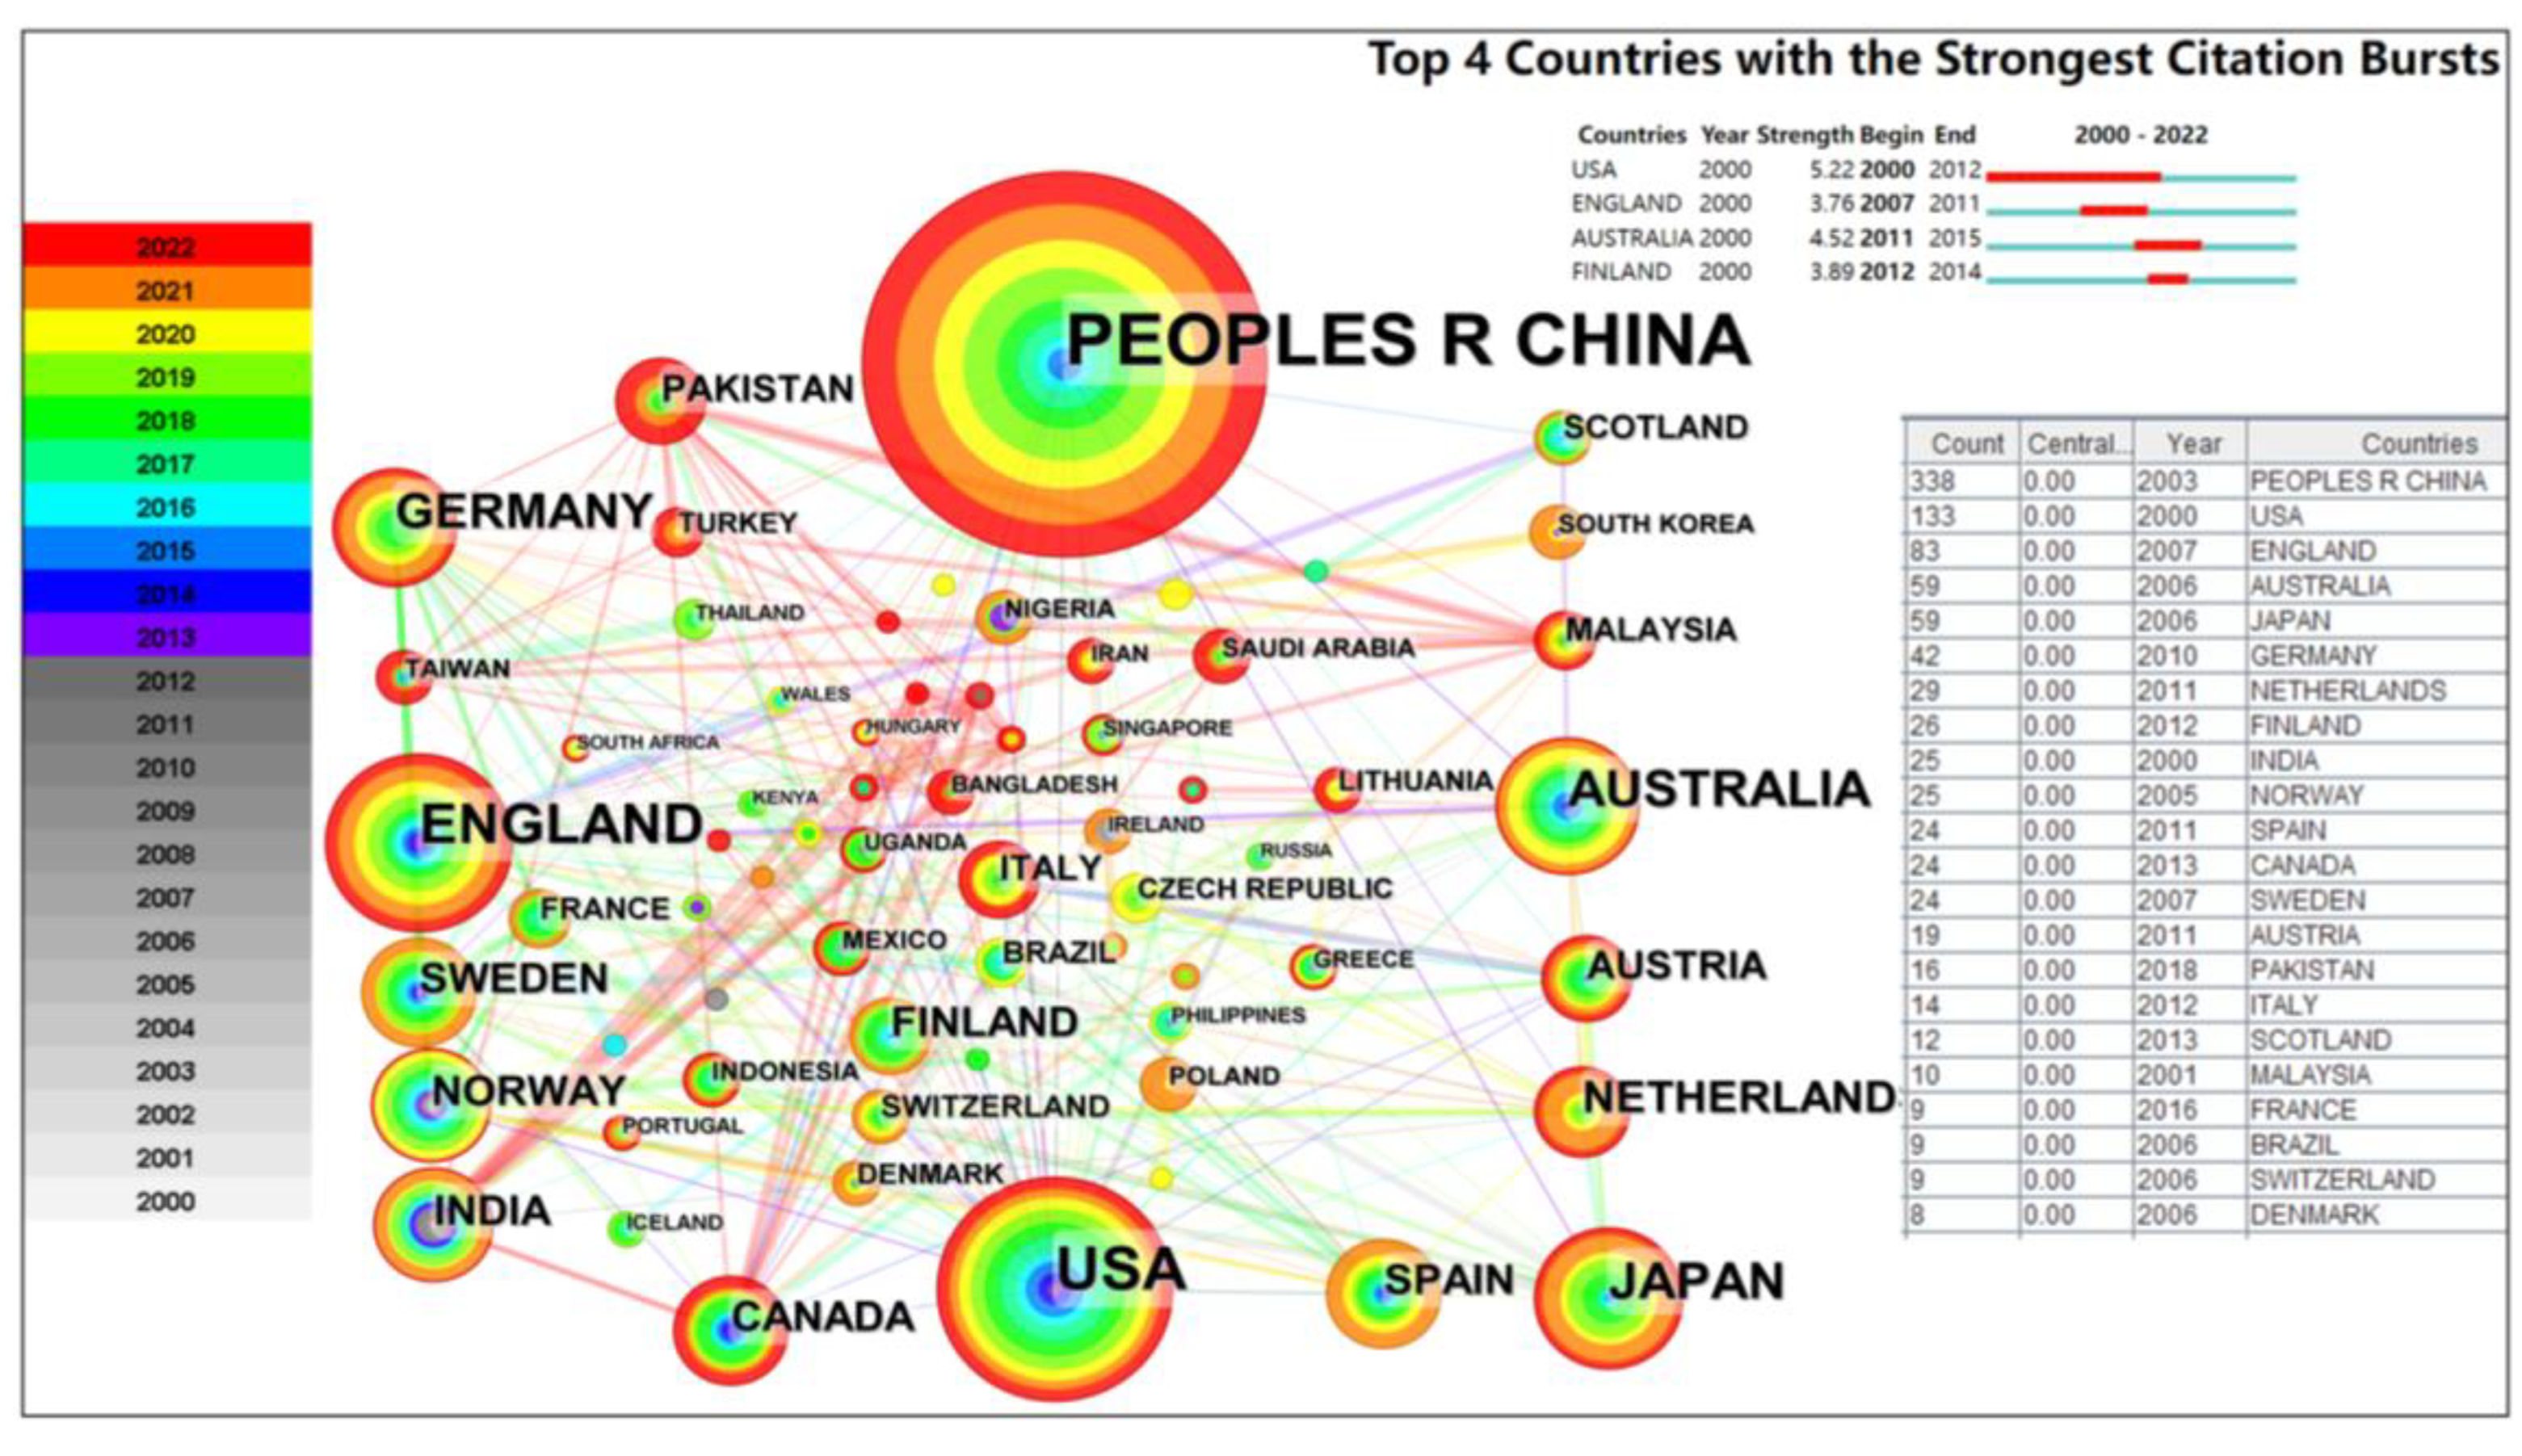
The content of the original software base setup was followed, where Node Types = Country, to generate a nation/region cooperation network in household carbon footprint. The nation/region cooperation network (middle), the list of the top four nations/regions with the strongest burst values (upper right), and the list of nation/region cooperation information (lower right) are integrated into Figure 8. Due to the close cooperation and large nodes of each major nation/region on the map, some node positions are moved to enable a clear grasp of the nation/region cooperation network. The list of nation/region cooperation information is arranged in descending order of the frequency of cooperation. Regarding the frequency of cooperation, only 2 countries have more than 100: China tops the list with 338, and the United States ranks second with 113, and these two countries play a pivotal role in household carbon footprint research. Britain, Australia, and Japan, occupied the third, fourth, and fifth places, respectively. According to the nation/region cooperation network figure, it can be seen that the nations/regions are closely connected to each other, and the major nations/regions even occupy the center of the figure. According to the list of the top 4 nations/regions with the strongest burst values, the United States has the highest burst value 5.22, Australia ranks second with burst = 4.52, and Finland and the United Kingdom rank third and fourth. Regarding the timing of the burst, the United States started the earliest and lasted the longest from 2000 to 2012, while Finland started the latest and lasted the shortest from 2012 to 2014. Regarding the frequency of cooperation in over 10 countries, Pakistan’s first cooperation appeared in 2018. The first cooperation between Canada and Scotland was also late, in 2013, in contrast to the United States and India, which first collaborated in 2000, the initial stage of household carbon footprint research.
Although China has the highest frequency of cooperation, the first cooperation appeared later than the United States and India. The follow-up cooperation started in 2012 and is mainly related to China’s economic development and environmental protection policies. Another point worth noting is that Finland, Canada, and Scotland, which are highly developed capitalist countries, need to catch up in devoting themselves to household carbon footprint cooperation. The reasons behind this are worth further investigating.

5. Analysis of Knowledge Evolution

This part includes two primary content analyses. One is co-citation analysis, performed on article keywords and keyword+ to measure the close relationship between keywords by the number of co-occurrence [104]. Second, journal overlay maps analysis demonstrates literature distribution, citation trajectories, research drift, and, thus, the knowledge evolution process [105].

5.1. Keyword Co-Word Analysis

Following the original software base setting content, where Node Types = Keyword, a keyword network of the household carbon footprint domain is generated to capture the knowledge evolution process within the domain, explore the research frontiers, grasp the research trends, and clarify the topic structure. Keywords include two parts: the content of the article extracted by the authors themselves—keywords—and the keywords added by WOS to the original article—keywords+. In this paper, the keyword co-occurrence network (right), the keyword information list (lower left), and the list of the top 12 keywords with the strongest burst values (upper left) are integrated into Figure 9. There are 450 nodes and 3163 connections in Figure 9. Since the significant keywords in the figure are closely linked, and the nodes are large, some node positions are moved to facilitate the analysis to show the keyword co-word network clearly. In Figure 9, the change of node color from gray to red means that the occurrence time is distributed from 2000 to 2022, and the larger the node radius is, the higher the frequency of the keyword is, representing that it is the focus within this field.
According to Figure 9, it can be seen that the main keywords within the household carbon footprint domain are prominent, and the keywords are closely linked to each other. With 184 occurrences, “impact” ranked first as one of the most important keywords. The second-ranked keyword, “CO2 emissions”, was found 176 times, and the third-ranked keyword, “consumption”, was found 157 times, with all three keywords found more than 150 times. The list of keyword information shows that 19 words co-occur more than 50 times, indicating that these keywords form the basis of the research on household carbon footprint. A total of 450 nodes in the keyword co-occurrence network indicate that the field of household carbon footprint is rich in content and distinctive in theme. From the list of the top 12 keywords with the strongest burst values, “city” has the highest burst value, 5.04, while “energy demand” and “input” have the lowest burst values, 3.31.
Regarding the beginning of the burst, “climate” was the earliest, starting in 2005, and “input” was the latest, starting in 2020. In terms of burst duration, the longest duration for “climate” was from 2005 to 2013, while the shortest duration for “decomposition”, “energy demand”, “reduction”, and “renewable energy” was only two years. One of the more noteworthy is “input” because the burst time is 2020–2022, close to the present time, which is a recent research hot spot. The earliest appearance and longest duration of “climate” indicate that most of the early household carbon footprint studies were related to climate issues, and combined with the previous co-citation analysis, it can be seen that most of the early studies were conducted in the context of climate warming [31]. Most of the studies were conducted to mitigate climate warming [106].
Combining the list of keyword information with the list of the top 12 keywords with the strongest burst values shows that the household carbon footprint has a different thematic structure at different research stages. During the initial stage of household carbon footprint 2000–2008, keywords such as “greenhouse gas emissions”, “carbon dioxide emissions”, “global warming”, “air pollution”, “carbon dioxide”, “consumption”, and “energy” became the main research objects in this period. This is mainly because the IPCC has been publishing a global climate report at regular intervals since 1990, and the climate reports for three consecutive years, 1990, 1996, and 2001, have attracted the attention of researchers worldwide. Therefore, the research reports during this period were conducted in the context of the global warming trend, and the keywords naturally include “climate”, “emission”, and “carbon dioxide”. During the stage of rapid development of household carbon footprint 2009–2016, “household demand”, “energy efficiency”, “household consumption”, “behavior”, “urbanization”, “countryside”, “building”, and other keywords become the primary research objects in this period. The main reason is that with the global awakening of low-carbon emission reduction awareness [107], policies to reduce carbon emissions should no longer be a broad and empty framework but should formulate corresponding reduction policies for different emission sources. In the period of high development of household carbon footprint 2017–2022, keywords such as “inequality”, “drivers”, “carbon tax”, “mitigation measures”, and “willingness to pay the price” become the primary research objects in this period. This is mainly because as the content of household carbon footprint research continues to grow, researchers have gradually subdivided the factors affecting household carbon emissions into a smaller scale and explored the value of each factor’s contribution to the household carbon footprint. In the context of “carbon neutral” and “carbon peak” commitments made by countries around the world [108], carbon trading markets have been gradually improved, and research topics such as “carbon tax” and “willingness to pay” have been introduced into the field of household carbon footprint [109]. IPCC method [110], the input-output method [111], the life-cycle method [112], the multi-region input–output method [113], etc.—each of the above calculation methods has its instinctive field of application and advantages.

5.2. Analysis of Journal Overlay Maps

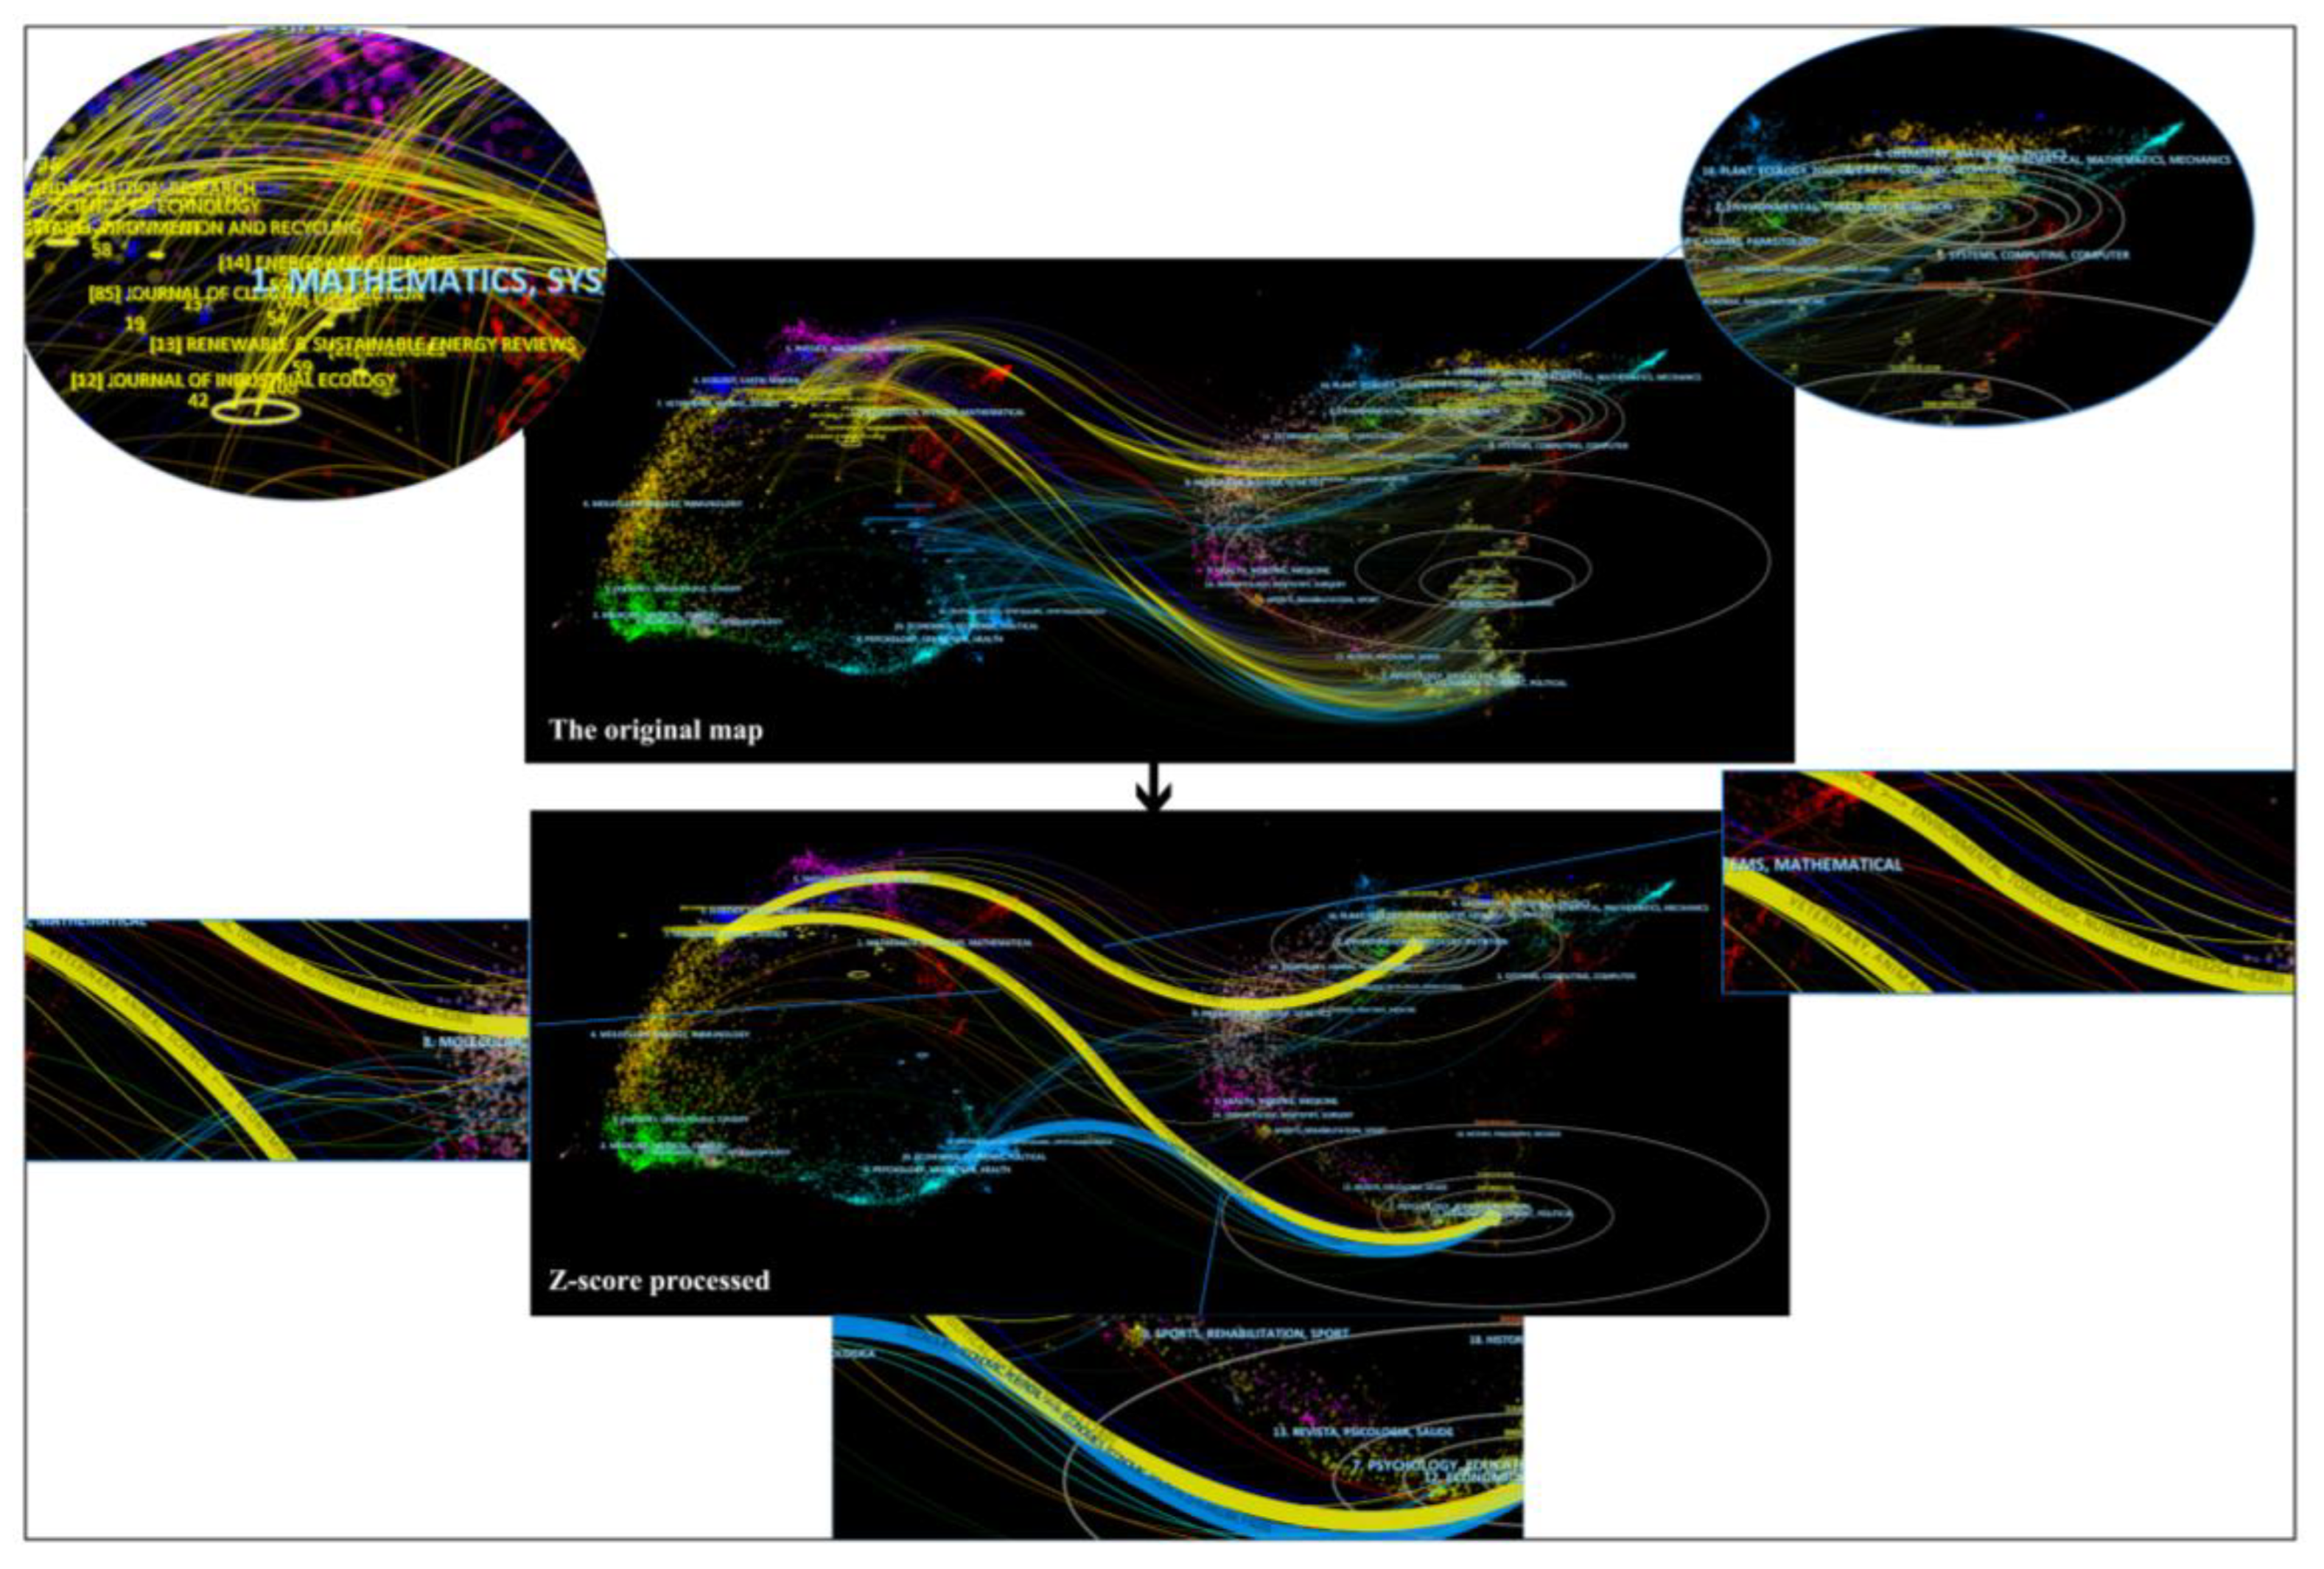
In order to analyze the knowledge evolution process of household carbon footprint studies, we analyzed the journal overlay maps of household carbon footprint studies. Journal overlay maps analysis illustrates the sources of knowledge and destinations of contributions to household carbon footprint research by analyzing all cited papers and subject categories of cited papers for the sample of 754 papers. It is a new method for displaying information about the distribution of papers, citation trajectories, and knowledge drift across disciplines [114]. By analyzing the differences between cited journals and citation journals, we can visually analyze the evolution of household carbon footprint research in terms of disciplinary distribution and research focus. Unlike the previous parameter settings, the journal coverage analysis was opened by “JCR Journal Maps” in the “Overlay Maps” menu, and the data was added by “Add Overlay” to obtain the journal overlay maps (Figure 10). Two parts are contained in Figure 10: the original map of the journal overlay analysis (top) and the results of the Z-score processing (bottom). The colors of the lines in Figure 10 represent the different topics of the source journals [44], and the corresponding ovals represent the number of papers (longitudinal axis) and the number of authors (transverse axis) included in the topics. The original map shows that most of the sources belong to the “Mathematics, Systems, Mathematical” category, while most destinations belong to “History, Philosophy, Records”. However, due to the large number of journals, it is difficult to identify the evolutionary paths of major journal topics in the original map, so the paths need to be merged using the Z-Score algorithm [115]. Then, the thematic evolutionary paths of household carbon footprint studies are summarized.
The original journal paths were grouped into three main evolutionary paths by Z-score (Z) analysis (Figure 10 and Table 5), and the most common topics were “Veterinary, Animal, Science”, as seen in Table 5. The total number of publications evolved through these two paths is 11,410 (f = 11,410). What is interesting is that the literature on this topic belongs to 2 different cited journal topics (destinations): “Environment, Toxicology, Nutrition” (Z = 3.9453254, f = 4830) and “Economics, Economic, Political” (Z = 5.5301766, f = 6580). This indicates that with the development of household carbon footprint research, “Veterinary, Animal, Science” has received more attention from scholars and has become a subject for further refinement. It has facilitated the transfer and evolution of carbon footprint knowledge, concrete evidence of the gradual diversification, and interdisciplinary development of carbon footprint research.
Among the three main paths, the path with the largest proportion is path 2 (Z = 5.5301766, f = 6580), the essential path of knowledge evolution in the development of carbon footprint research in the last 28 years. The path with the minor proportion is path 1 (Z = 3.9453254, f = 4830). It can be seen that the research on carbon footprint in the topic of “Environment, Toxicology, Nutrition” needs more exploration by scholars. Another path of concern is path 3 (Z = 4.4461384, f = 5383), which is the only path where the subject source is homogeneous.

6. Results and Discussion

Based on bibliometrics and knowledge maps, this paper reviews the knowledge base, cooperation networks, and knowledge evolution of household carbon footprint research from 2000 to 2022. Based on CiteSpace software, the development trend of household carbon footprint research in the past 22 years was visualized and analyzed, providing a basis for subsequent research and a theoretical reference for household carbon footprint research scholars. This study tentatively draws the following conclusions by analyzing the three components of knowledge base, cooperation network, and knowledge evolution.
The co-citation analysis shows that household carbon footprint studies have a clear knowledge base and show exact trends over time, as evidenced by the 10 carbon footprint clusters. After 2009, household carbon footprint research entered a rapid development stage, and keywords such as “household demand”, “energy efficiency”, “household consumption”, and “carbon tax” have become the frontier of research and emerging hotspots. The classic literature before 2008 played a crucial role in carbon footprint research, implying that many diverse and interdisciplinary studies emerged after 2008. However, this classical literature still provides the knowledge base for subsequent studies and inspires subsequent breakthrough research directions during the rapid development and high growth stage.
Based on the three-level cooperation network analysis, which implies that household carbon footprint research has a clear research cooperation network structure with prominent nation/region characteristics, there are more high-frequency collaborating scholars in household carbon footprint studies, among which Chinese scholars account for a relatively large number and have a clear central role. In recent years, East/Southeast Asian countries, exemplified by China, have begun to attach importance to sustainable development. These scholars have begun to participate in collaborative global carbon footprint research. However, due to possible cultural and language barriers, scholars have yet to enter the center of international collaborative networks.
In stark contrast, although the University of California at Berkeley is the earliest institution to research household carbon footprint, the China Academy of Sciences has the highest research cooperation. As seen from the time of the cooperation, many Chinese research institutions, dominated by the Chinese Academy of Sciences, have played an essential role in the global household carbon footprint study since 2009. As with Chinese scholars, although China has supported many studies, they have never reached the nation/region cooperation network centers. This phenomenon is manifested again in cooperation at the nation/region level. Developed countries, represented by the United States, have chosen to conduct multifaceted research at the macro level through cross-regional cooperation, and such efforts have continued for a long time.
The co-word analysis and journal overlay maps analysis reveals that household carbon footprint research contains a wide range of research topics and shows a more obvious process of topic drift and knowledge evolution. Not surprisingly, “impact” is the most frequent keyword, highlighting the critical role of research methods based on “life cycle assessment” and “input–output analysis”. The apparent keyword shift within each research stage is concrete evidence that household carbon footprint research is gradually developing into an interdisciplinary, diverse, and homogenous field. “Veterinary, Animal, Science” became the most critical category source for citing journals. Through the destination of the selection “Economics, Economy, Political”, there is an apparent drift of knowledge in household carbon footprint research, thus demonstrating its emerging interdisciplinary nature. Accordingly, other topics are gradually being integrated with the “Economics, Economic, Political” topic, which has some significance in future hot spots.
Although the extensive data sources involved in this study can be used to summarize the research characteristics and trends of household carbon footprint, there are still some limitations. First, the theme-based search method can collect a large amount of data and form a more explicit theme structure. However, due to the macroscopic perspective of the analysis, this study did not involve a detailed interpretation of each cluster or research direction in the analysis process. The knowledge map and bibliometric-based analysis provided in this study can be used as one of the literature review methods for household carbon footprint studies, which can provide a reference for subsequent studies. Second, since the current research on household carbon footprint has developed a more systematic, diversified, and interdisciplinary research trend, this study involves a balanced interpretation of multidisciplinary perspectives. This method of interpretation is not comprehensive, but it can provide a unique perspective. The above two limitations need to be further developed and supplemented by subsequent studies.

7. Conclusions

This paper presents a bibliometric analysis of the evolution of household carbon footprint with the help of the WOS data website and CiteSpace visualization software. The study found that household carbon footprint has a clear knowledge base and shows exact trends over time. Within this research area, the classic literature lays the foundation for subsequent diversified and interdisciplinary articles, and subsequent research hotspots show apparent inheritance and development characteristics. The household carbon footprint research has a clear structure of scientific cooperation networks with distinct nation/region characteristics. Cross-institution and cross-nation/region article collaborations have become the norm. China, Chinese institutions, and Chinese scholars are actively involved in conducting research in this field but still need to enter the center of the collaborative network. Household carbon footprint studies encompass various research topics and show a more prominent topic drift and knowledge evolution process. The apparent keyword shift is direct evidence of the gradual development of household carbon footprint research into an interdisciplinary and diverse homogenous field. This paper analyzes the evolution of household carbon footprint in detail and composes the basic knowledge to provide some reference for subsequent researchers.
As an essential part of carbon emission reduction in the future, the household carbon footprint is bound to become a research hotspot for a long time, and how to balance the high carbon footprint of household consumption tendency with the severe carbon emission reality is inevitably going to be a significant challenge. Therefore, the future research direction should not only focus on reducing the carbon footprint of goods and services but also on making household consumers develop low-carbon consumption behaviors and practice low-carbon concepts on their own. Household carbon footprint research should develop in the direction of refinement, diversification, and feasibility with changing times. Regions, countries, institutions, and authors around the globe should work together in a more holistic direction, regardless of language differences, cultural differences, geopolitics, etc. Household carbon footprint should not be simply ignored as background knowledge by other disciplines but should move towards the interdisciplinary and multi-integrated direction. The household carbon footprint study will become an essential practical solution to achieve global “carbon neutrality” and “carbon peaking” in the future.

Author Contributions

Conceptualization, F.S., Z.S. and Y.M.; methodology, F.S.; software, F.S.; validation, F.S., X.Z. and Y.Z.; formal analysis, F.S.; data curation, F.S.; writing—original draft preparation, F.S.; writing—review and editing, F.S.; project administration, Z.S.; funding acquisition, S.Y. All authors have read and agreed to the published version of the manuscript.

Funding

This research is funded by the National Natural Science Foundation of China (Grant No. 41661036), the National Natural Science Foundation of China—Xinjiang Joint Fund (Grant No. U1603241), and the Xin-jiang local government sent overseas study group supporting projects (No. 117/40299006).

Institutional Review Board Statement

Not applicable.

Informed Consent Statement

Not applicable.

Data Availability Statement

Data are contained within the article.

Acknowledgments

All authors acknowledge the hard-working editors and reviewers for their valuable comments.

Conflicts of Interest

The authors declare that there are no conflicts of interest.

References

  1. Zhao, Z.; Luo, Y.; Huang, J. Review IPCC 30 years (1988–2018). Adv. Clim. Chang. Res. 2018, 14, 540–546. [Google Scholar]
  2. Wang, L.; Zhang, B.; Shi, Y.; Han, Z.; Lu, B. Interpretation of the IPCC AR6 on the impacts and risks of climate change. Progress. Inquisitiones Mutat. Clim. 2022, 18, 389–394. [Google Scholar]
  3. IPCC. The IPCC Sixth Assessment Report on Climate Change Impacts. Popul. Dev. Rev. 2022, 48, 629–633. [Google Scholar] [CrossRef]
  4. Jiang, D.; Wang, X. A brief interpretation of drought change from IPCC Sixth Assessment Report. Trans. Atmos. Sci. 2021, 44, 650–653. [Google Scholar]
  5. Li, Q.C.; Han, Y.; Liu, X.; Ansari, U.; Cheng, Y.F.; Yan, C.L. Hydrate as a by-product in CO2 leakage during the long-term sub-seabed sequestration and its role in preventing further leakage. Environ. Sci. Pollut. Res. 2022, 29, 77737–77754. [Google Scholar] [CrossRef] [PubMed]
  6. Li, Q.; Wang, F.L.; Wang, Y.L.; Bai, B.J.; Zhang, J.Y.; Lili, C.; Sun, Q.; Wang, Y.; Forson, K. Adsorption behavior and mechanism analysis of siloxane thickener for CO2 fracturing fluid on shallow shale soil. J. Mol. Liq. 2023, 376, 10. [Google Scholar] [CrossRef]
  7. Aleixandre-Tudo, J.L.; Castello-Cogollos, L.; Aleixandre, J.L.; Aleixandre-Benavent, R. Trends in funding research and international collaboration on greenhouse gas emissions: A bibliometric approach. Environ. Sci. Pollut. Res. 2021, 28, 32330–32346. [Google Scholar] [CrossRef]
  8. Tan, S.K.; Zhang, M.M.; Wang, A.; Zhang, X.S.; Chen, T.C. How do varying socio-economic driving forces affect China’s carbon emissions? New evidence from a multiscale geographically weighted regression model. Environ. Sci. Pollut. Res. 2021, 28, 41242–41254. [Google Scholar] [CrossRef]
  9. Wu, Y.; Shen, L.Y.; Zhang, Y.; Shuai, C.Y.; Yan, H.; Lou, Y.L.; Ye, G. A new panel for analyzing the impact factors on carbon emission: A regional perspective in China. Ecol. Indic. 2019, 97, 260–268. [Google Scholar] [CrossRef]
  10. Wei, Y.G.; Zhu, X.H.; Li, Y.; Yao, T.; Tao, Y. Influential factors of national and regional CO2 emission in China based on combined model of DPSIR and PLS-SEM. J. Clean. Prod. 2019, 212, 698–712. [Google Scholar] [CrossRef]
  11. Shuai, C.Y.; Chen, X.; Wu, Y.; Tan, Y.T.; Zhang, Y.; Shen, L.Y. Identifying the key impact factors of carbon emission in China: Results from a largely expanded pool of potential impact factors. J. Clean. Prod. 2018, 175, 612–623. [Google Scholar] [CrossRef]
  12. Liu, Y.L.; Chang, X.L.; Huang, C.F. Research and Analysis on the Influencing Factors of China’s Carbon Emissions Based on a Panel Quantile Model. Sustainability 2022, 14, 7791. [Google Scholar] [CrossRef]
  13. Shuai, C.Y.; Shen, L.Y.; Jiao, L.D.; Wu, Y.; Tan, Y.T. Identifying key impact factors on carbon emission: Evidences from panel and time-series data of 125 countries from 1990 to 2011. Appl. Energy 2017, 187, 310–325. [Google Scholar] [CrossRef]
  14. Zhang, C.G.; Tan, Z. The relationships between population factors and China’s carbon emissions: Does population aging matter? Renew. Sustain. Energy Rev. 2016, 65, 1018–1025. [Google Scholar] [CrossRef]
  15. Yang, Y.Y.; Zhao, T.; Wang, Y.N.; Shi, Z.H. Research on impacts of population-related factors on carbon emissions in Beijing from 1984 to 2012. Environ. Impact Assess. Rev. 2015, 55, 45–53. [Google Scholar] [CrossRef]
  16. Weidema, B.P.; Thrane, M.; Christensen, P.; Schmidt, J.; Lokke, S. Carbon footprint—A catalyst for life cycle assessment? J. Ind. Ecol. 2008, 12, 3–6. [Google Scholar] [CrossRef]
  17. East, A.J. In What is a carbon footprint? An overview of definitions and methodologies. In Vegetable Industry Carbon Footprint Scoping Study—Discussion Papers and Workshop, 26 September 2008; Horticulture Australia Limited Sydney: Sydney, Australia, 2008. [Google Scholar]
  18. Edwards-Jones, G.; Plassmann, K.; York, E.H.; Hounsome, B.; Jones, D.L.; Canals, L.M.I. Vulnerability of exporting nations to the development of a carbon label in the United Kingdom. Environ. Sci. Policy 2009, 12, 479–490. [Google Scholar] [CrossRef]
  19. Barthelmie, R.J.; Morris, S.D.; Schechter, P. Carbon neutral Biggar: Calculating the community carbon footprint and renewable energy options for footprint reduction. Sustain. Sci. 2008, 3, 267–282. [Google Scholar] [CrossRef]
  20. Hertwich, E.G.; Peters, G.P. Carbon Footprint of Nations: A Global, Trade-Linked Analysis. Environ. Sci. Technol. 2009, 43, 6414–6420. [Google Scholar] [CrossRef] [Green Version]
  21. Eggleston, H.; Buendia, L.; Miwa, K.; Ngara, T.; Tanabe, K. 2006 IPCC Guidelines for National Greenhouse Gas Inventories; IPPC: Geneva, Switzeralnd, 2006. [Google Scholar]
  22. Specification, P.A. Specification for the assessment of the life cycle greenhouse gas emissions of goods and services. Bsi Br. Stand. Isbn 2008, 978, 580. [Google Scholar]
  23. Wiedmann, T.; Minx, J. A definition of ‘carbon footprint’. Ecol. Econ. Res. Trends 2008, 1, 1–11. [Google Scholar]
  24. Thapa, P.; Hasnine, M.T.; Zoungrana, A.; Thakur, S.; Yuan, Q.Y. Food Waste Treatments and the Impact of Composting on Carbon Footprint in Canada. Fermentation 2022, 8, 566. [Google Scholar] [CrossRef]
  25. Wolfson, J.A.; Willits-Smith, A.M.; Leung, C.W.; Heller, M.C.; Rose, D. Cooking at Home, Fast Food, Meat Consumption, and Dietary Carbon Footprint among US Adults. Int. J. Environ. Res. Public Health 2022, 19, 853. [Google Scholar] [CrossRef] [PubMed]
  26. Bian, R.X.; Chen, J.H.; Zhang, T.X.; Gao, C.Q.; Niu, Y.T.; Sun, Y.J.; Zhan, M.L.; Zhao, F.B.; Zhang, G.D. Influence of the classification of municipal solid wastes on the reduction of greenhouse gas emissions: A case study of Qingdao City, China. J. Clean Prod. 2022, 376, 10. [Google Scholar] [CrossRef]
  27. Yang, Y.; Li, Y.; Guo, Y.D. Impact of the differences in carbon footprint driving factors on carbon emission reduction of urban agglomerations given SDGs: A case study of the Guanzhong in China. Sustain. Cities Soc. 2022, 85, 13. [Google Scholar] [CrossRef]
  28. Kiehle, J.; Kopsakangas-Savolainen, M.; Hilli, M.; Pongracz, E. Carbon footprint at institutions of higher education: The case of the University of Oulu. J. Environ. Manag. 2023, 329, 14. [Google Scholar] [CrossRef]
  29. Eslamidoost, Z.; Arabzadeh, M.; Oskoie, V.; Dehghani, S. Carbon footprint calculation in one of the largest Gas Refinery Companies in the Middle East. Environ. Sci. Pollut. Res. 2022, 29, 81609–81623. [Google Scholar] [CrossRef]
  30. Patel, R.; Marvuglia, A.; Baustert, P.; Huang, Y.L.; Shivakumar, A.; Nikolic, I.; Verma, T. Quantifying households’ carbon footprint in cities using socioeconomic attributes: A case for The. Sustain. Cities Soc. 2022, 86, 19. [Google Scholar] [CrossRef]
  31. Weber, C.L.; Matthews, H.S. Quantifying the global and distributional aspects of American household carbon footprint. Ecol. Econ. 2008, 66, 379–391. [Google Scholar] [CrossRef]
  32. Wiedenhofer, D.; Guan, D.B.; Liu, Z.; Meng, J.; Zhang, N.; Wei, Y.M. Unequal household carbon footprints in China. Nat. Clim. Chang. 2017, 7, 75–80. [Google Scholar] [CrossRef] [Green Version]
  33. Shi, S.Q.; Yin, J.H. Global research on carbon footprint: A scientometric review. Environ. Impact Assess. Rev. 2021, 89, 15. [Google Scholar] [CrossRef]
  34. Christis, M.; Breemersch, K.; Vercalsteren, A.; Dils, E. A detailed household carbon footprint analysis using expenditure accounts—Case of Flanders (Belgium). J. Clean Prod. 2019, 228, 1167–1175. [Google Scholar] [CrossRef]
  35. Pottier, A. Expenditure elasticity and income elasticity of GHG emissions: A survey of literature on household carbon footprint. Ecol. Econ. 2022, 192, 13. [Google Scholar] [CrossRef]
  36. Chai, Z.Y.; Yan, Y.B.; Simayi, Z.; Yang, S.T.; Abulimiti, M.; Wang, Y.Q. Carbon emissions index decomposition and carbon emissions prediction in Xinjiang from the perspective of population-related factors, based on the combination of STIRPAT model and neural network. Environ. Sci. Pollut. Res. 2022, 29, 31781–31796. [Google Scholar]
  37. Yao, L.; Liu, J.; Yuan, Y. Growth of carbon footprint of Chinese household consumption during the recent two decades and its future trends. Acta Sci. Circumstantiae 2017, 37, 2403–2408. [Google Scholar]
  38. Shigetomi, Y.; Kanemoto, K.; Yamamoto, Y.; Kondo, Y. Quantifying the carbon footprint reduction potential of lifestyle choices in Japan. Environ. Res. Lett. 2021, 16, 13. [Google Scholar] [CrossRef]
  39. Yue, T.; Liu, H.W.; Long, R.Y.; Chen, H.; Gan, X.; Liu, J.L. Research trends and hotspots related to global carbon footprint based on bibliometric analysis: 2007–2018. Environ. Sci. Pollut. Res. 2020, 27, 17671–17691. [Google Scholar] [CrossRef] [PubMed]
  40. Broadus, R.N. Toward a definition of “bibliometrics”. Scientometrics 1987, 12, 373–379. [Google Scholar] [CrossRef]
  41. Ball, R. An Introduction to Bibliometrics: New Development and Trends; Chandos Publishing: Oxford, UK, 2017. [Google Scholar]
  42. Donthu, N.; Kumar, S.; Mukherjee, D.; Pandey, N.; Lim, W.M. How to conduct a bibliometric analysis: An overview and guidelines. J. Bus. Res. 2021, 133, 285–296. [Google Scholar] [CrossRef]
  43. Cobo, M.J.; Martinez, M.A.; Gutierrez-Salcedo, M.; Fujita, H.; Herrera-Viedma, E. 25 years at Knowledge-Based Systems: A bibliometric analysis. Knowl. -Based Syst. 2015, 80, 3–13. [Google Scholar] [CrossRef]
  44. Chen, Y.; Chen, C.; Liu, Z.; Hu, Z.; Wang, X. The methodology function of Cite Space mapping knowledge domains. Stud. Sci. Sci. 2015, 33, 242–253. [Google Scholar]
  45. Xiao, F.J.; Li, C.Z.; Sun, J.M.; Zhang, L.J. Knowledge Domain and Emerging Trends in Organic Photovoltaic Technology: A Scientometric Review Based on CiteSpace Analysis. Front. Chem. 2017, 5, 12. [Google Scholar] [CrossRef] [PubMed] [Green Version]
  46. Ma, X.T.; Luo, H.P.; Liao, J.A.; Zhao, J.F. The knowledge domain and emerging trends in apple detection based on NIRS: A scientometric analysis with CiteSpace (1989–2021). Food Sci. Nutr. 2022, 10, 4091–4102. [Google Scholar] [CrossRef] [PubMed]
  47. Rousi, A.M.; Laakso, M. Overlay journals: A study of the current landscape. J. Librariansh. Inf. Sci. 2022, 14. [Google Scholar] [CrossRef]
  48. Chen, C. Science Mapping: A Systematic Review of the Literature. J. Data Inf. Sci. 2017, 2, 1–40. [Google Scholar] [CrossRef] [Green Version]
  49. Diaz, I.A.; Kopecky, K.; Rodriguez, J.M.R.; Reche, M.P.C.; Torres, J.M.T. Pathologies associated with Problematic Internet Use. A systematic review and meta-analysis in WoS and Scopus. Investig. Bibliotecol. 2020, 34, 229–253. [Google Scholar]
  50. Chen, C.; Li, C.J.; Reniers, G.; Yang, F.Q. Safety and security of oil and gas pipeline transportation: A systematic analysis of research trends and future needs using WoS. J. Clean Prod. 2021, 279, 12. [Google Scholar] [CrossRef]
  51. Sarkar, A.; Wang, H.Y.; Rahman, A.; Memon, W.H.; Qian, L. A bibliometric analysis of sustainable agriculture: Based on the Web of Science (WOS) platform. Environ. Sci. Pollut. Res. 2022, 29, 38928–38949. [Google Scholar] [CrossRef]
  52. Hu, Y.; Zheng, J.; Kong, X.; Sun, J.; Li, Y. Carbon footprint and economic efficiency of urban agriculture in Beijing—A comparative case study of conventional and home-delivery agriculture. J. Clean. Prod. 2019, 234, 615–625. [Google Scholar] [CrossRef]
  53. Silva, J.T.; Garzillo, J.M.F.; Rauber, F.; Kluczkovski, A.; Rivera, X.S.; da Cruz, G.L.; Frankowska, A.; Martins, C.A.; da Costa Louzada, M.L.; Monteiro, C.A.; et al. Greenhouse gas emissions, water footprint, and ecological footprint of food purchases according to their degree of processing in Brazilian metropolitan areas: A time-series study from 1987 to 2018. Lancet Planet. Health 2021, 5, e775–e785. [Google Scholar] [CrossRef]
  54. Erdoğan, S.; Onifade, S.T.; Altuntaş, M.; Bekun, F.V. Synthesizing urbanization and carbon emissions in Africa: How viable is environmental sustainability amid the quest for economic growth in a globalized world? Environ. Sci. Pollut. Res. 2022, 29, 24348–24361. [Google Scholar] [CrossRef] [PubMed]
  55. Padgett, J.P.; Steinemann, A.C.; Clarke, J.H.; Vandenbergh, M.P. A comparison of carbon calculators. Environ. Impact Assess. Rev. 2008, 28, 106–115. [Google Scholar] [CrossRef]
  56. Bravo, G.; Vallino, E.; Cerutti, A.K.; Pairotti, M.B. Alternative scenarios of green consumption in Italy: An empirically grounded model. Environ. Model. Softw. 2013, 47, 225–234. [Google Scholar] [CrossRef]
  57. Akizu-Gardoki, O.; Wakiyama, T.; Wiedmann, T.; Bueno, G.; Arto, I.; Lenzen, M.; Lopez-Guede, J.M. Hidden Energy Flow indicator to reflect the outsourced energy requirements of countries. J. Clean. Prod. 2021, 278, 123827. [Google Scholar] [CrossRef]
  58. Ward, D.O.; Clark, C.D.; Jensen, K.L.; Yen, S.T.; Russell, C.S. Factors influencing willingness-to-pay for the ENERGY STAR® label. Energy Policy 2011, 39, 1450–1458. [Google Scholar] [CrossRef]
  59. Rao, C.S.; Gopinath, K.A.; Prasad, J.V.N.S.; Singh, A.K. Climate resilient villages for sustainable food security in tropical India: Concept, process, technologies, institutions and impacts. Adv. Agron. 2016, 140, 101–214. [Google Scholar]
  60. Grabow, M.; Bryan, T.; Checovich, M.M.; Converse, A.K.; Middlecamp, C.; Mooney, M.; Torres, E.R.; Younkin, S.G.; Barrett, B. Mindfulness and Climate Change Action: A Feasibility Study. Sustainability 2018, 10, 1508. [Google Scholar] [CrossRef] [Green Version]
  61. Fissore, C.; Baker, L.A.; Hobbie, S.E.; King, J.Y.; McFadden, J.P.; Nelson, K.C.; Jakobsdottir, I. Carbon, nitrogen, and phosphorus fluxes in household ecosystems in the Minneapolis-Saint Paul, Minnesota, urban region. Ecol. Appl. 2011, 21, 619–639. [Google Scholar] [CrossRef] [Green Version]
  62. Li, H.; Jenkins-Smith, H.C.; Silva, C.L.; Berrens, R.P.; Herron, K.G. Public support for reducing US reliance on fossil fuels: Investigating household willingness-to-pay for energy research and development. Ecol. Econ. 2009, 68, 731–742. [Google Scholar] [CrossRef]
  63. Ma, M.; Ma, X.; Cai, W.; Cai, W. Carbon-dioxide mitigation in the residential building sector: A household scale-based assessment. Energy Convers. Manag. 2019, 198, 111915. [Google Scholar] [CrossRef]
  64. Small, H.G. A Co-Citation Model of a Scientific Specialty: A Longitudinal Study of Collagen Research. Soc. Stud. Sci. 1977, 7, 139–166. [Google Scholar] [CrossRef]
  65. Chen, C.; Chen, Y.; Hou, J.; Liang, Y. CiteSpace II: Detecting and Visualizing Emerging Trends and Transient Patterns in Scientific Literature. J. China Soc. Sci. Tech. Inf. 2009, 28, 401–421. [Google Scholar] [CrossRef] [Green Version]
  66. Druckman, A.; Jackson, T. Household energy consumption in the UK: A highly geographically and socio-economically disaggregated model. Energy Policy 2008, 36, 3177–3192. [Google Scholar] [CrossRef] [Green Version]
  67. Ramaswami, A.; Hillman, T.; Janson, B.; Reiner, M.; Thomas, G. A demand-centered, hybrid life-cycle methodology for city-scale greenhouse gas inventories. Environ. Sci. Technol. 2008, 42, 6455–6461. [Google Scholar] [CrossRef] [PubMed] [Green Version]
  68. Weber, C.L.; Peters, G.P.; Guan, D.; Hubacek, K. The contribution of Chinese exports to climate change. Energy Policy 2008, 36, 3572–3577. [Google Scholar] [CrossRef] [Green Version]
  69. Feng, Z.H.; Zou, L.L.; Wei, Y.M. The impact of household consumption on energy use and CO2 emissions in China. Energy 2011, 36, 656–670. [Google Scholar] [CrossRef]
  70. Liu, L.C.; Wu, G.; Wang, J.N.; Wei, Y.M. China’s carbon emissions from urban and rural households during 1992–2007. J. Clean. Prod. 2011, 19, 1754–1762. [Google Scholar] [CrossRef]
  71. Druckman, A.; Jackson, T. The carbon footprint of UK households 1990–2004: A socio-economically disaggregated, quasi-multi-regional input-output model. Ecol. Econ. 2009, 68, 2066–2077. [Google Scholar] [CrossRef] [Green Version]
  72. Tian, X.; Geng, Y.; Dong, H.J.; Dong, L.; Fujita, T.; Wang, Y.T.; Zhao, H.Y.; Wu, R.; Liu, Z.; Sun, L. Regional household carbon footprint in China: A case of Liaoning province. J. Clean. Prod. 2016, 114, 401–411. [Google Scholar] [CrossRef]
  73. Guo, F.; Zhao, X.; Zhang, L.; Li, W. Carbon footprint of farmers of different livelihood strategies in Gannan plateau. Acta Ecol. Sin. 2015, 35, 3755–3765. [Google Scholar]
  74. Xu, X.B.; Tan, Y.; Chen, S.; Yang, G.S.; Su, W.Z. Urban Household Carbon Emission and Contributing Factors in the Yangtze River Delta, China. PLoS ONE 2015, 10, 21. [Google Scholar] [CrossRef] [PubMed] [Green Version]
  75. Zhuang, X.; Jiang, K.; Zhao, X. An Analysis on Carbon Footprints of Residential Livings and Travel and Their Environmental Influential Factors in Shijiazhuang City. Adv. Clim. Chang. Res. 2010, 6, 443–448. [Google Scholar]
  76. Das Gupta, M. Carbon footprint from road transport use in Kolkata city. Transport. Res. Part D-Transport. Environ. 2014, 32, 397–410. [Google Scholar] [CrossRef]
  77. Sun, X.; Liu, J.; Yang, D.; Lu, B. The carbon footprint of household air-conditioner and its key influence factors. Acta Sci. Circumstantiae 2014, 34, 1054–1060. [Google Scholar]
  78. Nie, X.; Liu, J.; Yang, J.; Liu, R. Carbon footprint patterns of the rural and urban household consumption at provincial level in China. J. Univ. Chin. Acad. Sci. 2014, 31, 477–483. [Google Scholar]
  79. Liobikiene, G.; Brizga, J. Sustainable Consumption in the Baltic States: The Carbon Footprint in the Household Sector. Sustainability 2022, 14, 1567. [Google Scholar] [CrossRef]
  80. Zen, I.S.; Al-Amin, A.; Alam, M.M.; Doberstein, B. Magnitudes of households’ carbon footprint in Iskandar Malaysia: Policy implications for sustainable development. J. Clean Prod. 2021, 315, 14. [Google Scholar] [CrossRef]
  81. Huang, Y.Z.; Shigetomi, Y.; Chapman, A.; Matsumoto, K. Uncovering Household Carbon Footprint Drivers in an Aging, Shrinking Society. Energies 2019, 12, 3745. [Google Scholar] [CrossRef] [Green Version]
  82. Zheng, H.R.; Long, Y.; Wood, R.; Moran, D.; Zhang, Z.K.; Meng, J.; Feng, K.S.; Hertwich, E.; Guan, D.B. Ageing society in developed countries challenges carbon mitigation. Nat. Clim. Chang. 2022, 12, 241–248. [Google Scholar] [CrossRef]
  83. Bjelle, E.L.; Steen-Olsen, K.; Wood, R. Climate change mitigation potential of Norwegian households and the rebound effect. J. Clean. Prod. 2018, 172, 208–217. [Google Scholar] [CrossRef]
  84. Moran, D.; Wood, R.; Hertwich, E.; Mattson, K.; Rodriguez, J.F.D.; Schanes, K.; Barrett, J. Quantifying the potential for consumer-oriented policy to reduce European and foreign carbon emissions. Clim. Policy 2020, 20, S28–S38. [Google Scholar] [CrossRef] [Green Version]
  85. Gooch, M.; Matsubuchi-Shaw, M.; Bucknell, D.; LaPlain, D.; Kohler, L. Quantifying the carbon footprint of household food waste and associated GHGs in Oakville, Ontario, and a municipality’s role in reducing both food waste and GHGs. Can. Geogr.-Géographe Can. 2022, 66, 769–782. [Google Scholar] [CrossRef]
  86. Adelodun, B.; Kim, S.H.; Odey, G.; Choi, K.S. Assessment of environmental and economic aspects of household food waste using a new Environmental-Economic Footprint (EN-EC) index: A case study of Daegu, South Korea. Sci. Total Environ. 2021, 776, 10. [Google Scholar] [CrossRef] [PubMed]
  87. Sun, M.X.; Chen, G.W.; Xu, X.B.; Zhang, L.X.; Hubacek, K.; Wang, Y.T. Reducing Carbon Footprint Inequality of Household Consumption in Rural Areas: Analysis from Five Representative Provinces in China. Environ. Sci. Technol. 2021, 55, 11511–11520. [Google Scholar] [CrossRef] [PubMed]
  88. Huang, Y.Z.; Shigetomi, Y.; Matsumoto, K. Evaluating carbon inequality by household type and income level across prefectures in Japan. Sustain. Cities Soc. 2022, 87, 14. [Google Scholar] [CrossRef]
  89. Chen, C.C.; Liu, G.Y.; Meng, F.X.; Hao, Y.; Zhang, Y.; Casazza, M. Energy consumption and carbon footprint accounting of urban and rural residents in Beijing through Consumer Lifestyle Approach. Ecol. Indic. 2019, 98, 575–586. [Google Scholar] [CrossRef]
  90. Adnan, M.N.; Safeer, R.; Rashid, A. Consumption based approach of carbon footprint analysis in urban slum and non-slum areas of Rawalpindi. Habitat Int. 2018, 73, 16–24. [Google Scholar] [CrossRef]
  91. Zhang, Y.J.; Bian, X.J.; Tan, W.P.; Song, J. The indirect energy consumption and CO2 emission caused by household consumption in China: An analysis based on the input-output method. J. Clean Prod. 2017, 163, 69–83. [Google Scholar] [CrossRef]
  92. Tang, Z.P.; Wu, S.; Zou, J.L. Consumption substitution and change of household indirect energy consumption in China between 1997 and 2012. PLoS ONE 2020, 15, 19. [Google Scholar] [CrossRef]
  93. Ivanova, D.; Stadler, K.; Steen-Olsen, K.; Wood, R.; Vita, G.; Tukker, A.; Hertwich, E.G. Environmental Impact Assessment of Household Consumption. J. Ind. Ecol. 2016, 20, 526–536. [Google Scholar] [CrossRef] [Green Version]
  94. Ivanova, D.; Vita, G.; Steen-Olsen, K.; Stadler, K.; Melo, P.C.; Wood, R.; Hertwich, E.G. Mapping the carbon footprint of EU regions. Environ. Res. Lett. 2017, 12, 13. [Google Scholar] [CrossRef]
  95. Zhang, X.L.; Luo, L.Z.; Skitmore, M. Household carbon emission research: An analytical review of measurement, influencing factors and mitigation prospects. J. Clean Prod. 2015, 103, 873–883. [Google Scholar] [CrossRef] [Green Version]
  96. Yuan, B.L.; Ren, S.G.; Chen, X.H. The effects of urbanization, consumption ratio and consumption structure on residential indirect CO2 emissions in China: A regional comparative analysis. Appl. Energy 2015, 140, 94–106. [Google Scholar] [CrossRef]
  97. Golley, J.; Meng, X. Income inequality and carbon dioxide emissions: The case of Chinese urban households. Energy Econ. 2012, 34, 1864–1872. [Google Scholar] [CrossRef]
  98. Jones, C.; Kammen, D.M. Spatial distribution of U.S. household carbon footprints reveals suburbanization undermines greenhouse gas benefits of urban population density. Environ. Sci. Technol. 2014, 48, 895–902. [Google Scholar] [CrossRef] [PubMed]
  99. Brizga, J.; Feng, K.; Hubacek, K. Household carbon footprints in the Baltic States: A global multi-regional input–output analysis from 1995 to 2011. Appl. Energy 2017, 189, 780–788. [Google Scholar] [CrossRef]
  100. Wang, W.J.; Wang, Z.J. Retrospecting the researches and efforts on Lancang-Mekong water issues: A bibliometric perspective. Water Policy 2022, 24, 1930–1950. [Google Scholar] [CrossRef]
  101. Zhao, R.; Wu, D.Y.; Patti, S. A Bibliometric Analysis of Carbon Labeling Schemes in the Period 2007–2019. Energies 2020, 13, 4233. [Google Scholar] [CrossRef]
  102. Chen, Y.J.; Zhi, G.R.; Feng, Y.L.; Liu, D.Y.; Zhang, G.; Li, J.; Sheng, G.Y.; Fu, J.M. Measurements of Black and Organic Carbon Emission Factors for Household Coal Combustion in China: Implication for Emission Reduction. Environ. Sci. Technol. 2009, 43, 9495–9500. [Google Scholar] [CrossRef]
  103. Smith, K.R.; Uma, R.; Kishore, V.V.N.; Zhang, J.F.; Joshi, V.; Khalil, M.A.K. Greenhouse implications of household stoves: An analysis for India. Annu. Rev. Energ. Environ. 2000, 25, 741–763. [Google Scholar] [CrossRef] [Green Version]
  104. Chen, C.M.; Ibekwe-SanJuan, F.; Hou, J.H. The Structure and Dynamics of Cocitation Clusters: A Multiple-Perspective Cocitation Analysis. J. Am. Soc. Inf. Sci. Technol. 2010, 61, 1386–1409. [Google Scholar] [CrossRef] [Green Version]
  105. Zhang, Y.; Qiu, J.; Chen, S. Application of Artificial Intelligence in International Knowledge Management Research. Sci. Tech. Mana. Res. 2020, 40, 211–216. [Google Scholar]
  106. Bailis, R.; Ezzati, M.; Kammen, D.M. Greenhouse gas implications of household energy technology in Kenya. Environ. Sci. Technol. 2003, 37, 2051–2059. [Google Scholar] [CrossRef] [PubMed] [Green Version]
  107. Liu, Y.; Liu, J.; Su, Y.P. Low-Carbon Awareness and Behaviors: Effects of Exposure to Climate Change Impact Photographs. SAGE Open 2021, 11, 13. [Google Scholar] [CrossRef]
  108. Rogelj, J.; den Elzen, M.; Hohne, N.; Fransen, T.; Fekete, H.; Winkler, H.; Chaeffer, R.S.; Ha, F.; Riahi, K.; Meinshausen, M. Paris Agreement climate proposals need a boost to keep warming well below 2 degrees C. Nature 2016, 534, 631–639. [Google Scholar] [CrossRef] [Green Version]
  109. Dou, X.; Zhuang, G. Review of Research on Policy Assessment and Mechanism of Carbon Emission Trading Scheme. Ecol. Econ. 2022, 38, 45–52. [Google Scholar]
  110. Mi, Z.F.; Zheng, J.L.; Meng, J.; Ou, J.M.; Hubacek, K.; Liu, Z.; Coffman, D.; Stern, N.; Liang, S.; Wei, Y.M. Economic development and converging household carbon footprints in China. Nat. Sustain. 2020, 3, 529–537. [Google Scholar] [CrossRef]
  111. Liu, X.Y.; Wang, X.E.; Song, J.N.; Duan, H.Y.; Wang, S. Why Are the Carbon Footprints of China’s Urban Households Rising? An Input-Output Analysis and Structural Decomposition Analysis. Sustainability 2019, 11, 7157. [Google Scholar] [CrossRef] [Green Version]
  112. Peng, Y.; Yang, L.E.; Scheffran, J. A life-cycle assessment framework for quantifying the carbon footprint of rural households based on survey data. MethodsX 2021, 8, 101411. [Google Scholar] [CrossRef]
  113. Wang, X.R.; Chen, S.Q. Urban-rural carbon footprint disparity across China from essential household expenditure: Survey-based analysis, 2010–2014. J. Environ. Manag. 2020, 267, 11. [Google Scholar] [CrossRef]
  114. Han, J.W.; Tan, Z.X.; Chen, M.Z.; Zhao, L.; Yang, L.; Chen, S.Y. Carbon Footprint Research Based on Input-Output Model-A Global Scientometric Visualization Analysis. Int. J. Environ. Res. Public Health 2022, 19, 11343. [Google Scholar] [CrossRef] [PubMed]
  115. Carley, S.; Porter Alan, L.; Rafols, I.; Leydesdorff, L. Visualization of Disciplinary Profiles: Enhanced Science Overlay Maps. J. Data Inf. Sci. 2017, 2, 68–111. [Google Scholar] [CrossRef] [Green Version]
Figure 1. Flow chart and analysis methods.
Sustainability 15 06138 g001
Figure 2. Annual growth trend of household carbon footprint articles.
Sustainability 15 06138 g002
Figure 3. Household carbon footprint co-citation network.
Sustainability 15 06138 g003
Figure 4. Cluster analysis and timeline.
Sustainability 15 06138 g004
Figure 5. Time zone view.
Sustainability 15 06138 g005
Figure 6. Co-author network analysis.
Sustainability 15 06138 g006
Figure 7. Institution cooperation network.
Sustainability 15 06138 g007
Figure 8. Nation/region cooperation network.
Sustainability 15 06138 g008
Figure 9. Keyword co-word analysis.
Sustainability 15 06138 g009
Figure 10. Journal overlay maps.
Sustainability 15 06138 g010
Table 1. Data collection setup.
Search SetupParameters and Results
DatabaseWeb of Science Core Collection = Science Citation Index Expanded(SCI-EXPANDED)--1999-present + Social Sciences Citation Index(SSCI)--1999-present
Search FormulaTopic = household* and (“carbon footprint*” or ((CO2 or carbon dioxide or GHG or “greenhouse* gas*”)and (emit* or emission* or accounting*)))
Date Range(2000–2022)
Search Time3 October 2022
Document TypesArticle, Review Article, Proceeding Paper
Records3042
Table 2. Data judgement criteria.
StepJudgement CriteriaExample of Screened-Out Articles
Browse article titles, keywords, abstracts1. Whether the main research object is the household carbon footprint?Hu et al. (2019) [52], da Silva et al. (2021) [53], Erdogan (2022) [54], etc.
2. Does it describe the effectiveness of a technique, method, policy, model, etc.?Padgett et al. (2008) [55], Bravo et al. (2013) [56], Akizu-Gardoki et al. (2021) [57], etc.
3. Is the household carbon footprint only used as a knowledge context?Ward et al. (2011) [58], Rao et al. (2016) [59], Grabow et al. (2018) [60], etc.
4. Is it focused on the relationship between household and carbon footprint?Fissore et al. (2011) [61], Li et al. (2009) [62], Ma et al. (2019) [63], etc.
Table 3. List of high-frequency cited articles.
RankCountYearLiterature Cited
1772017Wiedenhofer D, 2017, NAT CLIM CHANGE, V7, P75, DOI 10.1038/NCLIMATE3165 [32]
2492016Ivanova D, 2016, J IND ECOL, V20, P526, DOI 10.1111/jiec.12371 [93]
3382017Ivanova D, 2017, ENVIRON RES LETT, V12, P0, DOI 10.1088/1748-9326/aa6da9 [94]
4352017Zhang YJ, 2017, J CLEAN PROD, V163, P69, DOI 10.1016/j.jclepro.2015.08.044 [91]
5342014Jones C, 2014, ENVIRON SCI TECHNOL, V48, P895, DOI 10.1021/es4034364 [98]
6332015Zhang XL, 2015, J CLEAN PROD, V103, P873, DOI 10.1016/j.jclepro.2015.04.024 [95]
7292016Tian X, 2016, J CLEAN PROD, V114, P401, DOI 10.1016/j.jclepro.2015.05.097 [72]
8282015Yuan BL, 2015, APPL ENERG, V140, P94, DOI 10.1016/j.apenergy.2014.11.047 [96]
9282017Brizga J, 2017, APPL ENERG, V189, P780, DOI 10.1016/j.apenergy.2016.01.102 [99]
10282012Golley J, 2012, ENERG ECON, V34, P1864, DOI 10.1016/j.eneco.2012.07.025 [97]
Table 4. Cited literature clustering information table.
Cluster IDSizeSilhouetteMean (Year)Top Terms (LLR)Parts in Time Stage
#01030.9292013Urban China2
#1940.8292018Carbon emission3
#2800.9562009Indirect greenhouse gas emission2
#3770.9182017Carbon footprint3
#4570.8692013Different urban zone2
#53712001China household sector1
#62612006Comparative performance1
#71512000Household stove1
#81512008Hazard1
#91312005American household carbon footprint1
Table 5. Topic transfer based on Z-score.
PathsJournal Overlay Maps
(Topics: Citing Pattern->Cited Pattern)
Z-ScoreFrequency (f)
1VETERINARY, ANIMAL, SCIENCE->ENVIRONMENTAL, TOXICOLOGY, NUTRITION3.94532544830
2VETERINARY, ANIMAL, SCIENCE->ECONOMICS, ECONOMIC, POLTICAL5.53017666580
3ECONOMICS, ECONOMIC, POLTICAL->ECONOMICS, ECONOMIC, POLTICAL4.44613845383
Disclaimer/Publisher’s Note: The statements, opinions and data contained in all publications are solely those of the individual author(s) and contributor(s) and not of MDPI and/or the editor(s). MDPI and/or the editor(s) disclaim responsibility for any injury to people or property resulting from any ideas, methods, instructions or products referred to in the content.