
Categorizing Chinese Consumers’ Behavior to Identify Factors Related to Sustainable Clothing Consumption


Abstract
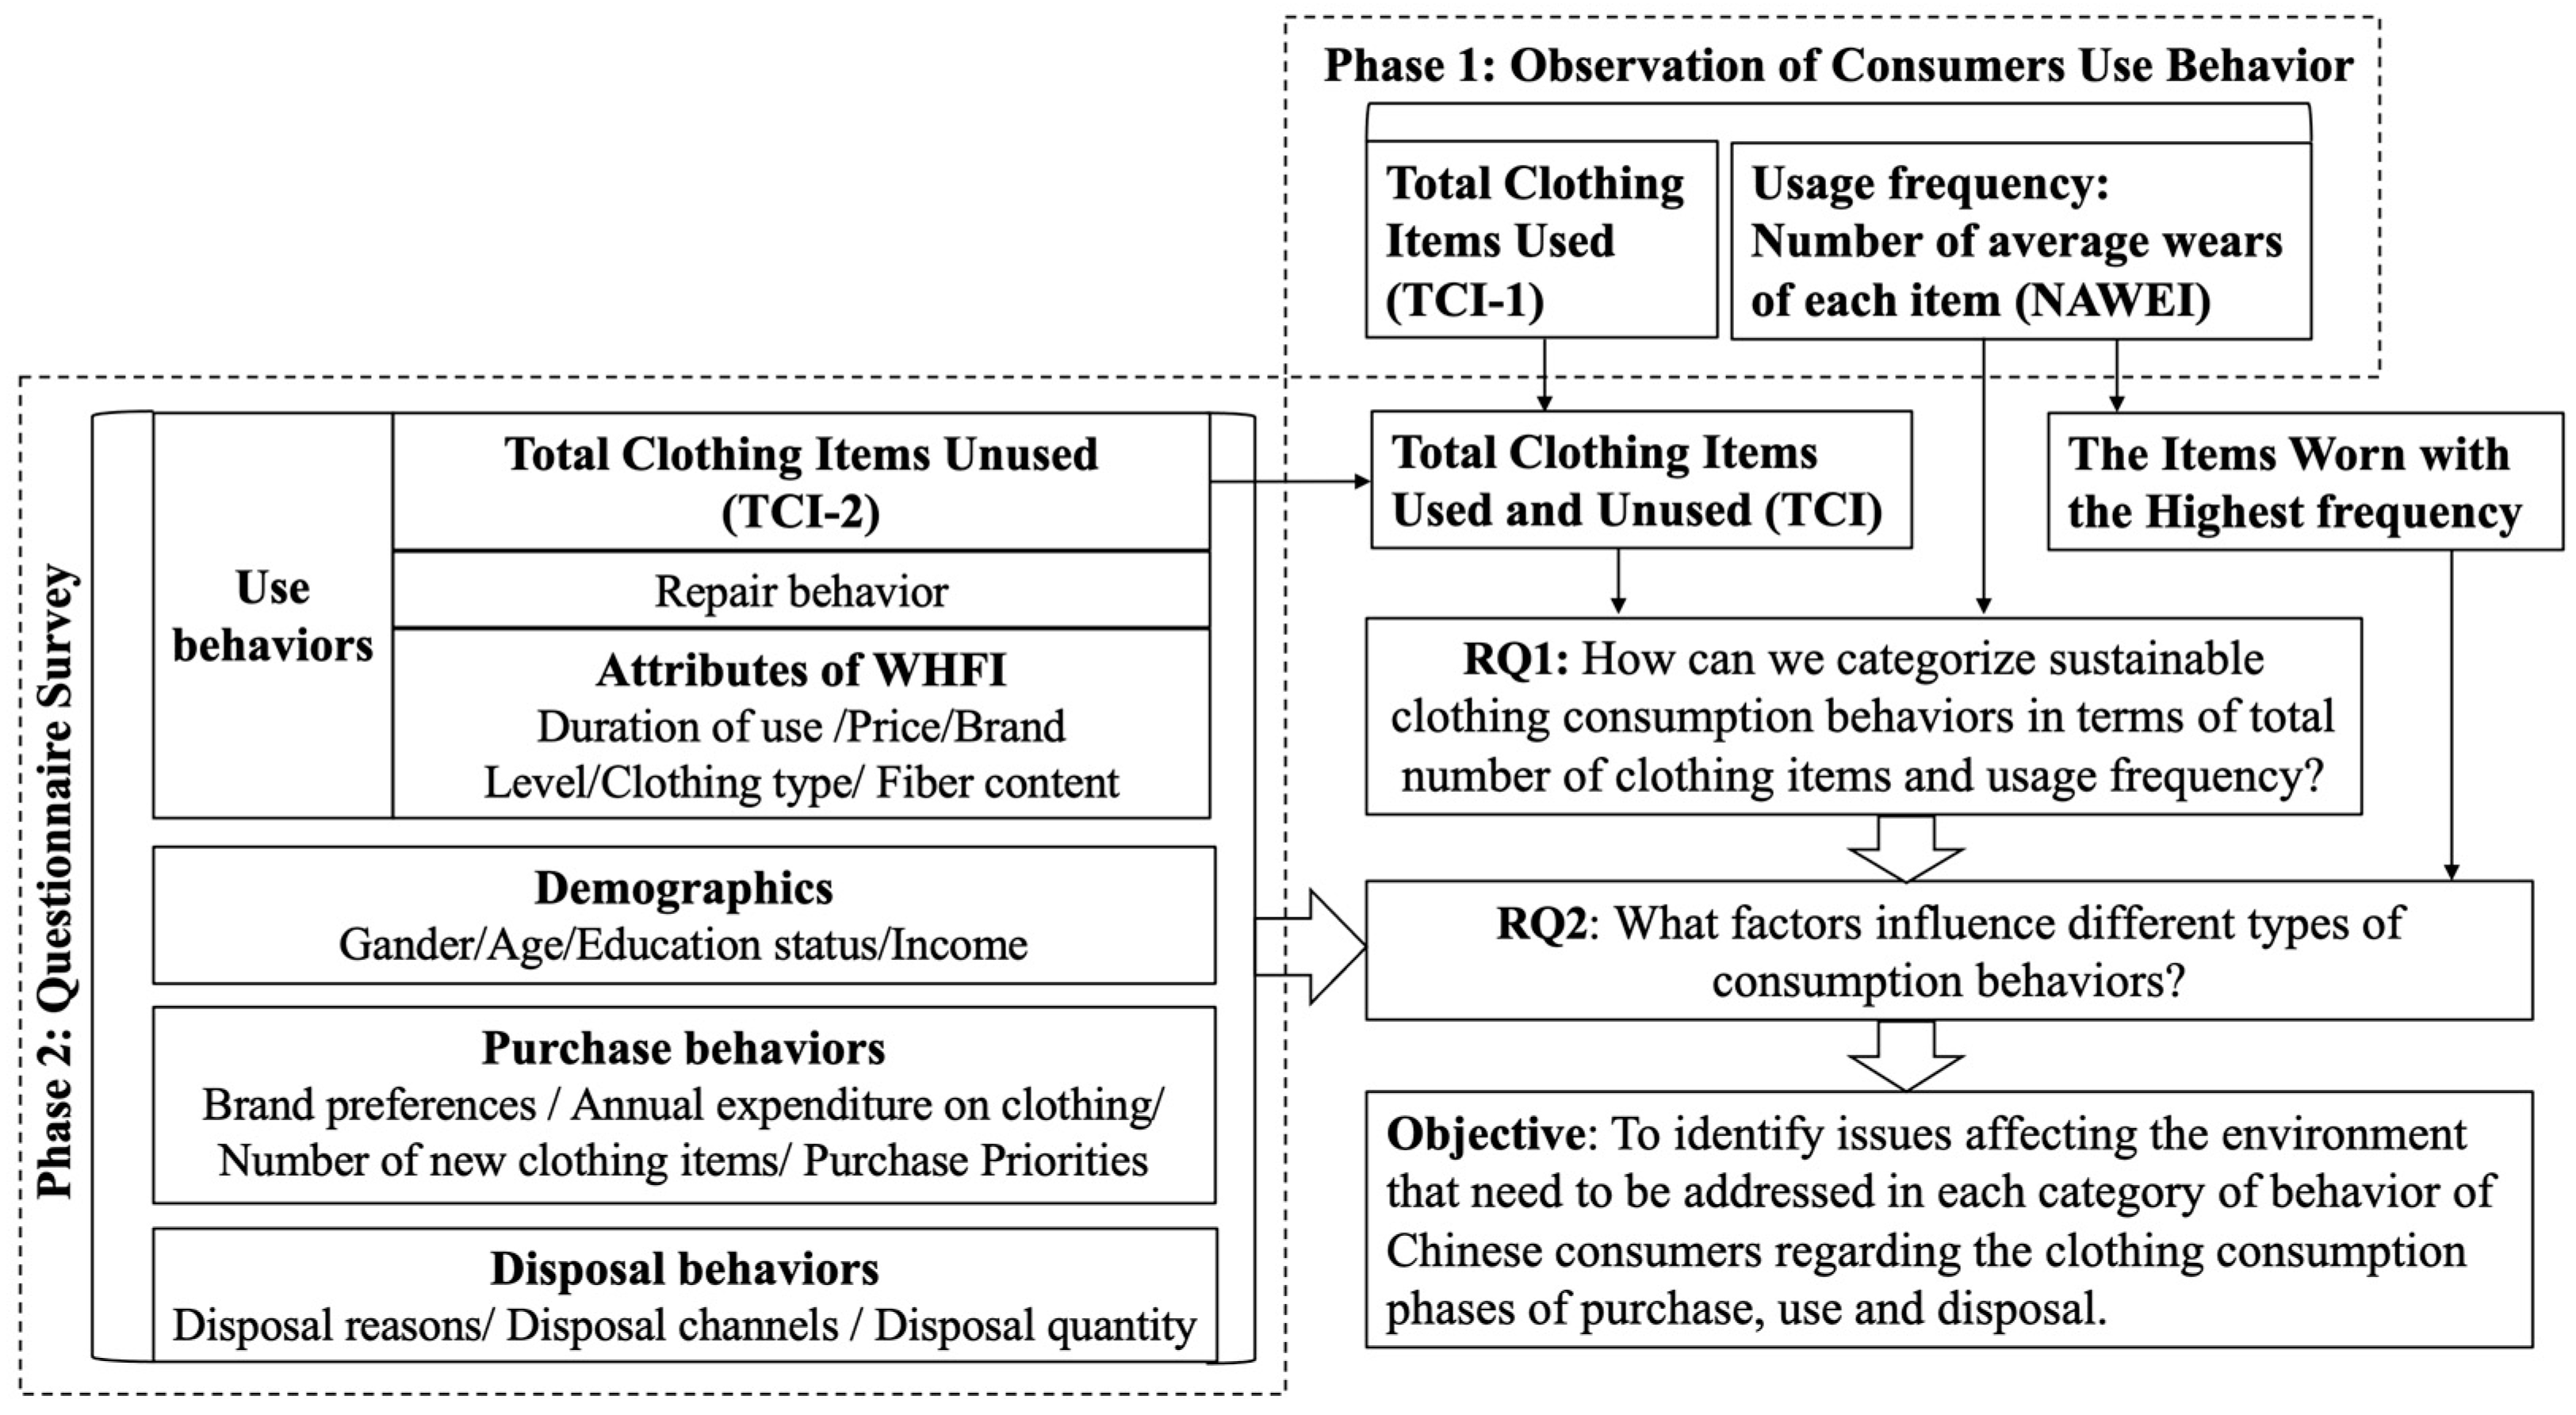
1. Introduction
- (1)
- How can we categorize sustainable clothing consumption behaviors in terms of total number of clothing items and usage frequency?
- (2)
- What factors influence different types of consumption behaviors?
2. Literature Review
2.1. Sustainable Clothing Consumption
2.2. Issues to Be Addressed
2.3. Factors for Sustainable Clothing Consumption
3. Materials and Methods
3.1. Data Collection
3.1.1. Phase 1: Observation
3.1.2. Phase 2: Questionnaire Survey
3.2. Measurement
3.3. Data Analysis
4. Results
4.1. Categorization of Clothing Consumption Behavior of Chinese Consumers
4.2. Factors That Influence Different Types of Consumption Behaviors
4.2.1. Demographics
4.2.2. Purchase Behavior
4.2.3. Disposal Behavior
4.2.4. Use Behavior
5. Discussion
5.1. Categorization of Clothing Consumption Behavior of Chinese Consumers
5.2. Purchase Phase
5.3. Use Phase
5.4. Disposal Phase
6. Conclusions
Author Contributions
Funding
Informed Consent Statement
Data Availability Statement
Acknowledgments
Conflicts of Interest
References
- Gwilt, A. A Practical Guide to Sustainable Fashion; Fairchild Publications: London, UK, 2014; pp. 30–86. [Google Scholar]
- Cooper, T. Inadequate life? Evidence of consumer attitudes to product obsolescence. J. Consum. Policy 2004, 27, 421–449. [Google Scholar] [CrossRef]
- Gwozdz, W.; Nielsen, K.S.; Müller, T. An environmental perspective on clothing consumption: Consumer segments and their behavioral patterns. Sustainability 2017, 9, 762. [Google Scholar] [CrossRef]
- Laitala, K.; Klepp, I.G. What affects garment lifespans? International clothing practices based on a wardrobe survey in China, Germany, Japan, the UK, and the USA. Sustainability 2020, 12, 9151. [Google Scholar] [CrossRef]
- Fletcher, K. Durability, fashion, sustainability: The processes and practices of use. Fash. Pract. 2012, 4, 221–238. [Google Scholar] [CrossRef]
- Fletcher, K. Sustainable Fashion and Textiles: Design Journeys, 2nd ed.; Routledge: London, UK, 2014. [Google Scholar]
- Jung, S.; Jin, B. From quantity to quality: Understanding slow fashion consumers for sustainability and consumer education. Int. J. Consum. Stud. 2016, 40, 410–421. [Google Scholar] [CrossRef]
- Kim, W.B.; Choo, H.J. An action research on creative clothing consumption behavior. J. Korean Soc. Cloth. Text. 2016, 44, 594–609. [Google Scholar] [CrossRef]
- Laitala, K.; Klepp, I.G. Age and Active Life of Clothing. In Proceedings of the Product Lifetimes and The Environment, Nottingham, UK, 17–19 June 2015; pp. 182–186. [Google Scholar]
- Paço, A.; Leal Filho, W.; Ávila, L.V.; Dennis, K. Fostering sustainable consumer behavior regarding clothing: Assessing trends on purchases, recycling and disposal. Text. Res. J. 2021, 91, 373–384. [Google Scholar] [CrossRef]
- De Wagenaar, D.; Galama, J.; Sijtsema, S.J. Exploring worldwide wardrobes to support reuse in consumers’ clothing systems. Sustainability 2022, 14, 1–16. [Google Scholar]
- Henninger, C.E.; Alevizou, P.J.; Oates, C.J. What is sustainable fashion? J. Fash. Mark. Manag. 2016, 20, 400–416. [Google Scholar] [CrossRef]
- Koo, S.; Ma, Y.J. Environmentally responsible apparel consumption and convertible dresses. J. Korean Soc. Cloth. Text. 2019, 43, 327–348. [Google Scholar] [CrossRef]
- Haug, A.; Busch, J. Dealing with Uncertainties in Sustainable Consumer Product Designs. Int. J. Des. Manag. Prof. Pract. 2016, 10, 1–12. [Google Scholar] [CrossRef]
- Joung, H.M.; Park-Poaps, H. Factors motivating and influencing clothing disposal behaviours. Int. J. Consum. Stud. 2013, 37, 105–111. [Google Scholar] [CrossRef]
- Zhang, L.; Hale, J. Extending the lifetime of clothing through repair and repurpose: An investigation of barriers and enablers in UK citizens. Sustainability 2022, 14, 10821. [Google Scholar] [CrossRef]
- Guo, W.; Kim, E. A study of sustainable design methods for clothing recycling from the perspective of reverse thinking. In Proceedings of the 14th International Conference of the European Academy of Design (EAD 2021), Lancaster, UK, 12–15 October 2021; pp. 217–228. [Google Scholar]
- Soyer, M.; Dittrich, K. Sustainable consumer behavior in purchasing, using and disposing of clothes. Sustainability 2021, 13, 8333. [Google Scholar] [CrossRef]
- Ackermann, L. Design for product care: Enhancing consumers’ repair and maintenance activities. Des. J. 2018, 21, 543–551. [Google Scholar] [CrossRef]
- Gray, S. Mapping Clothing Impacts in Europe—The Environmental Cost; ECAP/WRAP: Branbury, UK, 2013. [Google Scholar]
- Gwozdz, W.; Netter, S.; Bjartmarz, T.; Reisch, L.A. Survey Results on Fashion Consumption and Sustainability among Young Swedes; Report Mistra Future Fashion; Mistra Future Fashion: Borås, Sweden, 2013. [Google Scholar]
- Laitala, K.; Klepp, I.G.; Henry, B. Does use matter? Comparison of environmental impacts of clothing based on fiber type. Sustainability 2018, 10, 2524. [Google Scholar] [CrossRef]
- French, S.D.; Green, S.E.; O’Connor, D.A.; McKenzie, J.E.; Francis, J.J.; Michie, S.; Buchbinder, R.; Schattner, P.; Spike, N.; Grimshaw, J.M. Developing Theory-Informed behaviour change interventions to implement evidence into practice: A systematic approach using the theoretical domains framework. Implement. Sci. 2012, 7, 1–8. [Google Scholar] [CrossRef]
- Ministry of Environment Norway. Report of the Sustainable Consumption Symposium; Ministry of the Environment Norway: Oslo, Norway, 1994. [Google Scholar]
- Rhee, J.; Johnson, K.K.P. ‘The wardrobe diet’: Teaching sustainable consumption through experience with undergraduates in the USA. Int. J. Fash. Des. Technol. Educ. 2019, 12, 283–292. [Google Scholar] [CrossRef]
- Maldini, I.; Stappers, P.J.; Gimeno-Martinez, J.C.; Daanen, H.A.M. Assessing the impact of design strategies on clothing lifetimes, usage and volumes: The case of product personalisation. J. Clean. Prod. 2019, 210, 1414–1424. [Google Scholar] [CrossRef]
- Blum, P. Circular Fashion Making the Fashion Industry Sustainable; Laurence King: London, UK, 2021; pp. 130–141. [Google Scholar]
- Klepp, I.G.; Laitala, K.; Wiedemann, S. Clothing lifespans: What should be measured and how. Sustainability 2020, 12, 6219. [Google Scholar] [CrossRef]
- Michie, S.; van Stralen, M.M.; West, R. The behaviour change wheel: A new method for characterising and designing behaviour change interventions. Implement Sci. 2011, 6, 1–12. [Google Scholar] [CrossRef] [PubMed]
- Michie, S.; Atkins, L.; West, R. The Behaviour Change Wheel: A Guide to Designing Interventions; Silverback Publishing: London, UK, 2014; pp. 31–86. [Google Scholar]
- Kolodko, J.; Schmidtke, K.A.; Read, D.; Vlaev, I. #LetsUnlitterUK: A demonstration and evaluation of the behavior change wheel methodology. PLoS ONE 2021, 16, 1–20. [Google Scholar]
- Loft, M.I.; Martinsen, B.; Esbensen, B.A.; Mathiesen, L.L.; Iversen, H.K.; Poulsen, I. Strengthening the role and functions of nursing staff in inpatient stroke rehabilitation: Developing a complex intervention using the behaviour change wheel. Int. J. Qual. Stud. Health Well-Being 2017, 12, 1392218. [Google Scholar] [CrossRef]
- Langley, E.; Durkacz, S.; Tanase, S. Clothing Longevity and Measuring Active Use; Wrap: Banbury, UK, 2013. [Google Scholar]
- Kidwell, C.B.; Steele, V. Men and Women: Dressing the Part; Smithsonian Insititution Press: Washington, DC, USA, 1989. [Google Scholar]
- Rahman, O.; Fung, B.C.M.; Chen, Z. Young Chinese consumers’ choice between product-related and sustainable cues-the effects of gender differences and consumer innovativeness. Sustainability 2020, 12, 3818. [Google Scholar] [CrossRef]
- Lang, C.; Armstrong, C.M.; Brannon, L.A. Drivers of clothing disposal in the US: An exploration of the role of personal attributes and behaviours in frequent disposal. Int. J. Consum. Stud. 2013, 37, 706–714. [Google Scholar] [CrossRef]
- Zhang, L.; Wu, T.; Liu, S.; Jiang, S.; Wu, H.; Yang, J. Consumers’ clothing disposal behaviors in Nanjing, China. J. Clean Prod. 2020, 276, 123184. [Google Scholar] [CrossRef]
- Laitala, K.; Klepp, I.G.; Henry, B. Use Phase of Apparel: A Literature Review for Life Cycle Assessment with Focus on Wool; SIFO: Oslo, Norway, 2017; p. 162. [Google Scholar]
- Degenstein, L.M.; McQueen, R.H.; McNeill, L.S.; Hamlin, R.P.; Wakes, S.J.; Dunn, L.A. Impact of physical condition on disposal and end-of-Life extension of clothing. Int. J. Consum. Stud. 2020, 44, 586–596. [Google Scholar] [CrossRef]
- Perez, D.F.; Nie, J.X.; Ardern, C.I.; Radhu, N.; Ritvo, P. Impact of participant incentives and direct and snowball sampling on survey response rate in an ethnically diverse community: Results from a pilot study of physical activity and the built environment. J. Immigr. Minor Health 2013, 15, 207–214. [Google Scholar] [CrossRef]
- Saunders, M.; Lewis, P.; Thornhill, A. Research Methods for Business Students, 6th ed.; Pearson Education Limited: London, UK, 2012. [Google Scholar]
- Gwilt, A. Caring for clothes: How and why people maintain garments in regular use. Continuum 2021, 35, 870–882. [Google Scholar] [CrossRef]
- Gupta, S.; Gentry, J.W. Construction of gender roles in perceived scarce environments–Maintaining masculinity when shopping for fast fashion apparel. J. Consum. Behav. 2016, 15, 251–260. [Google Scholar] [CrossRef]
- Young Lee, j.; Halter, H.; Johnson, K.K.P.; Ju, H. Investigating fashion disposition with young consumers. Young Consum. 2013, 14, 67–78. [Google Scholar] [CrossRef]
- Armstrong, C.M.; Niinimäki, K.; Kujala, S.; Karell, E.; Lang, C. Sustainable product-service systems for clothing: Exploring consumer perceptions of consumption alternatives in Finland. J. Clean. Prod. 2015, 97, 30–39. [Google Scholar] [CrossRef]
- Laitala, K.; Klepp, I.G. Care and production of clothing in Norwegian homes: Environmental implications of mending and making practices. Sustainability 2018, 10, 2899. [Google Scholar] [CrossRef]
- Gwilt, A. What prevents people repairing clothes? An investigation into community-based approaches to sustainable product service systems for clothing repair. Mak. Futures J. 2014, 3, 332–337. [Google Scholar]
- Muthu, S.S. Sustainability in Denim; Woodhead Publishing: Cambridge, UK, 2017; pp. 27–48. [Google Scholar]
- Degenstein, L.M.; McQueen, R.H.; Krogman, N.T. ‘What goes where’? Characterizing Edmonton’s municipal clothing waste stream and consumer clothing disposal. J. Clean. Prod. 2021, 296, 126516. [Google Scholar] [CrossRef]
- Laitala, K. Consumers’ clothing disposal behaviour–A synthesis of research results. Int. J. Consum. Stud. 2014, 38, 444–457. [Google Scholar] [CrossRef]


| Count | Percent | ||
|---|---|---|---|
| Number of participants | N | 60 | 100% |
| Gender distribution | Men | 20 | 33% |
| Women | 40 | 67% | |
| Age group | 18–27 years | 10 | 17% |
| 28–37 years | 14 | 23% | |
| 38–47 years | 20 | 33% | |
| 48–57 years | 7 | 12% | |
| 58 years and over | 9 | 15% | |
| Education status | College and below | 16 | 27% |
| Undergraduate | 25 | 42% | |
| Master and above | 19 | 31% | |
| Income level | Low level | 14 | 23% |
| Medium level | 35 | 58% | |
| High level | 11 | 19% |
| Phase | Variables | Answer Categories |
|---|---|---|
| Purchase Behavior | 1. Brand preferences category | Budget brands, casual/middle brands, premium brands. |
| 2. Annual clothing expenditure (RMB) | 2000 and below, 2001–5000, 5001–10,000, 10,001–20,000, 20,001 and above. | |
| 3. Number of new items | 5 items or fewer, 6–20 items, 21–40 items, 41 items or more. | |
| 4. Purchase priorities | Fashionable/trendy, price, fabric quality, aesthetics (e.g., design or style), sustainable/environmentally production and brand. | |
| Disposal Behavior | 5. Disposal reasons | Wear and tear, fashion issues, poor fit, wardrobe space, others. |
| 6. Disposal channels | Conventional reuse and recycle channels, OCRP, throw away. | |
| 7. Disposal quantity this year | Fewer than 10 items, 11–20 items, 21–30 items, 31 items or more. | |
| Use Behavior with Garment Attributes of HFWI | 8. Repair experience | Has repair clothing experience last 12 months (0 = no, 1 = yes). |
| 9. TCI-2 | Varied from 4 to 62. | |
| 10. Duration of use | Less than 1 year, 1–2 years, 2–3 years, more than 3 years. | |
| 11. Price (RMB) | 200 and below, 201–500, 501–1000, 1001–2000, 2001 and above. | |
| 12. Brand Level | Budget brands (e.g., H&M or Uniqlo); Casual/middle brands (e.g., Levi’s, MLB, or FILA); Premium brands (e.g., Louis Vuitton, Prada, or Moschino). | |
| 13. Garment type | Top: T-shirts/polos/singlets, shirts/blouses, blazers/hoodies, others; outerwear: jackets, suits, overcoats, parkas, others; bottoms: jeans, sports/knitted trousers, formal trousers, skirt, others. | |
| 14. Fiber content | Cotton and cotton blends, wool and wool blends, synthetics, others. |
| Items | Answer Categories | Categorization | Value | Sig. (2-Sided) | ||||||
|---|---|---|---|---|---|---|---|---|---|---|
| Small–Active | Small–Passive | Large–Passive | ||||||||
| N | % | N | % | N | % | |||||
| Gender | Female | 6 a | 28.6% | 10 a | 66.7% | 24 b | 100.00% | 25.714 | <0.001 ***a | |
| Male | 15 a | 71.4% | 5 a | 33.3% | 0 b | 0.00% | ||||
| Age | 18–27 years | 2 a | 9.5% | 7 b | 46.7% | 1 a | 4.2% | -- | 0.012 *b | |
| 28–37 years | 4 a | 19.0% | 3 a | 20.0% | 7 a | 29.2% | ||||
| 38–47 years | 5 a | 23.8% | 4 a | 26.7% | 11 a | 45.8% | ||||
| 48–57 years | 3 a | 14.3% | 1 a | 6.7% | 3 a | 12.5% | ||||
| 58 years or over | 7 a | 33.4% | 0 b | 0.00% | 2 a,b | 8.3% | ||||
| Brand preference: budget brand | No | 6 a,b | 28.6% | 1 b | 6.7% | 14 a | 58.37% | 11.418 | 0.003 **a | |
| Yes | 15 a,b | 71.4% | 14 b | 93.3% | 10 a | 41.7% | ||||
| Brand preference: casual/middle brand | No | 12 a | 57.1% | 7 a,b | 46.7% | 4 b | 16.7% | 8.350 | 0.015 *a | |
| Yes | 9 a | 42.9% | 8 a,b | 53.3% | 20 b | 83.3% | ||||
| Annual expenditure on clothing (RMB) | 2000 or below | 8 a | 38.1%% | 0 b | 0.00% | 0 b | 0.00% | -- | <0.001 b | |
| 2001–5000 | 8 a | 38.1% | 3 a | 20.0% | 3 a | 12.5% | ||||
| 5001–10,000 | 3 a | 14.3% | 3 a | 20.0% | 5 a | 20.8% | ||||
| 10,001–20,000 | 1 a | 4.8% | 9 b | 60.0% | 6 b | 25.0% | ||||
| 20,001 or above | 1 a | 4.8% | 0 a | 0.00% | 10 b | 41.7% | ||||
| Number of new clothing items this year | 5 items or fewer | 13 a | 61.9% | 2 b | 13.3% | 1 b | 4.2% | -- | <0.001 b | |
| 6–20 items | 8 a,b | 38.1% | 9 a | 60.0% | 5 b | 20.8% | ||||
| 21–40 items | 0 a | 0.00% | 4 b | 26.7% | 12 b | 50.0% | ||||
| 41 items or more | 0 a | 0.00% | 0 a | 0.00% | 6 b | 25.0% | ||||
| Purchase priorities: fashionable/trendy | No | 17 a | 81.0% | 4 b | 26.7% | 16 a | 66.7% | 11.331 | 0.003 **a | |
| Yes | 4 a | 19.0% | 11 b | 73.3% | 8 a | 33.3% | ||||
| Disposal reasons: psychological | No | 16 a | 76.2% | 4 b | 26.7% | 3 b | 12.5% | 20.371 | <0.001 ***a | |
| Yes | 5 a | 23.8% | 11 b | 73.3% | 21 b | 87.5% | ||||
| Disposal channel: conventional | No | 13 a | 61.9% | 4 a,b | 26.7% | 3 b | 12.5% | 12.702 | 0.002 **a | |
| Yes | 8 a | 38.1% | 11 a,b | 73.3% | 21 b | 87.5% | ||||
| Disposal channel: throw away | No | 8 a | 38.1% | 7 a,b | 46.7% | 18 b | 75.0% | 6.724 | 0.035 *a | |
| Yes | 13 a | 61.9% | 8 a,b | 53.3% | 6 b | 25.0% | ||||
| Disposal quantity | 10 items or fewer | 14 a | 66.7% | 6 a,b | 40.0% | 6 b | 25.0% | -- | 0.01 b | |
| 11–20 items | 6 a | 28.6% | 6 a | 40.0% | 5 a | 20.8% | ||||
| 21–30 items | 1 a | 4.8% | 2 a | 13.3% | 6 a | 25.0% | ||||
| 31 items or more | 0 a | 0.00% | 1 a,b | 6.7% | 7 b | 29.2% | ||||
| Repair experience this year | No | 4 a | 19.0% | 10 b | 66.7% | 11 a,b | 45.8% | 8.449 | 0.015 *a | |
| Yes | 17 a | 81.0% | 5 b | 33.3% | 13 a,b | 54.2% | ||||
| Attributes of WHFI (tops): duration of use | Less than 1 year | 2 a | 9.5% | 9 b | 60.0% | 8 a,b | 33.3% | -- | 0.021 *b | |
| 1–3 years | 13 a | 61.9% | 4 a | 26.7% | 13 a | 54.2% | ||||
| More than 3 years | 6 a | 28.6% | 2 a | 13.3% | 3 a | 12.5% | ||||
| Attributes of WHFI (bottoms): duration of use | Less than 1 year | 4 a | 19.0% | 8 a | 53.3% | 7 a | 29.2% | -- | 0.034 *b | |
| 1–3 years | 6 a | 28.6% | 4 a | 26.7% | 13 a | 54.2% | ||||
| More than 3 years | 11 a | 52.4% | 3 a,b | 20.0% | 4 b | 16.7% | ||||
| Attributes of WHFI (bottoms): price (RMB) | 200 and below | 8 a | 38.1% | 5 a | 33.3% | 1 b | 4.1% | -- | 0.04 *b | |
| 201–500 | 10 a | 47.6% | 6 a | 40.0% | 18 a | 75.0% | ||||
| 501–1000 | 1 a | 4.8% | 3 a | 20.0% | 3 a | 12.5% | ||||
| 1001–2000 | 1 a | 4.8% | 0 a | 0.00% | 0 a | 0.00% | ||||
| 2001 and above | 1 a | 4.8% | 1 a | 6.7% | 2 a | 8.3% | ||||
| Attributes of WHFI (bottoms): clothing type | Jeans | 4 a | 19.0% | 6 a,b | 40.0% | 15 b | 62.5% | -- | 0.008 **b | |
| Sports/knitted trousers | 11 a | 52.3% | 6 a,b | 40.0% | 3 b | 12.5% | ||||
| Skirt | 0 a | 0.00% | 0 a | 0.00% | 3 a | 12.5% | ||||
| Other trousers | 6 a | 28.6% | 3 a | 20.0% | 3 a | 12.5% | ||||
| Categories | N | TCI-2 Mean ± SD | p |
|---|---|---|---|
| Small–active | 21 | 20.24 ± 10.27 | <0.001 |
| Small–passive | 15 | 12.53 ± 4.44 | |
| Large–passive | 24 | 35.71 ± 15.71 *# |
Disclaimer/Publisher’s Note: The statements, opinions and data contained in all publications are solely those of the individual author(s) and contributor(s) and not of MDPI and/or the editor(s). MDPI and/or the editor(s) disclaim responsibility for any injury to people or property resulting from any ideas, methods, instructions or products referred to in the content. |
© 2023 by the authors. Licensee MDPI, Basel, Switzerland. This article is an open access article distributed under the terms and conditions of the Creative Commons Attribution (CC BY) license (https://creativecommons.org/licenses/by/4.0/).
Share and Cite
Guo, W.; Kim, E. Categorizing Chinese Consumers’ Behavior to Identify Factors Related to Sustainable Clothing Consumption. Sustainability 2023, 15, 6126. https://doi.org/10.3390/su15076126
Guo W, Kim E. Categorizing Chinese Consumers’ Behavior to Identify Factors Related to Sustainable Clothing Consumption. Sustainability. 2023; 15(7):6126. https://doi.org/10.3390/su15076126
Chicago/Turabian StyleGuo, Wenjun, and Eunyoung Kim. 2023. "Categorizing Chinese Consumers’ Behavior to Identify Factors Related to Sustainable Clothing Consumption" Sustainability 15, no. 7: 6126. https://doi.org/10.3390/su15076126
APA StyleGuo, W., & Kim, E. (2023). Categorizing Chinese Consumers’ Behavior to Identify Factors Related to Sustainable Clothing Consumption. Sustainability, 15(7), 6126. https://doi.org/10.3390/su15076126