1. Introduction
A supply chain is a customer-oriented organizational form that aims to improve quality and efficiency by integrating resources for efficient collaboration in product design, procurement, production, sales, and service. In recent years, with the increasingly severe global climate problem, the construction of a green supply chain (GSC) has received increased attention. Based on the traditional supply chain, the GSC integrates concepts of sustainable development such as green manufacturing, product life-cycle management, and producer responsibility for enterprise value-chain activities. The GSC comprehensively considers the economic, social, and ecological benefits of enterprises through the entire supply chain process from raw material acquisition, processing, packaging, storage, transportation, use and recycling, and green sustainable development [
1,
2]. The GSC has the characteristics of integrity, purpose, hierarchy, environmental adaptability, and complexity [
3].
Performance evaluation of the GSC is important for its construction and management. Since the GSC is based on the concept of the whole life cycle, its performance evaluation pertains to all aspects of planning, procurement, production, logistics, marketing, and recycling [
1]. The GSC management process is more complex than that in traditional supply chains because the GSC involves longer evaluation cycles with diverse evaluation attributes. As such, evaluating its performance is challenging.
The traditional methods used for evaluating supply chain performance include the supply chain operation reference (SCOR) model and the balanced scorecard (BSC) model. The SCOR model is an effective tool for diagnosing the performance of a GSC [
4]. The model is vertically divided into four levels (the process level, configuration level, practice level, and implementation level) and horizontally divided into five links (planning, procurement, production, distribution, and return management) [
5]. The SCOR model is usually process-oriented, and the efficiency of the process is considered the key to the efficiency of the enterprise, which conforms to the GSC business framework. However, the model does not analyze the overall supply chain participants, and it does not take into account the indicators of all links of the supply chain [
6]. The BSC model can explain the relationship between strategy and process through four dimensions: finance, customers, internal processes, learning, and growth [
7]. The model comprehensively measures the balance between financial and non-financial, long-term and short-term, cause and result, internal and external, and qualitative and quantitative indicators [
8]. It provides a comprehensive framework for measuring performance. However, the BSC model is guided by the overall strategy and focuses on the comprehensive development of enterprises. There are defects in process-oriented organizational performance evaluations of supply chains [
9].
Thus, whereas the BSC model provides a basic framework for GSC performance evaluations from a macro-perspective, the SCOR model provides clear business divisions for the GSC. The combination of the two models can thus make the construction of an evaluation index system more comprehensive and scientific [
10]. To construct such a GSC performance evaluation index system, we introduce a combined BSC-SCOR model that merges the evaluation dimension with the operation process. On the one hand, according to the core idea of the BSC model, we introduce a multi-dimensional index, and on the other hand, business processes are divided and decomposed according to the SCOR model [
11].
Having constructed the evaluation index system, we identify the key indicators of performance evaluation of a GSC. The interaction between these indicators plays a vital role in improving performance. The identification of key indicators of a GSC performance evaluation is a typical multi-criteria decision-making (MCDM) problem. For this kind of problem, commonly used methods include the analytic hierarchy process (AHP) method, the entropy weight method, the analytic network process (ANP) method, and the decision-making trial and evaluation laboratory (DEMATEL), among others. However, the AHP and entropy weight method are only applicable when the indicators are independent of each other, without considering the interaction between them. In reality, there are interactions between different types of performance evaluation indicators. In the ANP model, each indicator has a network structure that affects other ones, and this method offers a consistency check and complex modeling for comparing indicators [
12,
13]. The DEMATEL method calculates the causality and prominence of each indicator to determine the key indicators. It then builds a causal relationship diagram of the indicators to reflect the interaction of each indicator. The total influence matrix and causality diagram obtained by the DEMATEL provide basic data for ANP, thus avoiding the consistency test and complex modeling problems that arise from only using the ANP. In our study, to capture the ambiguity and uncertainty of various indicators, we combine the fuzzy DEMATEL method with the ANP method to form the fuzzy DEMATEL-based ANP model to identify the key performance evaluation indicators for a GSC [
14,
15].
In our study, we explore the answers to the following research questions: What dimensions and indicators should be considered in the performance evaluation of GSC? Which are the critical indicators and how do they affect each other? Furthermore, which are the critical driving factors that affect the GSC’s performance most? Answering these questions has certain theoretical and practical implications. Theoretically, we sort out the performance evaluation indicators of a GSC systematically and comprehensively by combining the BSC and SCOR models. Furthermore, we analyze the interaction between any two indicators and identify the critical driving indicators with the adoption of the fuzzy DEMATEL-based ANP model. Practically, as shown in the case study, the findings are conducive to scientific evaluation and effective improvement of a GSC’s performance.
The rest of this paper is arranged as follows:
Section 2 reviews and summarizes previous research results on GSC performance evaluation. In
Section 3, we introduce the Delphi method and the fuzzy DEMATEL-based ANP model used in the study.
Section 4 presents our empirical research, which selects and analyzes the key performance evaluation indicators of a GSC.
Section 5 discusses relevant countermeasures and offers suggestions for performance evaluation of GSC based on the empirical research results.
Section 6 concludes.
2. Literature Review
A GSC is essentially an endorsement by green suppliers that the green attributes of supply chain management processes have been satisfied. They are an important means of optimizing the market environment, establishing a trust mechanism, and developing international green trade. Evaluations of GSC performance are a powerful guarantee for ensuring the greenness and effectiveness of the whole supply chain operation process. The GSC is a hot topic in the field of supply chain research. As the world continues to advocate for environmental awareness, the issue of evaluating GSC performance is also being studied and expanded upon by scholars.
On the selection of GSC performance evaluation indicators, scholars have conducted in-depth research from different perspectives. One focus is the supply chain business process, which includes all aspects of the supply chain operation process. Business process performance evaluation indicators are extracted according to the construction principles of the supply chain process performance evaluation indicator system. Liao analyzed the links at all levels of the resource input level, operation level, product (service) output level, and feedback level, and then screened out specific evaluation indicators [
16]. Feng and Li constructed corresponding indicators from three aspects: the result level, operation level, and support level. They used the entropy method and AHP method to determine the weight of indicators for evaluating performance [
17]. Jin selected 21 indicators from four dimensions related to the supply chain process to conduct research on evaluating the GSC performance of automobile enterprises in the carbon peak and carbon neutral backgrounds [
18]. Osintsev et al. conducted a detailed study on the performance evaluation of GSC logistics processes based on a combined DEMATEL-ANP method to achieve the goal of sustainable development [
19]. Effendi et al. and Divsalar et al. used the SCOR model to evaluate the performance of GSCs [
20,
21].
Another focus of research is capital operations and the financial management requirements of supply chain enterprises. Hou and Wang respectively analyzed the financial performance of A-share listed logistics supply chains and forestry logistics enterprises and built an enterprise financial performance evaluation index system based on four dimensions: enterprise profitability, debt paying ability, operating ability, and development ability [
22,
23]. Based on the concept of green development, Liu et al. added indicators that reflected low-carbon capacity to the four traditional dimensions of enterprise financial evaluation systems. They focused on measuring the efficiency of energy consumption, pollutant emissions, and post-production waste recycling [
24]. Based on the concept of green development, Yu and Li built a comprehensive financial analysis index system that includes five dimensions: solvency, operating ability, profitability, development ability, and environmental protection and governance ability [
25].
From the perspective of ecological civilization, some scholars argue that the impact of the whole life cycle of products on the environment should be considered in addition to economic and social benefits. Chang et al. started from the external value chain of enterprises, and comprehensively analyzed the impact of the upstream suppliers and downstream vendors (customers) outside the enterprise. Based on this, they built a set of performance evaluation indicators to comprehensively manage the environmental performance of enterprises [
26]. Wang et al. extracted 20 environmental performance evaluation indicators from six perspectives: ecological design, cleaner production, resource and energy utilization, waste recycling, environmental impact, and financial performance related to environmental activities [
27]. Yu et al. analyzed the environmental performance of automobile enterprises from both internal and external aspects [
28]. Zhou et al. evaluated green indicators such as green design, green procurement, and the green production of enterprises based on the Delphi and fuzzy AHP methods [
29]. Huang et al. used AHP and three-stage DEA methods to conduct comprehensive performance evaluation research on China’s energy supply chain in the context of double carbon goals [
30]. Wicher et al. used multi-criteria decision-making to evaluate the sustainability performance of industrial enterprises [
31].
There has also been extensive research done on various supply chain performance evaluation indicators, and on refining performance evaluation indicator systems. Some of this research pertains to the selection of critical performance evaluation indicators. In research on performance evaluation indicator segmentation, Wan, Xiao, and Gu considered the perspective of corporate stakeholders and added sustainable development indicators on the basis of the four dimensions: the financial situation, customer service, operation process, and innovative learning. Their green development indicators were subdivided into five categories: environmental governance investment, the environmental protection investment ratio, the environmental protection material utilization rate, the resource utilization rate, and the resource recovery rate. Based on these indicators, they established a GSC performance evaluation index system [
32,
33,
34]. Du studied the performance evaluation of GSC from four dimensions—finance, customers, processes, and sustainable development—and subdivided each aspect (e.g., dividing sustainable development into new product development capability, technology investment, and the community environmental protection level) [
35]. Wang and Lu, Bai et al. and Huang et al. considered the target benefits of GSC combined with the actual operations of GSC. They built a performance evaluation index system based on three aspects—economic benefits, social benefits, and environmental benefits—and on this basis, subdivided these into a secondary evaluation index system for comprehensive evaluations [
36,
37,
38]. Wang and Yang studied the characteristics of green agricultural product transportation and built a green agricultural product supply chain performance evaluation index system with six dimensions: financial status, customer service, business processes, the logistics technology level, innovative learning, and green environmental protection. In order to meet the requirements for agricultural product transportation, the logistics technology level was subdivided into four aspects: delivery timeliness, loss rate, service flexibility, and order completion rate [
39].
In terms of selecting critical performance evaluation indicators, Zhang et al. used the fuzzy technique for order preference by similarity to an ideal solution (TOPSIS) method to evaluate the performance of the GSC [
40]. Jiao used the multi-objective evaluation analysis method to construct an indicator system and used the fuzzy comprehensive evaluation method to evaluate the environmental management performance of GSC [
41]. Cao and Fan studied the performance evaluation of green agricultural product supply chains based on DEA and principal component analysis [
42]. Ma et al., constructed a GSC performance evaluation index system from the aspects of process, customer service, finance, environmental protection, information, and knowledge, and proposed a method to identify the critical performance evaluation indicators of GSC based on the DEMATEL method [
43]. Dai and Ye adopted a low-carbon perspective and analyzed and evaluated the key indicators of GSC optimization and supervision from five dimensions regarding property value and internal supply chain processes [
44]. Nozari et al., conducted quantitative analysis on critical performance evaluation indicators of GSC in the fast-moving consumer goods industry based on a nonlinear fuzzy method [
45]. Chang et al., used the mixed MCDM model to analyze the supply chain performance indicators of Indian mining and earth-moving equipment manufacturing companies through the DEMATEL method [
46].
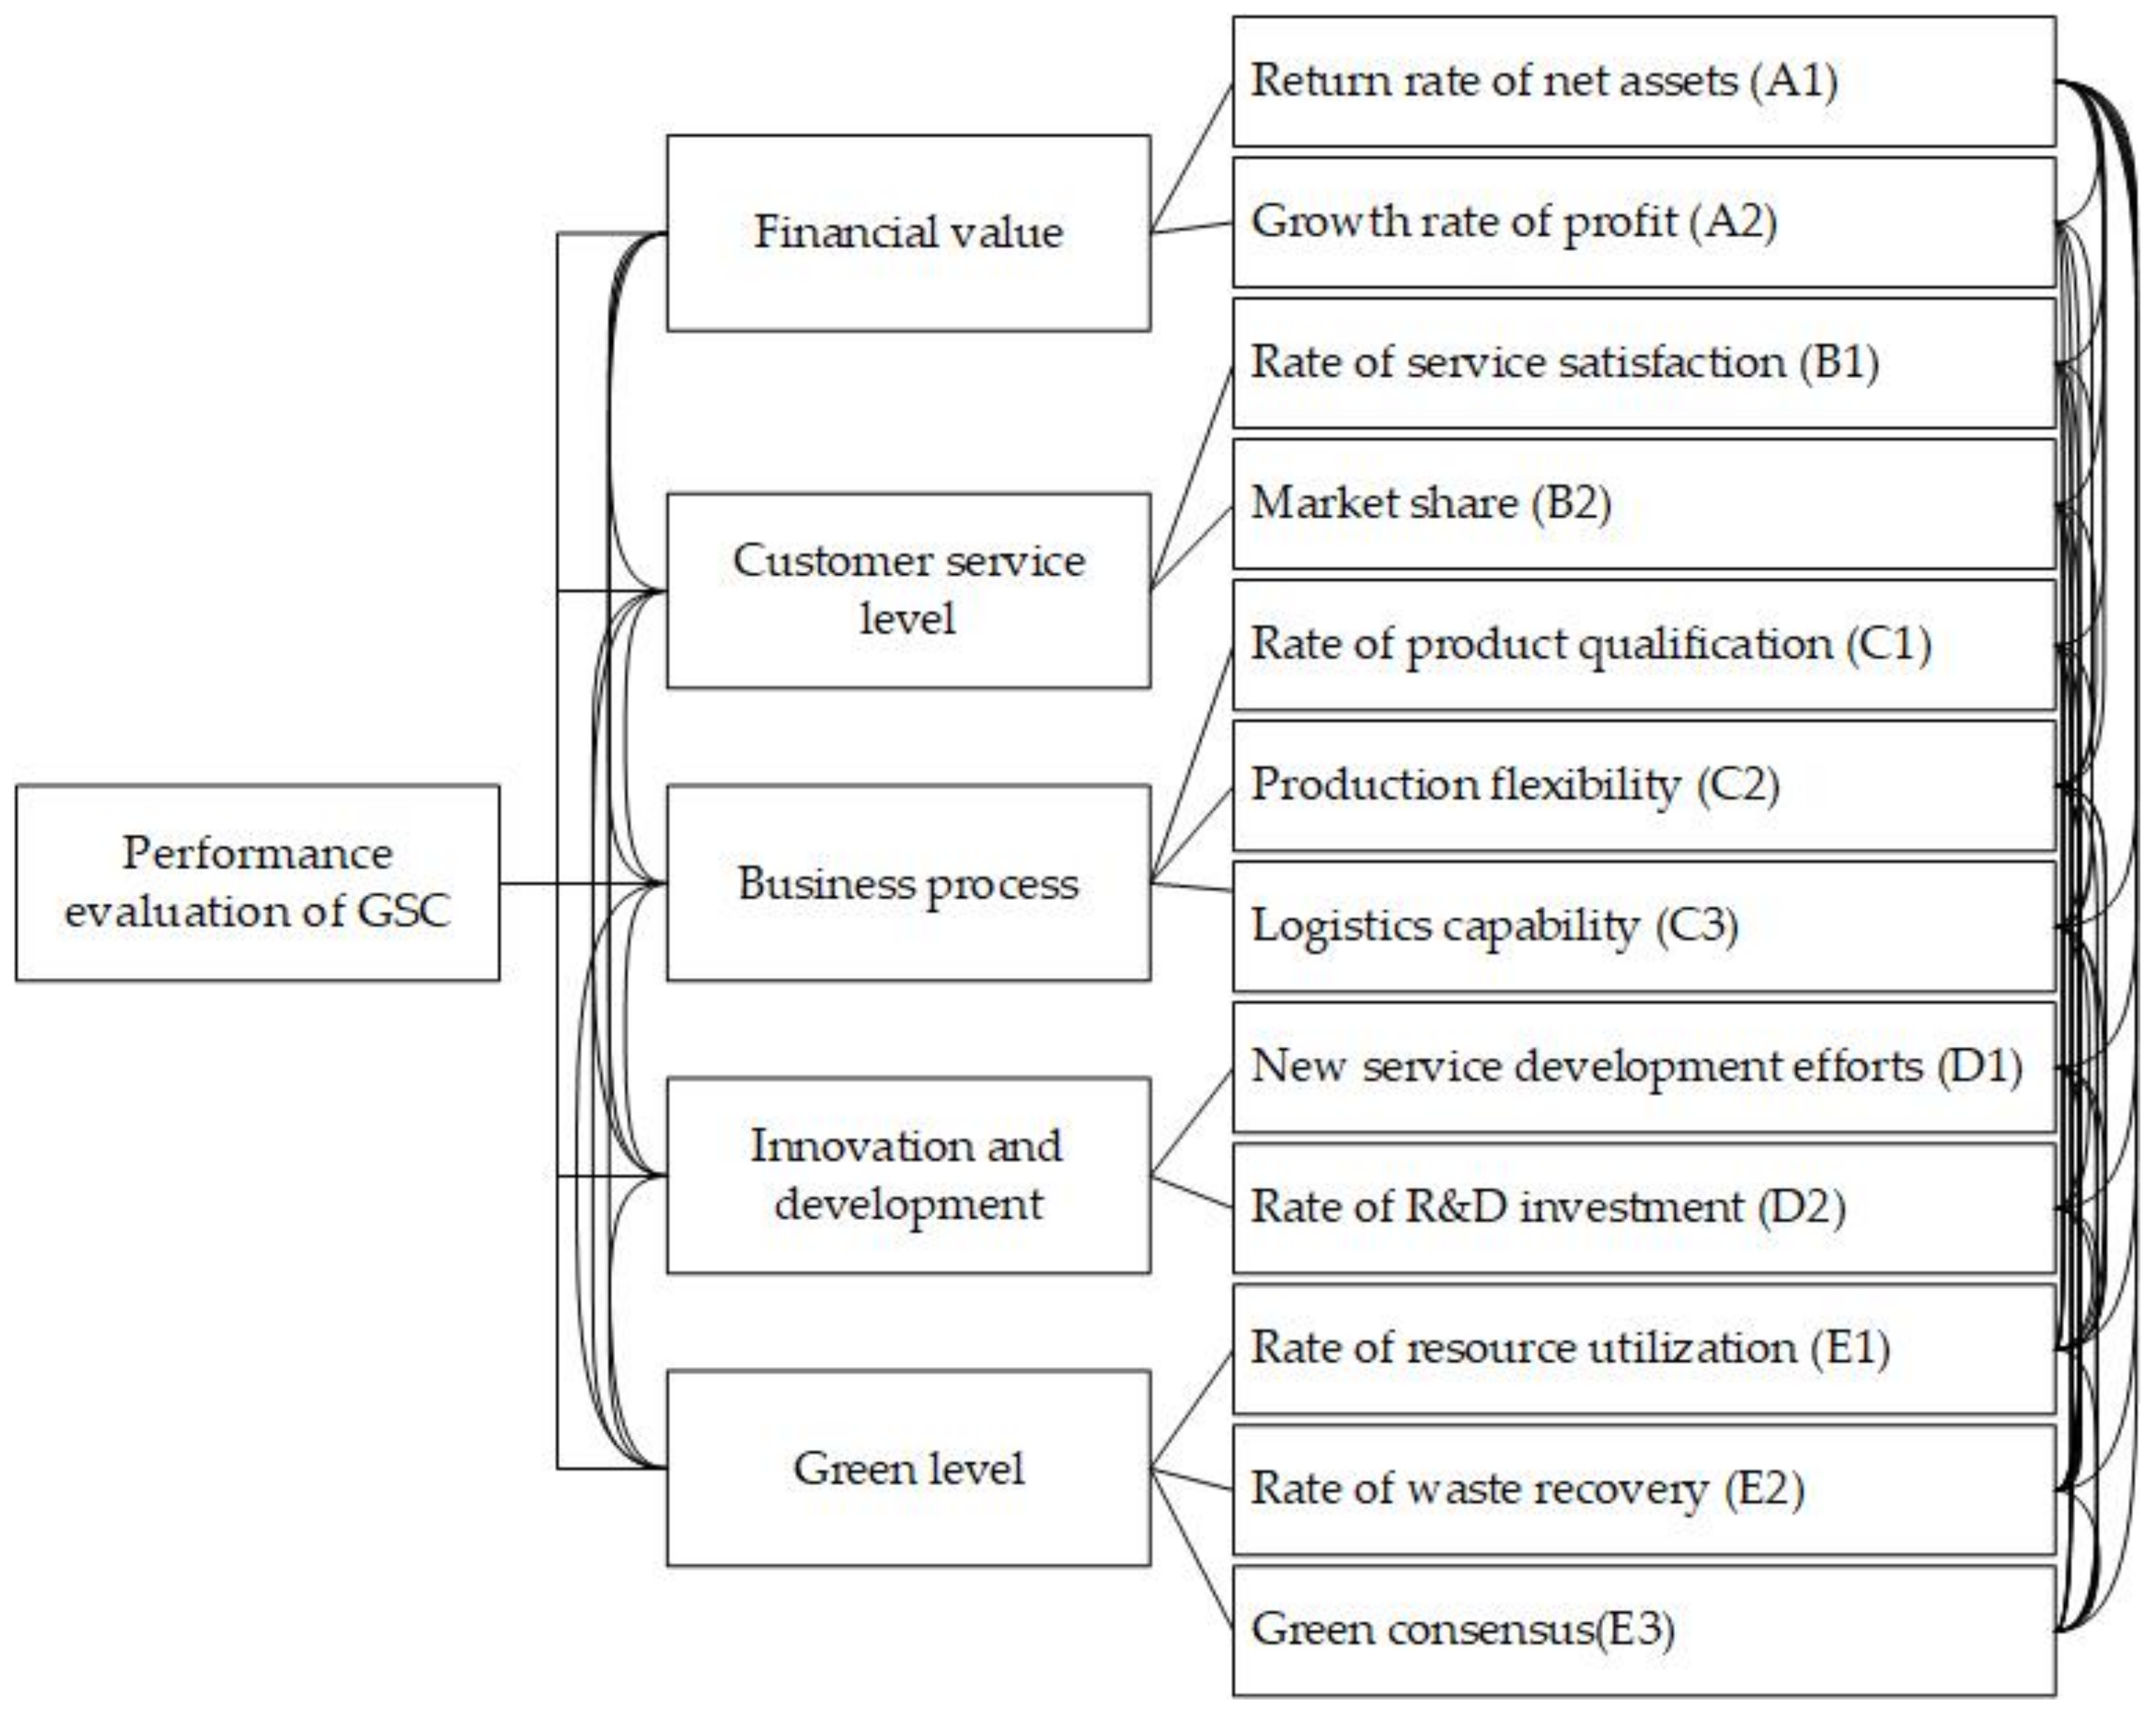
The above research results provided certain guidance for the construction of the initial evaluation index in our study. According to the principles of systematicness, comprehensiveness, a combination of static and dynamic indicators, and a combination of qualitative and quantitative indicators, we integrated and optimized the indicators involved in previous studies considering the actual requirements of a performance evaluation of a GSC. Firstly, referring to the BSC model, we summarized the previous evaluation indicators into four dimensions: financial value, customer service level, business process, innovation and development. Secondly, considering the characteristics performance evaluation of the GSC, indicators related to green, low-carbon, and sustainable aspects were summarized into the dimension of green level. Thirdly, the supply chain is the integration of all processes and activities from the initial supplier to the final customer. In order to reflect the characteristics, the business process was further decomposed in combination with SCOR model. Finally, the initial performance evaluation index system of the GSC was established as shown in
Table 1.
The previous literature offers many evaluation indicators for analyzing the performance evaluation process of GSCs from different perspectives. However, due to the limited resources in the actual supply chain management process, it is unrealistic to study and analyze all the performance evaluation indicators one by one. Thus, it is necessary to select only the critical indicators. To do so, the AHP method, gray evaluation method, and catastrophe progression method were used for quantitative analysis. These methods share a common problem, that is, the various evaluation indicators in the evaluation process are treated in isolation, without taking into account the interaction between them. For a comprehensive performance evaluation, various indicators should be understood in terms of their interaction with each other, forming a complex evaluation indicator system. Therefore, in what follows, we propose a new method of selecting critical performance evaluation indicators for GSCs.
3. Methodologies
3.1. Delphi Method
The Delphi method was initiated and implemented by the RAND Corporation in the 1950s and has the characteristics of anonymity, feedback, and statistics. It is essentially a method of anonymous inquiry by experts that involves soliciting opinions and feedback repeatedly until consensus is reached. The Delphi method adopts a back-to-back approach, which enables each expert to make independent judgments. It overcomes the subjective differences caused by different expert fields, experiences, personal cognition, etc. It is a scientific and practical analysis method [
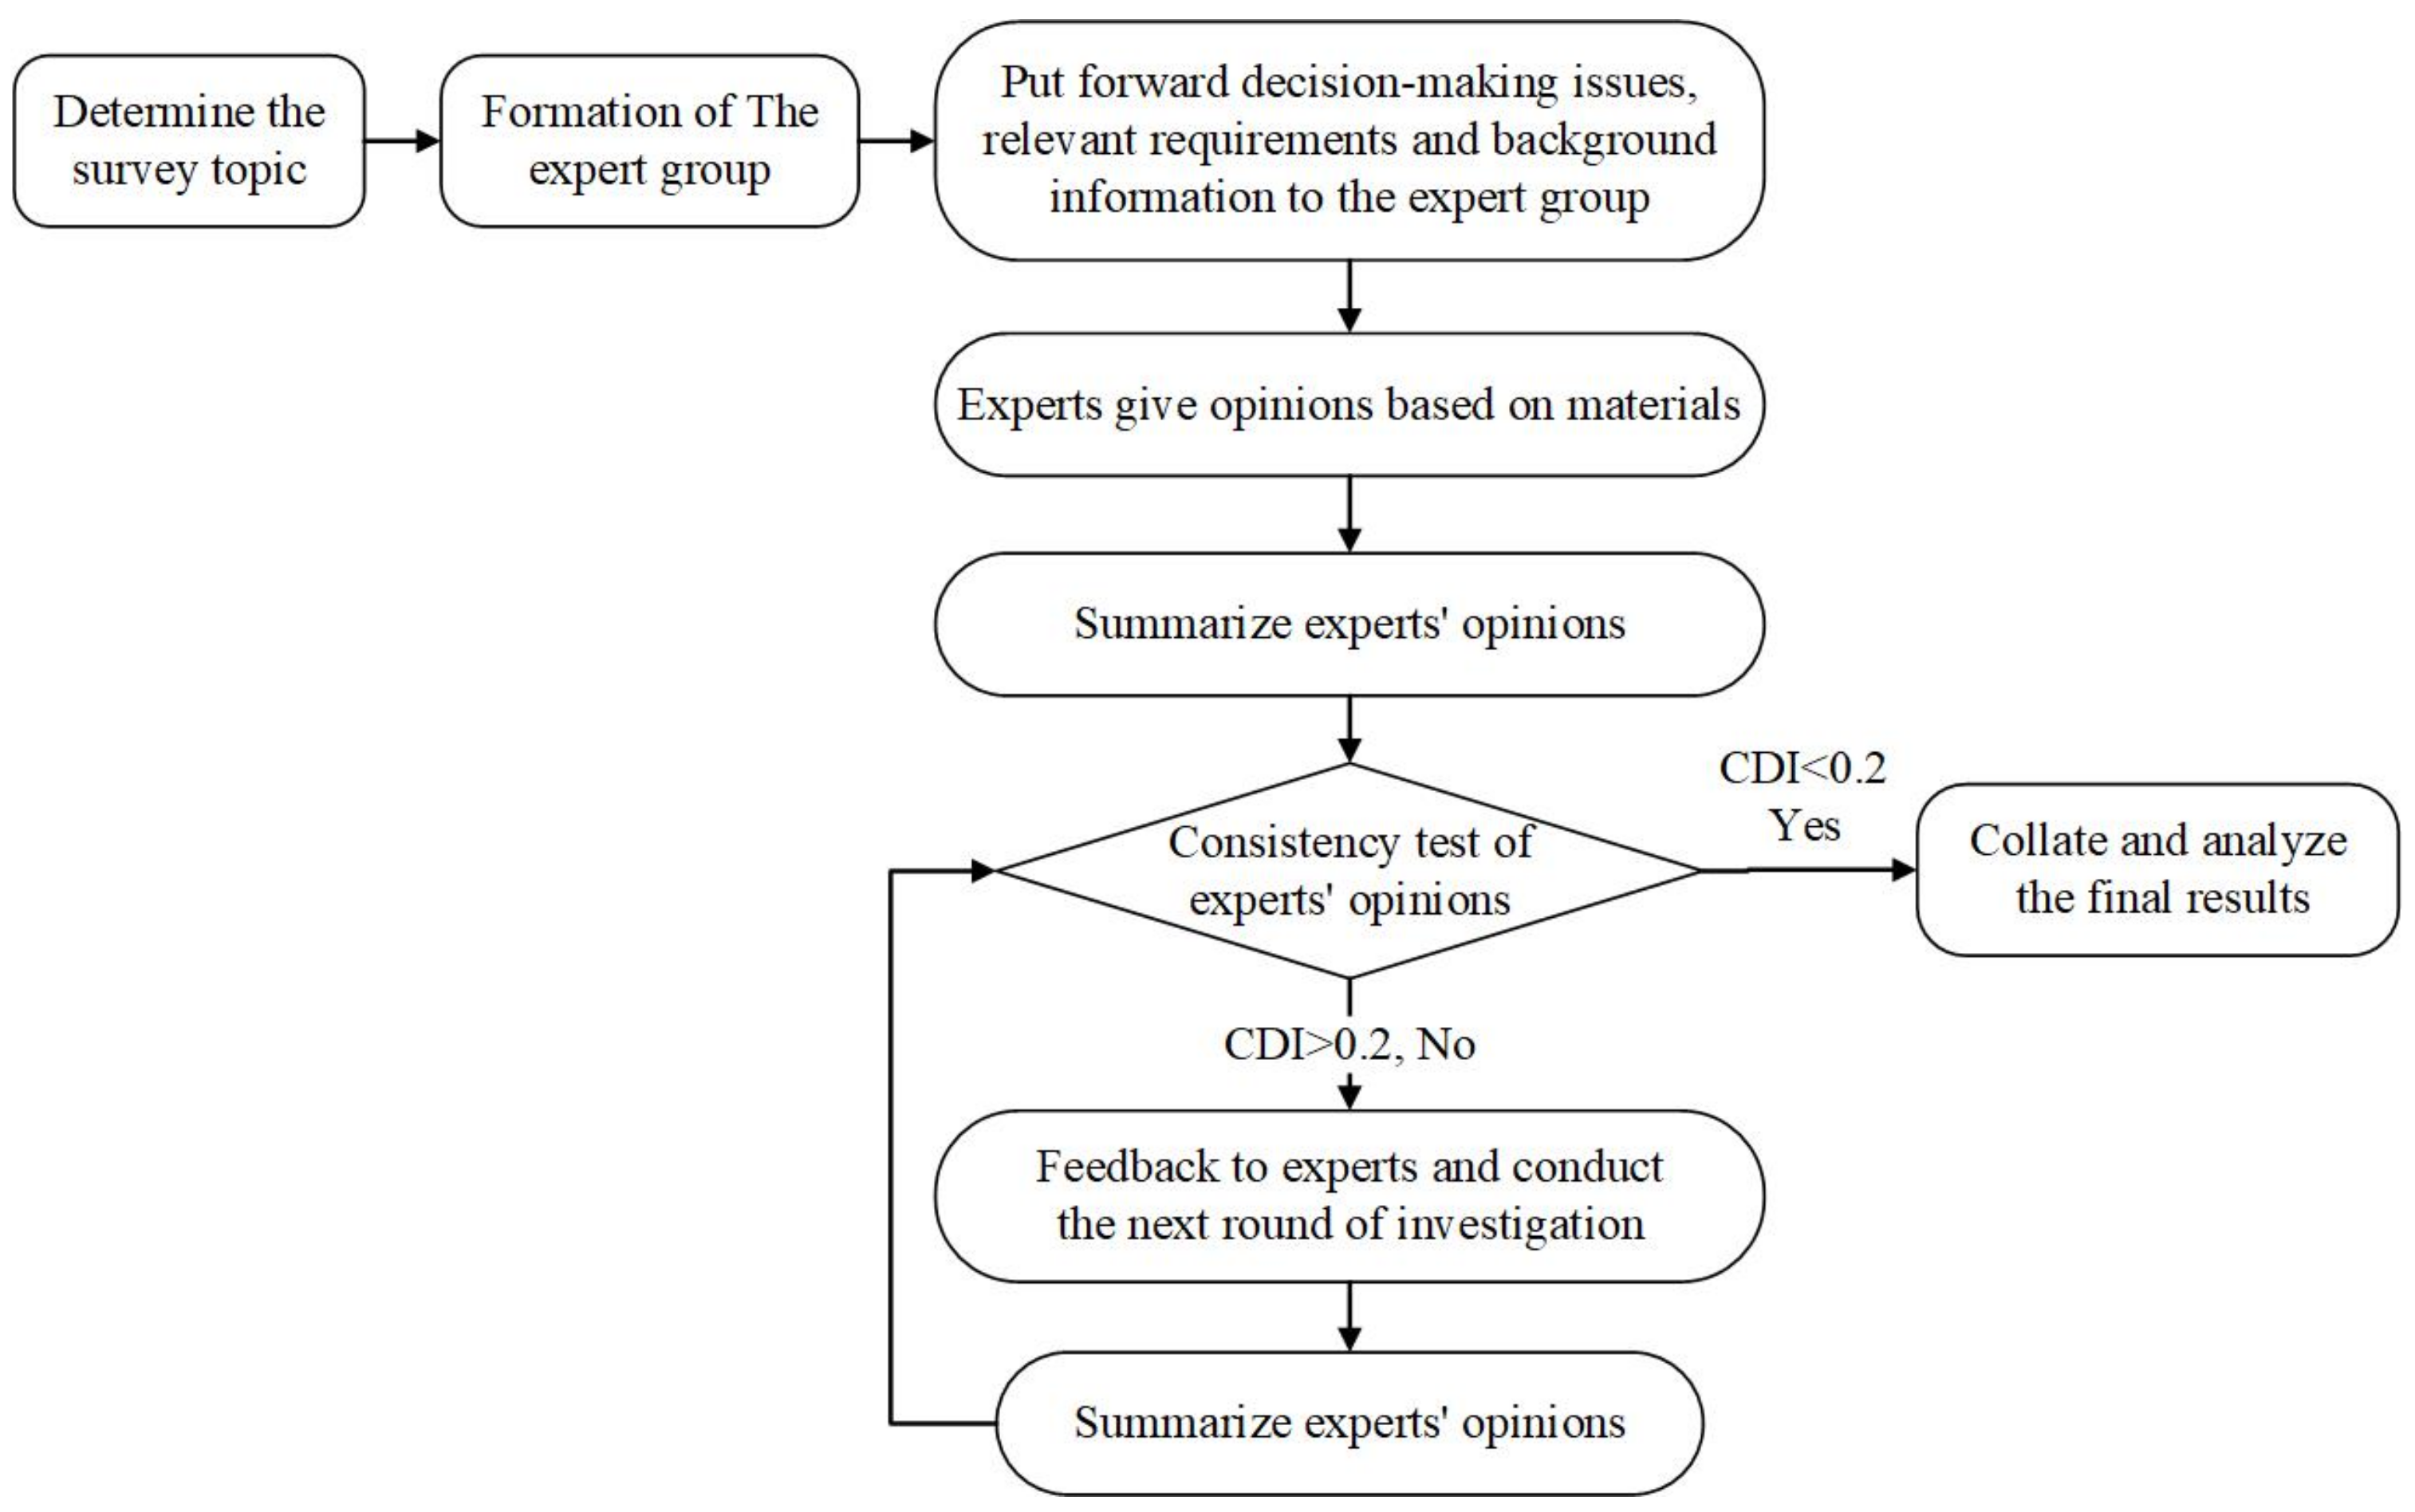
47]. When using the Delphi method to screen indicators, we first select representative scholars with professional knowledge and rich experience in decision-making issues. Anonymity ensures that the experts can freely and independently put forward their own opinions on decision-making issues. The experts are provided with as much information as possible to make judgments. Consistent opinions are sought through multiple rounds of feedback.
The specific implementation process of the Delphi method is shown in
Figure 1.
Implementation steps of the Delphi method:
- (1)
Determine the subject of investigation and draw up an outline of the investigation.
- (2)
Establish an expert group to determine the number of experts and the background of each expert.
- (3)
Present the research questions, relevant requirements, and background material to the expert group, and provide as much information as possible for the experts to make judgments.
- (4)
The experts make their own judgment based on this information.
- (5)
Summarize the expert opinions and ensure that they are consistent.
If the experts’ opinions are consistent, the final results are analyzed. If the experts’ opinions are inconsistent, they are provided with feedback and additional information, and another round of investigation is conducted until the expert opinions are consistent. The consensus deviation index (CDI) was used to calculate the consensus degree of the expert panel. The CDI value was equal to the standard deviation divided by the mean. A threshold was needed in advance. If the CDI values were greater than the threshold, it indicated a significant divergence in the experts’ opinions, and the next round of expert scoring is required until all the CDI values were lower than the threshold.
3.2. Fuzzy DEMATEL-Based ANP Model
The DEMATEL method was first proposed by A. Gabus and E. Fontela to understand complex and difficult decision-making problems in the real world. It is a systematic analysis method based on graph theory and matrix tools. When using the DEMATEL method for performance evaluation, we first analyze the composition of the indicators in the system and the logical relationship between the indicators. Then, we build a direct impact matrix. After calculations, we can obtain a comprehensive impact matrix, with which we can calculate the influence of each indicator on other indicators and determine the causality and prominence of each indicator as the basis for constructing the model. Thus, the causal relationship between indicators and the position of each indicator in the system are determined, and a causal relationship diagram of the indicators is generated [
48].
The ANP method is combined with the DEMATEL method to form the DEMATEL-ANP method, which plays an important role in determining critical factors and causal relationships. The causal relationship diagram of indicators formed by the DEMATEL method lays the foundation for ANP modeling. At the same time, the total influence matrix obtained by the DEMATEL method can be directly used as an unweighted super-matrix in the ANP model, which avoids the cumbersome work of comparing two indicators in the ANP method and the problem of consistency testing. The weights of the indicators are determined by comprehensively considering the prominence calculated by the DEMATEL method and the weight calculated by ANP method. The final ranking of each indicator is thus obtained.
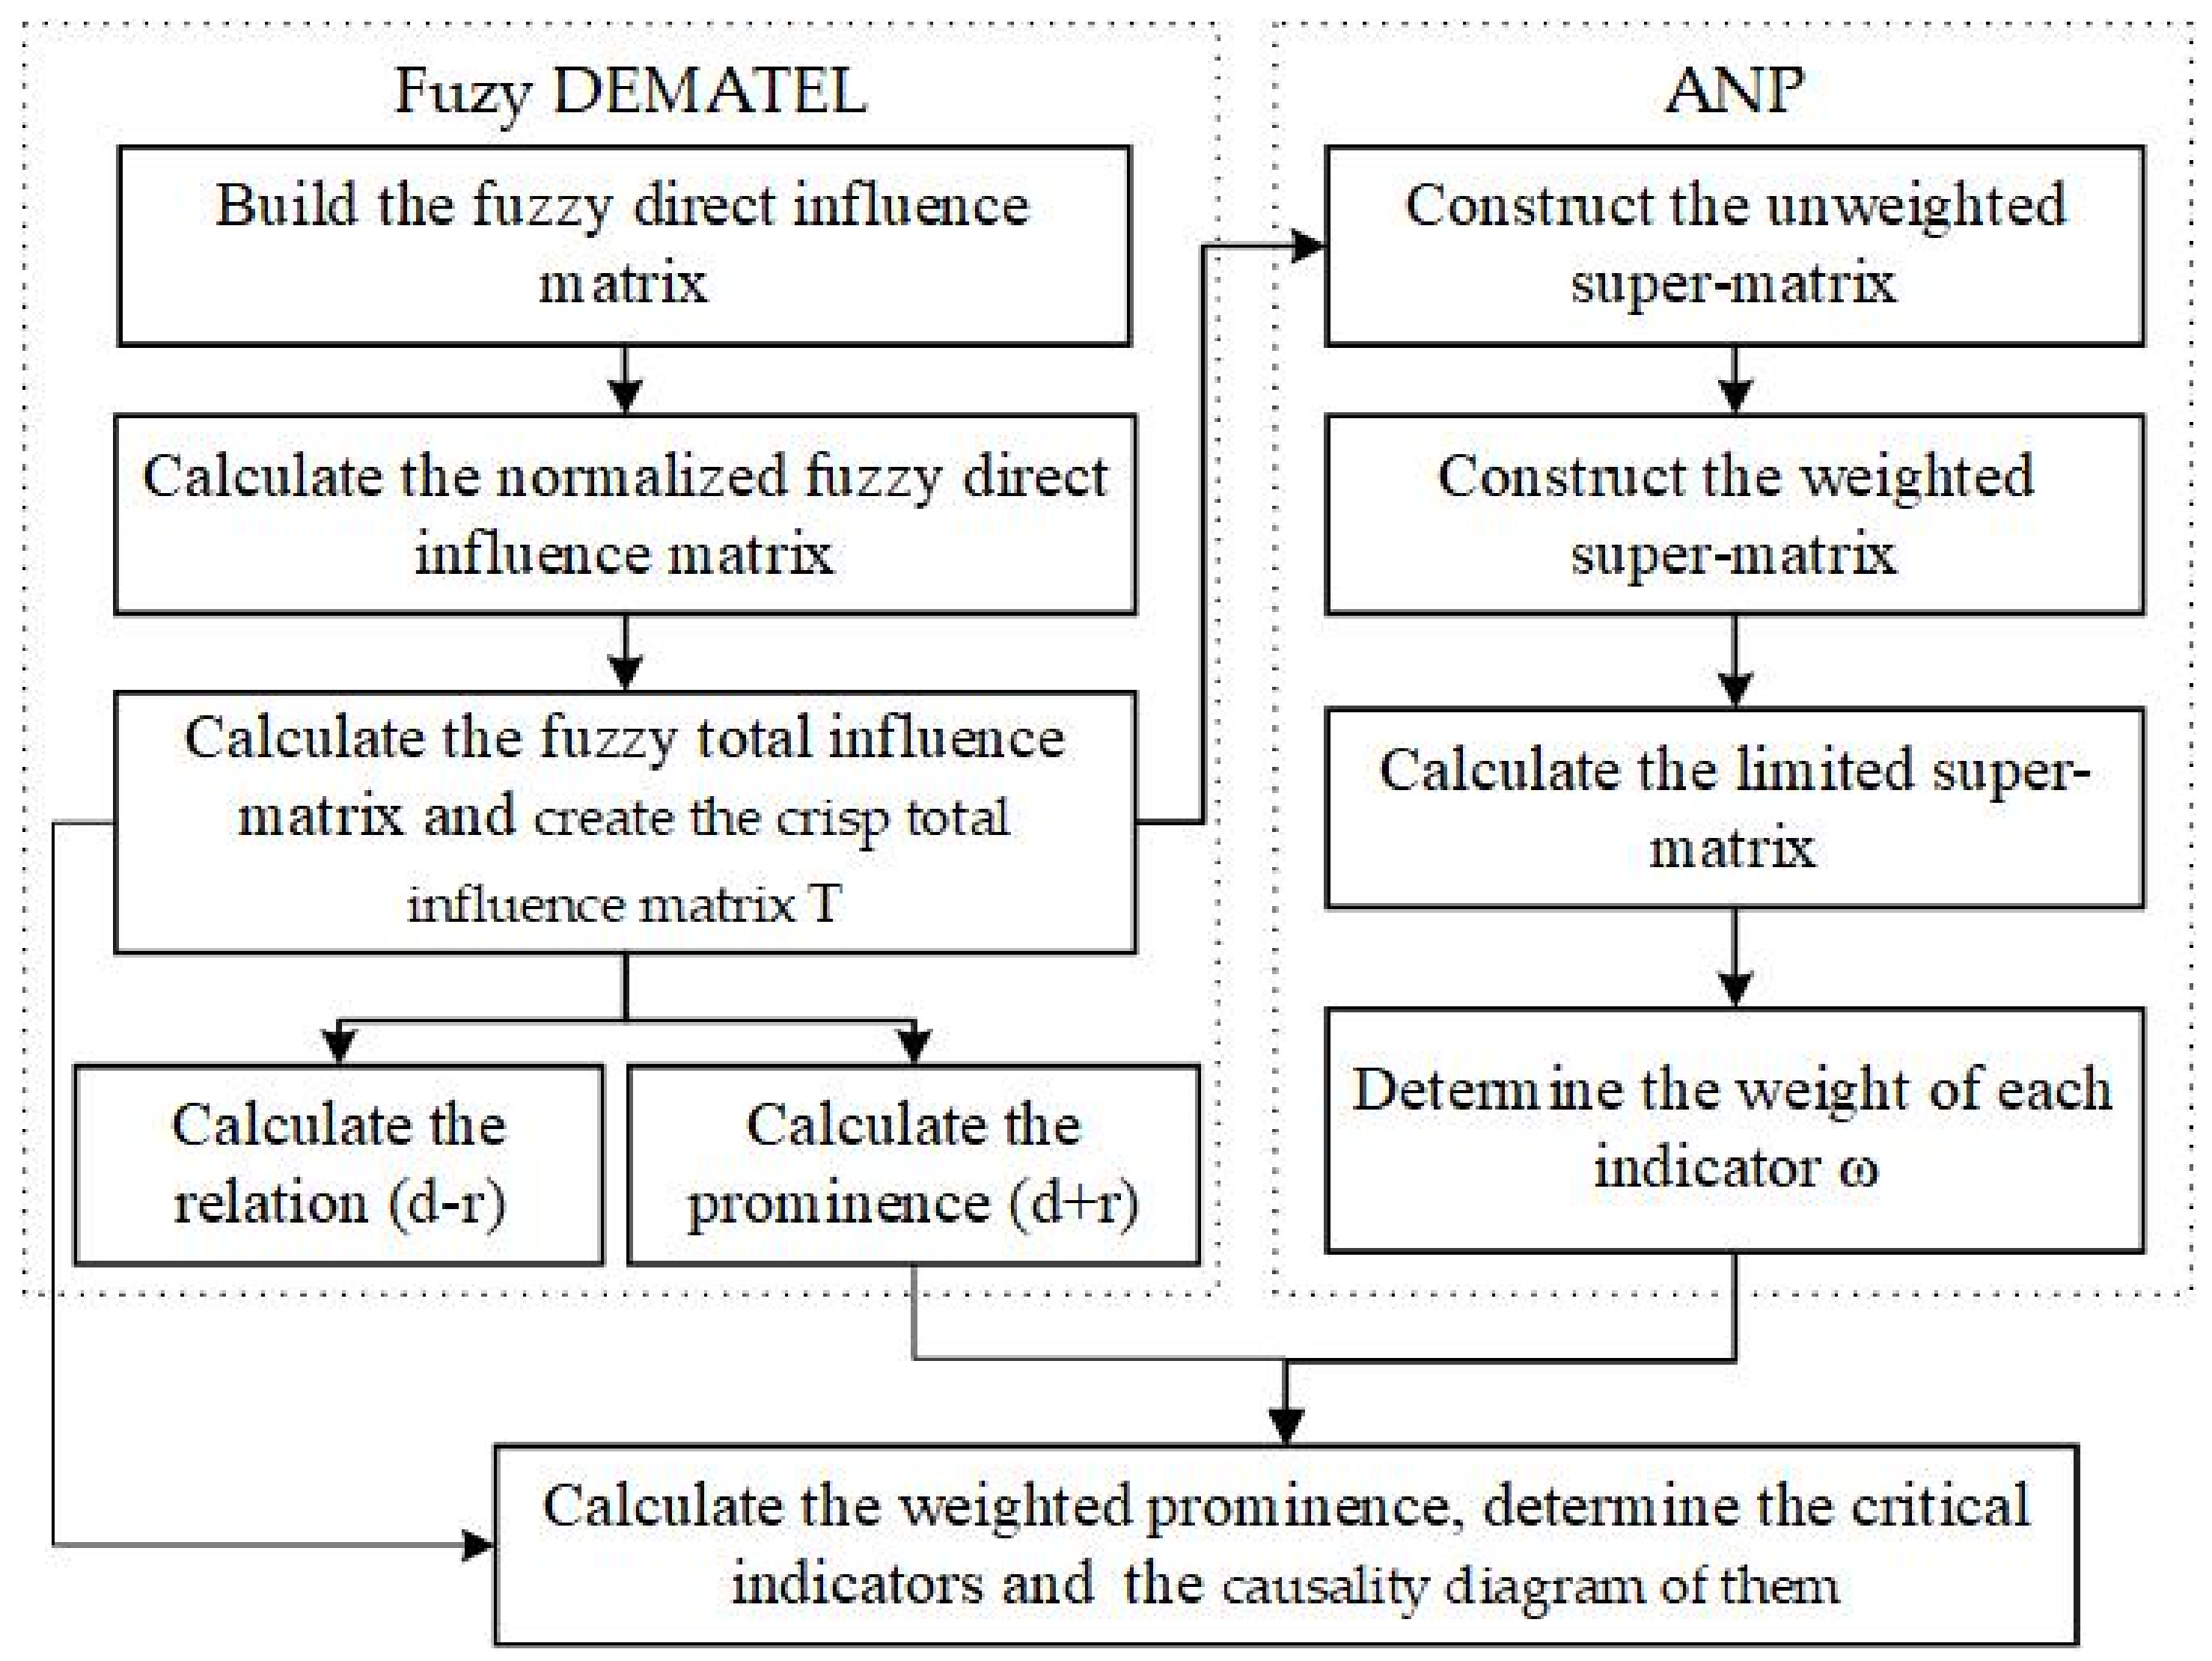
In our study, considering the ambiguity and uncertainty of various indicators, we explore the fuzzy DEMATEL-based ANP model for selecting key performance evaluation indicators. The specific operation steps are as follows:
First, we determined the interaction among the evaluation indicators through a questionnaire. Using the triangular blur number, we obtained the fuzzy direct influence matrix
, including
as the direct influence matrix of the lower limit, median, and the upper limit respectively. In Equation (1),
represents the fuzzy impact of the indicator
i on the indicator
j.
Second, we normalized the fuzzy direct influence matrix
to obtain the normalized fuzzy direct influence matrix
. The calculation formula is shown in Equation (2), and the calculation of
λ is shown in Equation (3).
Third, we calculated the fuzzy total influence matrix
according to the normative fuzzy direct influence matrix
. The calculation formula is shown in Equation (4), where
I was the unit matrix. Then, we created the crisp total influence matrix T based on
The crisp total influence matrix
T is directly used as the unweighted super-matrix of the ANP model. After the ANP operation, the weighted super-matrix and limited super-matrix were obtained successively.
Fourth, we determined the causal relationship of the performance evaluation indicators. In the total influence matrix T, we used di to represent the sum of evaluation indicators in each row and ri to represent the sum of the evaluation indicators in each column. Here, di represents the total influence value of the i-th indicator on other indicators, and ri represents the total influence value of the i-th indicator on all other indicators. The difference between the influence degree and the affected degree of the i-th indicator is the causality of this indicator, which is recorded as di − ri. If di − ri > 0, this indicates that the impact of this indicator on other indicators is greater than that of other indicators on itself, so this indicator is called a driving factor. The greater the difference, the greater the impact of this indicator on other indicators. Conversely, if di − ri < 0, this indicator is called a result factor. Therefore, we built a causal relationship diagram based on the classification of all indicators.
Finally, we sorted the indicators, and then determined the critical evaluation indicators. The prominence of each indicator was obtained by adding the influence degree di and the affected degree ri of the i-th indicator. This represents the role of the evaluation indicator in the whole performance evaluation system, such that the importance of the indicator can be obtained by sorting the prominence. At the same time, we calculated the weight of each evaluation indicator according to the ANP model, expressed by wi. Further, we calculated the weighted prominence of each evaluation indicator through the formula wi(di + ri), and, finally, ranked the indicators according to the weighted prominence and determined the critical indicators in the evaluation index system.
To sum up, the key indicator selection process based on the fuzzy DEMATEL-based ANP model is shown in
Figure 2.
5. Discussion and Implications
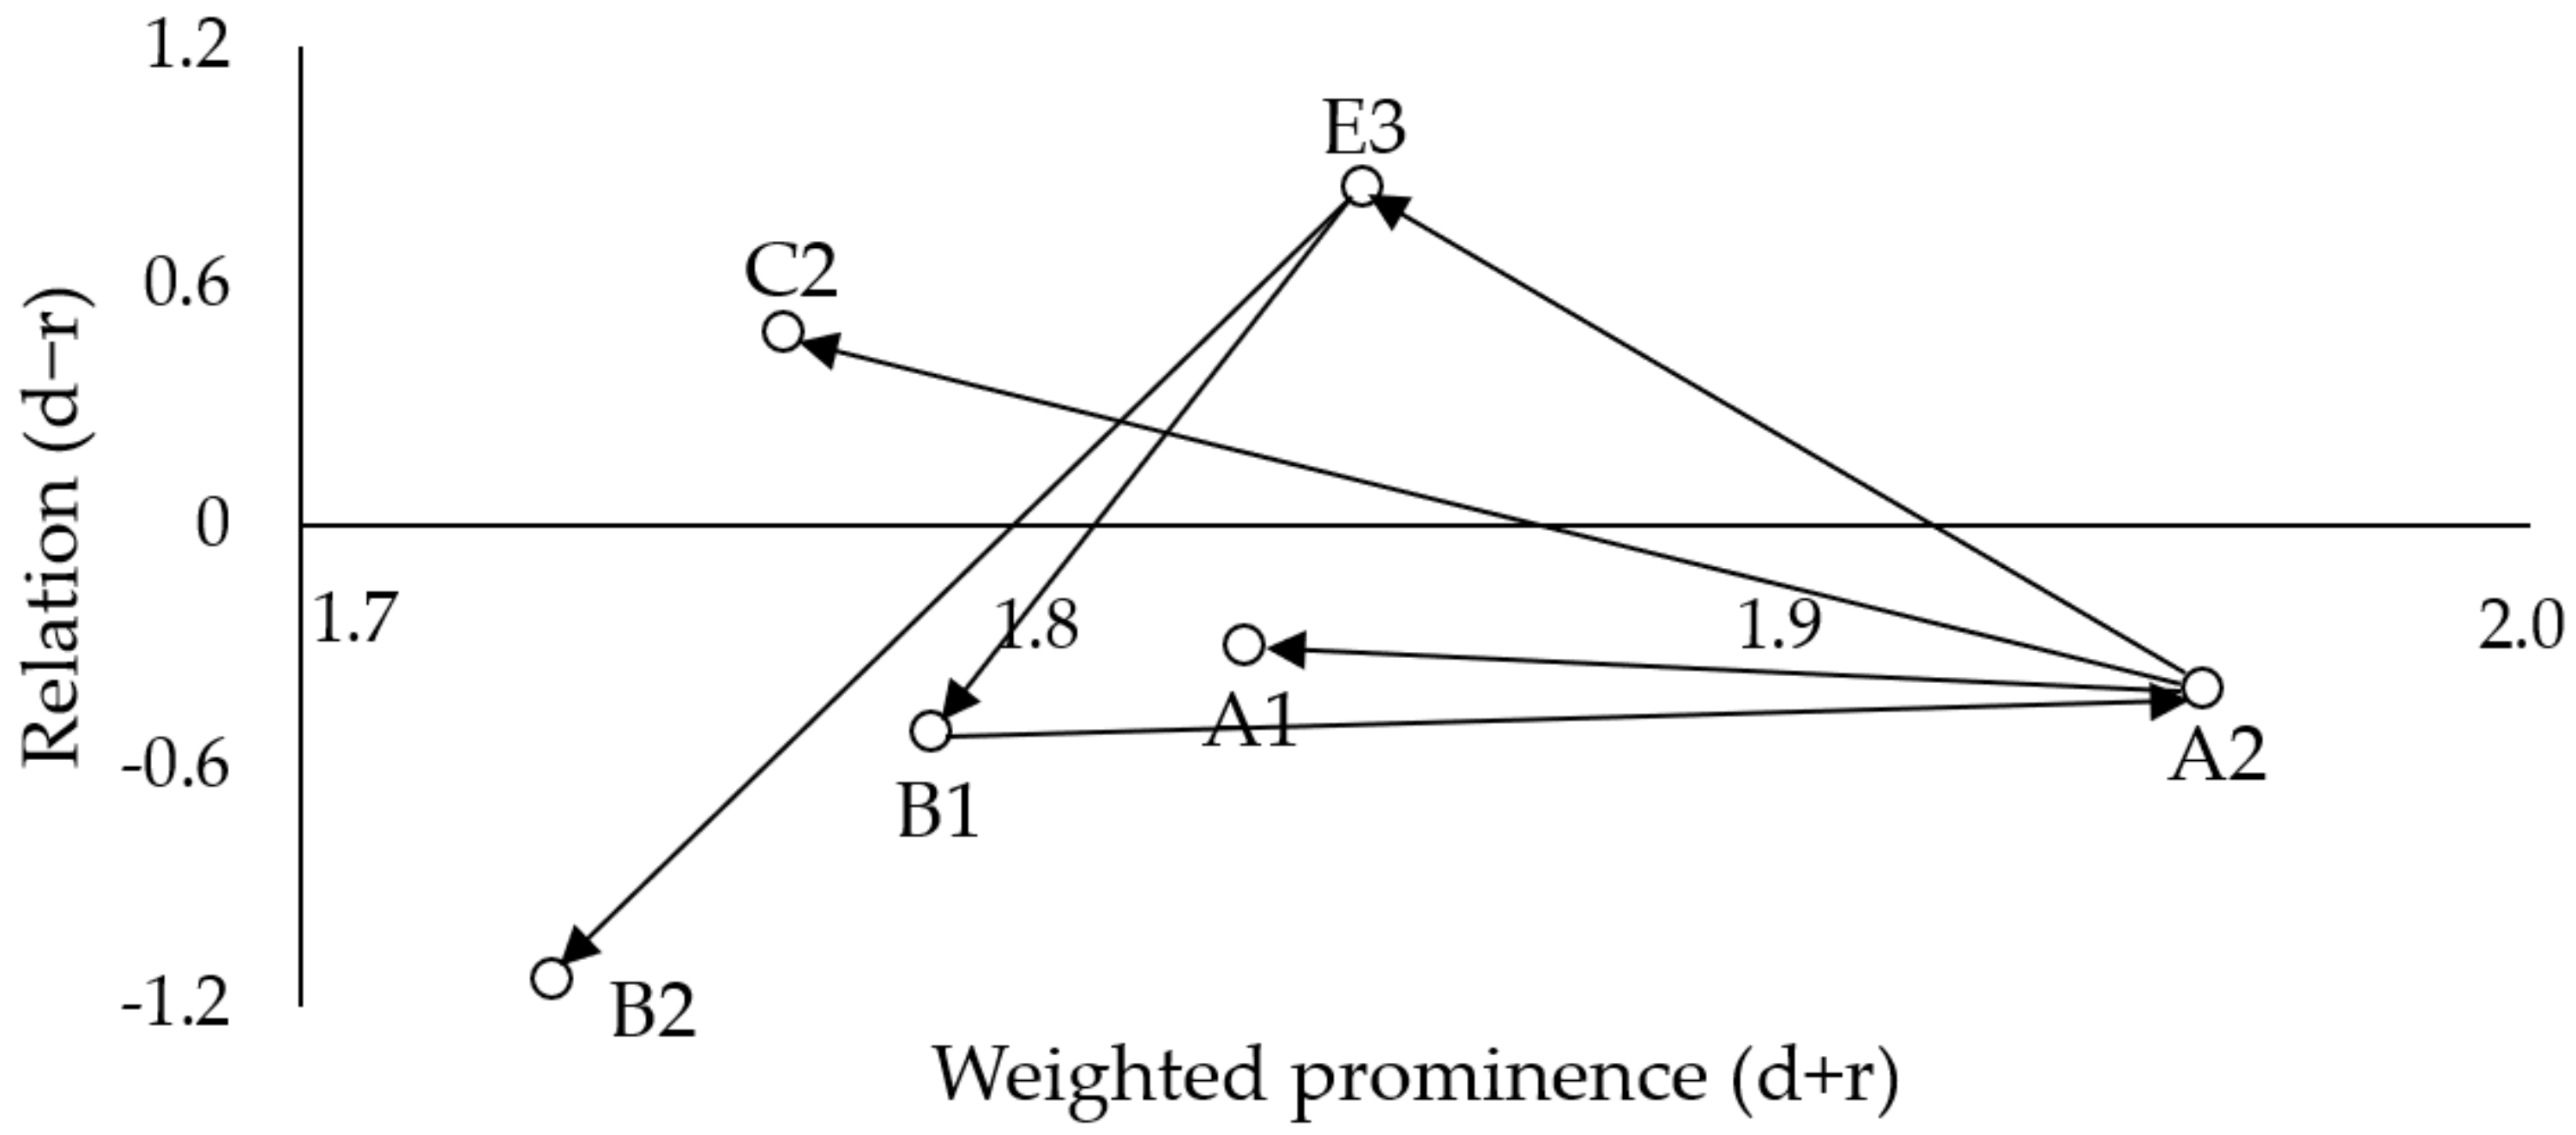
The empirical results showed that financial value, customer service level, business processes, and the green level were important dimensions of GSC performance evaluations. Critical performance evaluation indicators included the return rate of net assets (A1), the growth rate of profit (A2), the rate of service satisfaction (B1), market share (B2), production flexibility (C2), and the green consensus (E3). We divided the indicators in the evaluation index system into driving factors and result factors by calculating the cause degree. The detailed analysis of the results are as follows:
- (1)
The production flexibility (C2) and the green consensus (E3) are the critical driving factors. The latter (E3) has a decisive impact on the rate of resource utilization (E1), the rate of waste recovery (E2), the rate of service satisfaction (B1), market share (B2), and new service development efforts (D1).
- (2)
The rate of profit growth (A2) has an important impact on the financial value performance of GSC performance evaluations. The profit growth rate is an important indicator that reflects the operating efficiency and development prospects of enterprises. It further reflects the development potential of enterprises. However, the profit growth rate is a result factor that is mainly affected by the green degree of the enterprise. The public’s high recognition of GSC helps to improve the image, popularity, and influence of the green demonstration enterprise, thus bringing economic benefits. Enterprises should adhere to the principles of green development over a sustained period.
- (3)
The return rate of net assets (A1) is a critical factor in performance evaluations of GSC enterprises. It reflects the input–output level and profit quality of enterprises in a certain production cycle, and it further reflects the level of investment income of enterprises. It is the most comprehensive financial indicator when studying the operation status of enterprises and measuring the asset structure and operating capacity of enterprises, and it has an important impact on performance evaluations of supply chains. However, the return on net assets is a result factor that is mainly affected by the profit growth rate.
- (4)
The rate of service satisfaction (B1) plays an important role in performance evaluations of GSCs. Customers are located at the end of the supply chain and provide objective feedback for the operation effect of the enterprise supply chain. Service satisfaction reflects customers’ recognition of the enterprise and satisfaction with products and services, which is the key factor when measuring customer performance evaluation. It can be seen from
Figure 1 that service satisfaction is a result factor that is mainly affected by the green consensus of GSCs.
- (5)
Market share (B2) is a critical indicator in GSC performance evaluation, reflecting the share of supply chain end products in the market and the product service capability of enterprises. However, the market share is a result factor that is mainly affected by the green consensus of GSCs. That is, those enterprises with a high green consensus of GSCs also have a large share of their products at the end of the supply chain.
Based on the above analysis, we propose the following managerial implications to enhance the performance of GSCs.
To improve the performance of GSCs, enterprises should basically focus on the green consensus by strengthening the selection and evaluation of supply chain partners. Partners who accept and implement the green concept should be selected and encouraged. With the improvement of the green consensus, the service satisfaction level and the market share will all be optimized directly. The improvement of the service satisfaction level can lead to an improvement of the growth rate of profit. With the improvement of the growth rate of profit, participants of the GSC can utilize more financial resources to strengthen the green consensus. These three indicators form a virtuous circle. Additionally, the production flexibility and the return rate of net assets will be directly improved by the increasing financial support. That is, the whole GSC system will be improved through the improvement of green consensus and the virtuous circle.
6. Conclusions
Based on the improved BSC-SCOR model, we constructed a GSC performance evaluation index system to ensure comprehensiveness and performance of the evaluation process. Then, according to the fuzzy DEMATEL-based ANP model, we selected critical indicators for evaluating GSC performance, and we proposed corresponding countermeasures according to the empirical research results. Our conclusions are as follows:
First, we sorted out the existing research results in this field, and on that basis, we reviewed an initial index system for performance evaluation of GSCs. The initial indicator set comprised 24 evaluation indicators in five dimensions: financial value, customer service level, business processes, innovation and development, and the green level. The initial indicators were screened and optimized based on an expert questionnaire survey. After calculating the average score and CDI values of each indicator, 12 unnecessary indicators were eliminated, and a GSC performance evaluation indicator system with 12 indicators in five dimensions was ultimately obtained.
Second, we used the fuzzy DEMATEL method to calculate the prominence and causality of the indicators and analyzed the causal relationship between the indicators. Six experts with rich practical experience and professional theoretical backgrounds in the field of GSCs were invited to complete the questionnaire. By summarizing the data and calculating average values, an initial fuzzy direct influence matrix was obtained. The fuzzy and crisp total influence matrices were further calculated. The indicators were divided into driving factors and result factors according to the relationship. The driving factors included the product qualification rate, production flexibility, the logistics capacity, the rate of waste recovery, and the green consensus.
Third, we selected critical indicators for evaluating GSC performance according to the fuzzy DEMATEL-based ANP model. The weighted prominence of each indicator was obtained by combining the prominence with the weight coefficient calculated by the ANP model. Then, we ranked the calculation results to determine the critical evaluation indicators in GSC performance evaluation.
Finally, according to the analysis results, some countermeasures and suggestions were put forward regarding the process of evaluating GSC performance.
Compared with previous studies [
5,
11,
31,
49], four basic dimensions of the index system were the same, including financial value, customer service, business process, and innovation and development. We all took the growth rate of profit as a typical reflection of financial performance, the rate of service satisfaction as an important reflection of customer service level, and we all emphasized the importance of logistics capability in the supply chain. In the dimension of innovation and development, we all considered new service development and R&D investment. The differences lie in the following two aspects: firstly, our study fully considered the characteristics of a GSC, adding the green level as the fifth dimension. The green level dimension included three indicators: the rate of resource utilization, the rate of waste recovery, and the green consensus. Secondly, considering the complexity of the business process of a GSC, we included the SCOR model to optimize and adjust the business process dimension. We integrated the three indicators of time flexibility, variety flexibility, and quantity flexibility into production flexibility. At the same time, the logistics capability was incorporated into the business process dimension.
In terms of the identification of critical indicators, Shafiee et al. [
5] and Wang et al. [
31] obtained the critical indicators from three dimensions: financial, customer service, and business process, using the gray clustering and fuzzy comprehensive evaluation methods. Jia et al. [
49] identified that customer service and logistics capacity were the two most important indicators, using the extension goodness evaluation method. These conclusions are consistent with our study. Unlike from the previous studies, we not only extracted critical indicators, but also identified the critical driving indicators through the interaction analysis of any two indicators. We considered the green consensus as the most important indicator to enhance the overall performance of a GSC. We also discovered the virtuous circle among the green consensus, the service satisfaction level, and the growth rate of profit. Only if all the participants in the whole supply chain wholly accept the green development concept, can they maintain the synergy and consistency in their business and drive the improvement of financial indicators and customer satisfaction.
There were some limitations to this study. Although we classified the 24 indicators into five dimensions according to the BSC-SCOR joint model, we did not consider an exhaustive set of indicators. Such indicators should be checked one by one in consideration of innovations in supply chain models and recent research, and the selection of evaluation indicators should be further expanded. In addition, when processing the data, we treated the opinions of each expert equally, even though the theoretical experience of each expert differed. In future research, we will consider a weighted ratio to distinguish the experience of the experts.


