
Impacts of Climate Change on Hydrological Regimes in the Congo River Basin

 , ,
, ,  ,
,  and
and
Abstract
1. Introduction
2. Materials and Methods
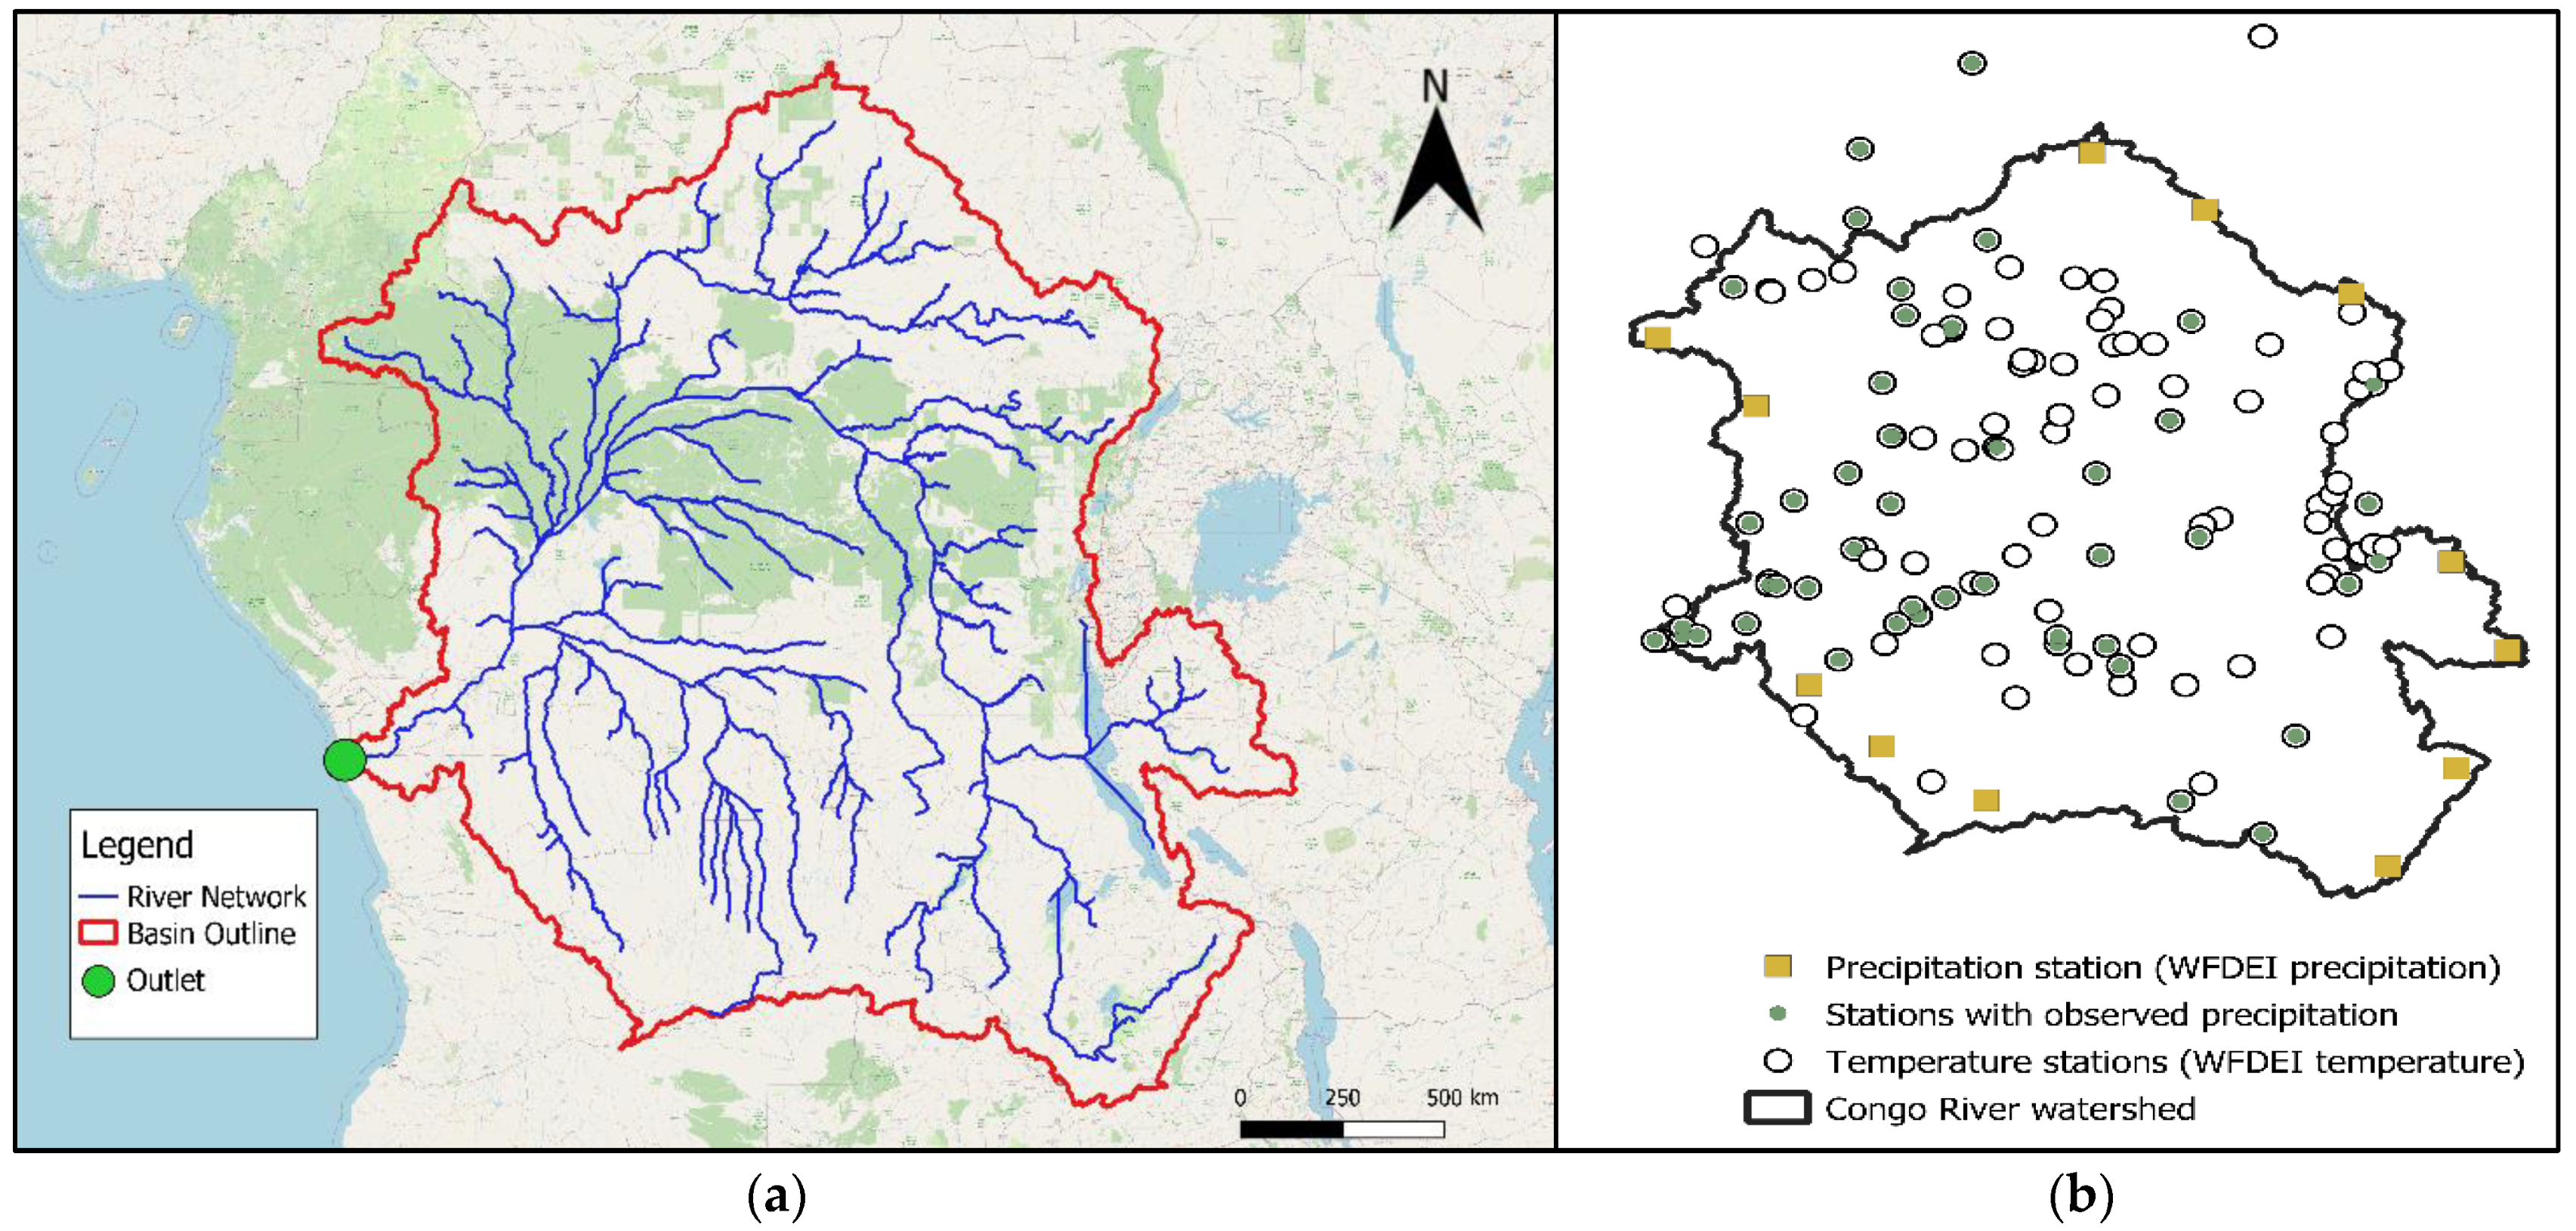
2.1. Available Data
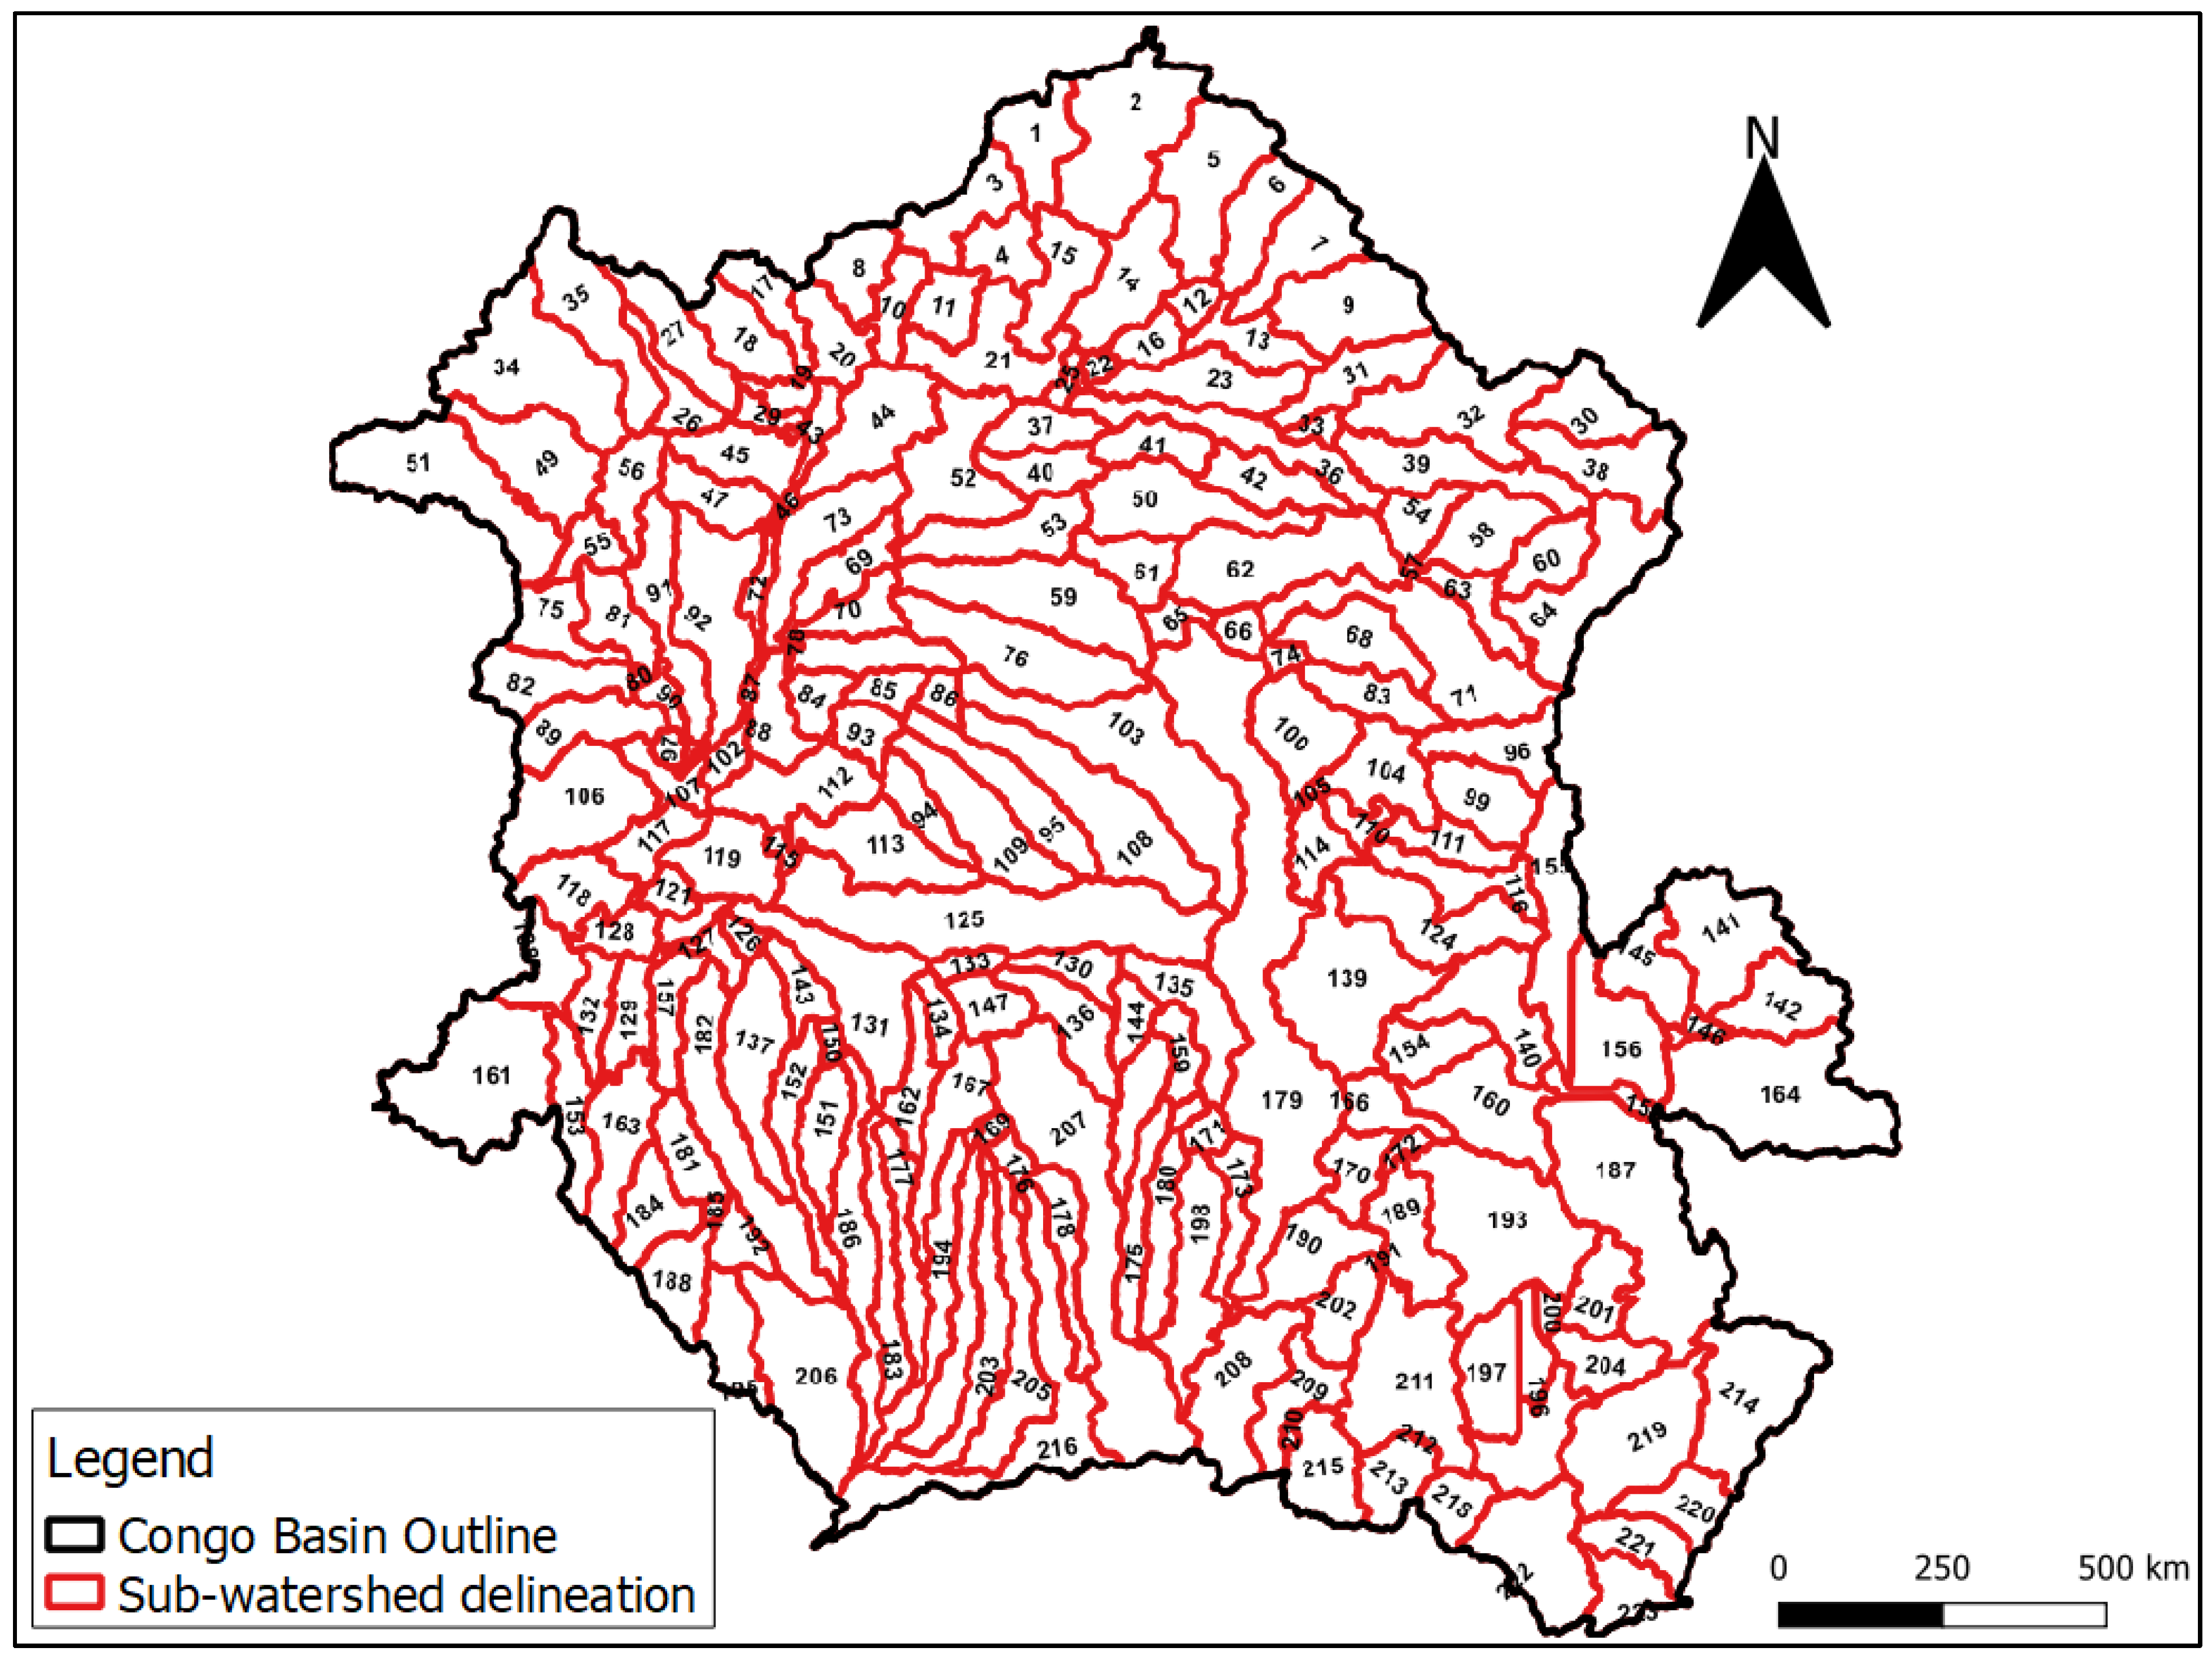
2.2. Model Setup
2.3. Calibration and Validation
2.3.1. Performance Measures
2.3.2. Sensitivity Analysis
3. Results and Discussion
3.1. Sensitivity Analysis
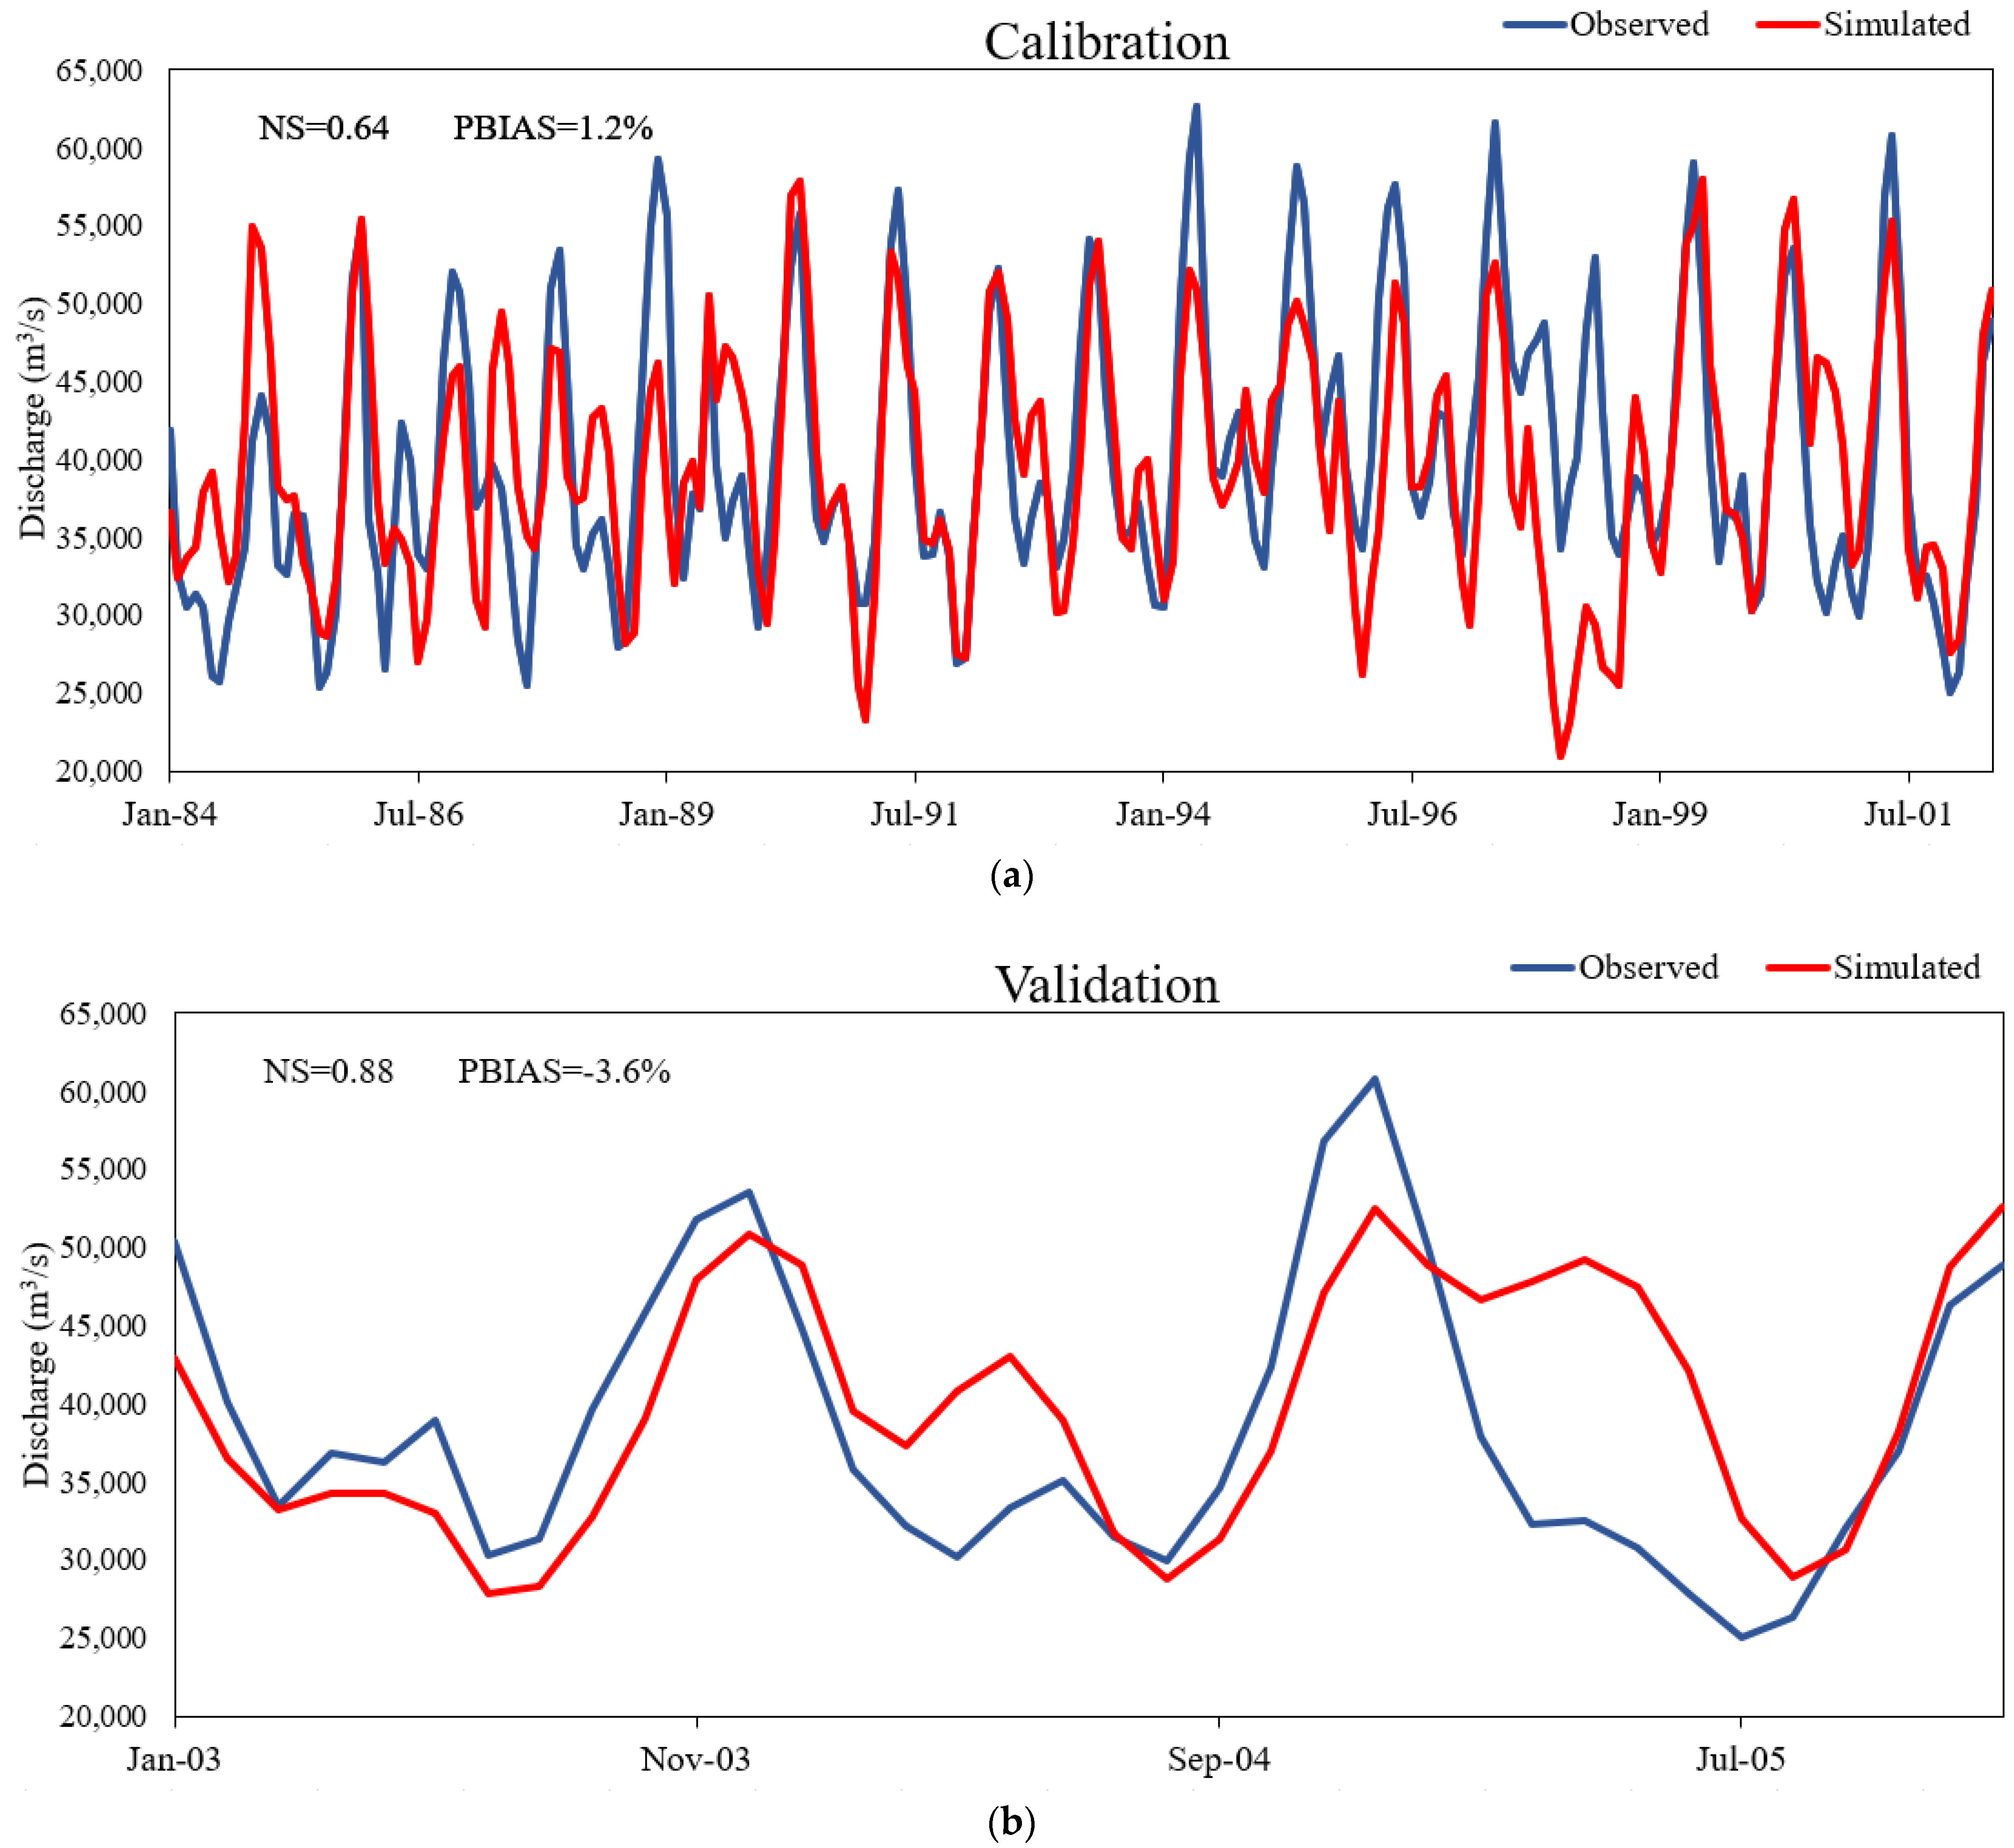
3.2. Calibration and Validation Performance
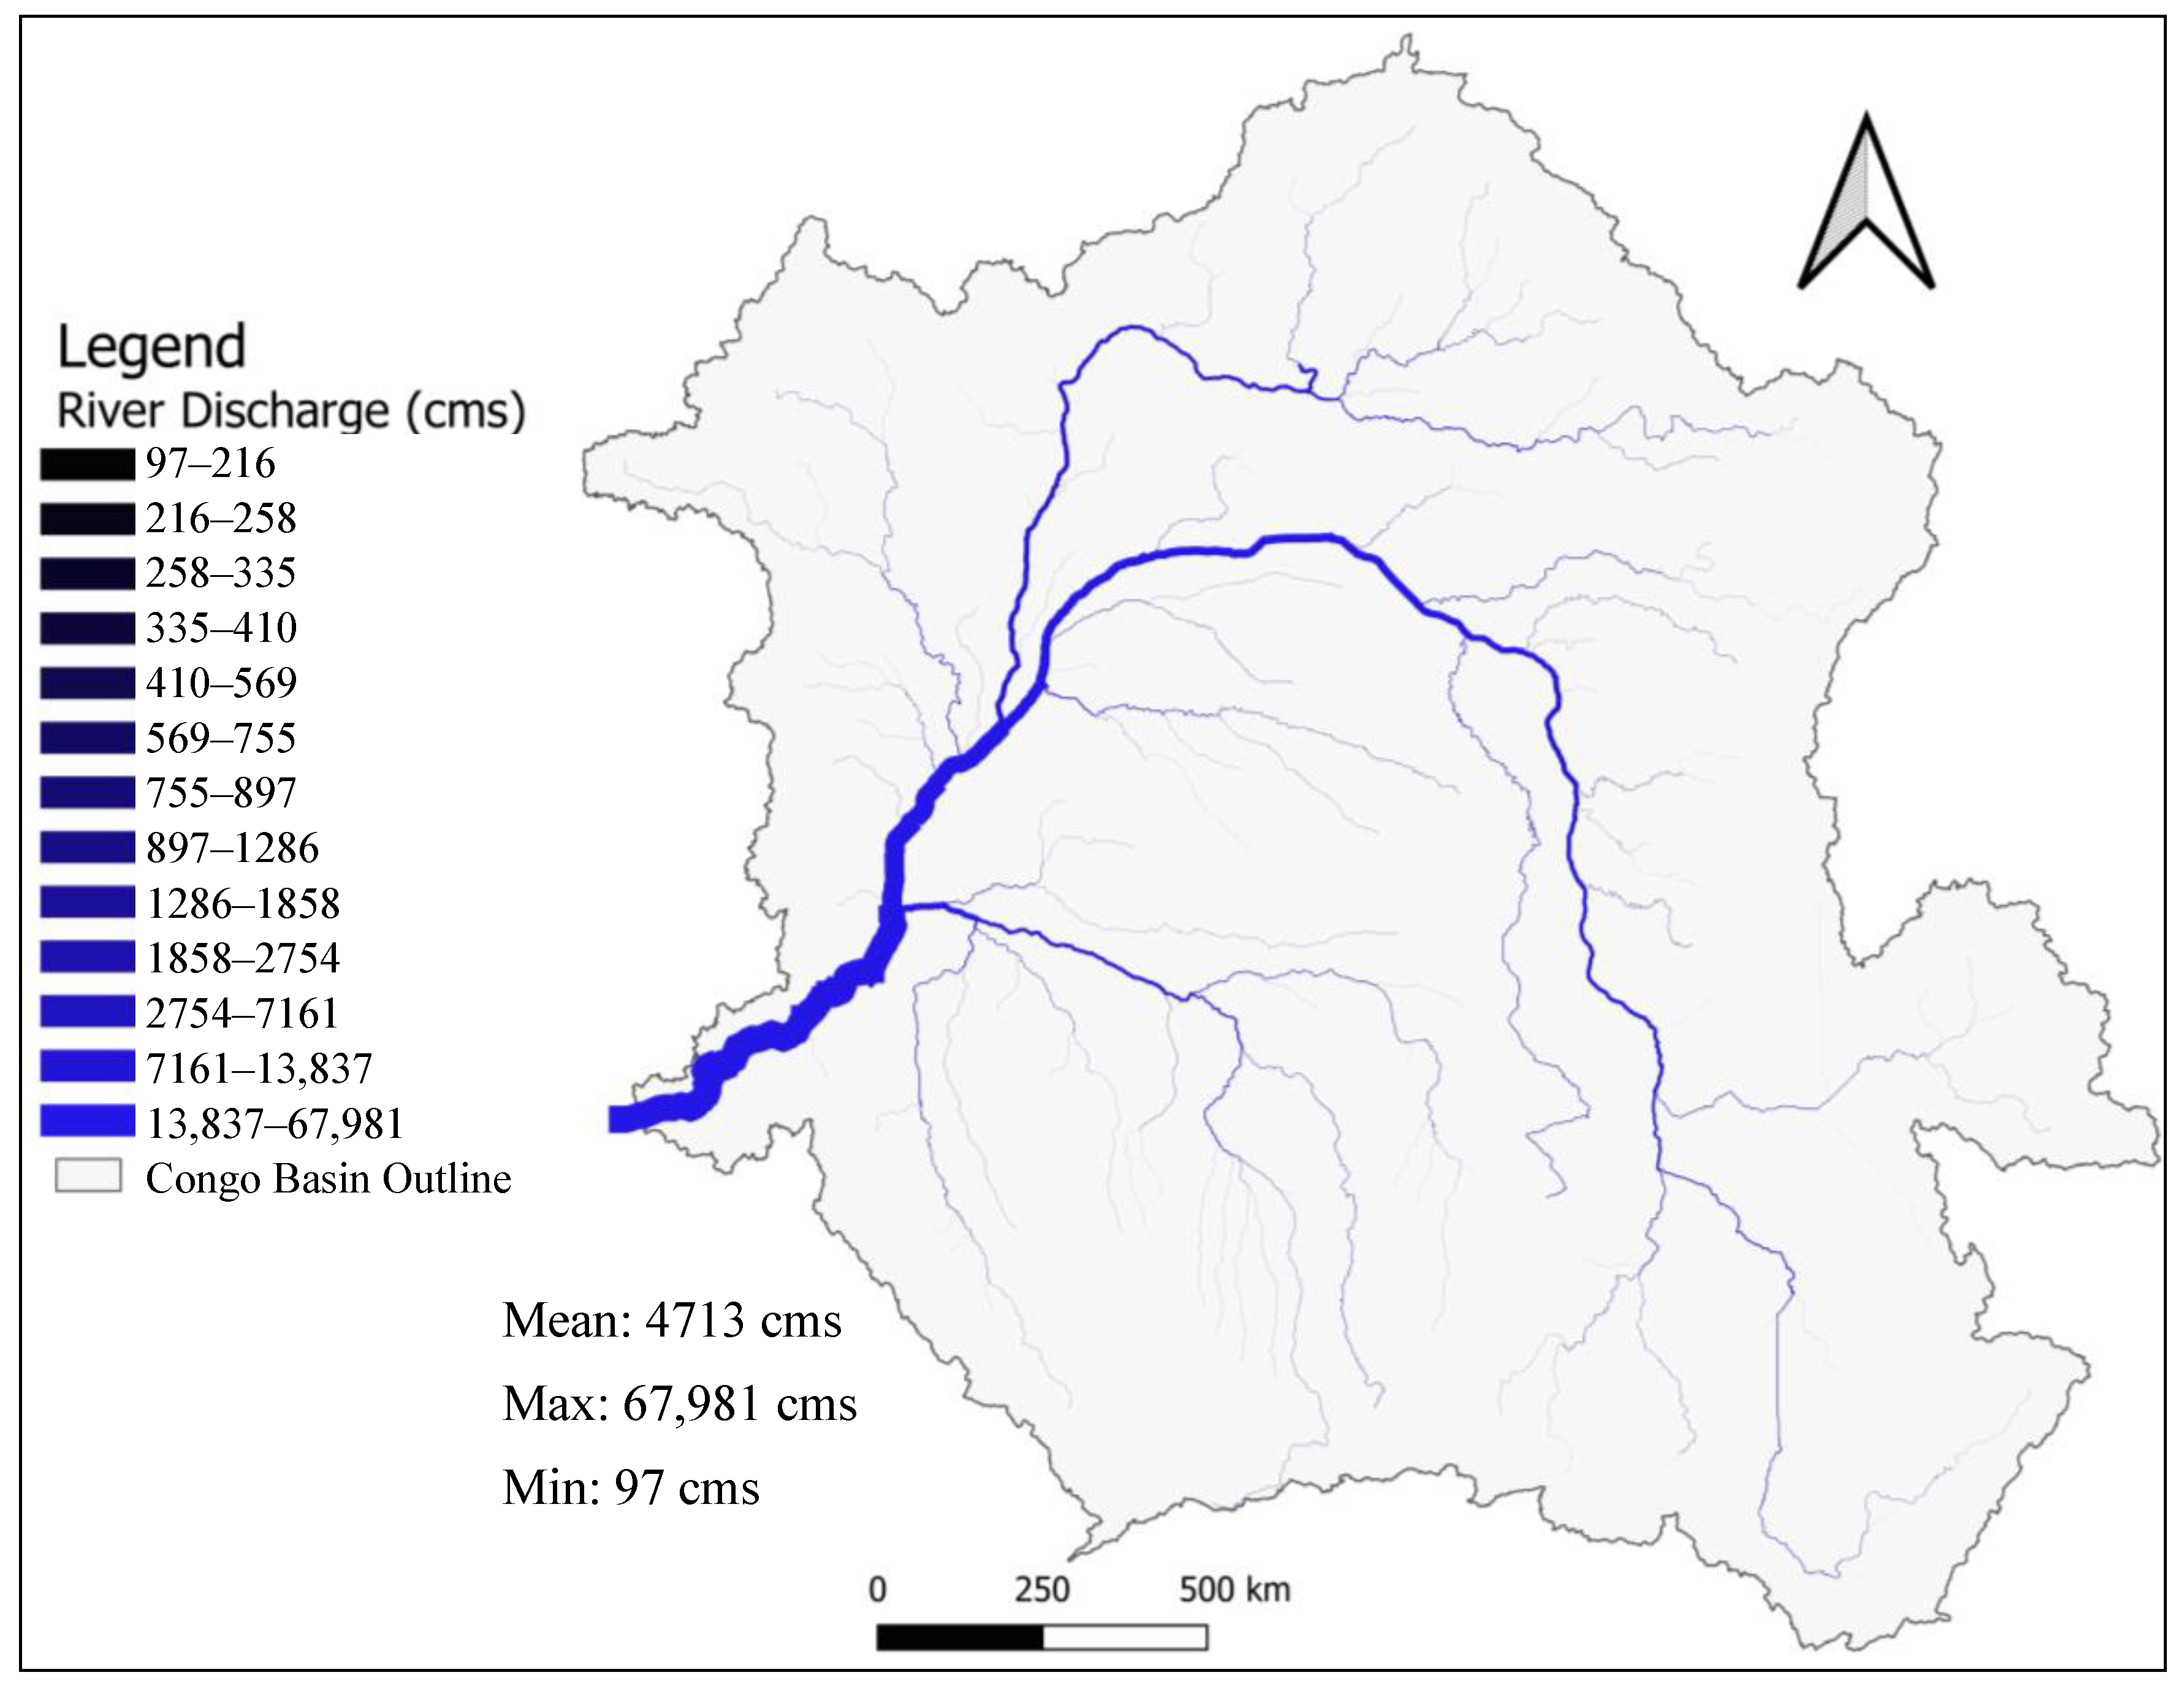
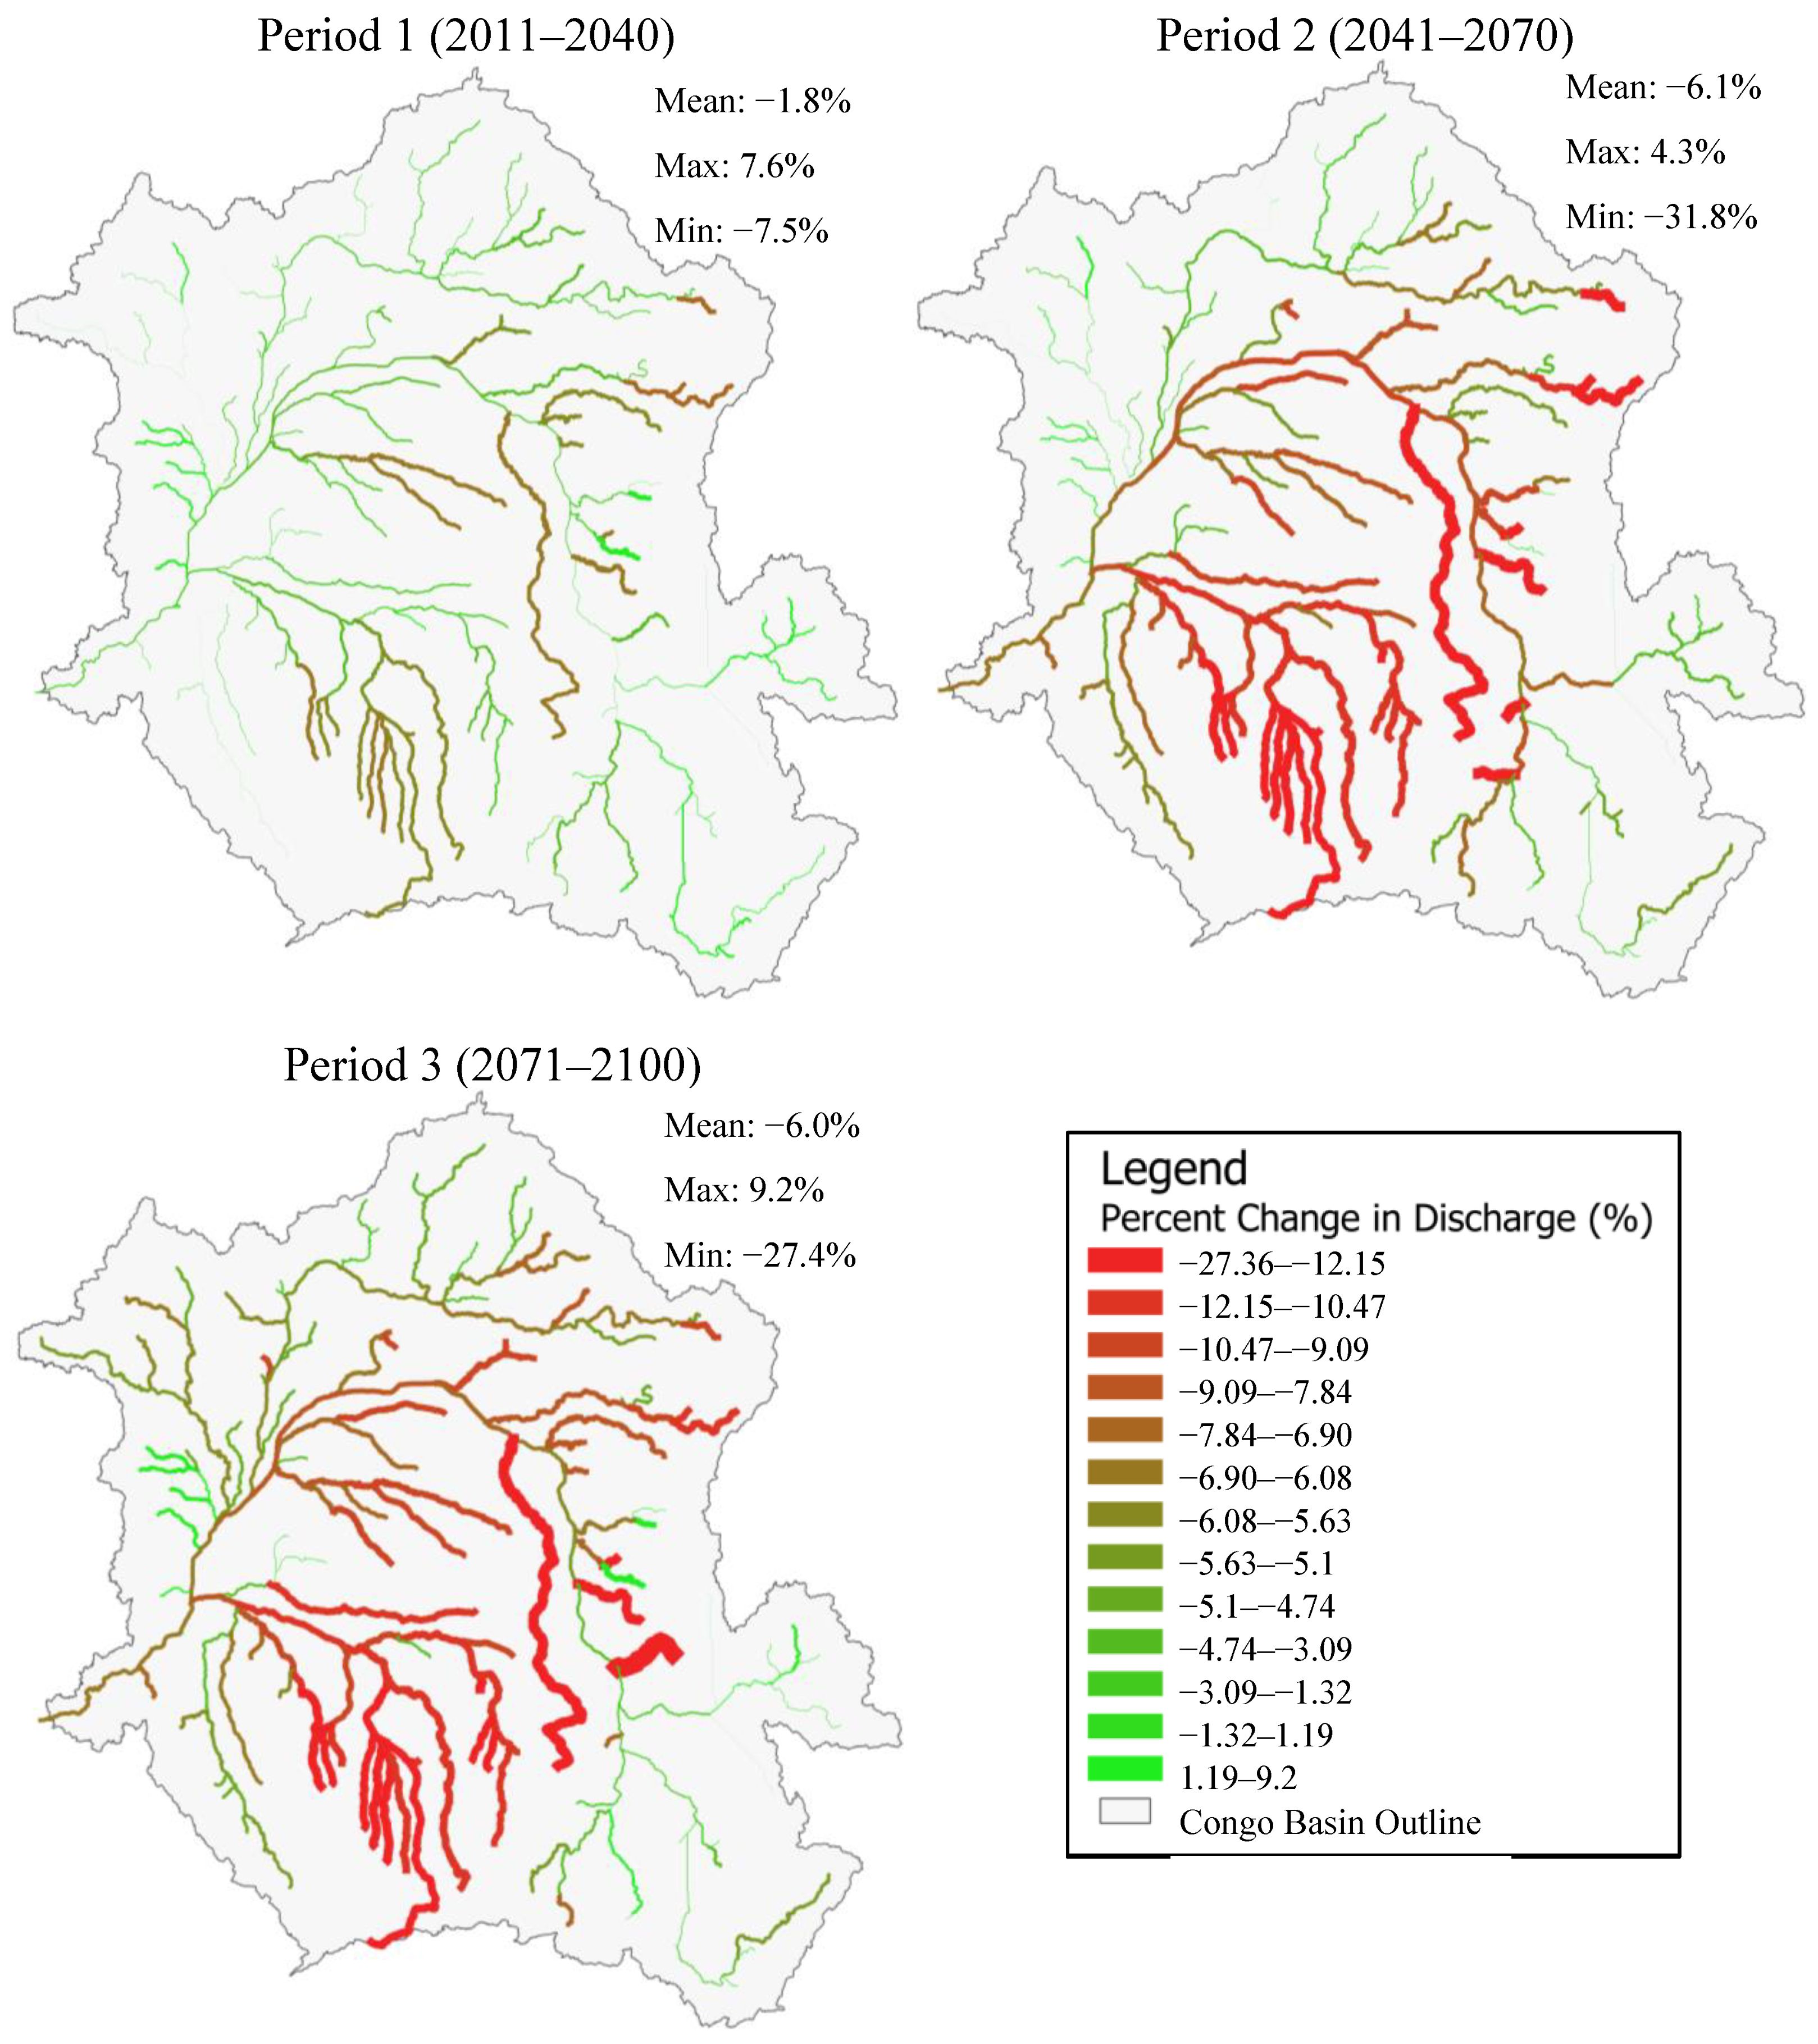
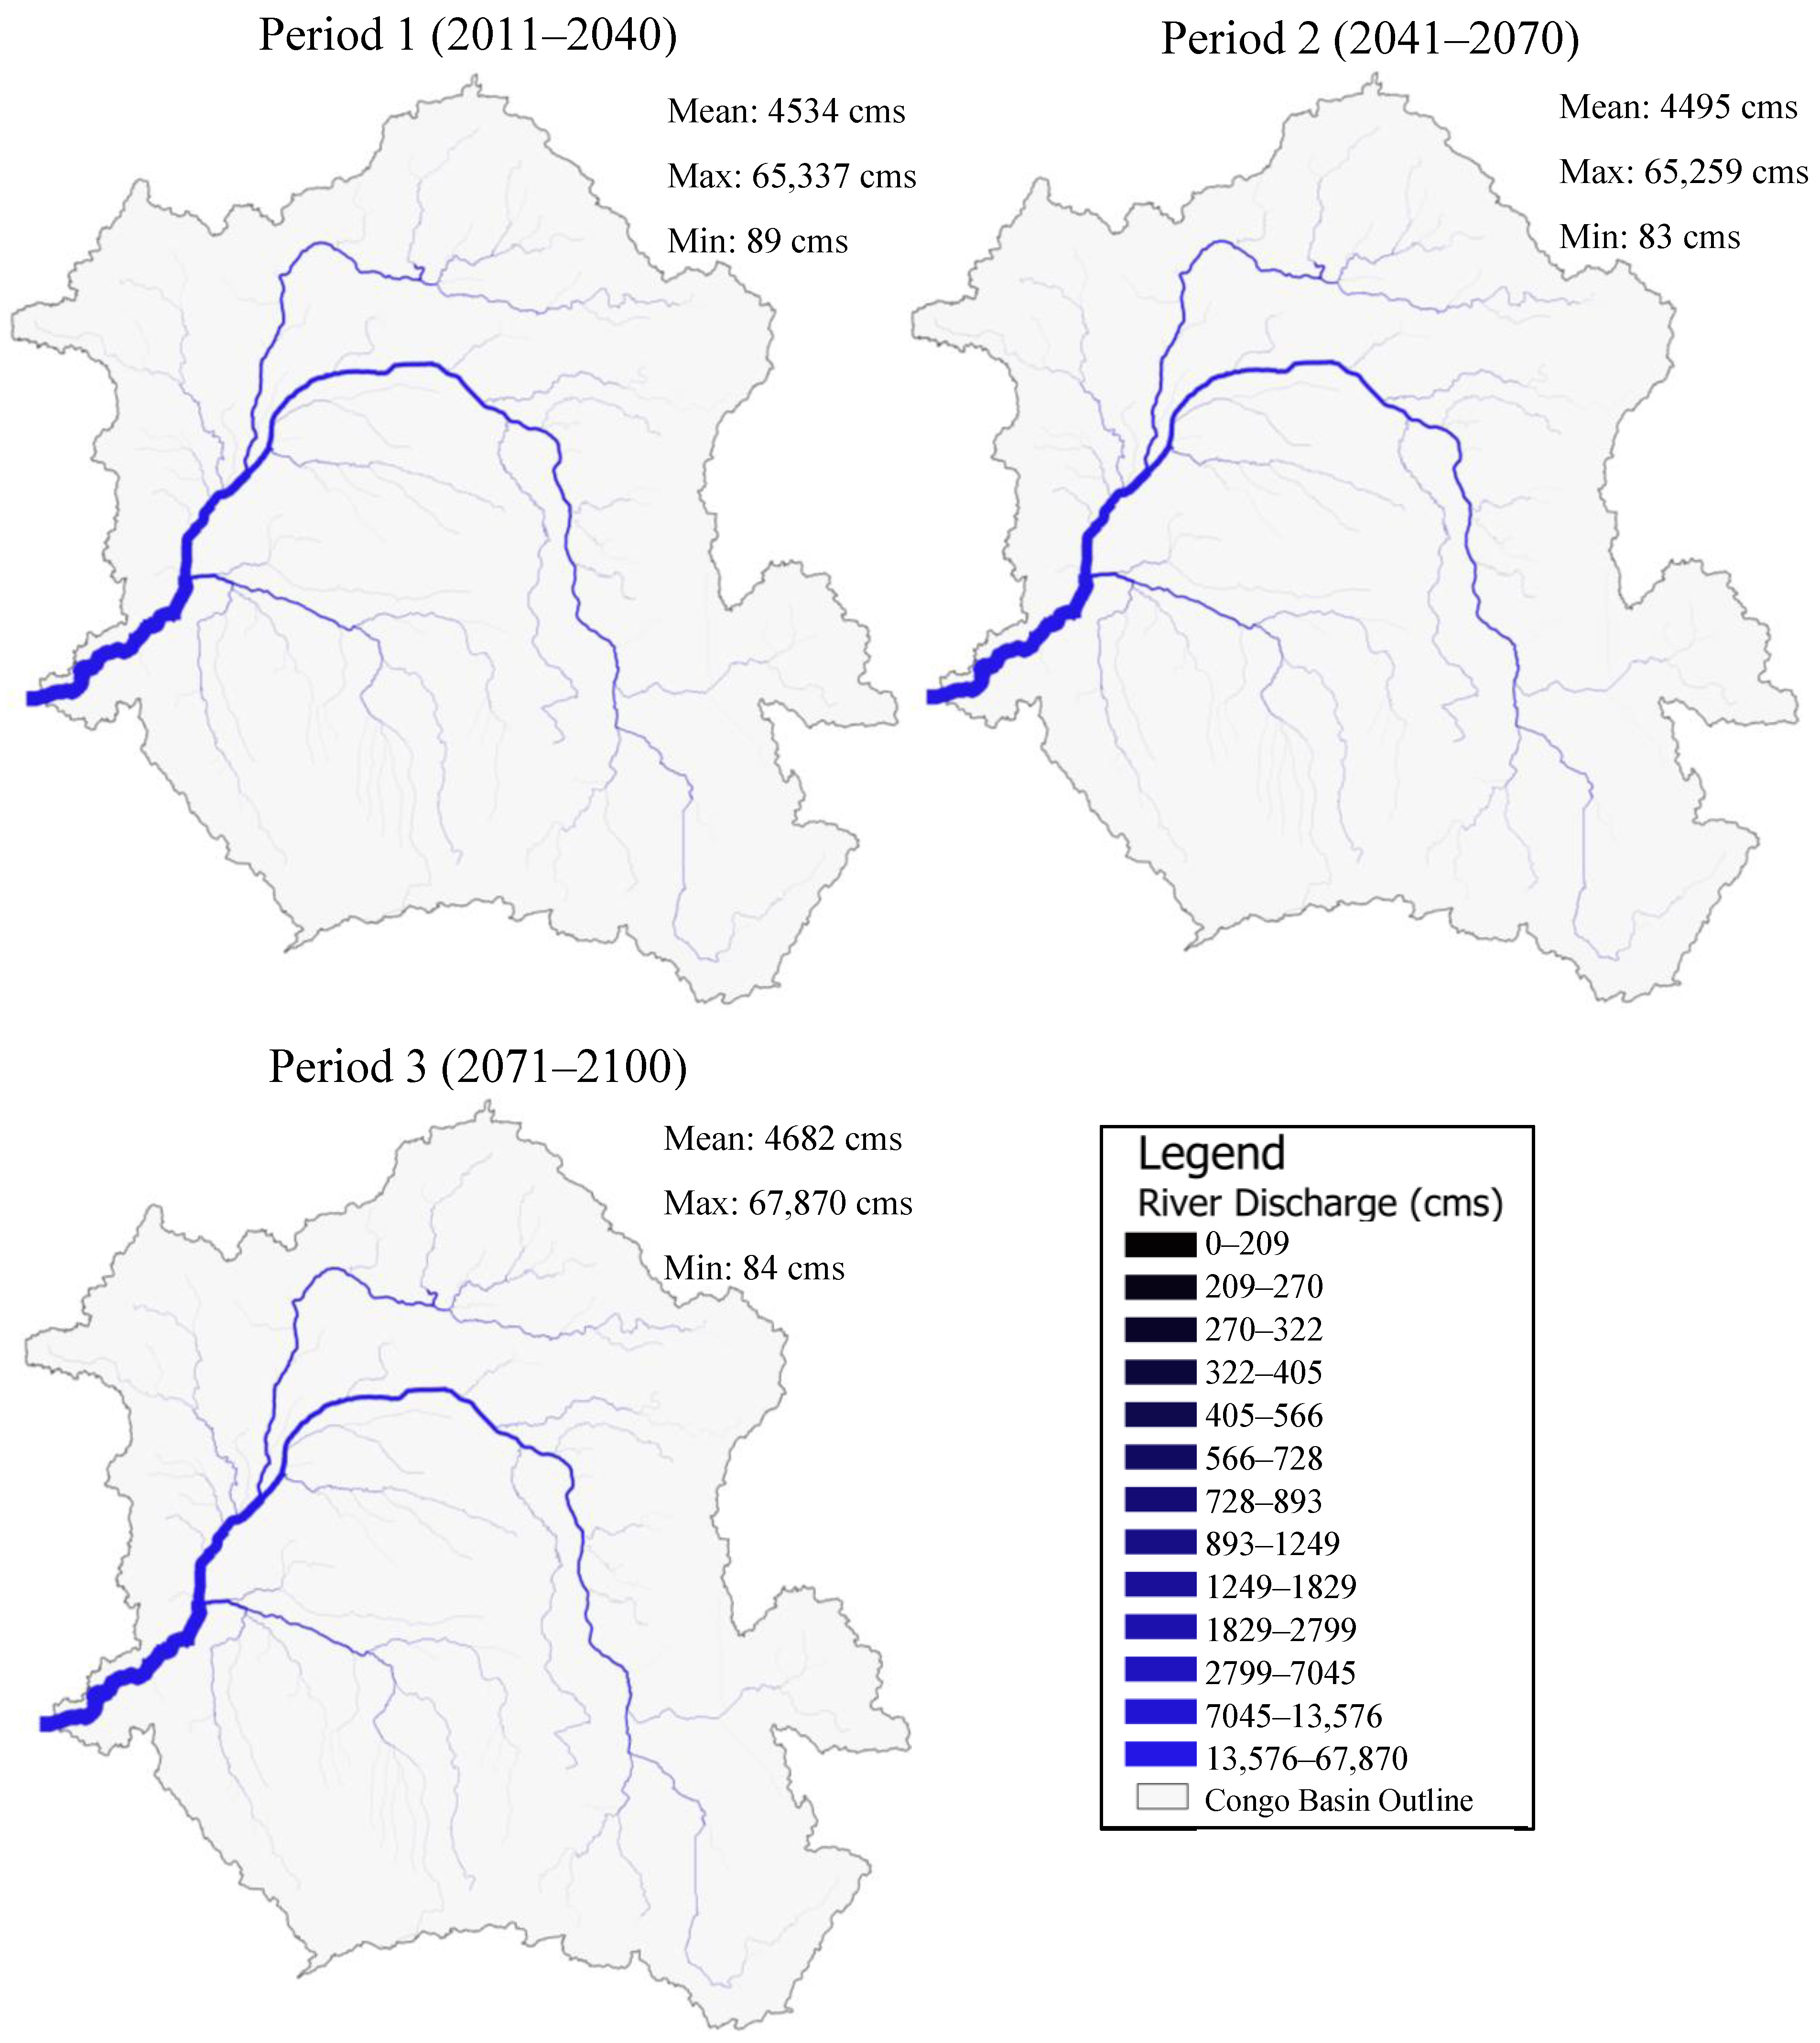
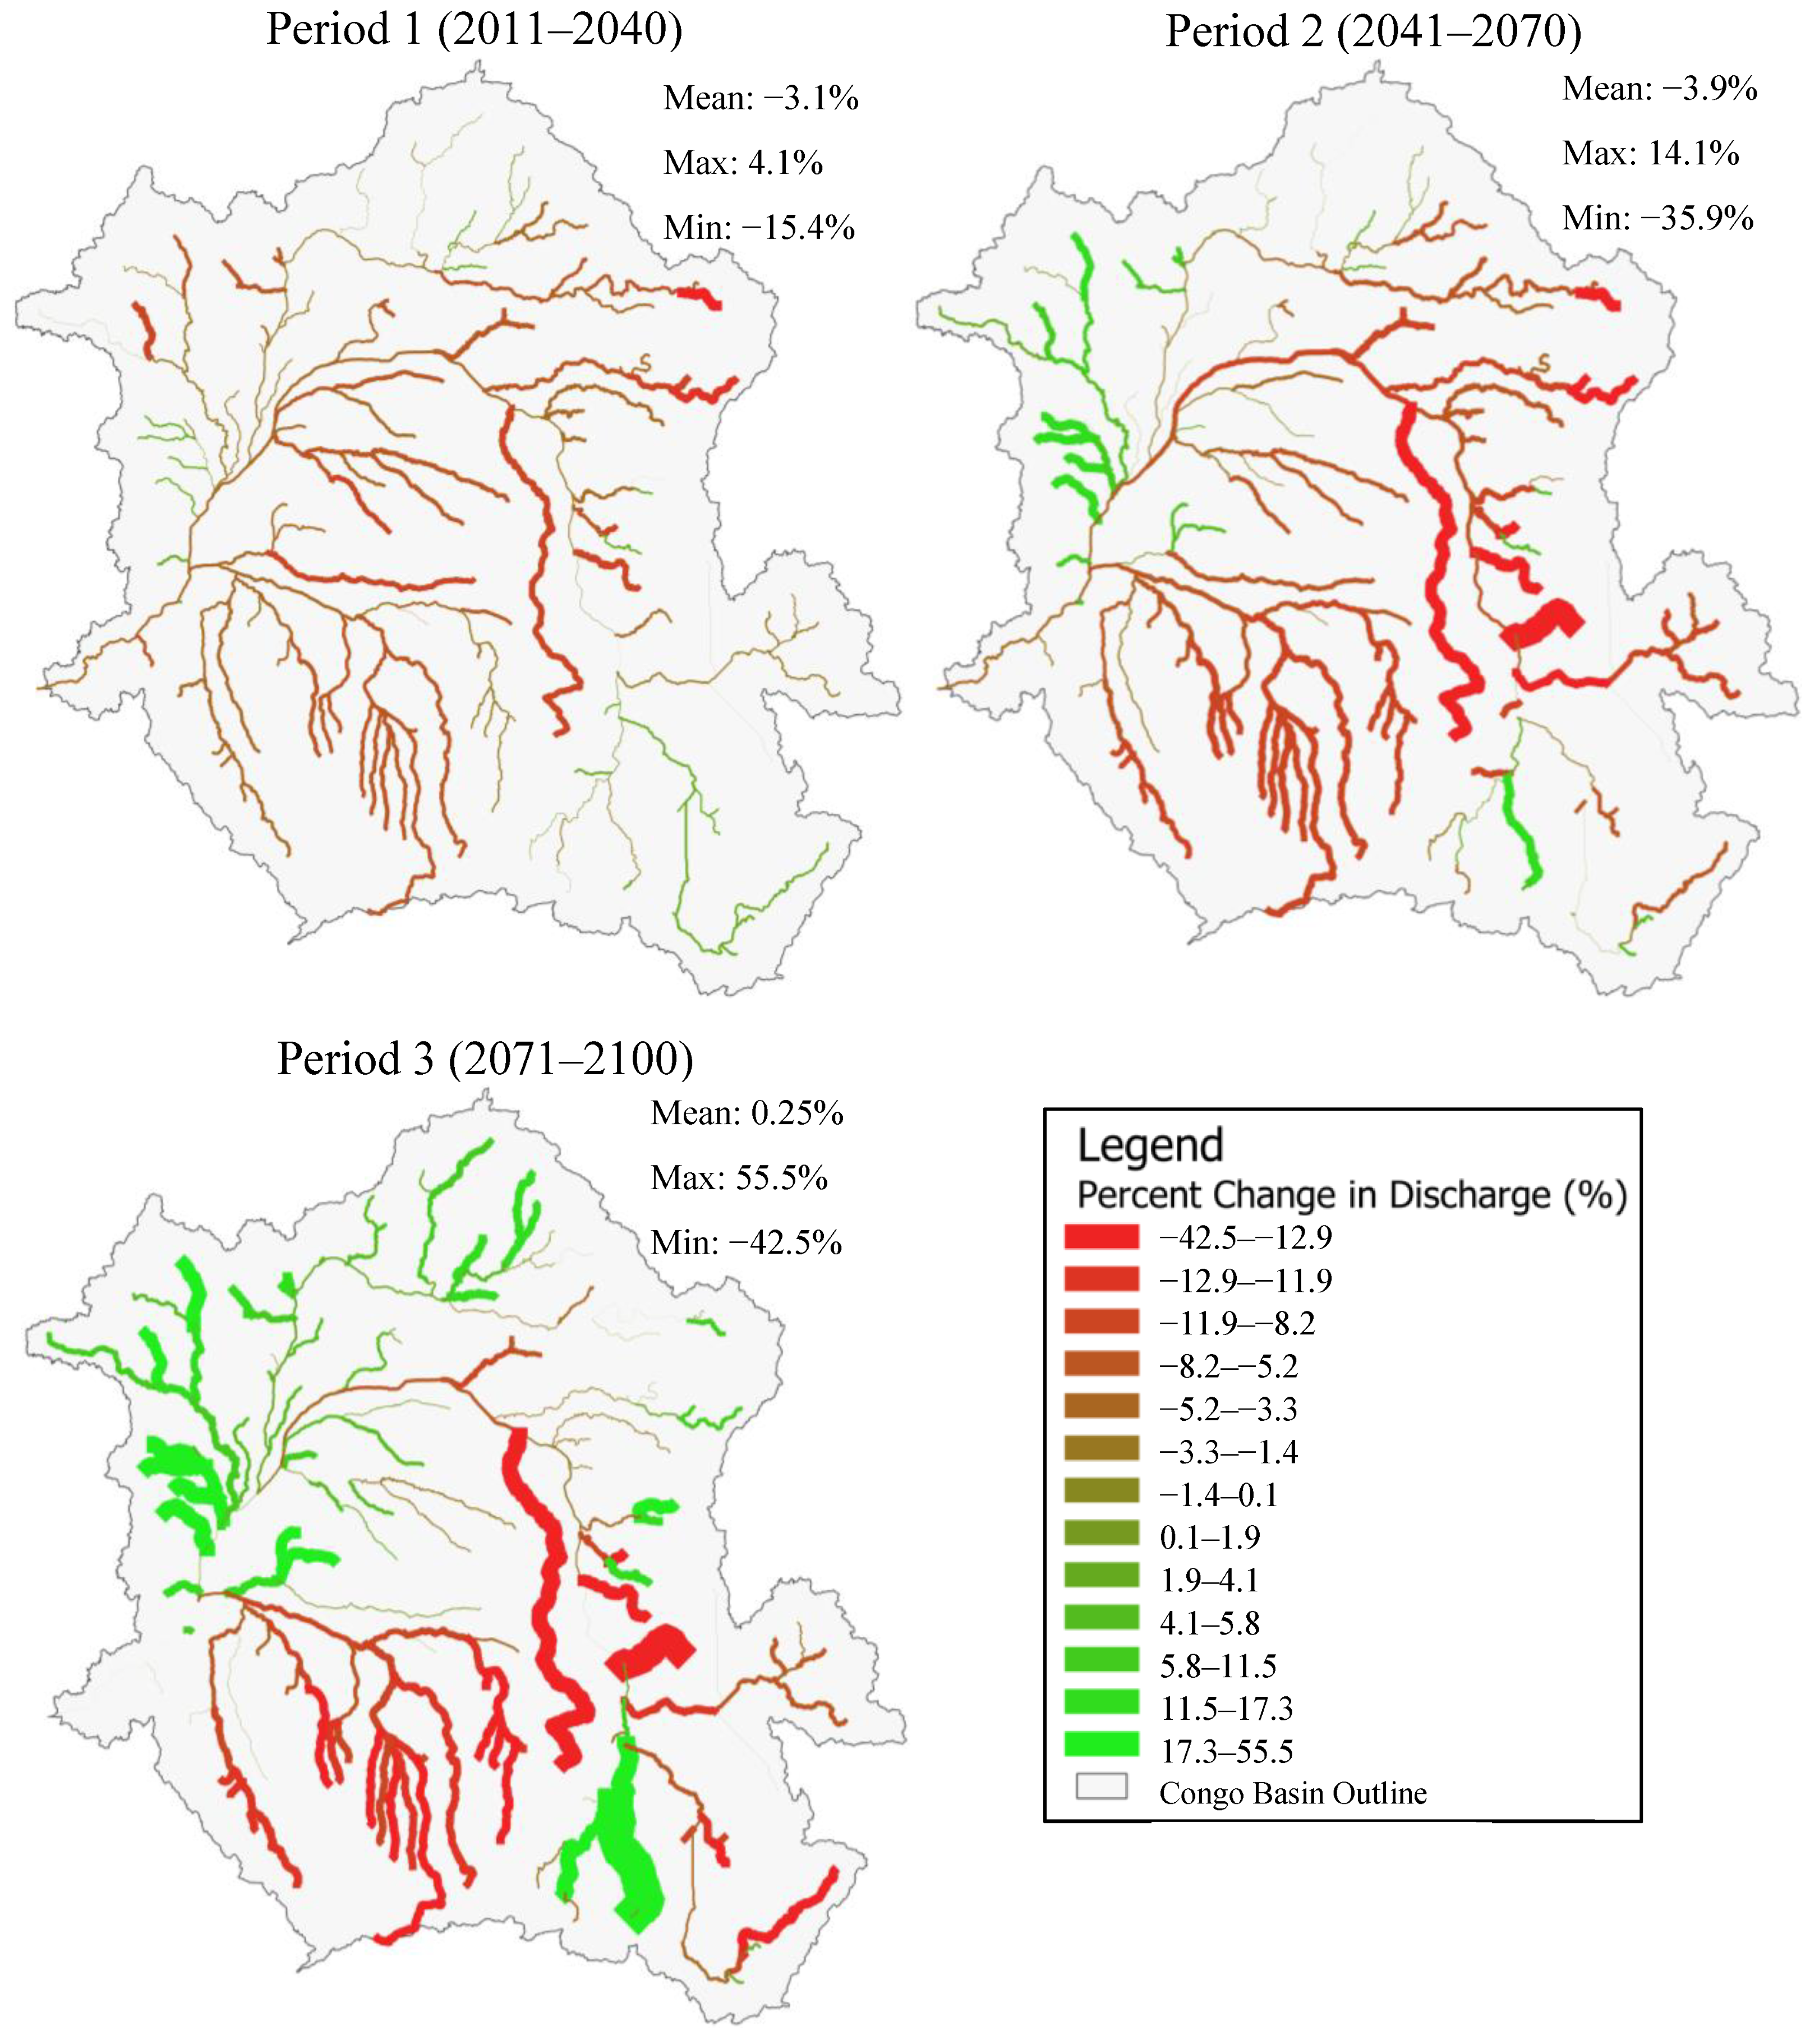
3.3. Projections for River Discharge
4. Discussion
4.1. Correlation with Climatological and Hydrological Studies
4.2. Potential Impacts of Projected Changes
5. Conclusions
Author Contributions
Funding
Informed Consent Statement
Data Availability Statement
Conflicts of Interest
References
- Tshimanga, R.M.; Bola, G.B.; Kabuya, P.M.; Nkaba, L.; Neal, J.; Hawker, L.; Trigg, M.A.; Bates, P.D.; Hughes, D.A.; Laraque, A.; et al. Towards a framework of catchment classification for hydrologic predictions and water resources management in the ungauged basin of the Congo River: An a priori approach. In Congo Basin Hydrology, Climate, and Biogeochemistry: A Foundation for the Future; Chapter 25; American Geophysical Union: Washington, DC, USA, 2022; pp. 469–498. [Google Scholar]
- Malhi, Y.; Wright, J. Spatial patterns and recent trends in the climate of tropical rainforest regions. Philos. Trans. R. Soc. Lond. 2004, 359, 311–329. [Google Scholar] [CrossRef]
- World Bank. World Bank Group Macroeconomic Models for Climate Policy Analysis; World Bank: Washington, DC, USA, 2022. [Google Scholar]
- Lewis, S.L.; Lopez-Gonzalez, G.; Sonké, B.; Affum-Baffoe, K.; Baker, T.R.; Ojo, L.O.; Phillips, O.L.; Reitsma, J.M.; White, L.; Comiskey, J.A.; et al. Increasing carbon storage in intact African tropical forests. Nature 2009, 457, 1003–1006. [Google Scholar] [CrossRef]
- Malhi, Y.; Adu-Bredu, S.; Asare, R.A.; Lewis, S.L.; Mayaux, P. African rainforests: Past, present and future. Philos. Trans. R. Soc. B Biol. Sci. 2013, 368, 20120312. [Google Scholar] [CrossRef]
- Creese, A.; Washington, R.; Jones, R. Climate change in the Congo Basin: Processes related to wetting in the December–February dry season. J. Clim. Dyn. 2019, 53, 3583–3602. [Google Scholar] [CrossRef]
- Tshimanga, R.M.; Hughes, D.A. Basin-scale performance of a semi distributed rainfall-runoff model for hydrological predictions and water resources assessment of large rivers: The Congo River. J. Hydrol. 2014, 50, 1174–1188. [Google Scholar]
- EM-DAT; CRED. The Emergency Events Database. Available online: www.emdat.be (accessed on 4 August 2021).
- Sridhar, V.; Kang, H.; Ali, S.A.; Bola, G.B.; Tshimanga, R.M.; Lakshmi, V. Water Budgets and Droughts under Current and Future Conditions in the Congo River Basin. In Congo Basin Hydrology, Climate, and Biogeochemistry: A Foundation for the Future; American Geophysical Union: Washington, DC, USA, 2022. [Google Scholar]
- Dos Santos, V.; Oliveira, R.J.; Datok, P.; Sauvage, S.; Paris, A.; Gosset, M.; Sánchez-Pérez, J.M. Evaluating the performance of multiple satellite-based precipitation products in the Congo River Basin using the SWAT model. J. Hydrol. Reg. Stud. 2022, 42, 101168. [Google Scholar] [CrossRef]
- Kitambo, B.; Papa, F.; Paris, A.; Tshimanga, R.; Calmant, S.; Frappart, F. Large-scale spatio-temporal variability of the Congo Basin surface hydrologic components from space. In Proceedings of the EGU General Assembly 2022, Vienna, Austria, 23–27 May 2022. [Google Scholar]
- Čerkasova, N.; Umgiesser, G.; Ertürk, A. Development of a hydrology and water quality model for a large transboundary river watershed to investigate the impacts of climate change—A SWAT application. J. Ecol. Eng. 2018, 124, 99–115. [Google Scholar] [CrossRef]
- Park, J.Y.; Jung, H.; Jang, C.H.; Kim, S.J. Assessing climate change impact on hydrological components of Yongdam dam watershed using RCP emission scenarios and SWAT model. J. Korean Soc. Agric. Eng. 2014, 56, 19–29. [Google Scholar]
- Anjum, M.N.; Ding, Y.; Shangguan, D. Simulation of the projected climate change impacts on the river flow regimes under CMIP5 RCP scenarios in the westerlies dominated belt, northern Pakistan. Atmos. Res. 2019, 227, 233–248. [Google Scholar] [CrossRef]
- Weedon, G.P.; Balsamo, G.; Bellouin, N.; Gomes, S.; Best, M.J.; Viterbo, P. The WFDEI Meteorological Forcing Data. Research Data Archive at the National Center for Atmospheric Research, Computational and Information Systems Laboratory. 2018. Available online: https://rda.ucar.edu/datasets/ds314.2/ (accessed on 31 February 2022).
- Le Page, M.; Gosset, C.; Oueslati, I.; Calvez, R.; Zribi, M.; Chabaane, Z.L. Comparison of meteorological forcing (WFDEI, AGRI4CAST) to in-situ observations in a semi arid catchment. The case of Merguellil in Tunisia. In Proceedings of the EGU General Assembly 2015, Vienna, Austria, 12–17 April 2015; p. 12609. [Google Scholar]
- Giorgi, F.; Gutowski, W.J., Jr. Regional dynamical downscaling and the CORDEX initiative. Annu. Rev. Environ. Resour. 2015, 40, 467–490. [Google Scholar] [CrossRef]
- Hakala, K.; Addor, N.; Seibert, J. Hydrological modeling to evaluate climate model simulations and their bias correction. J. Hydrometeorol. 2018, 19, 1321–1337. [Google Scholar] [CrossRef]
- Karam, S.; Seidou, O.; Nagabhatla, N.; Perera, D.; Tshimanga, R.M. Assessing the impacts of climate change on climatic extremes in the Congo River Basin. J. Clim. Change 2022, 170, 40. [Google Scholar] [CrossRef]
- Arnold, J.G.; Srinivasan, R.; Muttiah, R.S.; Williams, J.R. Large area hydrologic modeling and assessment part I: Model development. JAWRA J. Am. Water Resour. Assoc. 1998, 34, 73–89. [Google Scholar] [CrossRef]
- Pan, Y.; Liao, J.; Peng, R.; Wang, H. River direction prediction of Shuangliu District Fu River based on ArcSWAT model. J. Phys. Conf. Ser. 2022, 2277, 012004. [Google Scholar] [CrossRef]
- Arnold, J.G.; Moriasi, D.N.; Gassman, P.W.; Abbaspour, K.C.; White, M.J.; Srinivasan, R.; Santhi, C.; Harmel, R.D.; Van Griensven, A.; Van Liew, M.W.; et al. SWAT: Model use, calibration, and validation. Trans. ASABE 2012, 55, 1491–1508. [Google Scholar] [CrossRef]
- Neitsch, S.L.; Arnold, J.G.; Kiniry, J.R.; Williams, J.R. Soil and Water Assessment Tool Theoretical Documentation Version 2009; Texas Water Resources Institute: Temple, TX, USA, 2011. [Google Scholar]
- Nash, J.E.; Sutcliffe, J.V. River flow forecasting through conceptual models part I—A discussion of principles. J. Hydrol. 1970, 10, 282–290. [Google Scholar] [CrossRef]
- Gupta, H.V.; Sorooshian, S.; Yapo, P.O. Status of automatic calibration for hydrologic models: Comparison with multilevel expert calibration. J. Hydrol. Eng. 1999, 4, 135–143. [Google Scholar] [CrossRef]
- Moriasi, D.N.; Arnold, J.G.; Van Liew, M.W.; Bingner, R.L.; Harmel, R.D.; Veith, T.L. Model evaluation guidelines for systematic quantification of accuracy in watershed simulations. Trans. ASABE 2007, 50, 885–900. [Google Scholar] [CrossRef]
- Abbaspour, K. User Manual for SWAT-CUP, SWAT Calibration and Uncertainty Analysis Programs; Swiss Federal Institute of Aquatic Science and Technology: Dübendorf, Switzerland, 2007. [Google Scholar]
- Verhagen, A.P.; Ostelo, R.W.; Rademaker, A. Is the p value really so significant? Aust. J. Physiother. 2004, 50, 261–262. [Google Scholar] [CrossRef]
- Zango, B.S.; Seidou, O.; Sartaj, M.; Nakhaei, N.; Stiles, K. Impacts of urbanization and climate change on water quantity and quality in the Carp River watershed. J. Water Clim. Change 2022, 13, 786–816. [Google Scholar] [CrossRef]
- Abbaspour, K.C.; Rouholahnejad, E.; Vaghefi, S.R.; Srinivasan, R.; Yang, H.; Kløve, B. A continental-scale hydrology and water quality model for Europe: Calibration and uncertainty of a high-resolution large-scale SWAT model. J. Hydrol. 2015, 524, 733–752. [Google Scholar] [CrossRef]
- El-Khoury, A.; Seidou, O.; Lapen, D.R.; Que, Z.; Mohammadian, M.; Sunohara, M.; Bahram, D. Combined impacts of future climate and land use changes on discharge, nitrogen and phosphorus loads for a Canadian river basin. J. Hydrol. 2015, 151, 76–86. [Google Scholar] [CrossRef] [PubMed]
- Khoi, D.N.; Thom, V.T. Parameter uncertainty analysis for simulating streamflow in a river catchment of Vietnam. Global ecology and conservation. Glob. Ecol. Conserv. 2015, 4, 538–548. [Google Scholar] [CrossRef]
- Sharma, V.C.; Regonda, S.K. Multi-spatial resolution rainfall-runoff modelling—A case study of Sabari river basin, India. Water 2021, 13, 1224. [Google Scholar] [CrossRef]
- Tshimanga, R.M.; Hughes, D.A. Climate change and impacts on the hydrology of the Congo Basin: The case of the northern sub-basins of the Oubangui and Sangha Rivers. Phys. Chem. Earth Parts A/B/C 2012, 1, 72–83. [Google Scholar] [CrossRef]
- Aloysius, N.; Saiers, J. Simulated hydrologic response to projected changes in precipitation and temperature in the Congo River basin. Hydrol. Earth Syst. Sci. 2017, 21, 4115–4130. [Google Scholar] [CrossRef]


| No. | Driving GCM | GCM Institute | RCM | RCM Institute |
|---|---|---|---|---|
| 1 | Canadian Earth System Model Version 2 | Canadian Centre for Climate Modeling and Analysis | Canadian Regional Climate Model 4 | Canadian Centre for Climate Modeling and Analysis |
| 2 | Canadian Earth System Model Version 2 | Canadian Centre for Climate Modeling and Analysis | Rossby Centre regional atmospheric model, version 4 | Swedish Meteorological and Hydrological Institute |
| 3 | Centre National de Recherches Météorologiques, Climate Model 5 | National Centre for Meteorological Research | Rossby Centre regional atmospheric model, version 4 | Swedish Meteorological and Hydrological Institute |
| 4 | Queensland Climate Change Centre of Excellence (QCCCE) and Commonwealth Scientific and Industrial Research Organization (CSIRO) | The Commonwealth Scientific and Industrial Research Organization | Rossby Centre regional atmospheric model, version 4 | Swedish Meteorological and Hydrological Institute |
| 5 | European community Earth-System Model | Irish Centre for High-End Computing | Rossby Centre regional atmospheric model, version 4 | Swedish Meteorological and Hydrological Institute |
| 6 | Institut Pierre Laplace Climate Model version 5A | Institute Pierre Simon Laplace | Rossby Centre regional atmospheric model, version 4 | Swedish Meteorological and Hydrological Institute |
| 7 | Model for Interdisciplinary Research on Climate, version 5 | Center for Climate System Research/National Institute for Environmental Studies/Frontier Research Center for Global Chance, Japan Agency for Marine-Earth Science and Technology | Rossby Centre regional atmospheric model, version 4 | Swedish Meteorological and Hydrological Institute |
| 8 | Max Plank Institute Earth System Model | Max Planck Institute for Meteorology | Rossby Centre regional atmospheric model, version 4 | Swedish Meteorological and Hydrological Institute |
| 9 | Norwegian Earth System Model | Norwegian Climate Centre | Rossby Centre regional atmospheric model, version 4 | Swedish Meteorological and Hydrological Institute |
| 10 | Geophysical Fluid Research Laboratory Earth System Model | National Oceanic and Atmospheric Administration-Geophysical Fluid Dynamics Laboratory | Rossby Centre regional atmospheric model, version 4 | Swedish Meteorological and Hydrological Institute |
| Land Use/Cover Type | SWAT Code | Area (%) |
|---|---|---|
| 1. Water | WATR | 2.70 |
| 2. Residential area (urban) | URMD | 0.02 |
| 3. Dryland cropland and pasture | CRDY | 3.87 |
| 4. Mosaic cropland/grassland | CRGR | 0.12 |
| 5. Mosaic cropland/woodland | CRWO | 7.15 |
| 6. Grassland | GRAS | 0.19 |
| 7. Shrubland | SHRB | 0.31 |
| 8. Savanna | SAVA | 28.27 |
| 9. Deciduous broad-leaf forest | FODB | 13.70 |
| 10. Evergreen broad-leaf forest | FOEB | 42.89 |
| 11. Mixed forest | FOMI | 0.18 |
| 12. Barren or sparsely vegetated | BSVG | 0.58 |
| Satisfactory | Good | Very Good | |
|---|---|---|---|
| NS | 0.5–0.7 | 0.7–0.8 | 0.8–1.0 |
| PBIAS (%) | 15–25 | 10–15 | Less than 10% |
| Parameter Name | Parameter Description | Variation Range |
|---|---|---|
| r_HRU_SLP.hru | Average slope steepness (m/m) | 0.1–0.5 |
| r_ESCO.bsn | Soil evaporation compensation factor | 0.1–0.5 |
| r_EPCO.bsn | Plant uptake compensation factor | 0.1–0.4 |
| r_REVAPMN.gw | Threshold depth of water in the shallow aquifer for ‘revap’ to occur (mm) | 0.1–1.0 |
| r_GWQMN.gw | Threshold water depth in the shallow aquifer for flow | 0–0.5 |
| r_GW_REVAP.gw | Groundwater ‘revap’ coefficient | −0.1–0.1 |
| r_SOL_AWC.sol | Available water capacity | −0.5–0.1 |
| r_ESCO.hru | Soil evaporation compensation factor | 0–0.3 |
| r_ALPHA_BF.gw | Baseflow alpha factor | 0.01–1 |
| r_CN2.mgt | Initial SCS CNII value | −0.2–0.5 |
| r_RCHRG_DP.gw | Deep aquifer percolation fraction | 0–10 |
| r_SOL_BD.sol | Moist bulk density (Mg/m3 or g/cm3) | 0.01–2.0 |
| Parameter Name | t-Stat | p-Value | Rank |
|---|---|---|---|
| r_RCHRG_DP.gw | −0.09 | 0.92 | 1 (most sensitive) |
| r_SOL_AWC.sol | −0.06 | 0.95 | 2 |
| r_SOL_BD.sol | −0.05 | 0.96 | 3 |
| r_CN2.mgt | −0.04 | 0.97 | 4 |
| r_REVAPMN.gw | −0.02 | 0.97 | 5 |
| r_GW_REVAP.gw | 0.03 | 0.97 | 6 |
| r_GWQMN.gw | −0.02 | 0.98 | 7 |
| r_EPCO.bsn | 0.01 | 0.99 | 8 |
| r_ESCO.hru | 0.01 | 0.99 | 9 |
| r_ALPHA_BF.gw | 0.01 | 0.99 | 10 |
| r_ESCO.bsn | 0.01 | 0.99 | 11 |
| r_HRU_SLP.hru | 0.00 | 0.99 | 12 (least sensitive) |
| Parameters | Optimal Fitted Values |
|---|---|
| r_HRU_SLP.hru | 0.447 |
| r_ESCO.bsn | 0.345 |
| r_EPCO.bsn | 0.249 |
| r_REVAPMN.gw | 0.917 |
| r_GWQMN.gw | 0.194 |
| r_GW_REVAP.gw | −0.068 |
| r_SOL_AWC.sol | −0.362 |
| r_ESCO.hru | 0.140 |
| r_ALPHA_BF.gw | 0.268 |
| r_CN2.mgt | −0.298 |
| r_RCHRG_DP.gw | 7.979 |
| r_SOL_BD.sol | 1.360 |
Disclaimer/Publisher’s Note: The statements, opinions and data contained in all publications are solely those of the individual author(s) and contributor(s) and not of MDPI and/or the editor(s). MDPI and/or the editor(s) disclaim responsibility for any injury to people or property resulting from any ideas, methods, instructions or products referred to in the content. |
© 2023 by the authors. Licensee MDPI, Basel, Switzerland. This article is an open access article distributed under the terms and conditions of the Creative Commons Attribution (CC BY) license (https://creativecommons.org/licenses/by/4.0/).
Share and Cite
Karam, S.; Zango, B.-S.; Seidou, O.; Perera, D.; Nagabhatla, N.; Tshimanga, R.M. Impacts of Climate Change on Hydrological Regimes in the Congo River Basin. Sustainability 2023, 15, 6066. https://doi.org/10.3390/su15076066
Karam S, Zango B-S, Seidou O, Perera D, Nagabhatla N, Tshimanga RM. Impacts of Climate Change on Hydrological Regimes in the Congo River Basin. Sustainability. 2023; 15(7):6066. https://doi.org/10.3390/su15076066
Chicago/Turabian StyleKaram, Sara, Baba-Serges Zango, Ousmane Seidou, Duminda Perera, Nidhi Nagabhatla, and Raphael M. Tshimanga. 2023. "Impacts of Climate Change on Hydrological Regimes in the Congo River Basin" Sustainability 15, no. 7: 6066. https://doi.org/10.3390/su15076066
APA StyleKaram, S., Zango, B.-S., Seidou, O., Perera, D., Nagabhatla, N., & Tshimanga, R. M. (2023). Impacts of Climate Change on Hydrological Regimes in the Congo River Basin. Sustainability, 15(7), 6066. https://doi.org/10.3390/su15076066