You are currently viewing a new version of our website. To view the old version click .
Sustainability
  • Article
  • Open Access

30 March 2023

Utilization of Stockwell Transform, Support Vector Machine and D-STATCOM for the Identification, Classification and Mitigation of Power Quality Problems

,
,
,
,
,
,
,
and
1
Department of Electrical and Computer Engineering, Hawassa University, Hawassa 1530, Ethiopia
2
Department of Project Management, Universidad Internacional Iberoamericana, Campeche 24560, Mexico
3
Department of Electrical Engineering, College of Engineering, Majmaah University, Al-Majmaah 11952, Saudi Arabia
4
Department of Electrical and Computer Engineering, College of Engineering and Information Technology, Ajman University, Ajman 20550, United Arab Emirates
This article belongs to the Special Issue Advanced Research on Smart Grid, Energy Storage and Distribution Systems

Abstract

Power Quality (PQ) has become a significant issue in power networks. Power quality disturbances must be precisely and appropriately identified. This activity involves identifying, classifying, and mitigating power quality problems. A case study of the Awada industrial zone in Ethiopia is taken into consideration to show the practical applicability of the proposed work. It is found that the current harmonic distortion levels exceed the restrictions with a maximum percentage Total Harmonic Distortion of Current (THDI) value of up to 23.09%. The signal processing technique, i.e., Stockwell Transform (ST) is utilized for the identification of power quality issues, and it covers the most important and common power quality issues. The Support Vector Machine (SVM) method is used to categorize power quality issues, which enhances the classification procedure. The ST scored better in terms of accuracy than the Wavelet Transform (WT), Fourier Transform (FT), and Hilbert Transform (HT), obtaining 97.1%, as compared to 91.08%, 88.91%, and 86.8%, respectively. The maximum classification accuracy of SVM was 98.3%. To lower the current level of harmonic distortion in the industrial sector, a Distribution Static Compensator (D-STATCOM) is developed in the current control mode. To evaluate the performance of the D-STATCOM, the performance of the distribution network with and without D-STATCOM is simulated. The simulation results show that THDI is reduced to 4.36% when the suggested D-STATCOM is applied in the system.

1. Introduction

Electricity is delivered from the transmission system to individual consumers at the electric power distribution stage, which is the last in the process. Power transformers, distribution conductors, distribution feeders, and main service conductors make up a typical power distribution system [1]. Circuit breakers, protection devices, reclosers, capacitor banks, voltage regulators, metering equipment, etc. are also included in a distribution system. Through the distribution system, the power travels to industrial, commercial, and residential centers. From the distribution substation, feeders extend outward to transport electricity to clients [2]. Distribution transformers at strategic points along the distribution system reduce voltage to the standard 400 volts three-phase or 230 volts single-phase supply needed by the majority of customers [3]. For assessing the level of power quality and implementing effective alleviation measures, numerous power quality evaluations must be carried out at various points along the distribution system [4].
To analyze power quality and its disturbances, it is required to quickly, accurately, and correctly identify these disturbances. In order to take action and eliminate these disruptions, it is also critical to classify them in accordance with their norms [5,6]. Therefore, in order to ensure that these occurrences are understood, an advanced algorithm is required for the detection, feature extraction, and categorization of this data [7,8]. Algorithms for signal processing offer a mathematical approach for handling signals, particularly in the electrical power system [9,10].

1.1. Related Work

The following studies are some of the earlier works on power quality issues and mitigation strategies. In the literature, many methodologies of signal processing algorithms and their capabilities, in terms of detection and feature extraction, are studied.
The authors of [1] presented a new, ant colony-based, optimal feature selection method for classifying power quality issues. The authors of [2] used wavelet multiclass support vector machines to detect and categorize various power quality issues. The identification and categorization of individual and combined power quality issues were carried out by the authors in [3], utilizing fuzzy systems guided by the particle swarm optimization technique. The evaluation of the utility grid’s power quality with wind energy generation integrated was conducted by the authors in [4]. The detection of power quality disturbances based on time–frequency analysis and decision trees were demonstrated by the authors in [5].
The recognition of power quality disturbances based on a multiresolution Stockwell Transform (ST) and decision tree was described by the authors in [6]. The power quality disturbance feature selection and pattern identification based on picture enhancement approaches were given in [7] by the authors. Authors in [8] proposed the ST and fuzzy clustering-based power quality assessment and event detection in distribution networks with wind energy penetration. The authors of [9] offered a hybrid soft computing technique based on clustering, rule mining, and decision tree analysis for the problem of customer segmentation in real-world industries that place a high priority on the needs of the consumer. The real-time cross-correlation-based technique for detecting and categorizing power quality disturbances was demonstrated by the authors in [10].
The coordination of Distributed Flexible AC Transmission System (DFACTS) compensators and distributed generation units in contemporary distribution networks was presented in [11] by authors using a Basic Open-Source Nonlinear Mixed Integer Programming (BONMIN) solver. The islanding detection approach utilizing a potential energy function-based criterion was published in [12]. The optimal sizing of a smart hybrid renewable energy system was provided in [13] by authors utilizing several optimization algorithms. In [14], authors developed a novel method based on an iterative Lambert W function for mathematical modeling and parameter estimation of Polymer Electrolyte Membrane (PEM) fuel cells. The hybrid sine–cosine artificial rabbits’ algorithm was used by the authors of [15] to present the maximum hosting capacity estimation for renewables in power networks, taking energy storage and transmission line expansion into consideration.
A modified energy management strategy was published in [16] by the authors to assist phase balancing in grid-interfaced photovoltaic and fuel cell systems. The active/reactive energy control technique for a grid-connected fuel cell system with local inductive loads was proposed by the author in [17]. The enhanced instantaneous power theory-based current harmonic extraction for unbalanced electrical grid circumstances is given in [18] by the authors. The Interline Fuel Cell (I-FC) system with dual-functional control capability was presented by the author in [19]. The performance enhancement of a dynamic voltage restorer, based on a bidirectional dc–dc converter, was given in [20].
The event-triggered-based distributed cooperative energy management for multi-energy systems was presented by authors in [21]. The investigation of the dynamic voltage fluctuation mechanism in an interconnected power grid with stochastic power disturbances was reported by the authors in [22]. In [23], the authors described how to use a better common-mode voltage injection to minimize capacitor voltage fluctuations for four-level hybrid clamped converters.

1.2. Organization of the Manuscript

The remaining paper is organized as follows: Section 2 discusses data analysis and system modeling. Section 3 presented the methodology of the performed research. In Section 4, results and discussion are presented, followed by the conclusion.

2. Data Analysis and System Modeling

Various steps are utilized to develop the research model.

2.1. Data Collection

Primary and secondary data will be gathered for this work from the Yirgalem substation, Ethiopian Electric Utility (EEU), and Ethiopian Electric Power (EEP). The data would be gathered by interviewing each of the 47 substation employees, physically observing the substations, and obtaining historical data on feeder loading (peak load and hourly load) for the substation and distribution feeder roots from the engineering offices of EEU and EEP. As a rule of thumb, it is essential to test each location at the Points of Common Coupling (PCC) for at least seven days [24]. To maintain high reliability, the factory’s electrical power is delivered to the installation via a single incoming feeder from the Yirgalem substation.

2.2. Data Analysis

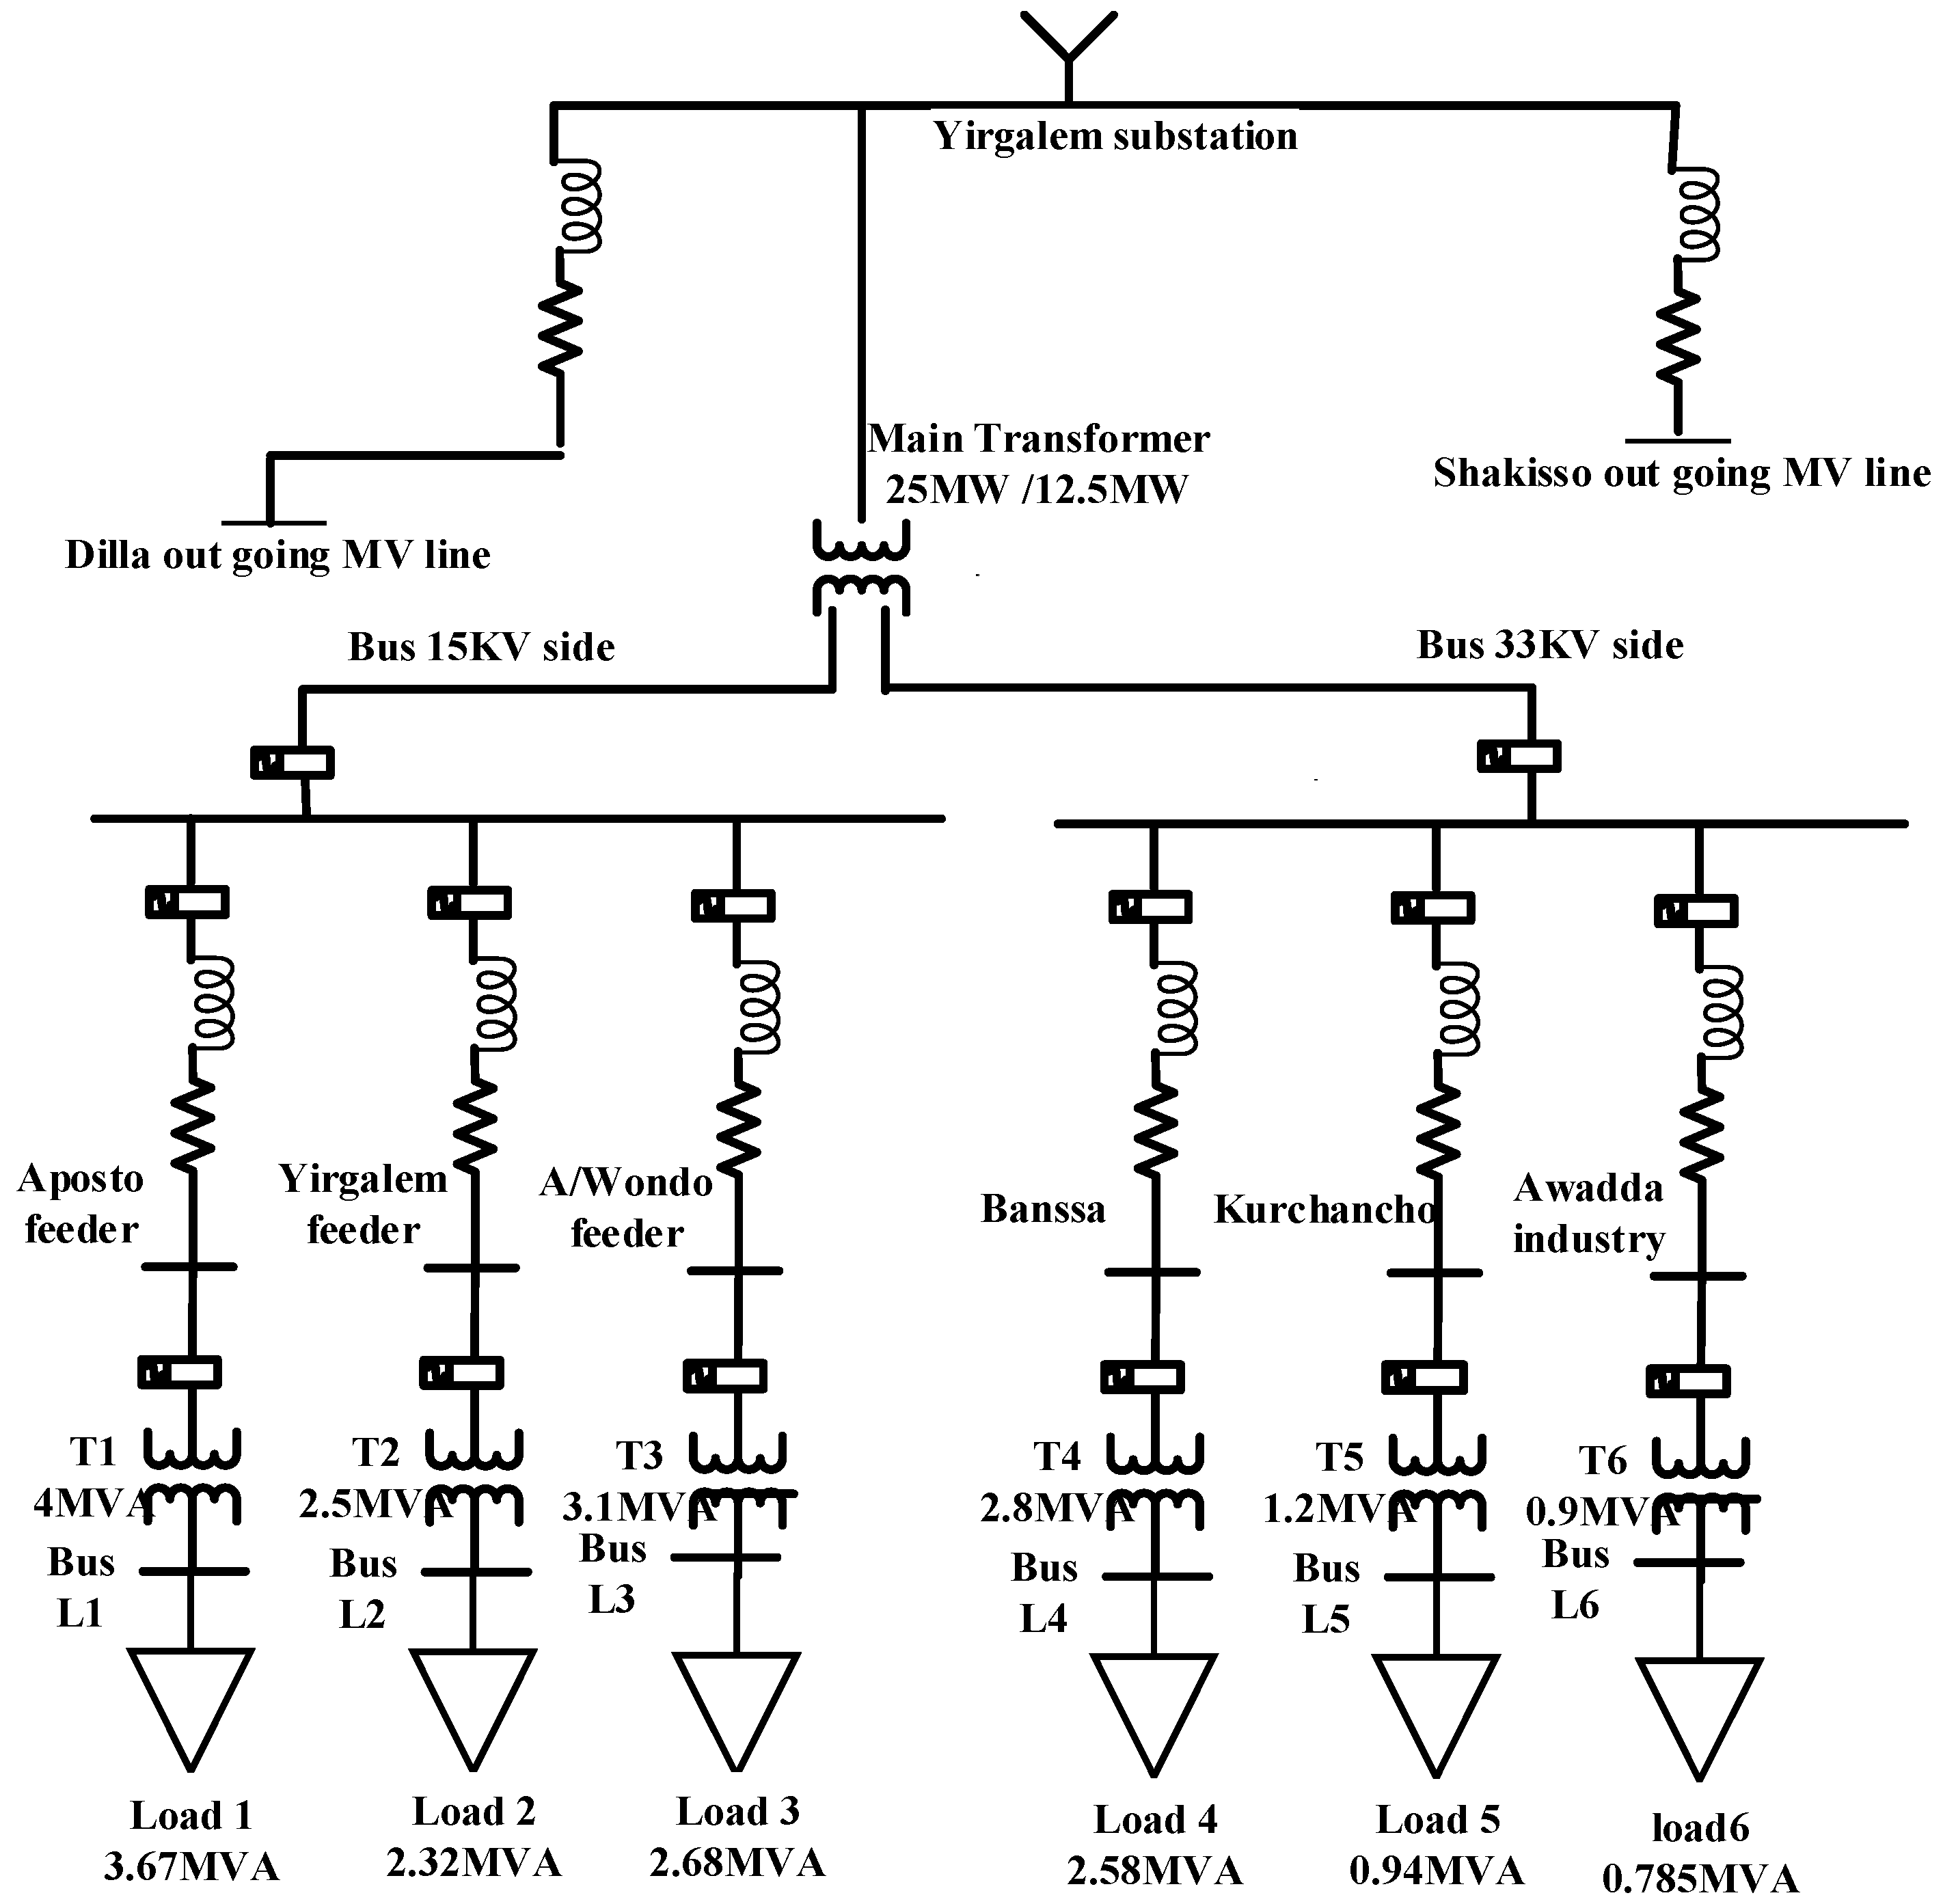
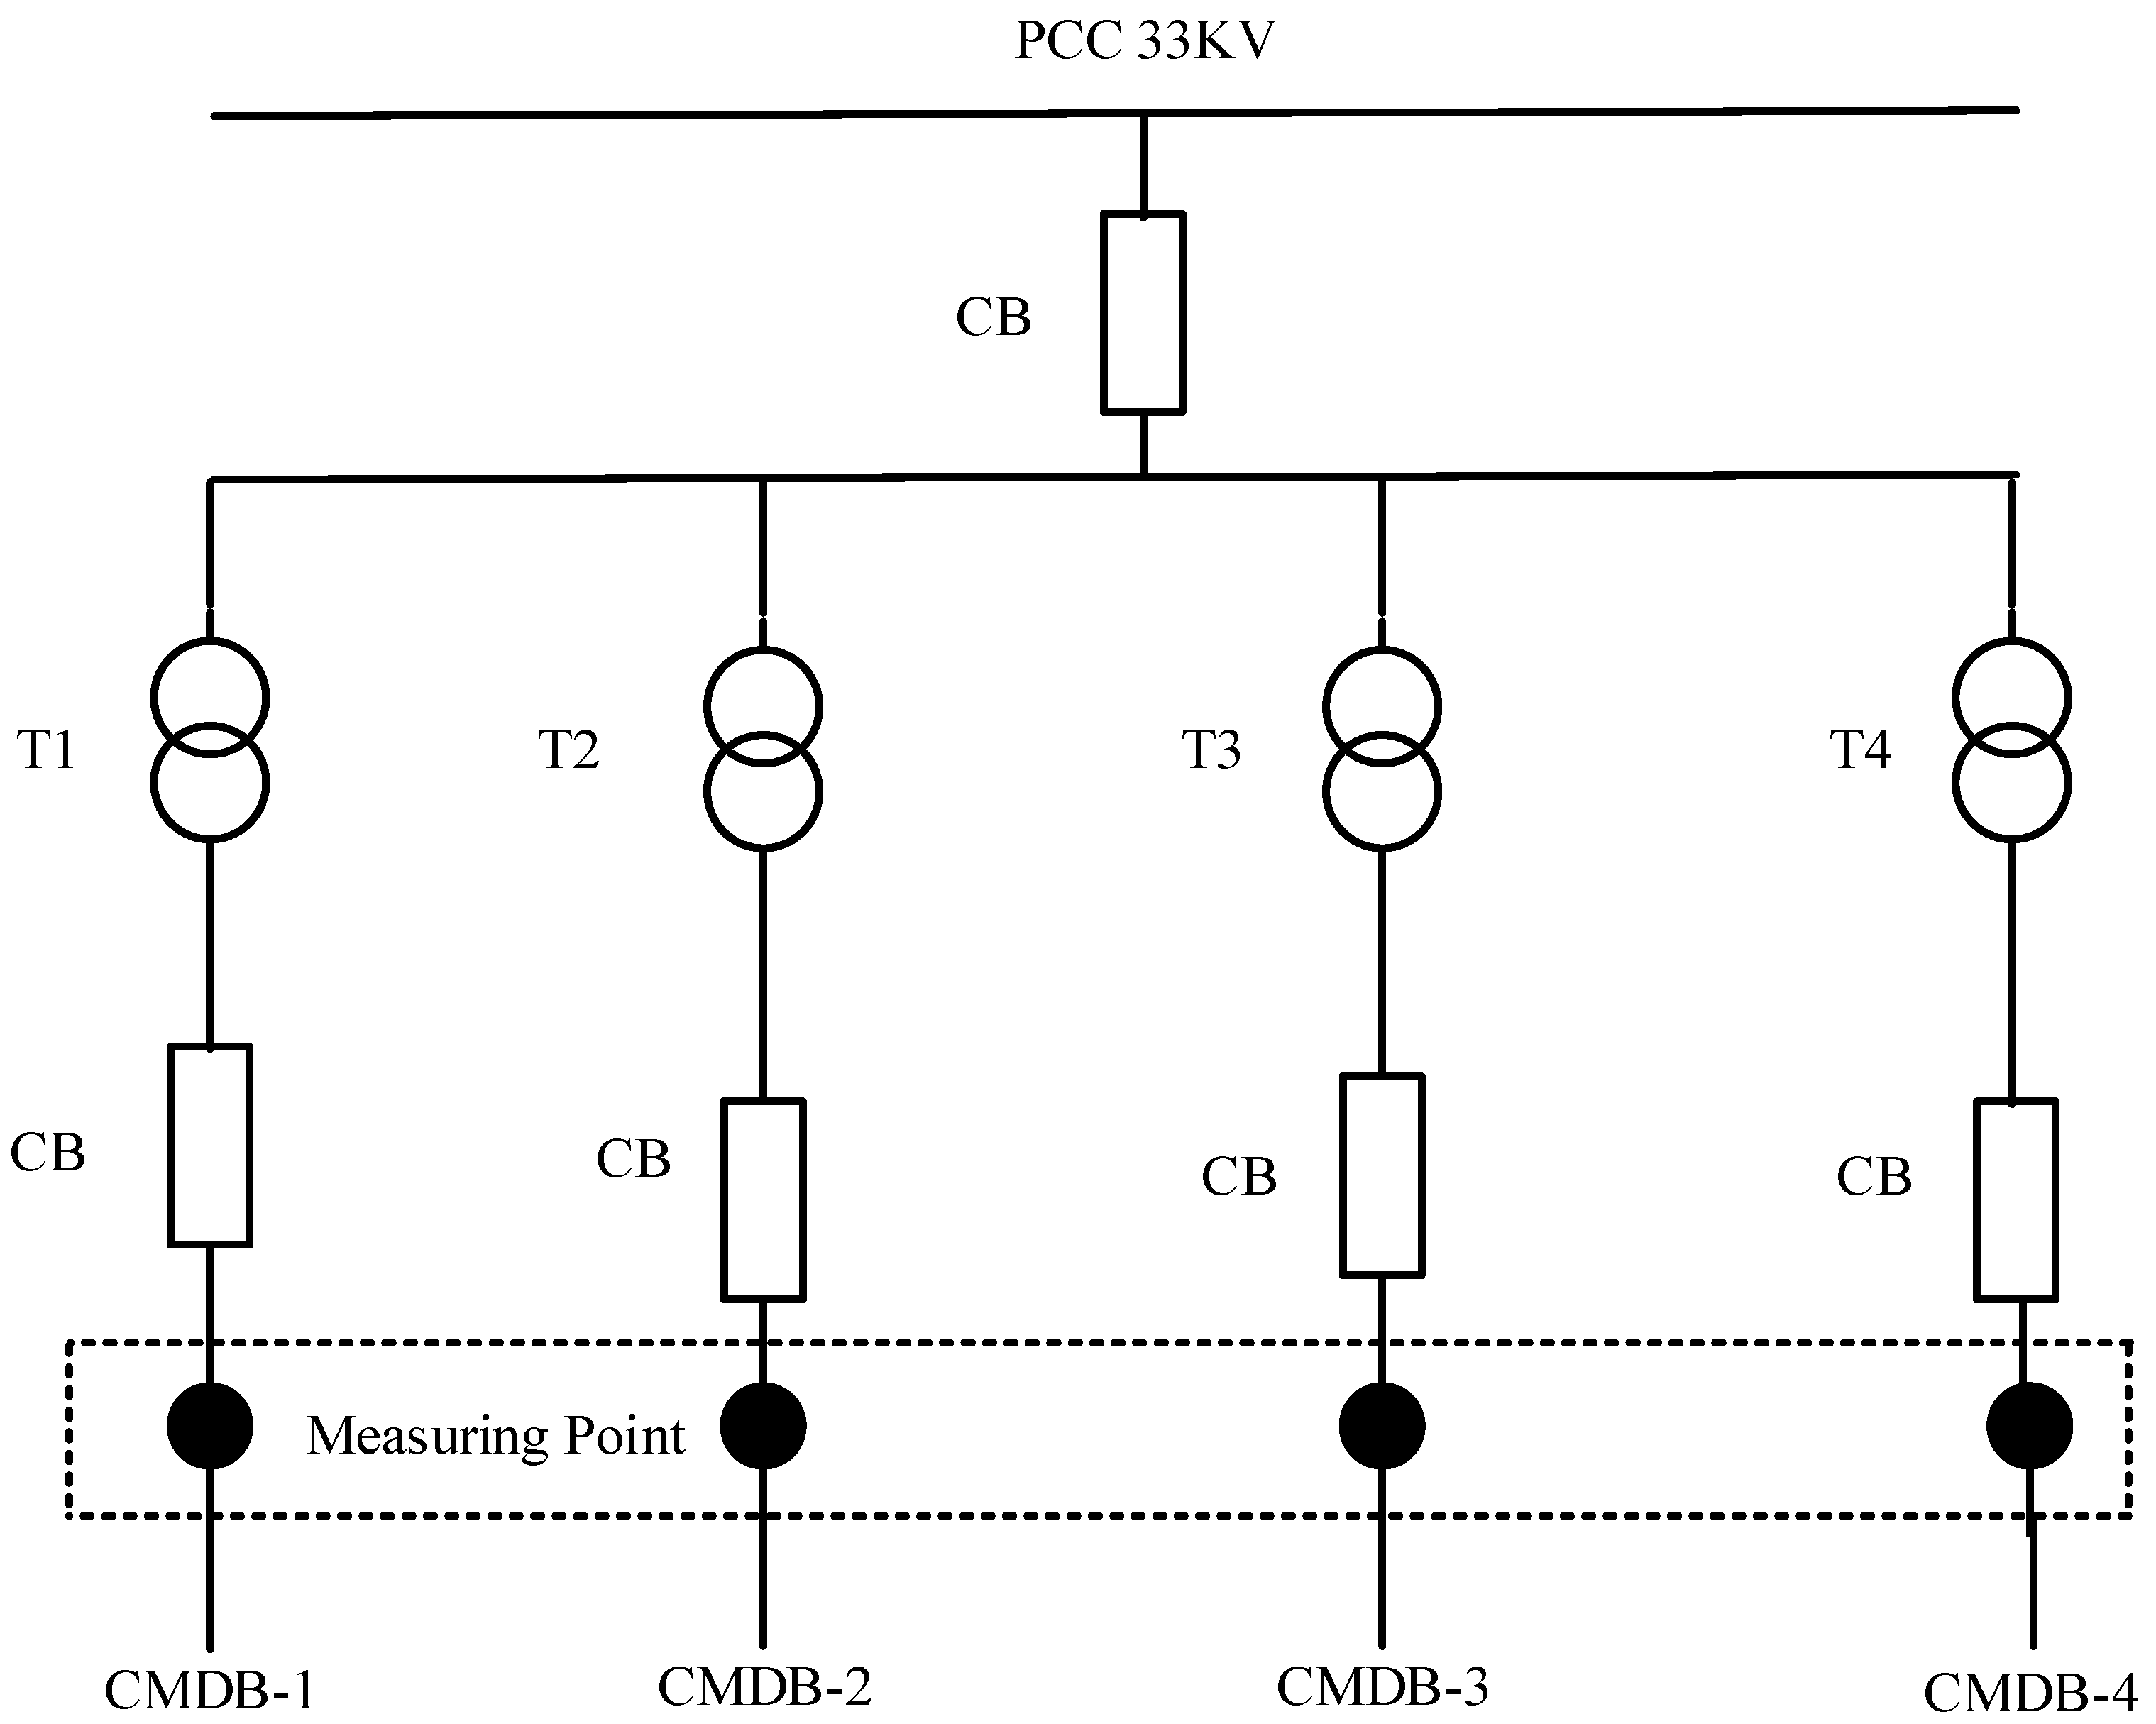
2.2.1. Electric Power Supply System to Awada Industry Zone

One inbound 132 kV transmission line will feed power to the Yirgalem substation from the Hawassa substation. The 33 kV and 15 kV feeders scale down the incoming 132 kV and distribute it. Three 132/33 kV, 25 MVA, and three 132/15 kV, 25 MVA step-down transformers (TR II and I) serve the study area, and the substation has six outgoing feeds. Feeders one, two, and three are powered by Transformer one (TR I). Feeders four, five, and six are all powered by Transformer Two (TR II), with the first three’s nominal voltage being 15 kV and the last three’s being 33 kV. Figure 1 presents the single-line diagram of the Yirgalem substation [24].
Figure 1. Single line diagram of Yirgalem substation.

2.2.2. Electrical Power Distribution Network of Awada Industry

An overhead distribution system connects the 33-kV primary distribution feeder line at the Yirgalem substation to the Awada industrial zone. The industry is supplied by a powerhouse that is built inside the plant. The distribution feeder line is integrated into the subsurface system of the powerhouse. One 33/0.4 kV, 800 kVA, %Z is 5.03, and three 33/0.4 kV, 1250 kVA, %Z is 5.05, and the Delta-Wye step-down net distribution transformers are linked to the 33 kV feeder line to provide a maximum demand of 2.85 MVA, as indicated in Figure 2 below.
Figure 2. Single line diagram of electrical power distribution network of Awada industry.
Power for the factory is distributed by four Central Main Distribution Boards (CMDBs), as shown in Figure 2 below. These four CMDBs serve a range of different and scattered loads through the Main Distribution Boards (MDBs) and Sub Distribution Boards (SDBs), which are positioned in various locations across the plant adjacent to the loads they supply.
Power for the majority of the production equipment in the facility is provided by CMDB-1, CMDB-2, and CMDB-3. On the other hand, loads including sizable Air Conditioning (AC) units, lighting loads, and office and kitchen equipment make up the majority of the connected loads to CMDB-4. One 200 kVA Standby Diesel Generator (SDG) is present in the factory for backup. The factory employs highly developed and powerful machinery, which is sensitive to even the smallest variation in the quality of the energy provided and, at the same time, has the propensity to contaminate the given pure sine wave. The loads in the sector can be inverters, 1-Φ and 3-Φ supplies, controlling units, lamps (fluorescent and gas discharge), and other equipment [24].

2.2.3. Power Quality Issues in the Industry Zone

In order to identify power quality problems, the authors examined weekly and monthly maintenance reports for the industry. Further investigation into power quality disturbance issues that may not have been reported in reports owing to various factors has also been conducted in thorough discussions with the factory engineers. The power quality and reliability issues that the industry has experienced over the past few years are harmonics, voltage sag, voltage swell, and interruption.

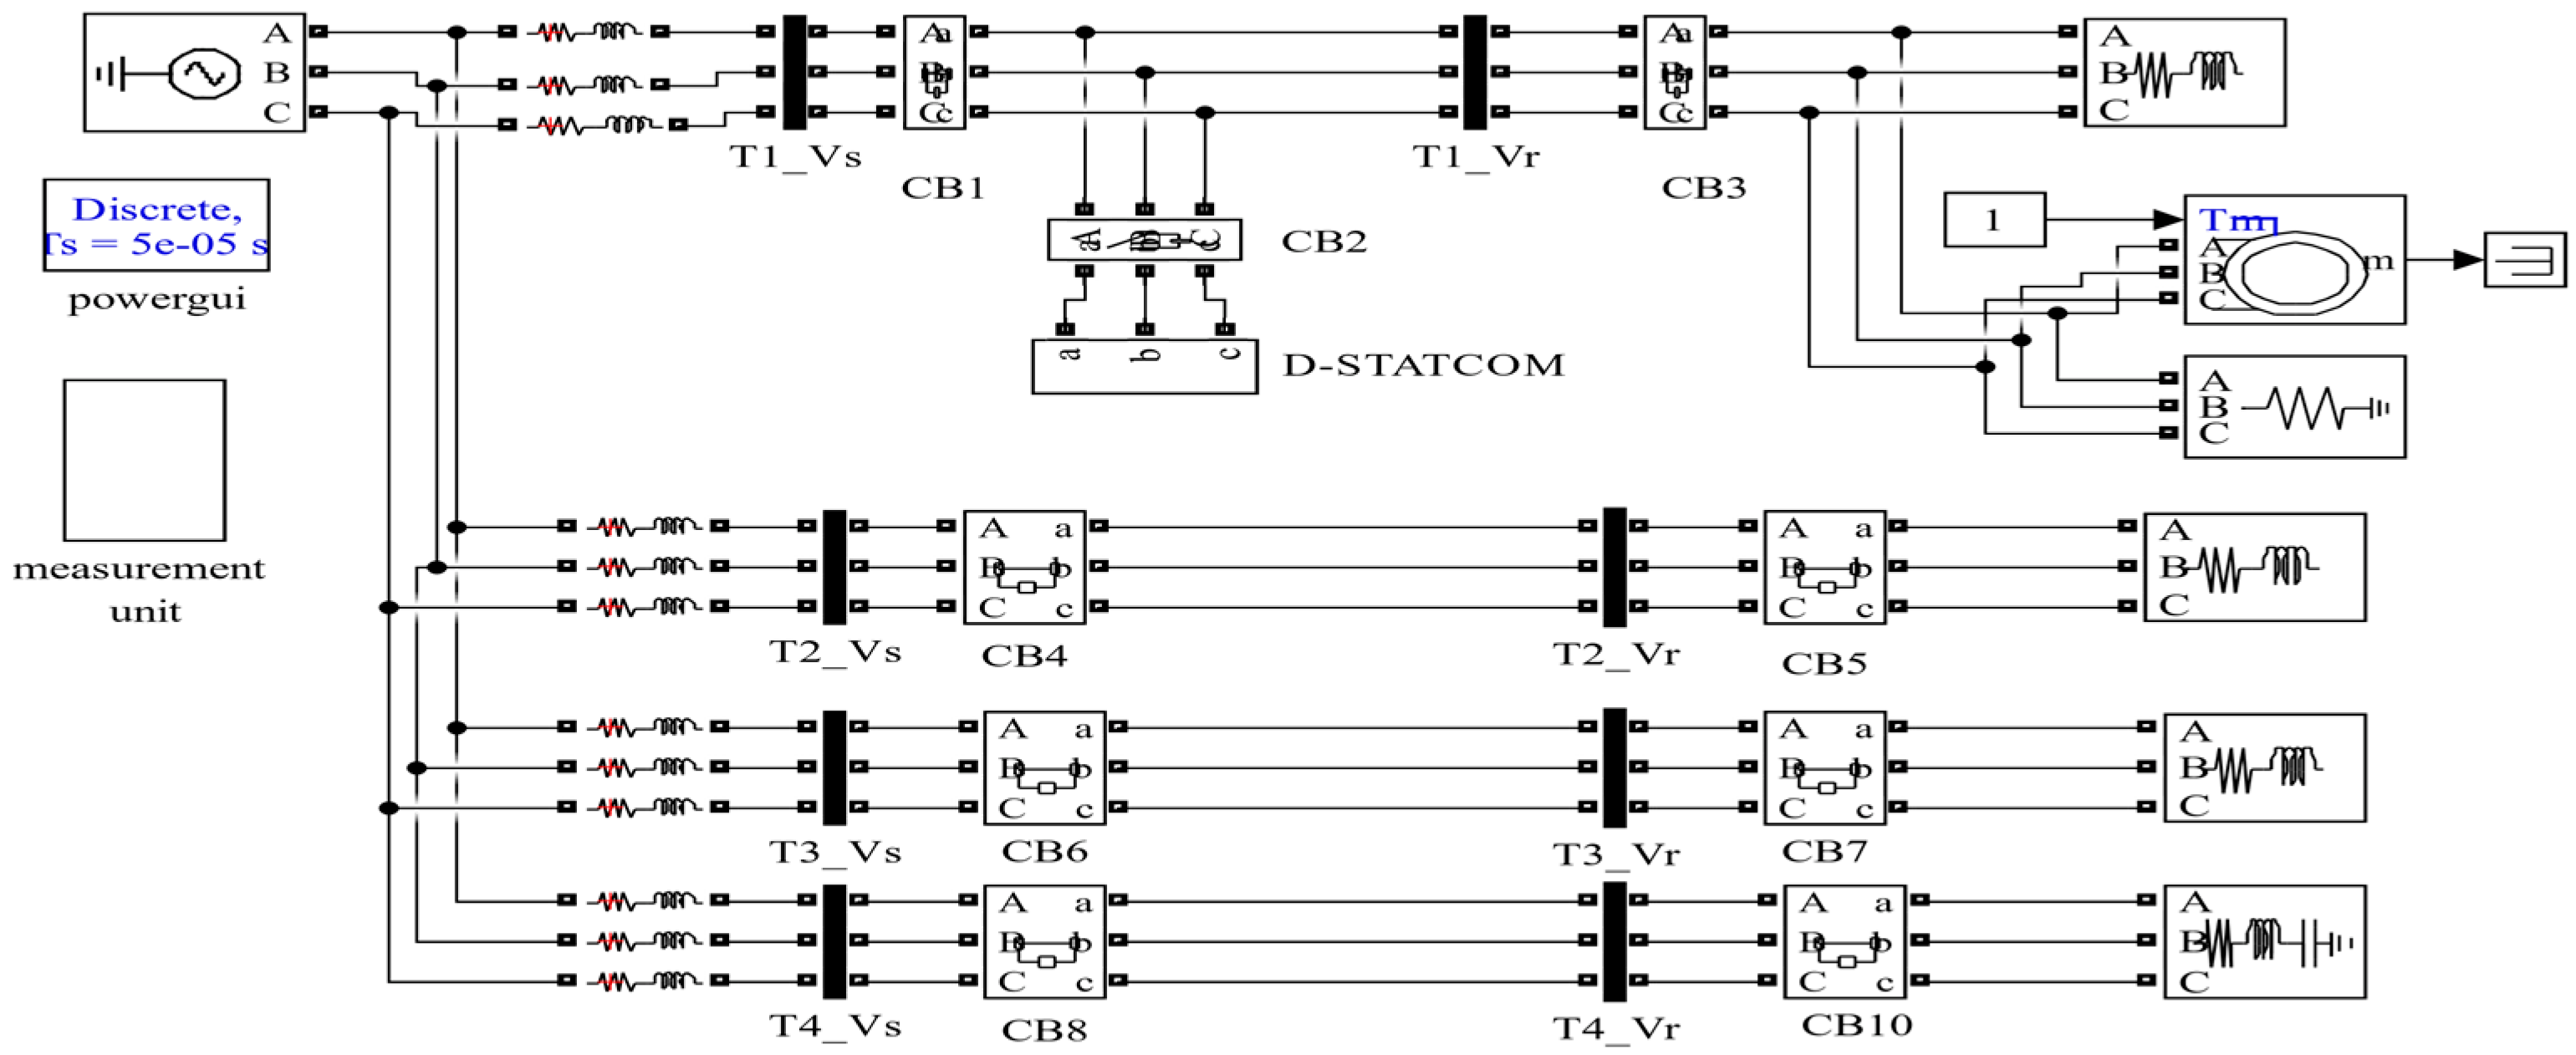
2.3. Distribution Network Modeling

The MATLAB/Simulink software is utilized in this work to develop the studied system. The Awada industry distribution network’s power quality performance is modeled and examined using this simulation software environment. It represents the distribution system using an equivalent circuit (an impedance diagram). The following subtopics present the calculations and presumptions used to represent various distribution network components. The computed values for the four-distribution transformer’s resistances and reactances are shown in Table 1 [24].
Table 1. Calculated values of R t r and X t r for T1–T4.

Electrical Demand Modeling

The factory’s monthly energy consumption information for each cost center is used to determine the real power factor of the loads. For this research, the power factor values of each cost center are averaged over a 12-month period (April 2021–March 2022). Table 2 presents the connected demand for each transformer [24].
Table 2. Each transformer connected demand.

3. Methodology

The proposed technique for the Power Quality (PQ) problem detection and classification is discussed in this section. Figure 3 presents the flow chart of the proposed methodology.
Figure 3. Flow chart of proposed methodology. Here, C1: Flicker, C2: Harmonic, C3: Impulse transient, C4: Interruption, C5: oscillatory, C6: non-pure sinusoidal signal, C7: Sag, C8: Sag harmonic, C9: Swell, and C10: Swell harmonic.

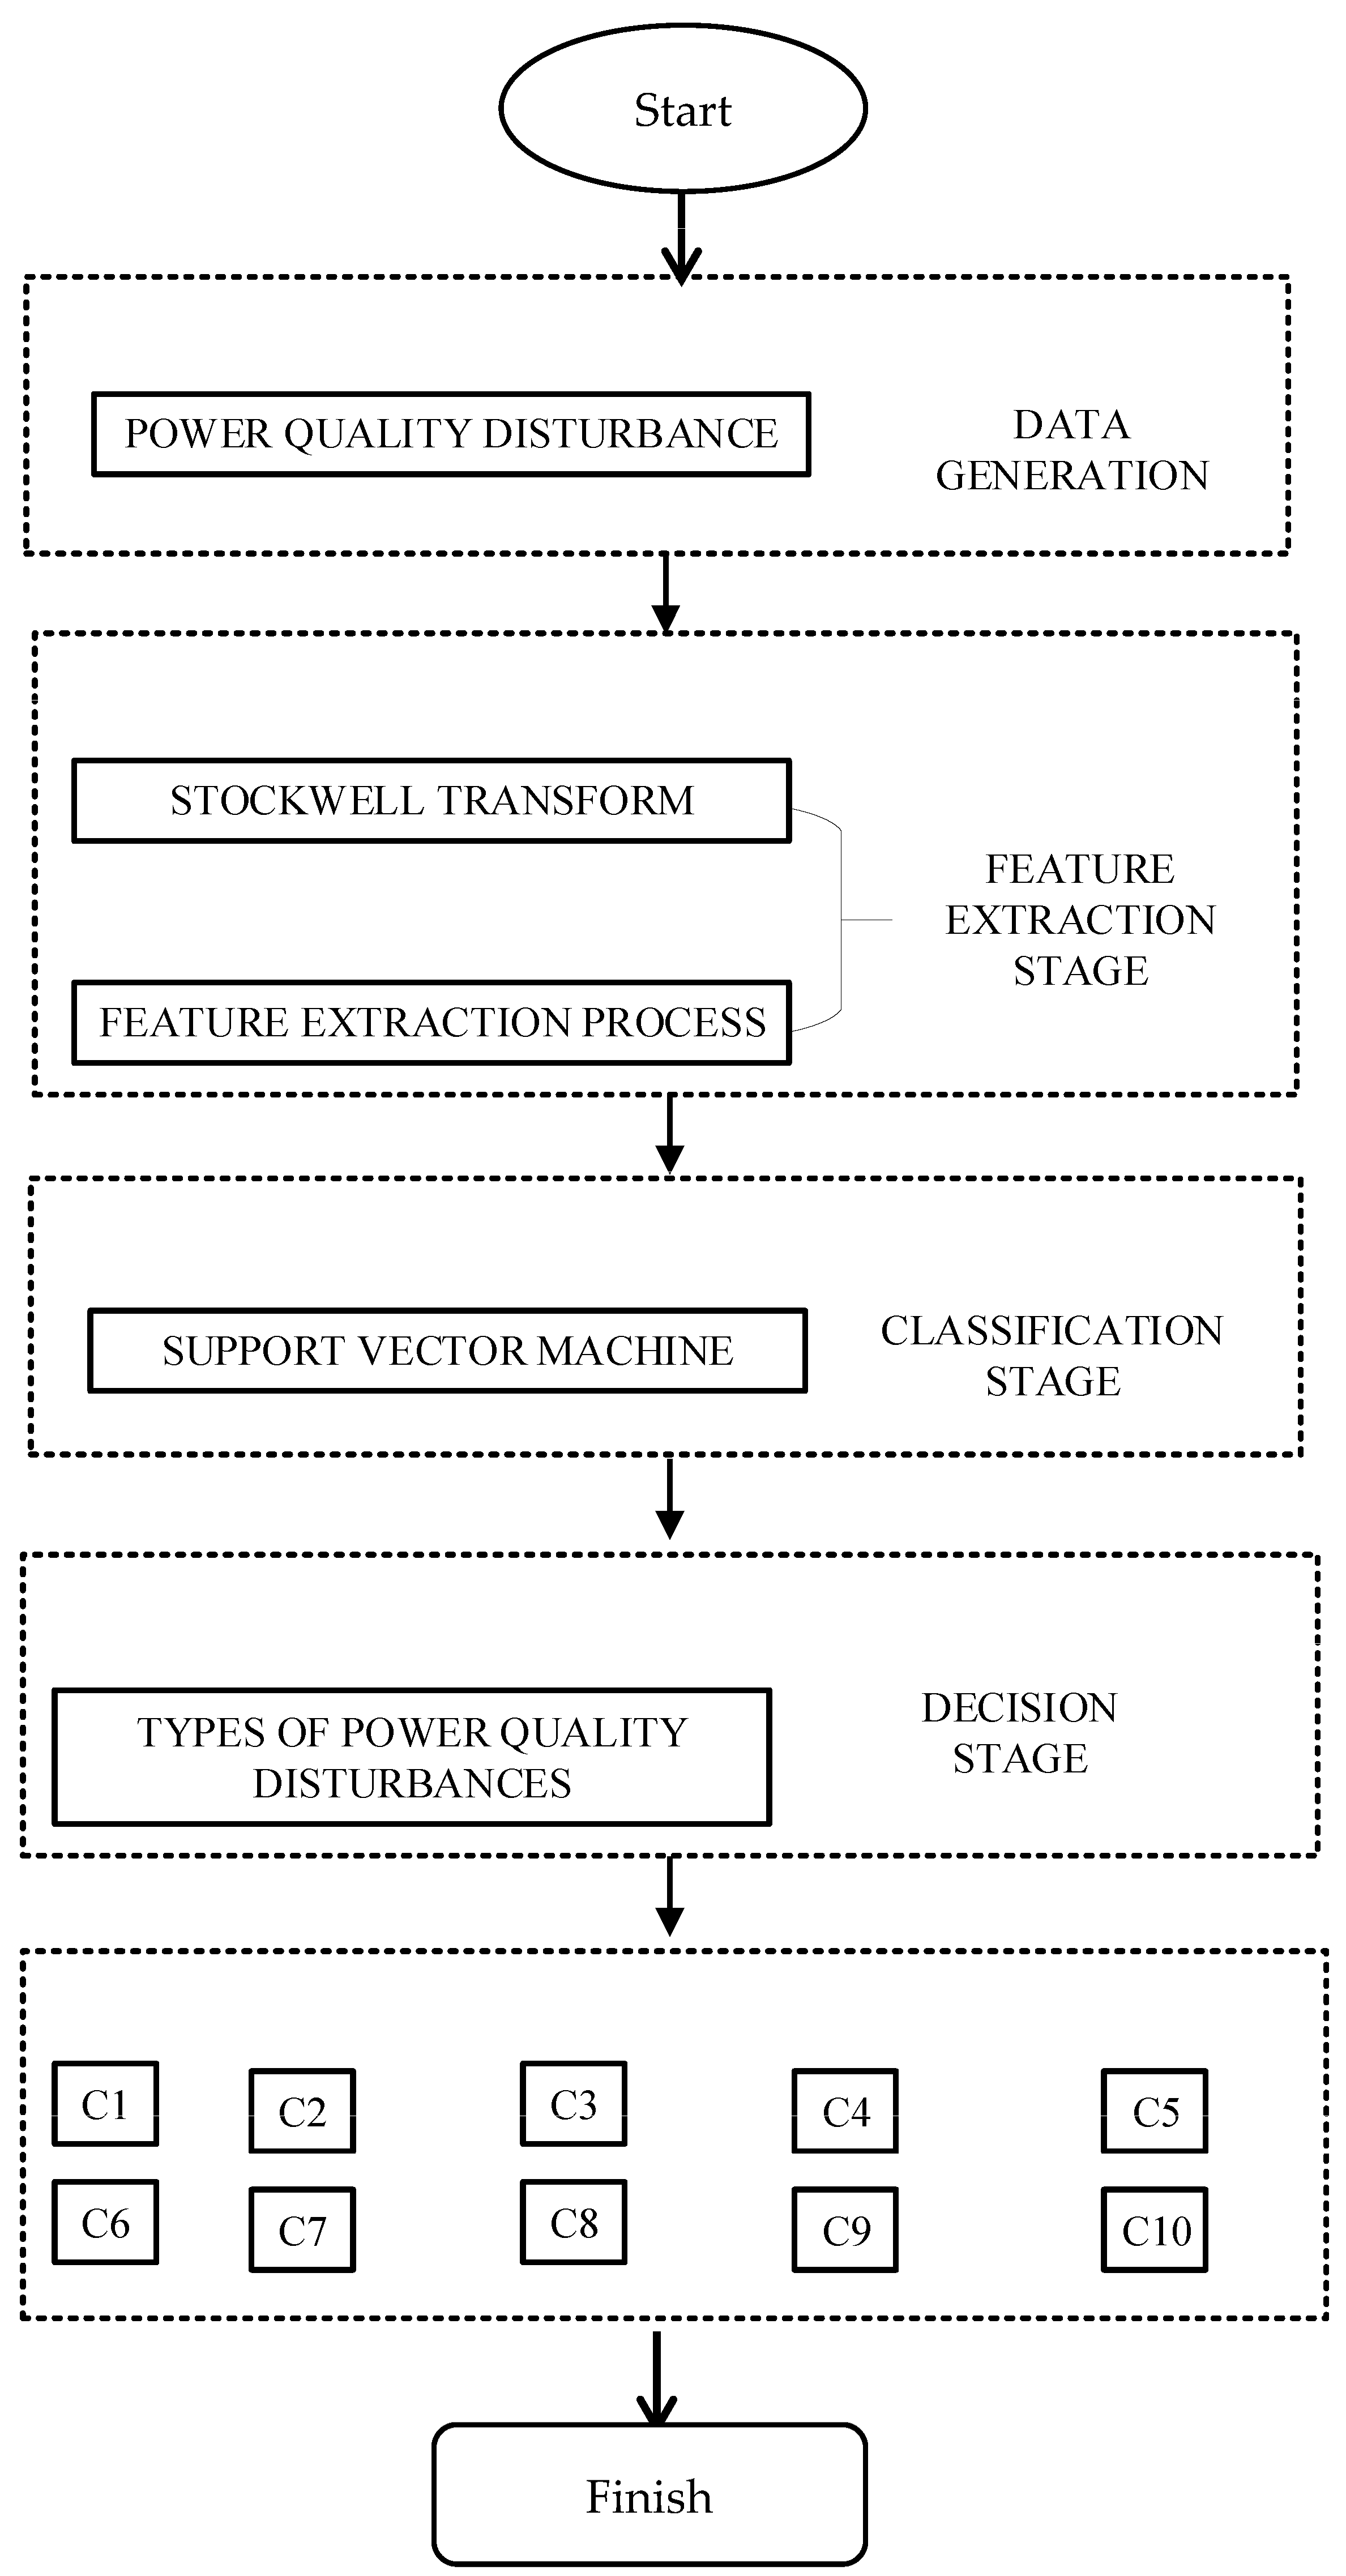
3.1. Proposed Algorithm for PQ Disturbance Identification

In this work for the PQ issue detection, the ST technique is utilized [25].

3.1.1. Stockwell Transform (ST)

The ST of a continuous time signal h(t) has been presented in Equation (1) as
S ζ , f = h t   f α 2 π . e ( f 2 ζ t 2 2 α 2 )     ,
where, f is the frequency, t is the time, and the ζ is the control parameter that controls the Gaussian window position on the t-axis [25]. Time and the frequency resolution are controlled by α. In this work, α is selected as 0.5.
The discrete version of FT is given by Equation (2) [25],
H n NT = 1 N k = 1 N 1 h kT . e i 2 π k N   ,
where, h kT discrete form of power signal h t , n is 0, 1, 2, …, N − 1, k = 1, 2… N − 1, and T is the sampling interval. The ST of a discrete time series h kT is expressed by assuming.
f → n NT and ζ → jT is represented as
S jT , n N T = m = 0 N 1 H m + n N T G m , n e i 2 π mj N   ,
G m , n = e i 2 π mj 2 N 2 , n 0 , where j, m = 0, 1, 2, …, N − 1
By assuming n = 0,
s jT . 0 = m = 0 N 1 h m NT   .
S-matrix is the name of the ST’s output. The frequency is represented by the row and the time by the column in the S-matrix results. Additionally, each matrix component is a complex value. A Fourier spectrum is produced by averaging the S-amplitude matrixes across time [25].

3.1.2. Feature Extraction

Feature extraction is the critical step in machine learning-based techniques for PQ problem identification and classification. The measured information that is extracted from sample signals to create a vector is referred to as an “extracted feature.” Sub-stages utilized in the feature extraction process are as follows:
A. Energy Feature
Using Perceval’s Theorem,
E s i g j = 1 N j = 1 N X j 2   ,
E D i = 1 N j = 1 N D i , j 2   ,
where Aj and Dj are wavelet coefficients, i is 1, 2, 3, …, L.
E A i = 1 N j = 1 N D l , j 2   ,
E i = E A 1   E A 2 E A l E A l ,   E D 1 E D 2 E D l E D l   ,
where E A j   and     E D j are the energies of wavelet-approximation and the detail coefficients up to level j and E𝑖 are the energy feature vector.
B. Entropy Feature
The detailed and approximated level coefficients of the relations for the Shannon entropy are as follows:
E n t D i = j = 1 N D i , j 2 log ( D i , j 2 )   ,
E n t A i = j = 1 N A i , j 2 log ( A i , j 2 )   ,
where 𝐴𝑖, and 𝐷𝑖, are the probability of the occurrence of feature values {𝐷1…8, 𝐴8} and 𝑖 = 1 … 10.
So, the overall entropy features are given by:
E n t i = E n t D 1 E n t D 2 E n t D l E n t A l ,   E n t A 1 E n t A 2 E n t A 8   .
C. Standard Deviation
It is given by,
S . D D j = j = 1 N D j m e a n 2 N 1   ,
S . D A j = j = 1 N A j m e a n 2 N 1   ,
S D i = E i = S D D 1   S D D 2 S D D l S D D l   ,
F e a t u r e i = E i E n t i S D D i   .

3.2. Proposed Classifier Algorithms

This section discusses the proposed classifier for the PQ problem classification based on the support vector machine.

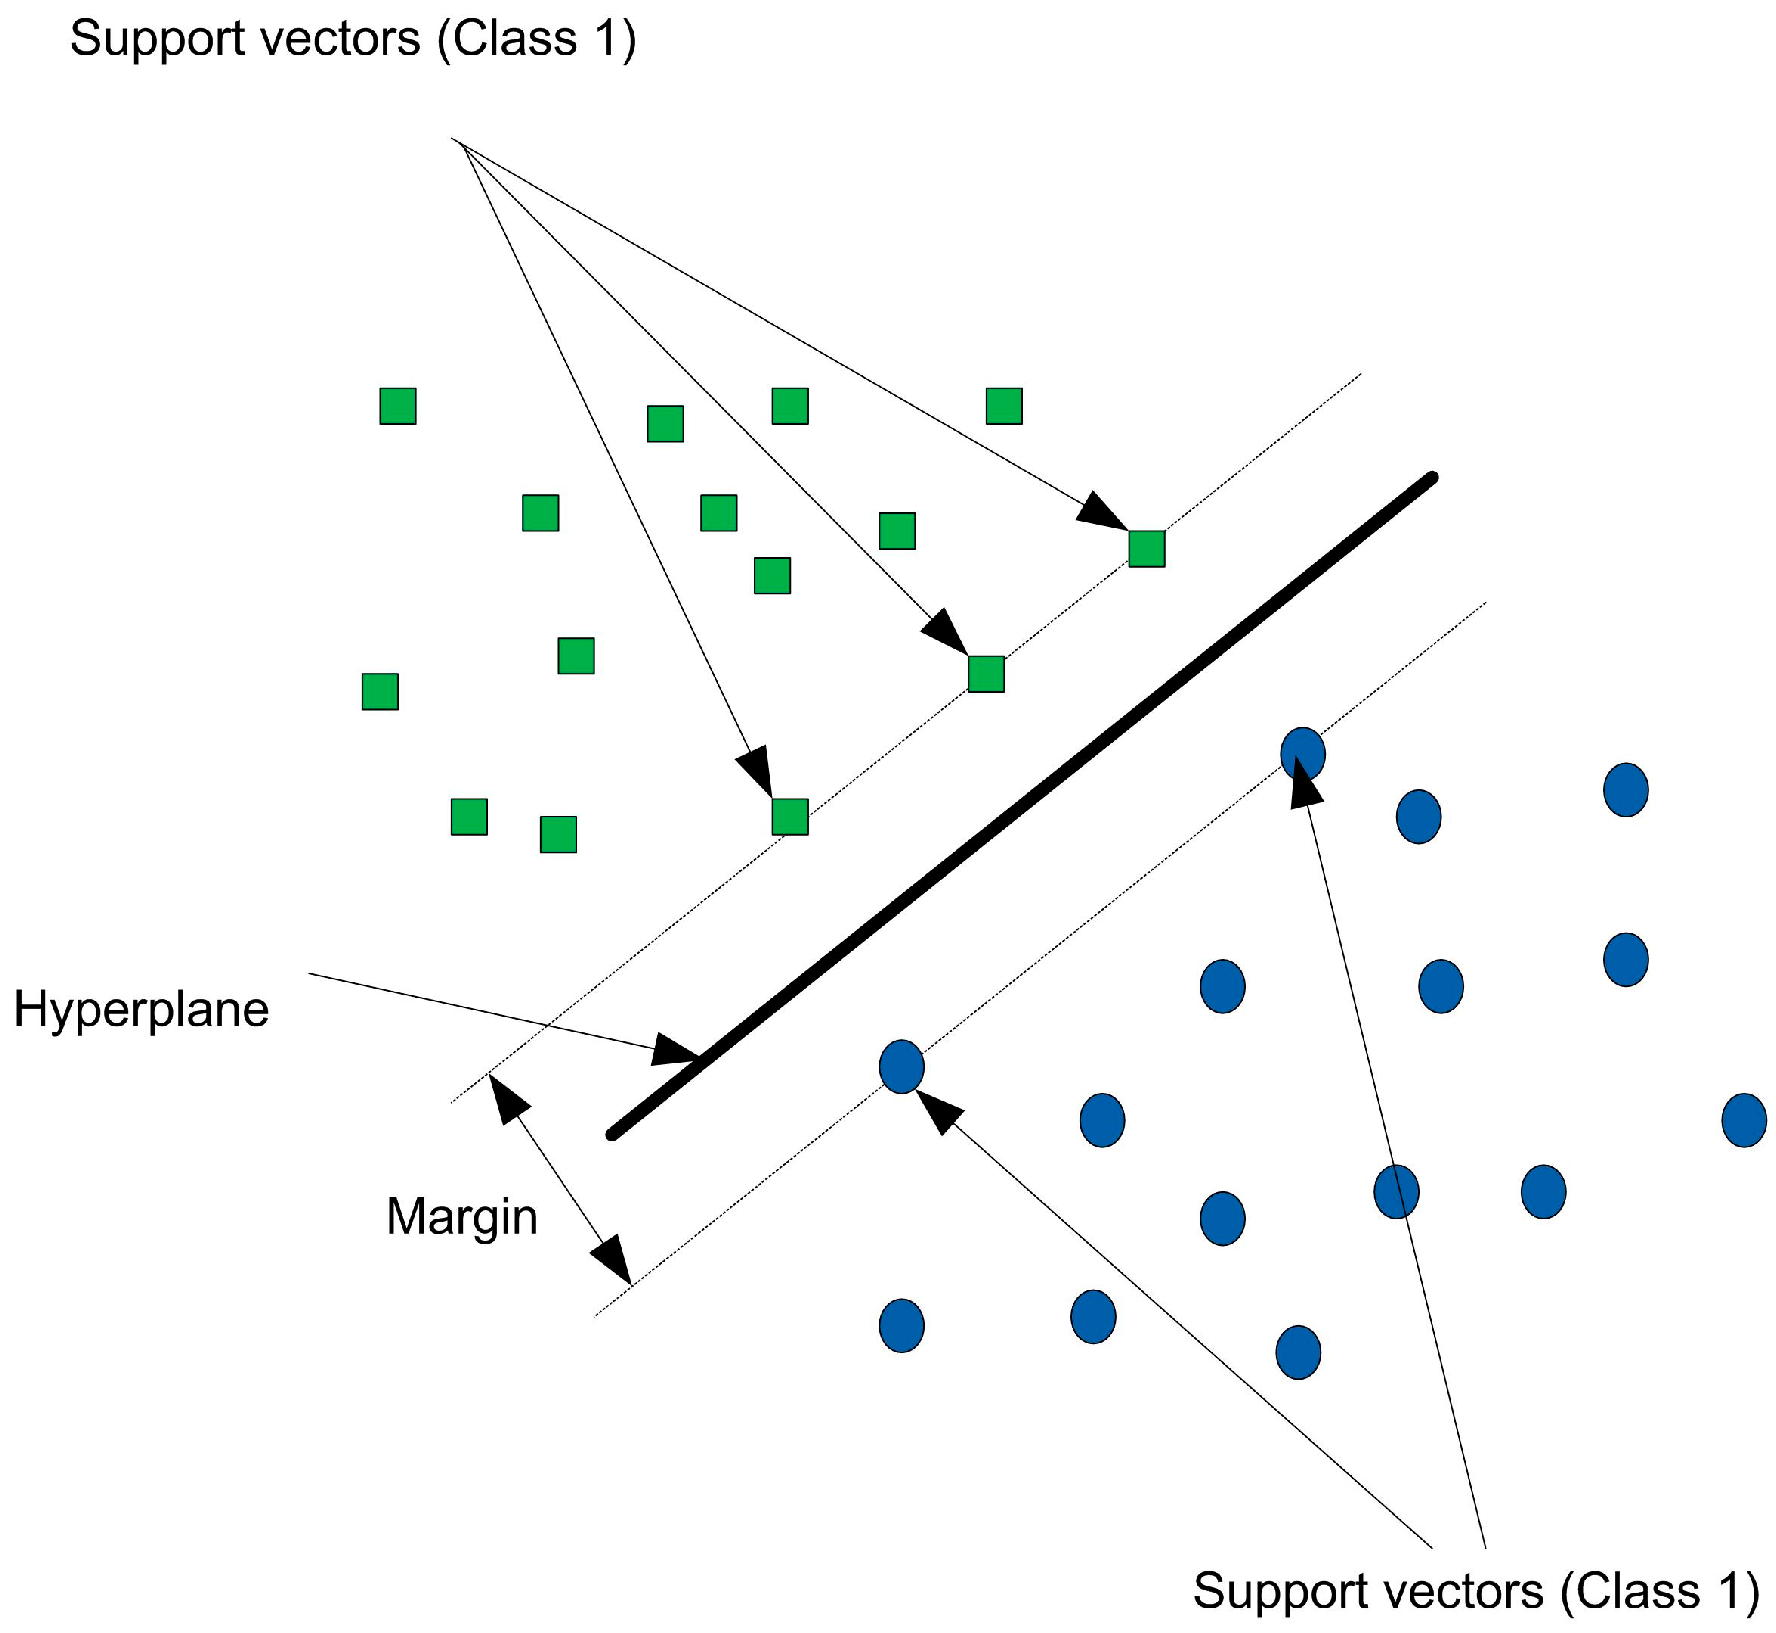
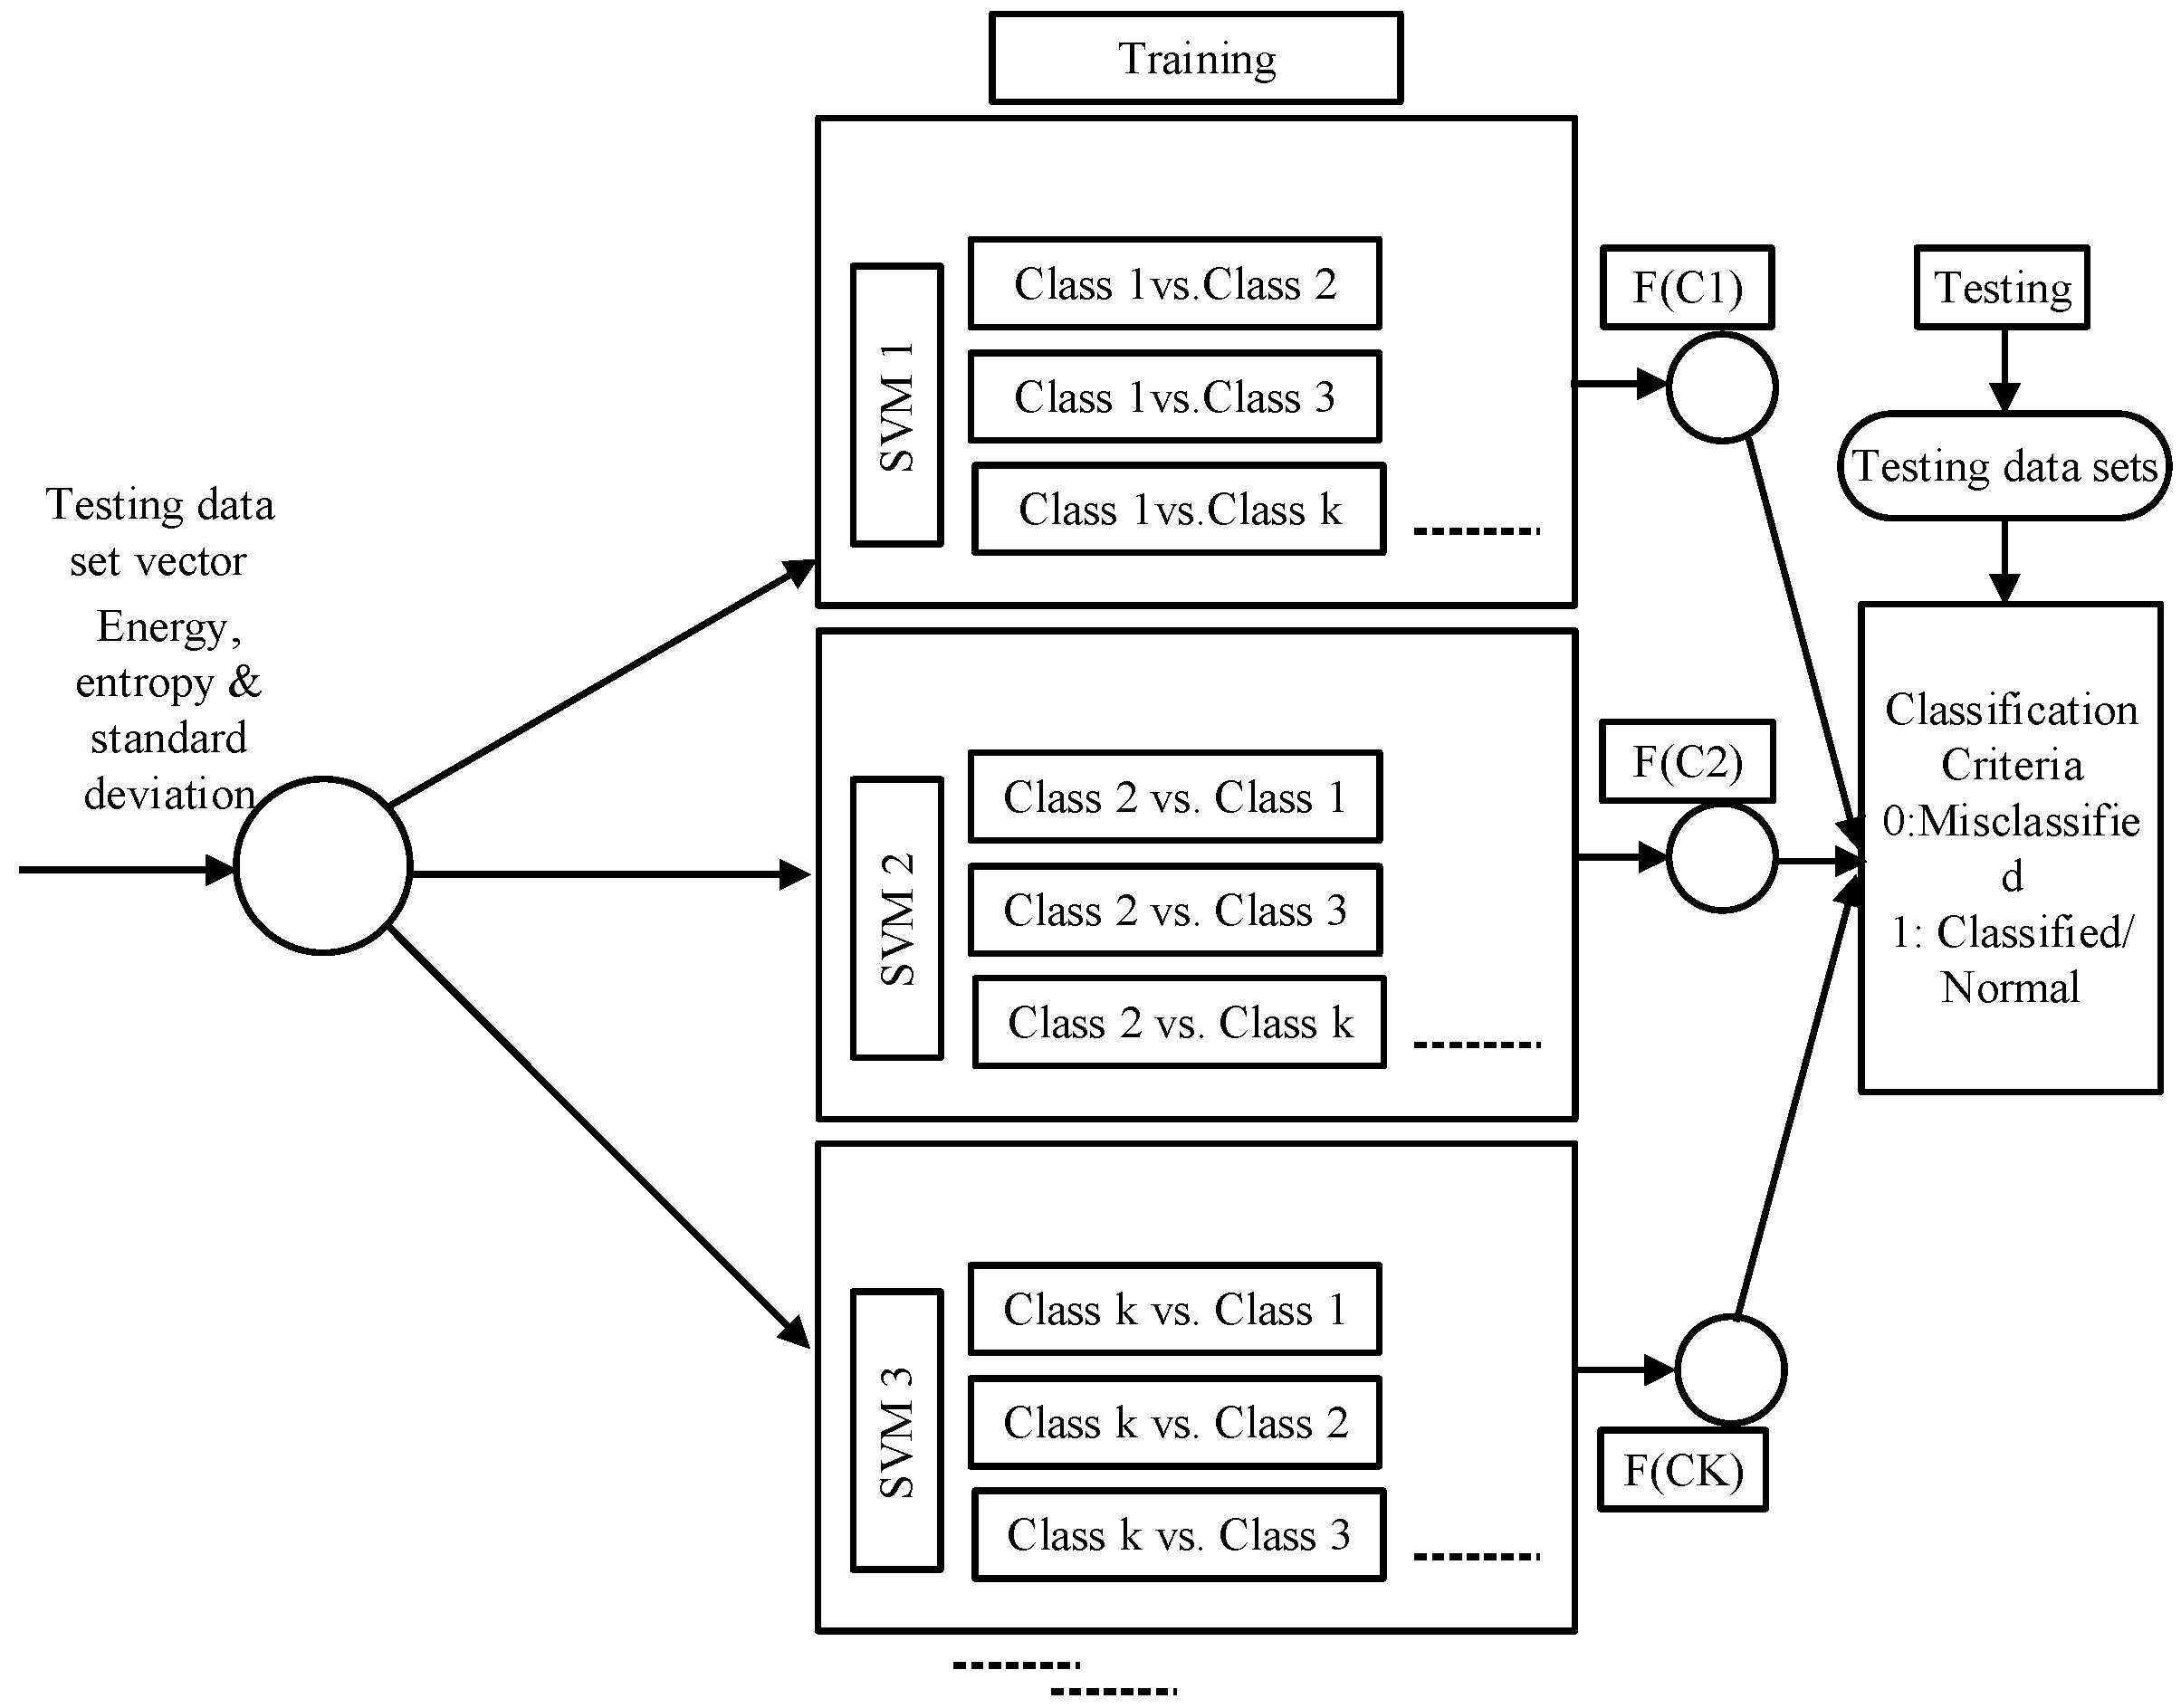
3.2.1. Support Vector Machine (SVM) Classifier

SVM functions as a discriminative classifier commonly specified as an ideal hyperplane for two or more categorized classes of disturbance data, as follows:
g x = x θ + b = 0   for   R   .
A linear decision boundary called a hyperplane divides the space for categorization into two halves. Kernel functions are employed for persistent and complex data. In this study, feature mapping and binary classification are related to localizing Gaussian kernels. The following is the mathematical relationship for the Gaussian kernel:
f x i , l j = e x p   x i l j 2   2 δ 2   ,
where x i represents feature, l j , landmark point, and δ is a Gaussian kernel parameter, which features f x i ,   I j to vary more smoothly.
The objective function is to minimize and subject to α j . y j , which is equal to zero,
min ( 0.5 j = 1 a k = 1 n a j a k y j y k G x j ,   x k j = 1 n a j )   ,
where a j 0   and j = 1, 2, …, n,
a j y j g x j 1 + δ j = 0   ,
δ j C a j = 0   ,
whereas,
g x j = φ x j θ + b .
Further, 𝜑 represents a kernel function, δ j is entitled slack parameter, and 𝐶 is regularization parameter. Figure 4 presents the SVM classification schematic diagram [2].
Figure 4. Support Vector Machine Classification Schematic.

3.2.2. Classification Stage

Figure 5 shows the one versus one SVM binary classification schematic diagram [2]. The feature vector comprises 27 dimensions of the feature dataset for 250 samples of each PQ disturbance class, i.e., 27 × 250. From 250 samples of each disturbance class, half of the data set has been used for training the SVM classifier, and the rest of the data is for testing purposes. For classification training with SVM, the 1 vs. 1 approach is adopted, as shown in Figure 5. In this approach, each SVM training node with i = 1 class is trained against all classes. Similarly, for the next SVM training node, the aforesaid i = 1 class is replaced with a i = 2 class, and training is conducted with all other classes. This process was iterated until all classes had passed through training. With this training process, SVM develops algorithm functions, i.e., Cn, for binary data classification, and outlier detection for n classes. Therefore, a one vs. one approach may allow the SVM classifier to have a very upright training performance with this multiclass classification problem. Testing of the classifier for each class, results in positive and negative scores for classified, and misclassified class samples, are performed. A label of one was assigned to a classified disturbance sample, and a label of zero was assigned to a misclassified sample. The time domain disturbance is fed into the classifier [2].
Figure 5. 1 versus 1 SVM binary classification process.

3.3. Mitigation of PQ Disturbance Using DSTATCOM

This work proposed the D-STATCOM for the mitigation of PQ disturbances identified and classified in this work [26].

3.3.1. Mitigation of Current Harmonic Distortion Using D-STATCOM

Figure 6 illustrates the Awada industry zone distribution system with three independently Current Control Mode (CCM) operated D-STATCOMs.
Figure 6. Simulink model of Awada industry zone network with D-STSTCOM.

3.3.2. D-STATCOM Capacity, Specifications and Measured Values

Based on the measured values of the electrical system of the Awada industry zone, the voltage at PCC is (VPCC=) 0.4 kV, apparent power is (S=) 1250 kVA, and power factor is (cosΦ=) 0.9. Moreover, maximum 3-Φ Total Harmonic Current Distortion (THDI) response is 75%, harmonic duration to protect is 250 msec.
It is advised to use D-STATCOM technology to harmonically correct the bus voltage and restore it to 100% of the rated value. Therefore, the compensating voltage of D-STATCOM should be 80% when the harmonic depth is less than 75%. By taking into account this consideration, for peak load of 1250 kVA with power factor of 0.9, compensation power required is (0.9 × 1250 kVA=) 1125 kVA. The duration of harmonic to protect is 250 msec. so, the required energy is ((1250 × 0.9) × 0.25=) 281.255 kJ.
For sufficient operating capacity, D-STATCOM capacity is selected with 1150 kVA, 300 kJ. In addition to this, it should be installed at the 33 kV side of the system.

4. Results and Discussion

In this section, the results obtained from the ST for PQ problem detection, SVM results of PQ problem classification, and D-STATCOM results of PQ problem mitigation are discussed. Furthermore, a comparison with other techniques is presented to demonstrate the efficacy of the proposed method.

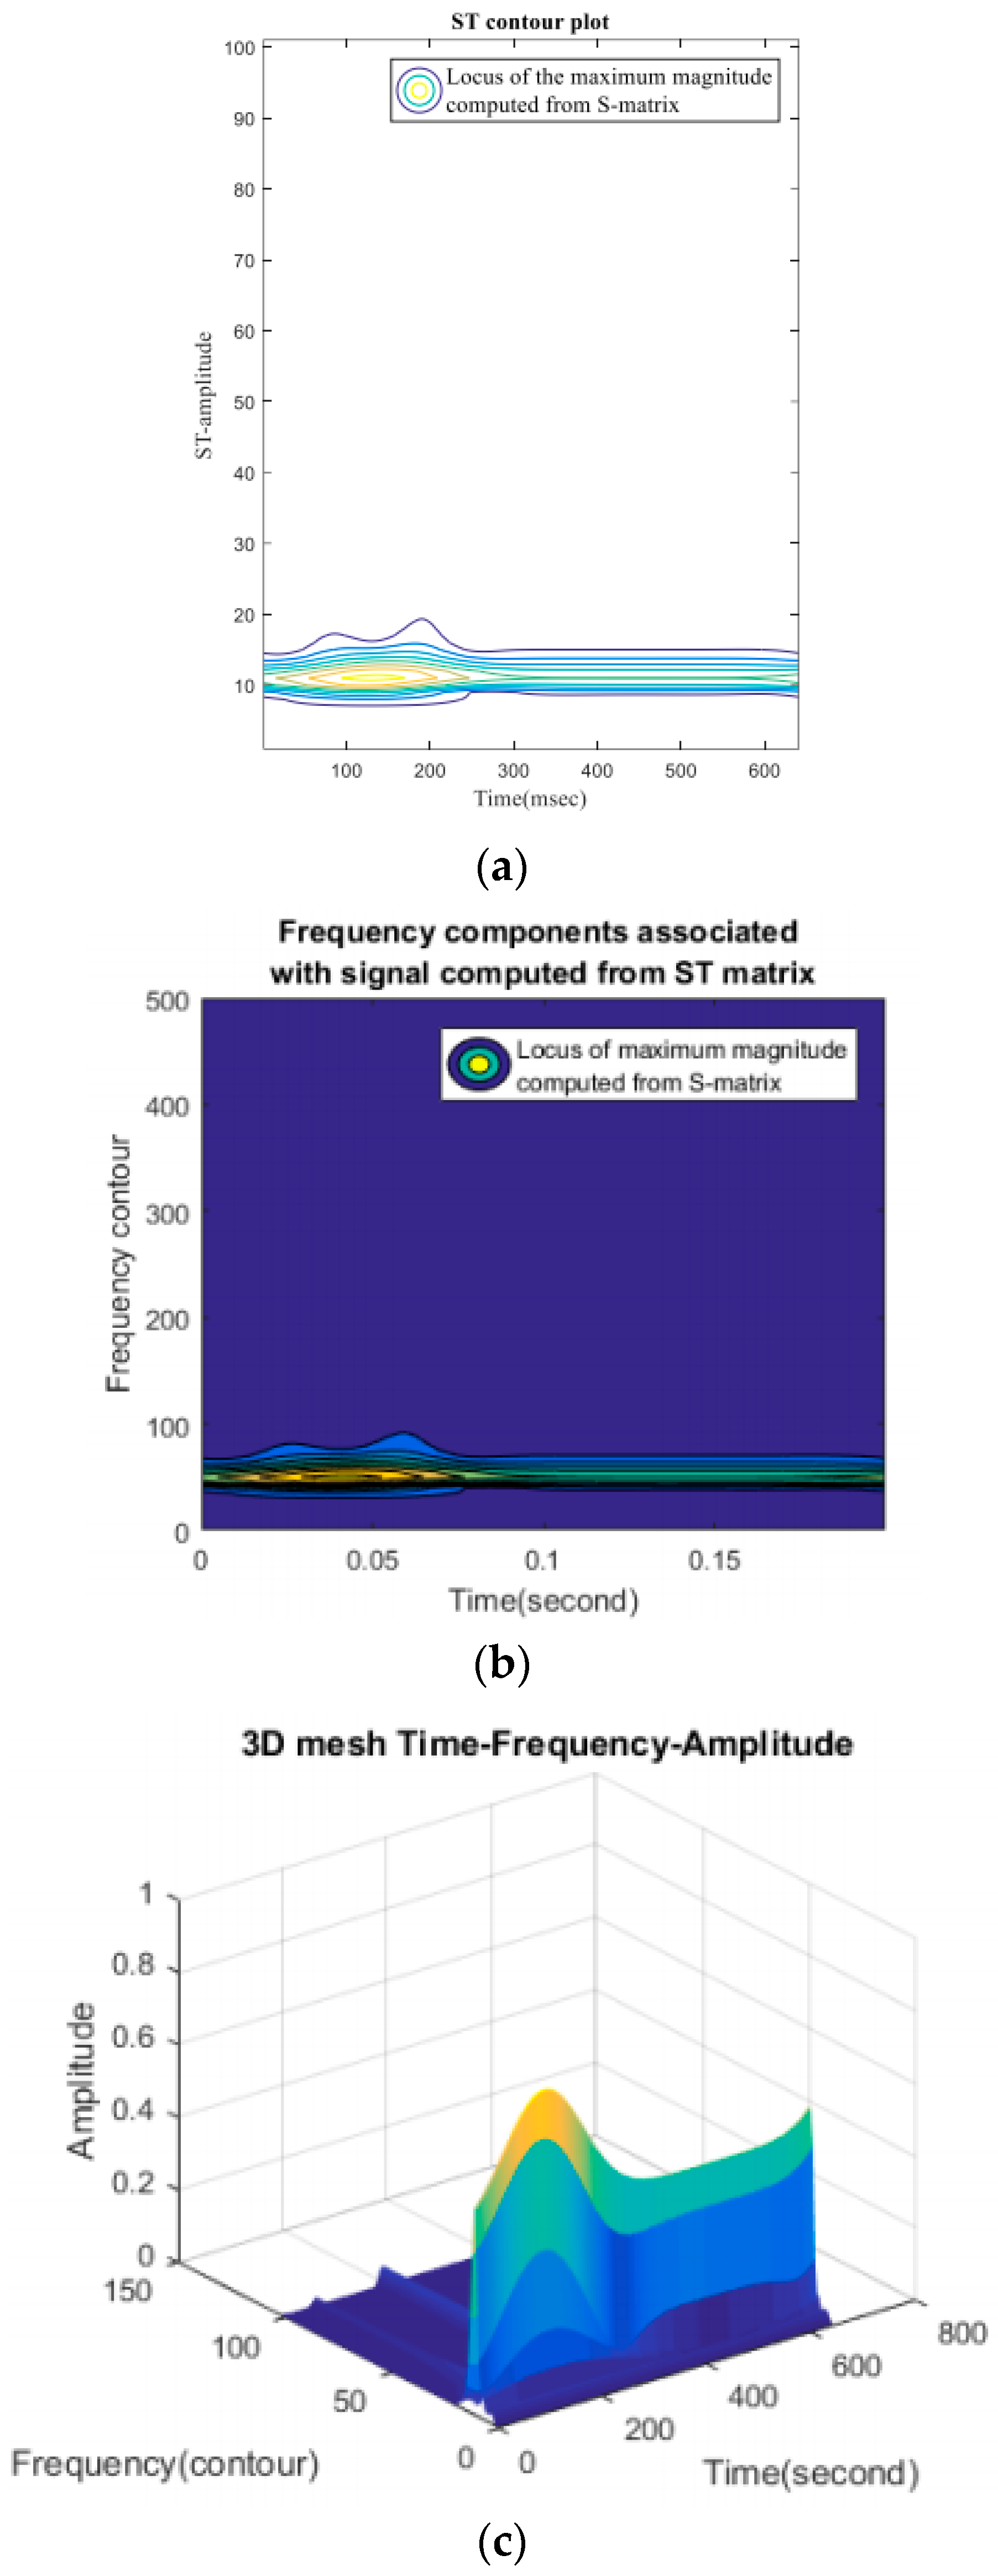
4.1. Identification of PQ Issues Using Stockwell Transform

This section presents the results of the identification of various PQ issues using the ST.

4.1.1. PQ Disturbances Pattern Generation

Figure 7 demonstrates the instantaneous waveform of measured phase voltages at the PCC.
Figure 7. Phase voltages at the PCC (a) Instantaneous voltage waveform at PCC for Phase A (b) Instantaneous voltage waveform at PCC for Phase B, (c) Instantaneous voltage waveform at PCC for Phase C.
Figure 8 presents the measured voltage at bus 33 kV side bus.
Figure 8. (a) Measured voltage at bus 33 kV side bus (b) instantaneous waveform of measured current at the PCC in bus 0.4 kV.
Furthermore, Figure 9 presents the instantaneous waveform of measured voltage at PCC phase A in the interruption case.
Figure 9. Instantaneous waveform of measured voltage at the PCC phase a.

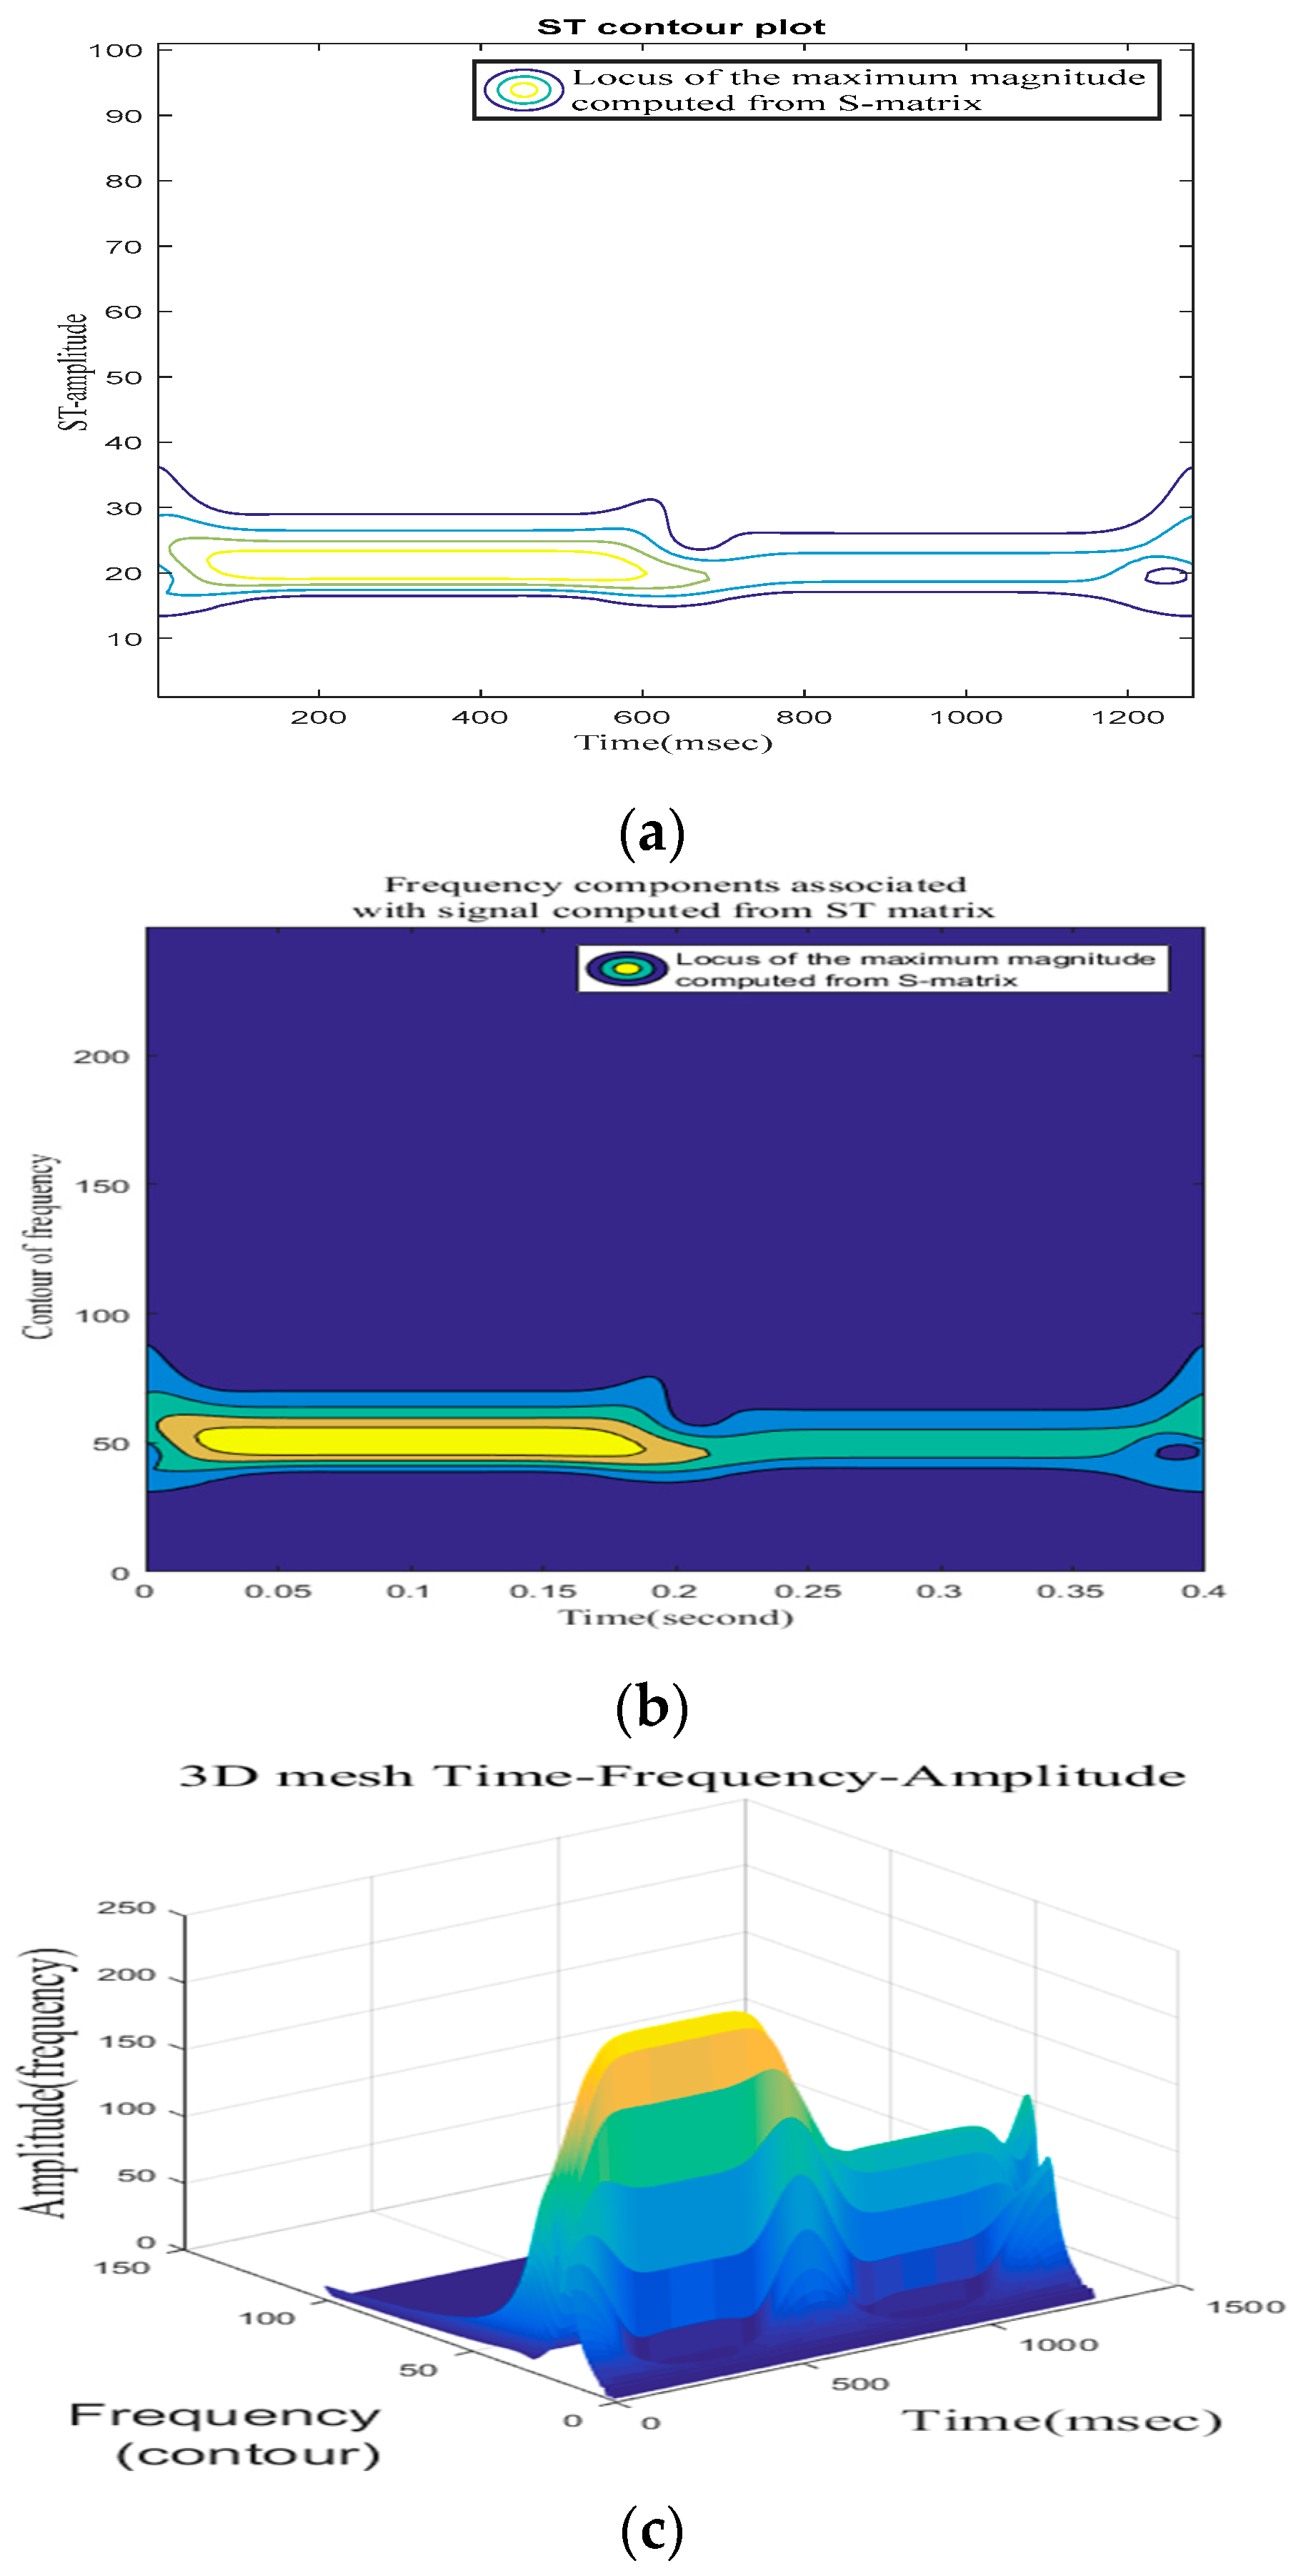
4.1.2. Detection of Harmonics

Based on phase voltage A presented in Figure 8a, Figure 10a presents the contour plots of S-transform absolute value coefficients in phase A sag with harmonics. Figure 10b presents the signal contaminated with the instantaneous voltage of phase A and S-transform contours of the absolute value. Figure 10c presents the 3D mesh time-frequency-amplitude of phase A voltage.
Figure 10. (a) Contour plots of ST absolute value coefficients in phase A sag with harmonics, (b) Signal contaminated with Harmonics and instantaneous voltage and ST contours absolute value, (c) 3D mesh time-frequency-amplitude.
Between the intervals of 0–600 and 600–1200 milliseconds, respectively, the ST contours demonstrate the presence of various voltage disturbances. This model can assist in identifying voltage change disturbances and recognizing all voltage variances.

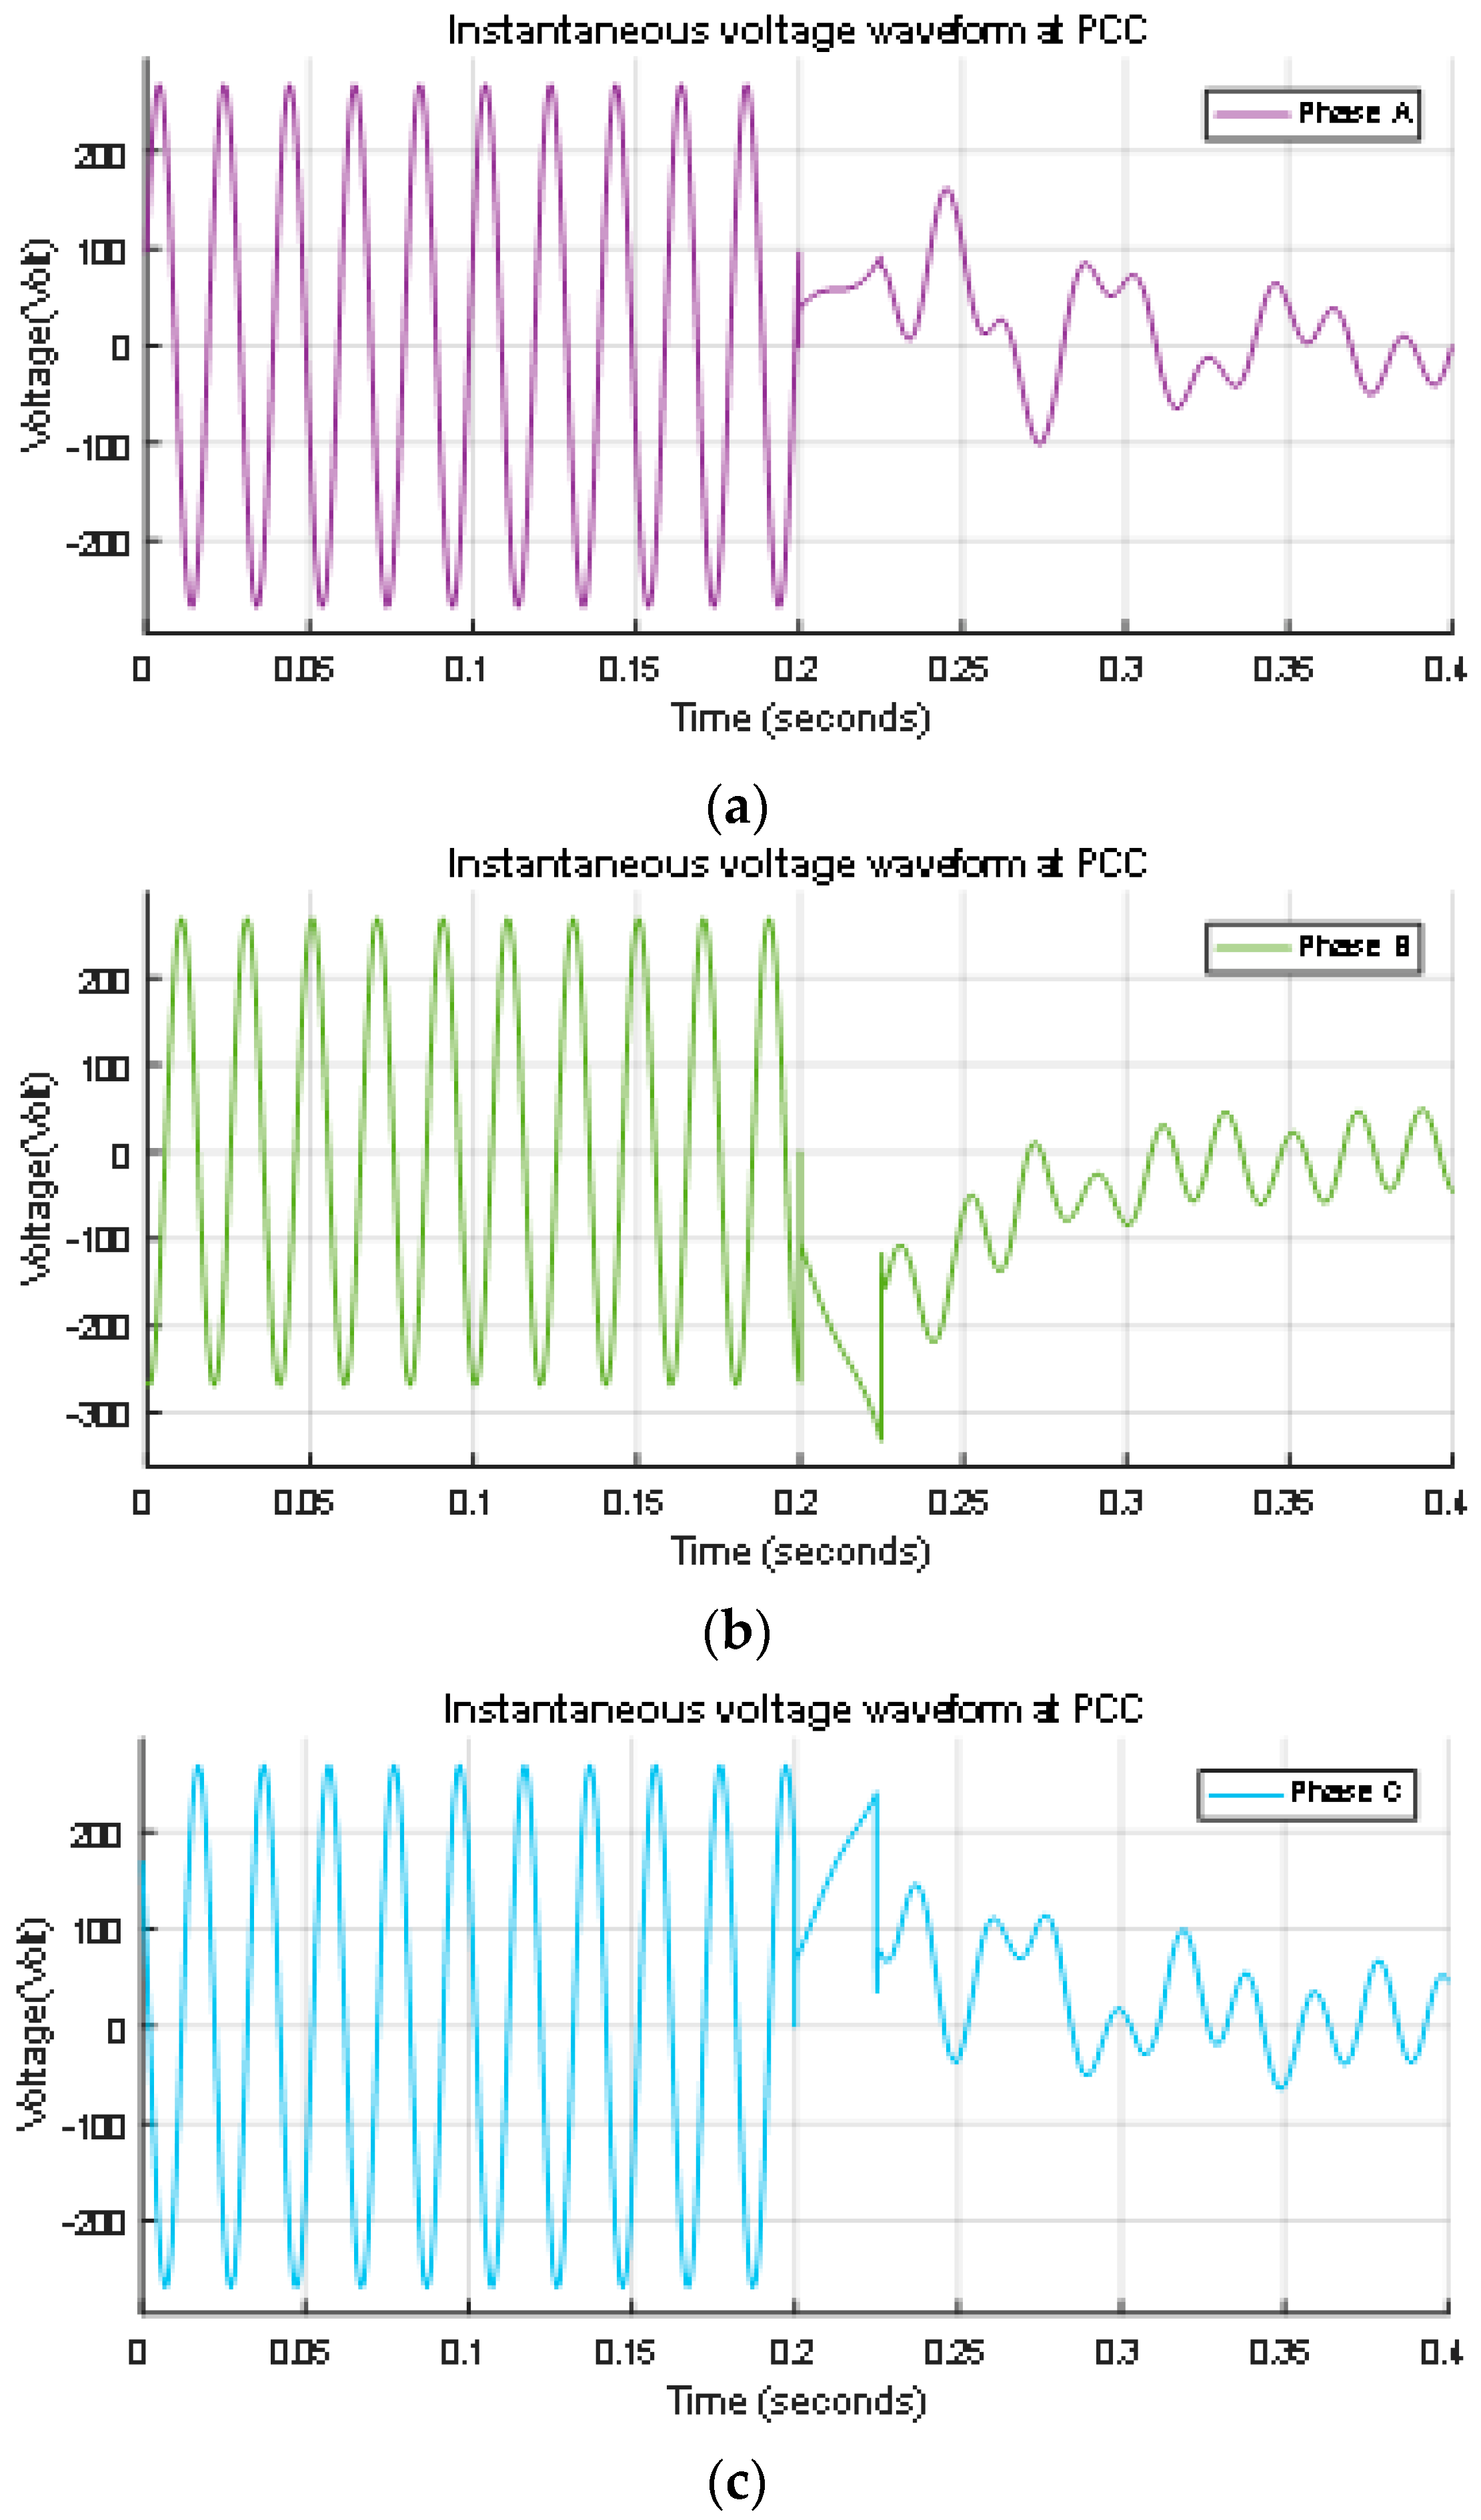
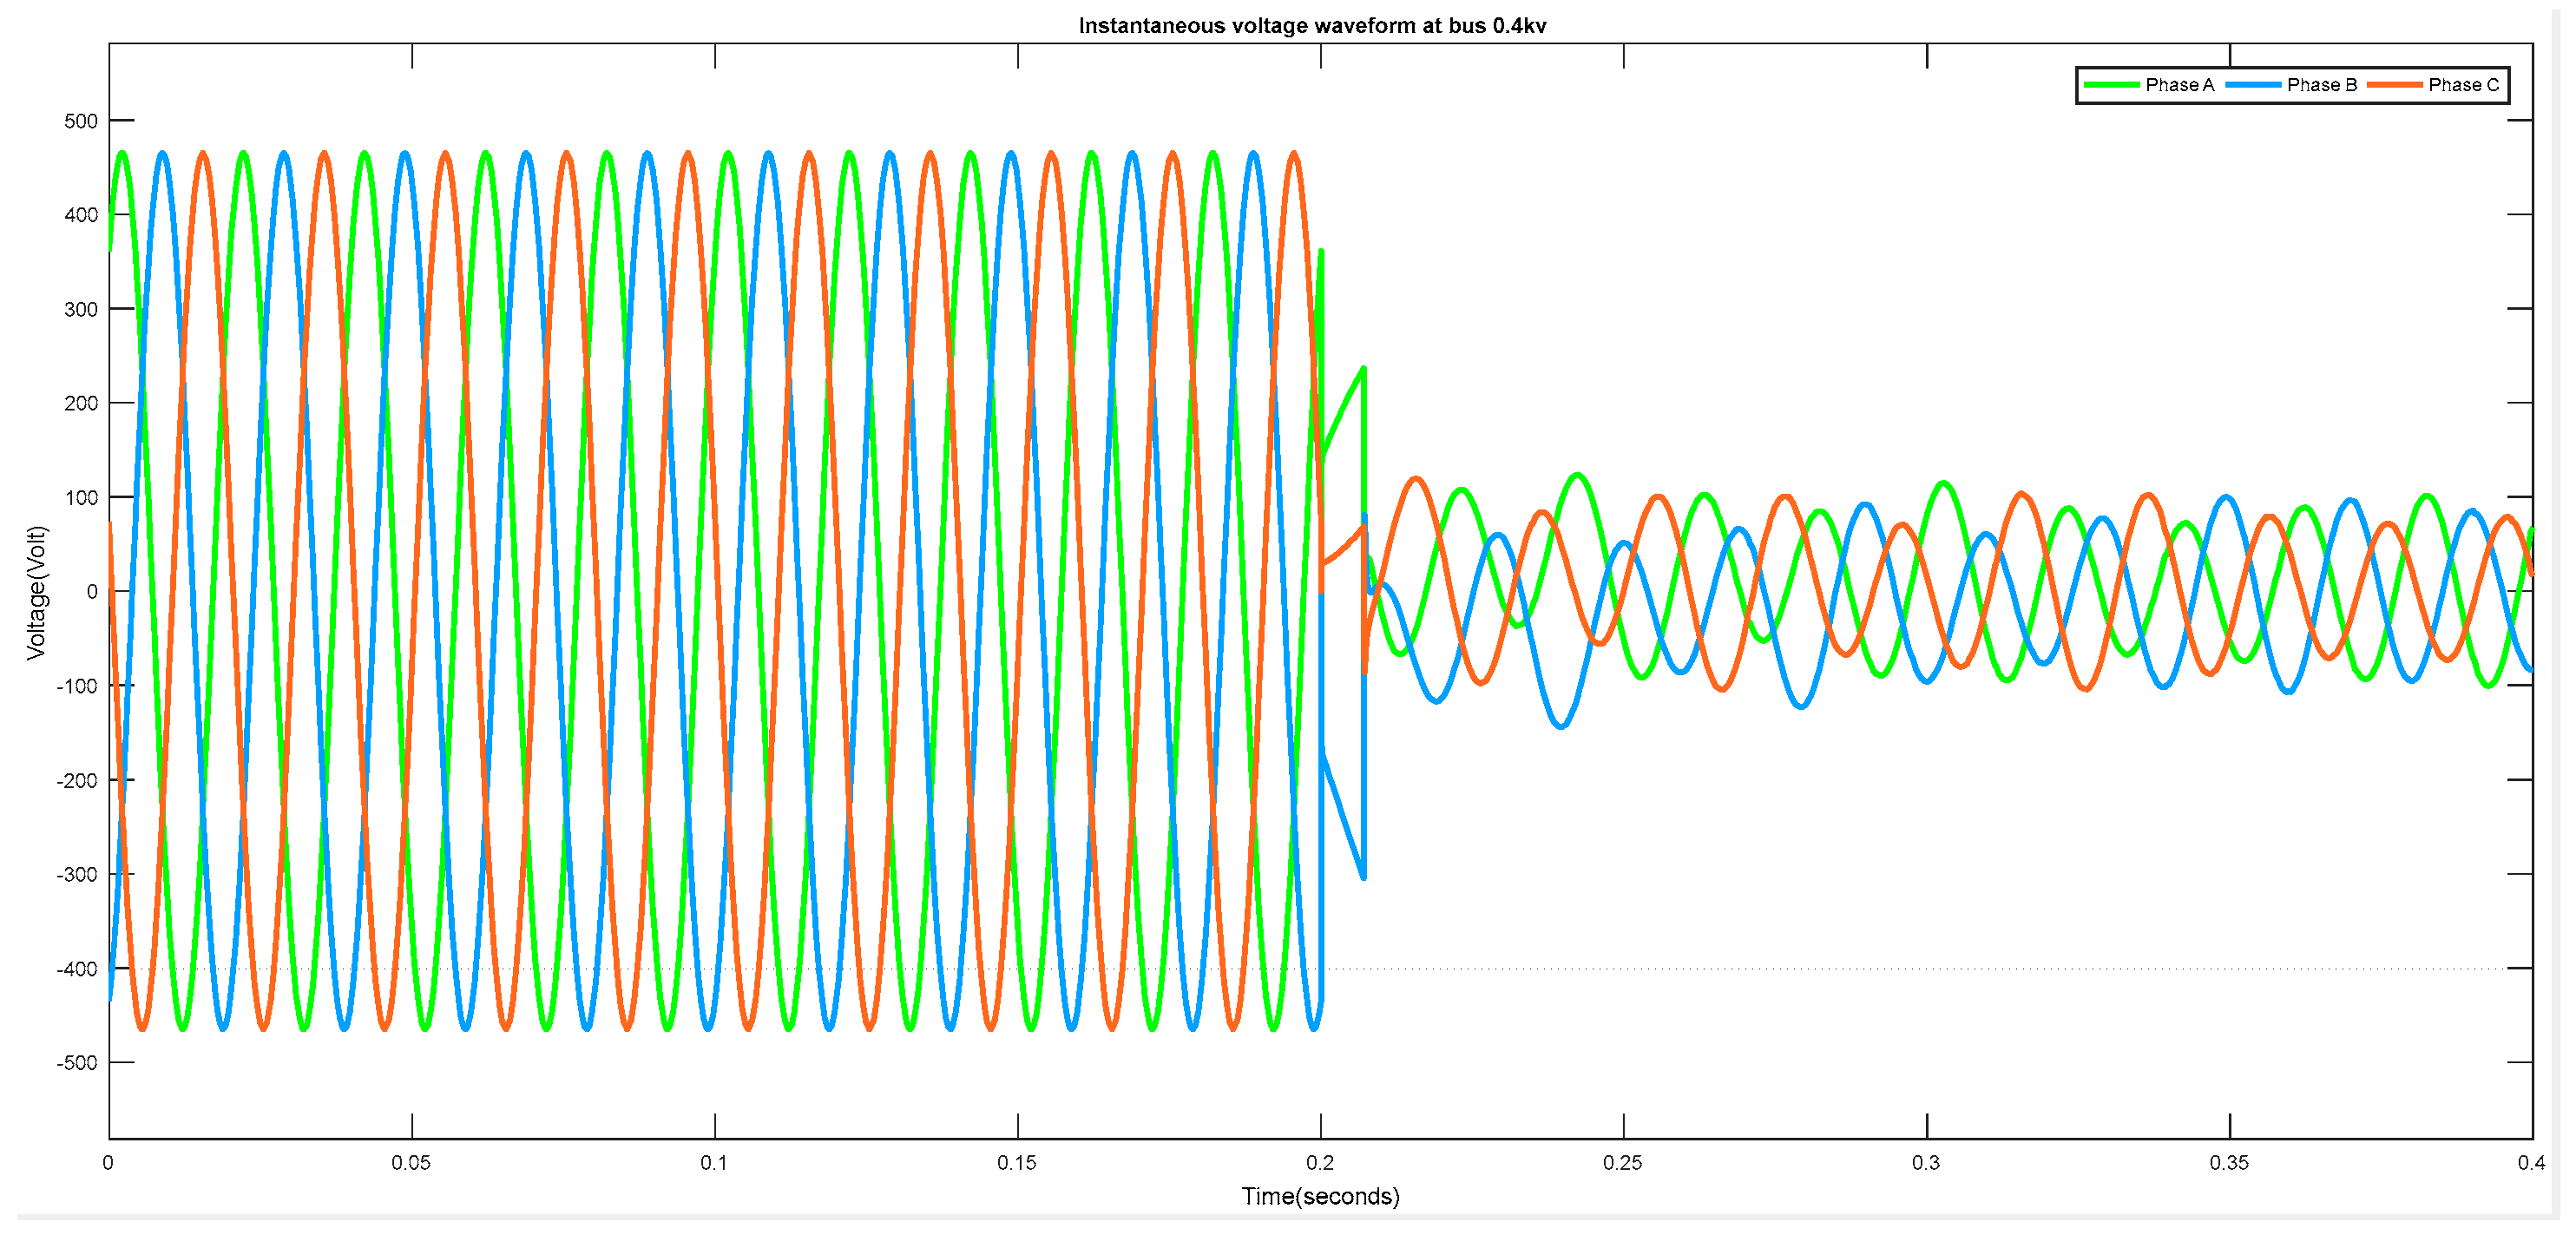
4.1.3. Voltage Swell
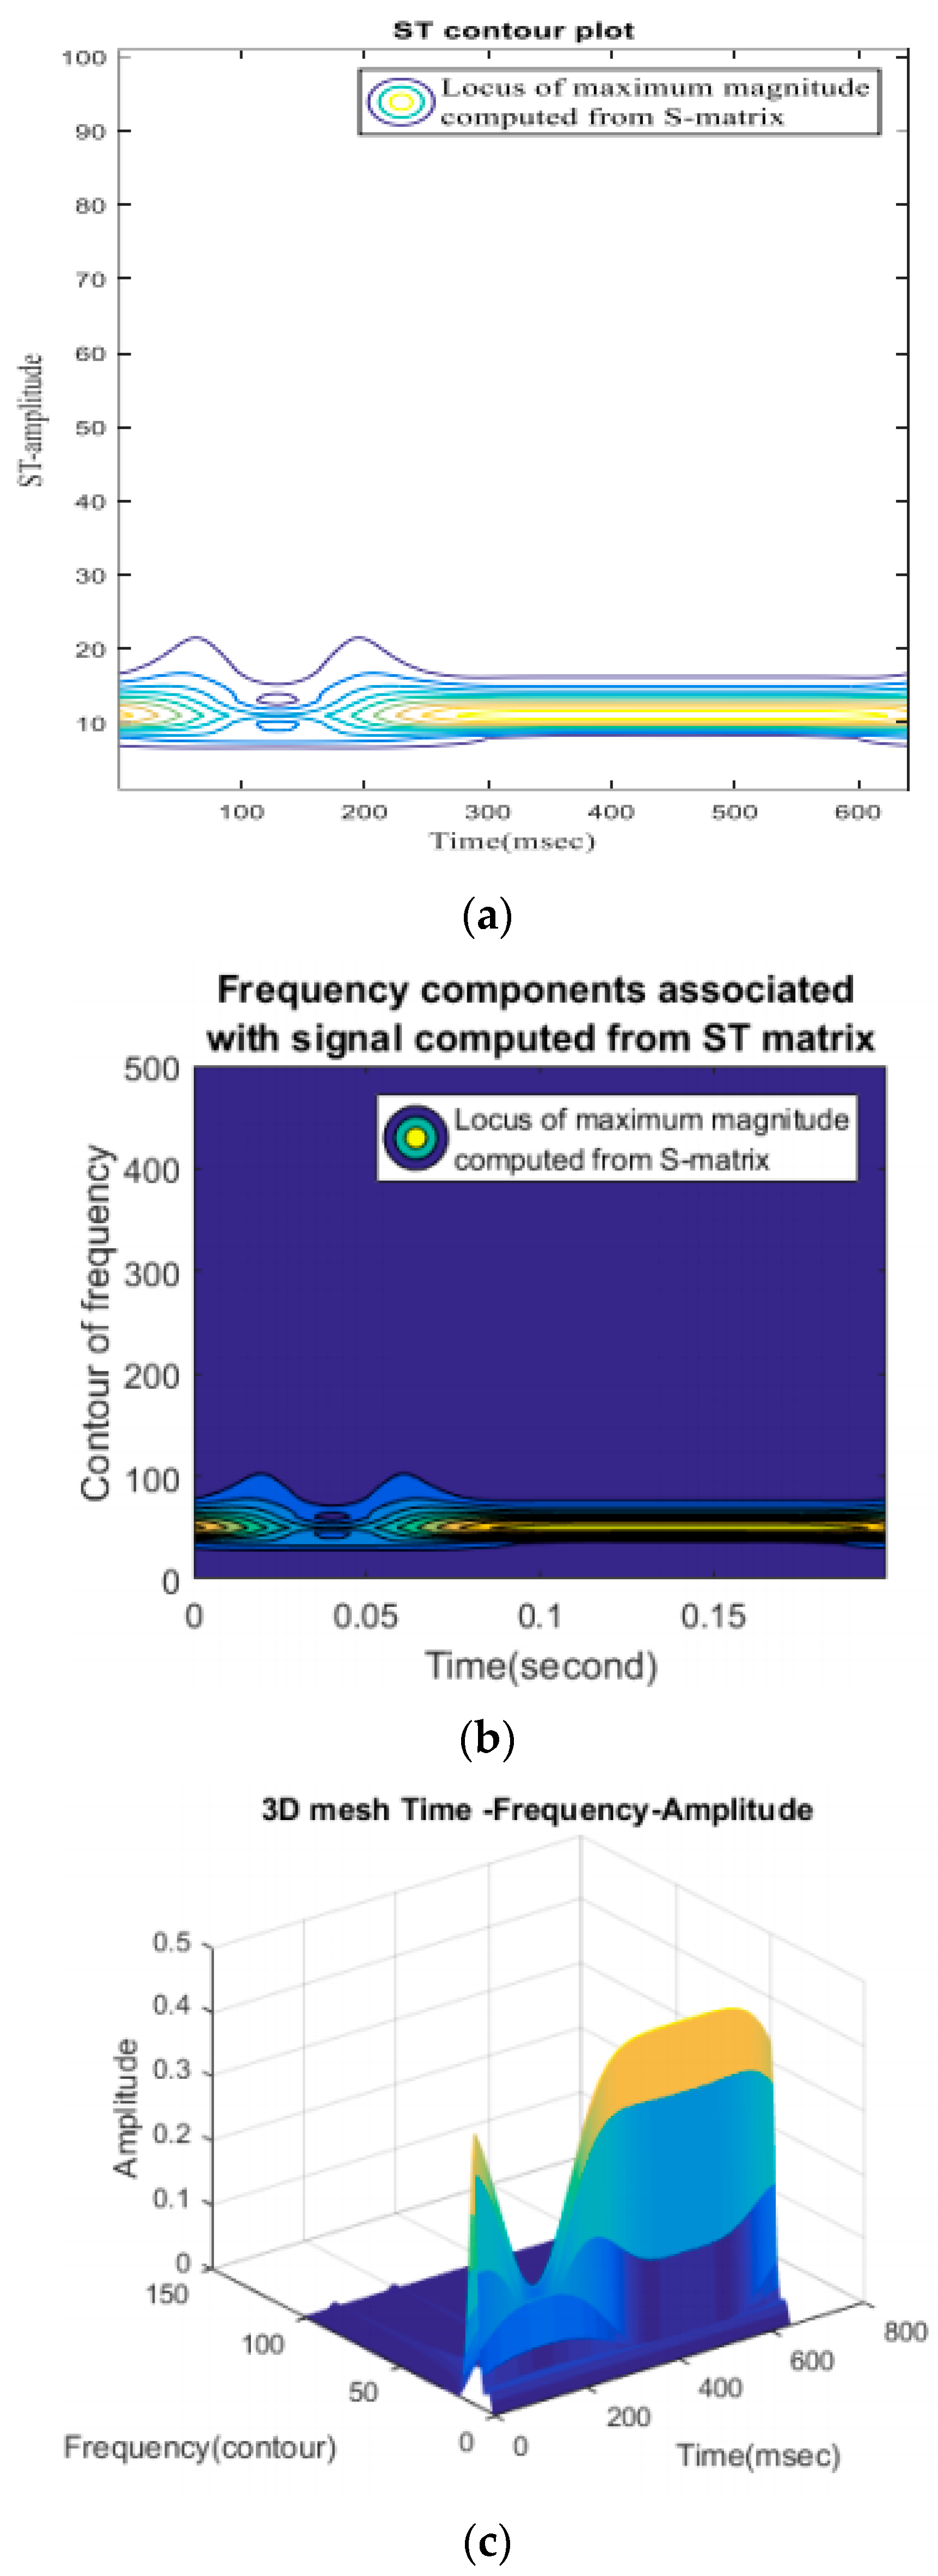
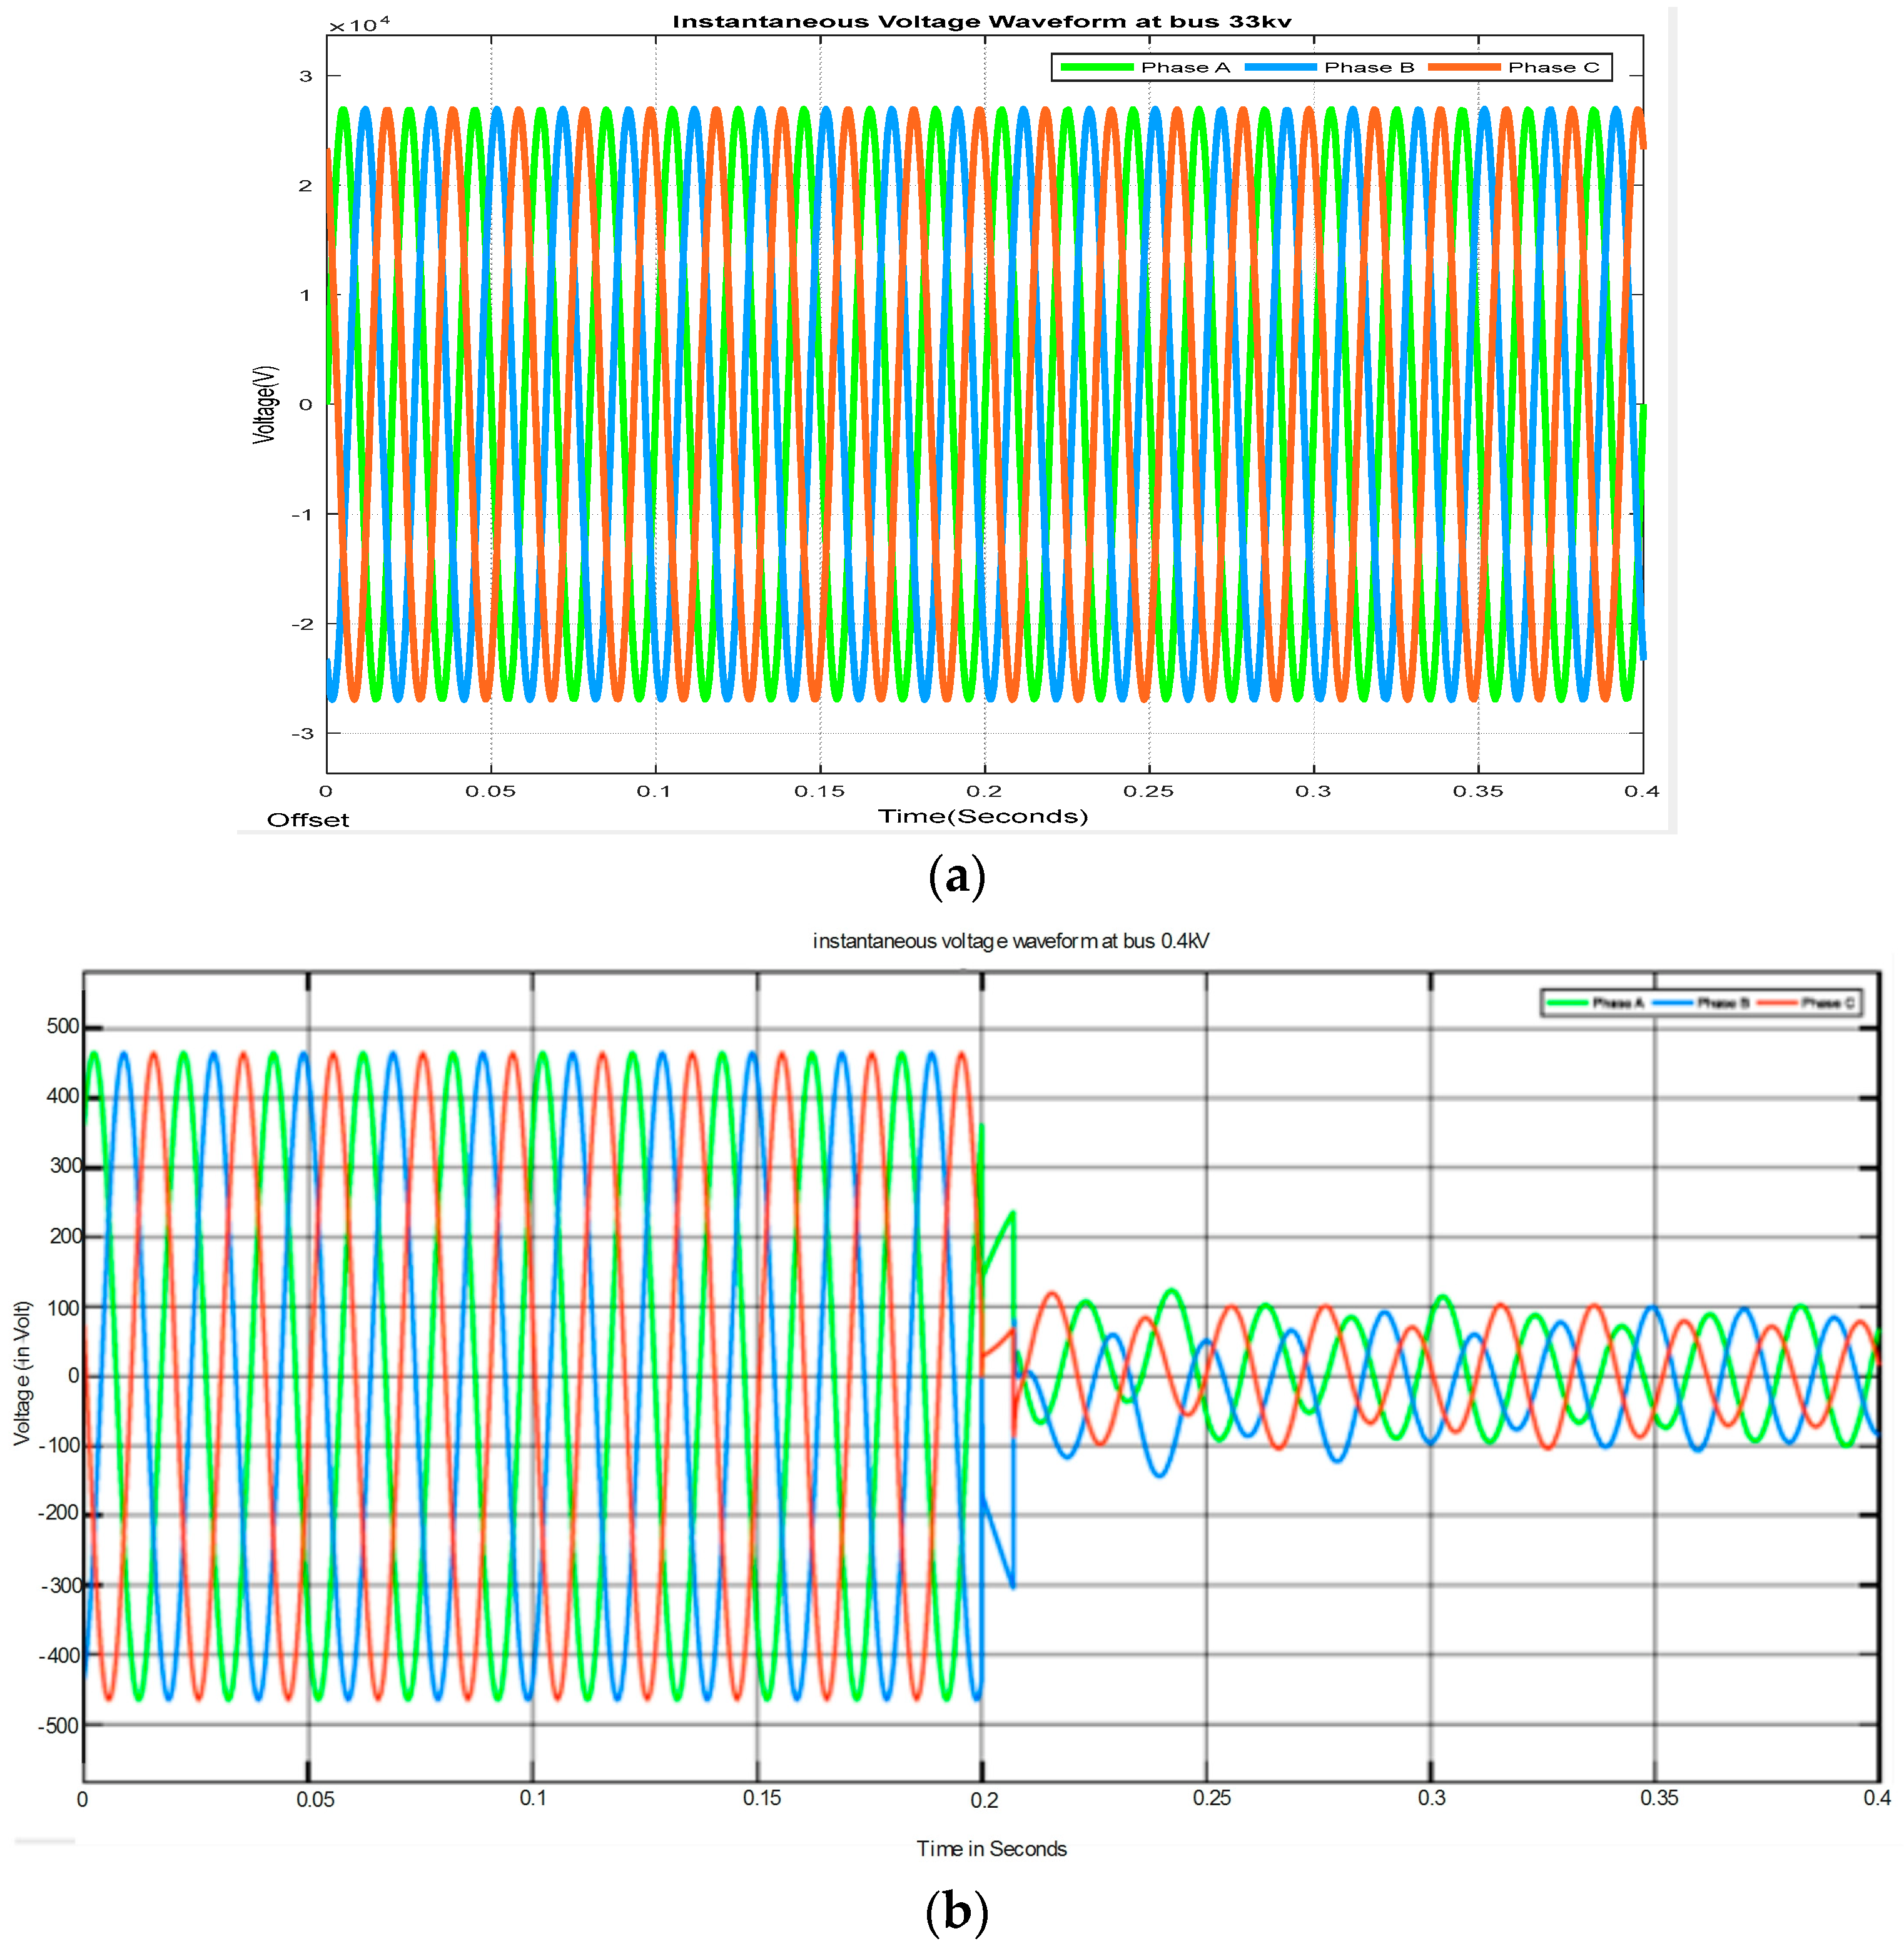
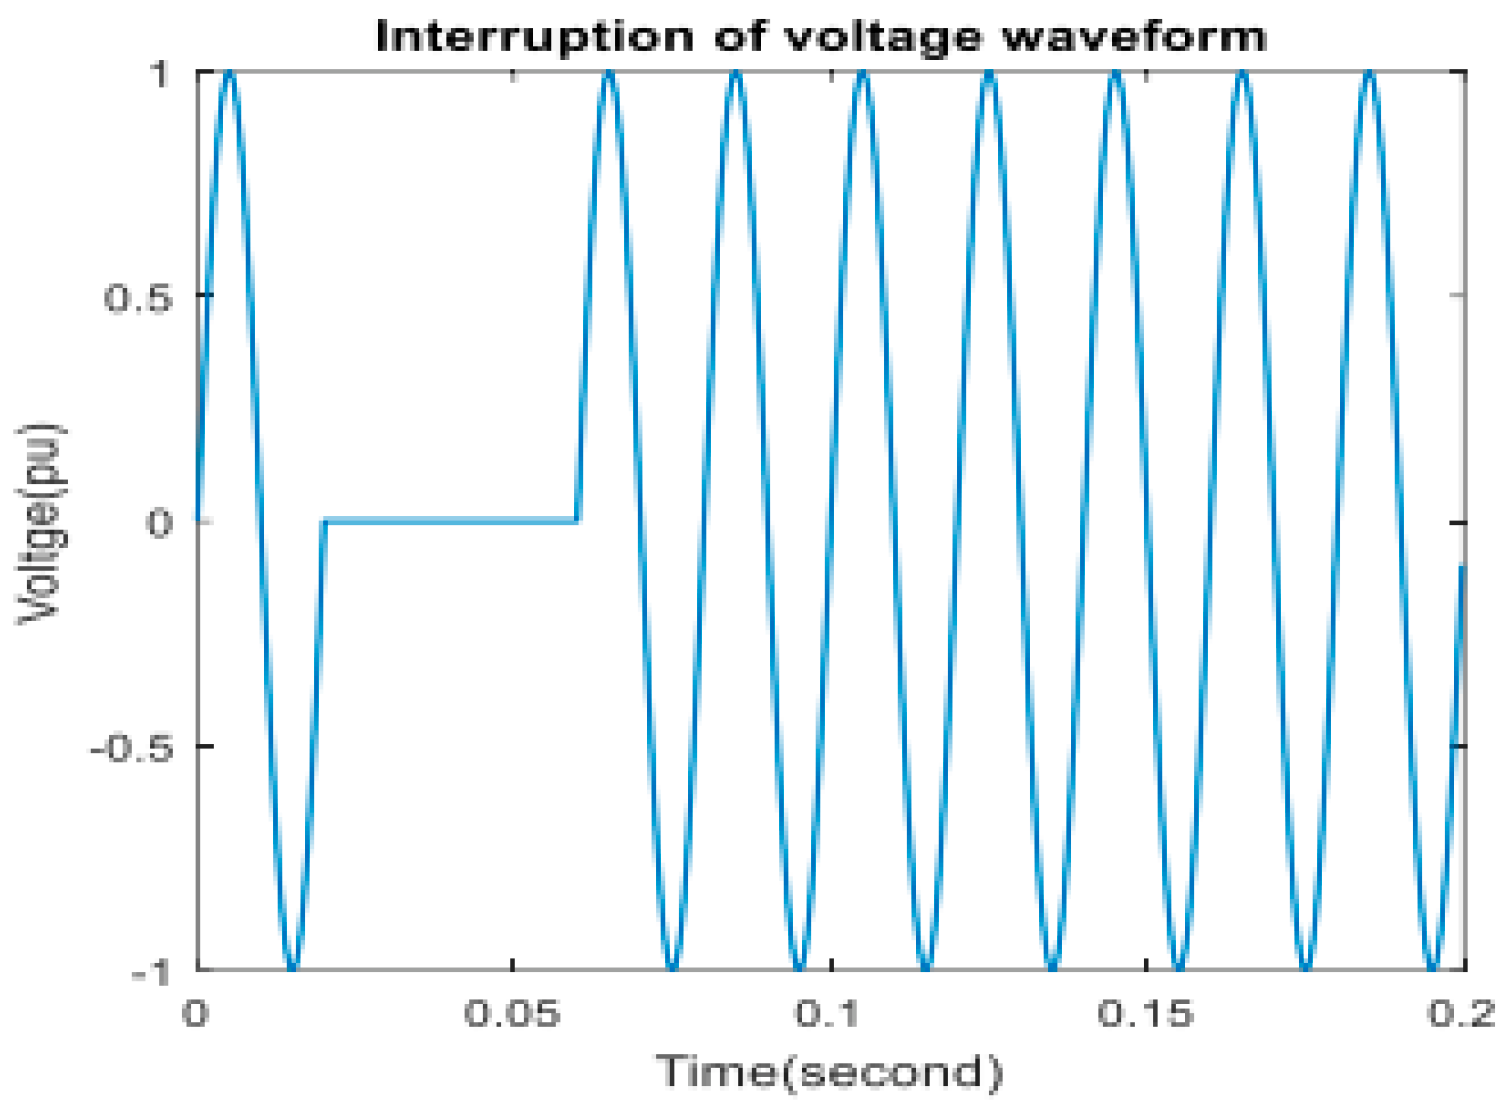
Figure 11 presents the results of the voltage swell power quality issue. Figure 11a presents the contour plots of ST absolute value coefficients in phase A swell. Figure 11b presents the signal contaminated with instantaneous voltage and ST contours absolute value, and Figure 11c presents the 3D mesh time-frequency-amplitude.
Figure 11. (a) Contour plots of ST absolute value coefficients in phase A swell, (b) Signal contaminated with instantaneous voltage and ST contours absolute value, (c) 3D mesh time-frequency-amplitude.

4.1.4. Interruption

Figure 12 presents the results of interruption related power quality issues. Figure 12a presented the contour plots of ST absolute value coefficients in phase A. Figure 12b presented the signal contaminated with interruption voltage and ST contours absolute, and Figure 12c presents the 3D mesh time-frequency-amplitude.
Figure 12. (a) Contour plots of ST absolute value coefficients in phase A. (b) Signal contaminated with interruption voltage and ST contours absolute (c) 3D mesh time-frequency-amplitude.
Additionally, the ST will produce temporal frequency contours that can show the patterns of the individual single-power quality disturbances. Figure 10 displays the ST contours of a single power quality disturbance. The instantaneous waveform of the measured voltage at PCC phase A is shown in its original waveform in Figure 7 and Figure 9, respectively. The ST contours of the presence of various voltage disturbances between the times of 0–600 and 600–1200, 0–250 and 0–100, and 100–200 milliseconds, respectively, were shown in Figure 10a, Figure 11a and Figure 12a. Figure 10c, Figure 11c and Figure 12c demonstrate how ST contours can be employed in 3D mesh time-frequency-amplitude analysis to identify both single and numerous disturbances. This model can assist in identifying voltage change disturbances and recognizing all voltage variances.

4.1.5. Comparative Analysis between ST and Other Algorithms

When compared to other time-frequency representations, such as the FT, WT, and HT, the ST is preferable, as shown in Figure 13 and Figure 14. In terms of their operation parameters and effectiveness, the proposed ST is compared in this section to previous signal processing methods used for PQ disturbances.
Figure 13. Identification accuracy of ST and other algorithms.
Figure 14. Identification error comparison of ST and other algorithms.
Detecting power quality disturbances using ST demonstrated the ability to correctly recognize these disturbances.

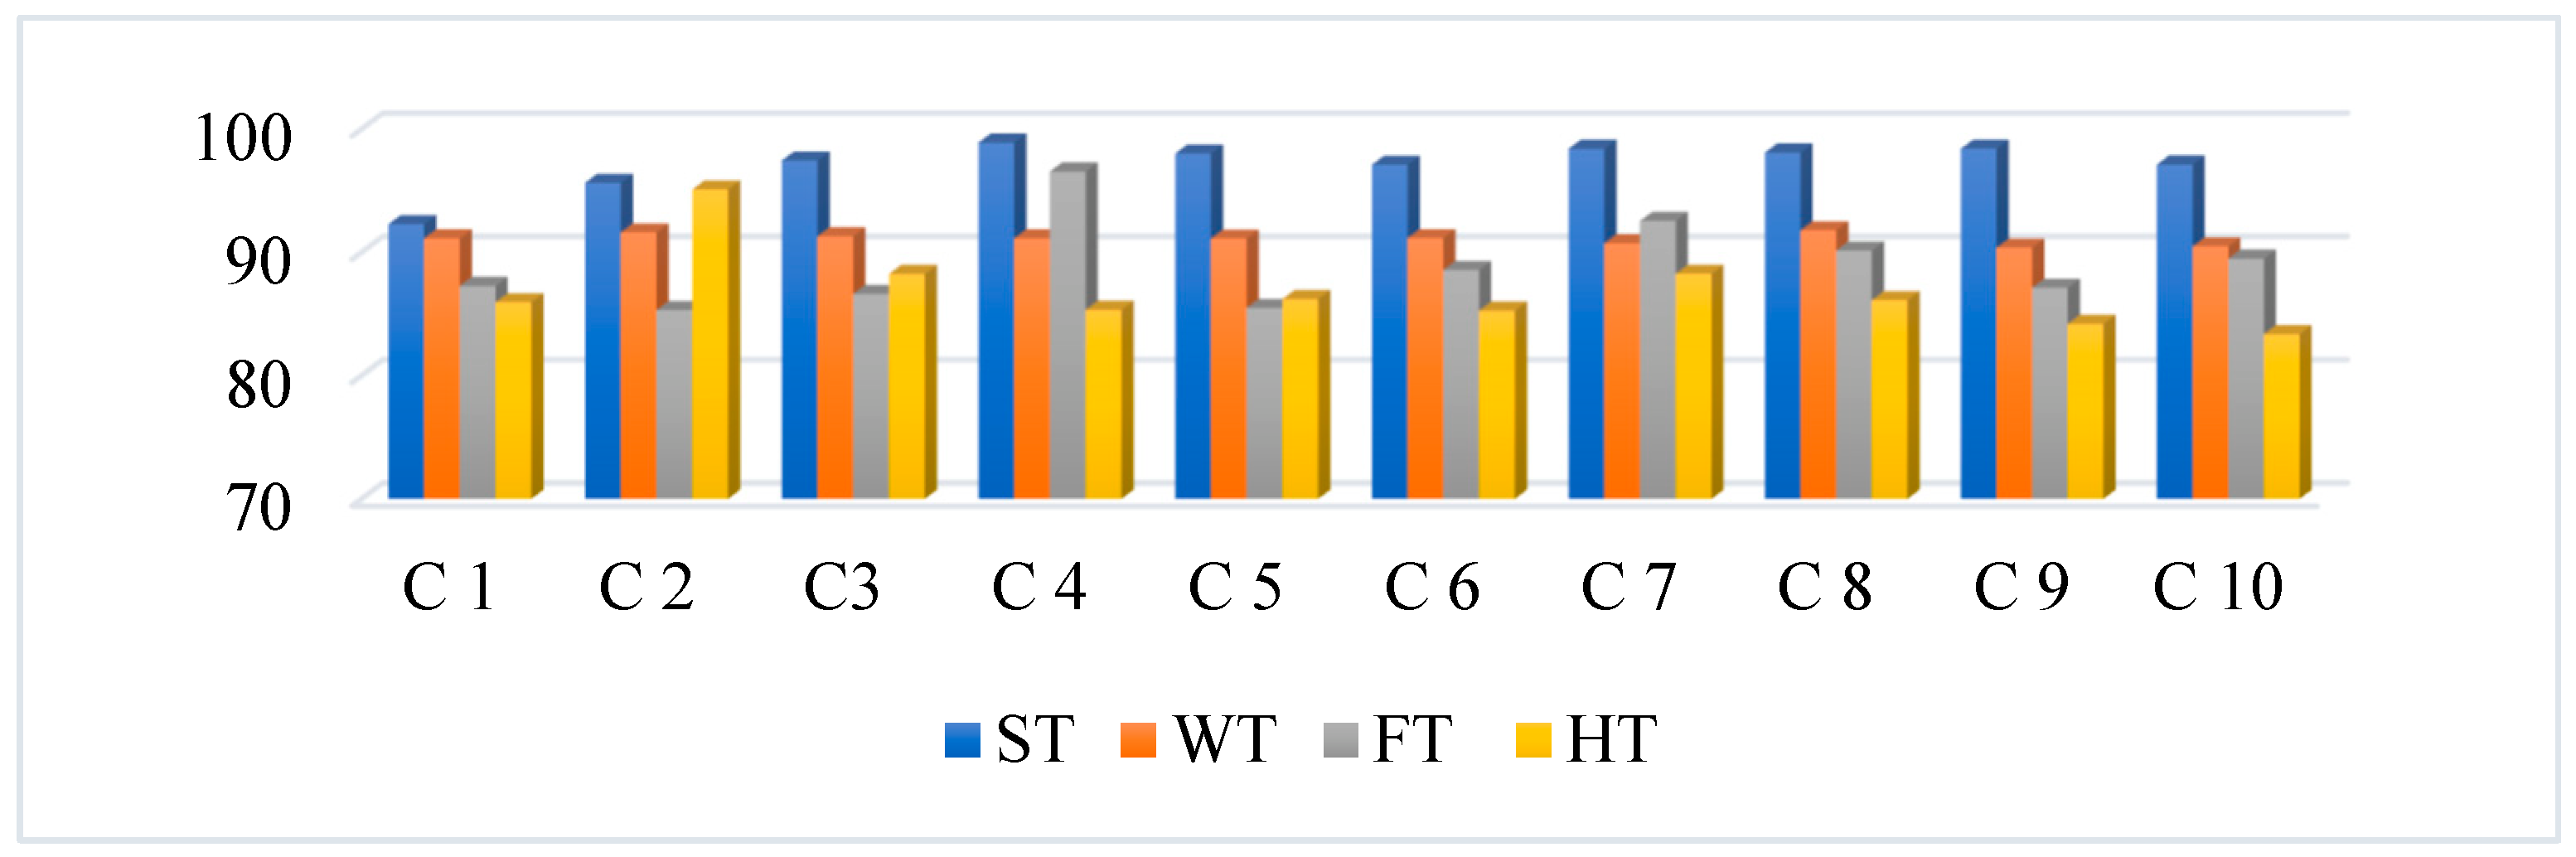
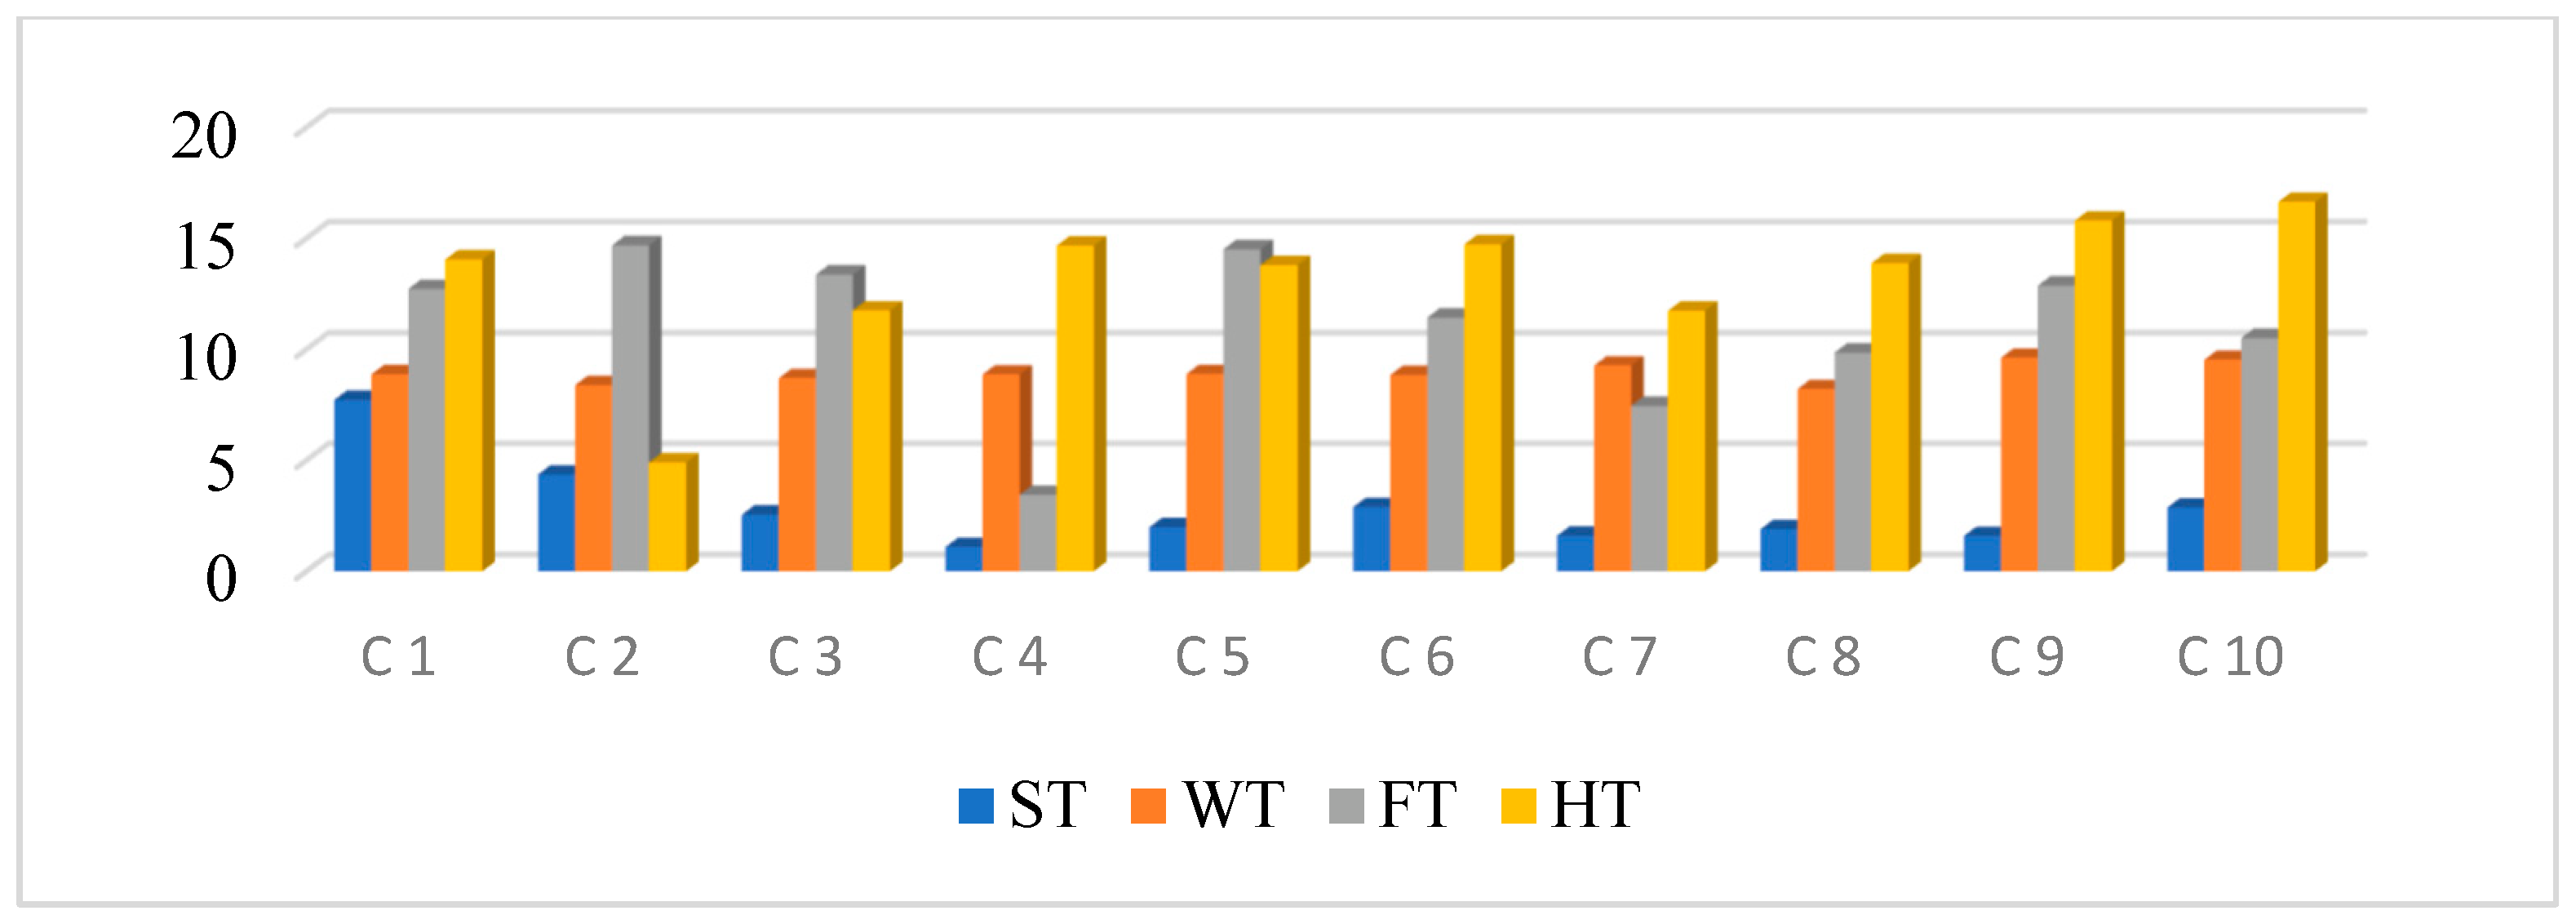
4.2. Classifications of PQ Disturbances Using Proposed Technique

This section presents the results of the proposed SVM technique for PQ disturbances’ classification. Table 3 presents the confusion matrix for the proposed SVM technique of PQ disturbance classification.
Table 3. Confusion matrix.
True Positives (TP), or disturbances that were correctly recognized, are represented by the diagonal elements in the confusion matrix, while off-diagonal components show the disturbance data samples that were incorrectly classified. All row elements in the matrix (except the diagonal element) are False Negatives (FN), meaning that the sample is supposed to be in the predicted class but is not. The same is true for all column elements, with the exception of diagonal elements. From Table 3, it is concluded that,
  • Predicted classes are displayed in the columns. The true positive rate for correctly identified points in this class is 97%, as demonstrated in the green cell color in the true positive rate column in the top row, where more than 99% of the power quality issues from flicker are correctly classified.
  • Less than 1% of the other power quality problems in the flicker row are wrongly categorized as coming from the pure signal. The red cell in the false negative rate column displays the false negative rate for improperly categorized points in this class, which is less than 1%.
Table 4 displays a performance summary for the classifier. The accuracy is found to be 98.3% overall.
Table 4. Classifier performance summary.
Table 4 demonstrates unequivocally that the eight separate and two hybrid PQ concerns were successfully classified using the suggested techniques. Classifier performance is deemed satisfactory. Sample patterns for each of the ten kinds of disturbances were used as 250 disturbances for the SVM classifier’s testing purposes. As a result, 245.7 samples, on average, out of 250 are correctly classified, whereas 4.3 samples are incorrectly classified. The classification results demonstrate the effectiveness of the suggested technique, which is acceptable and nominally applicable due to its simplicity and low processing requirements.

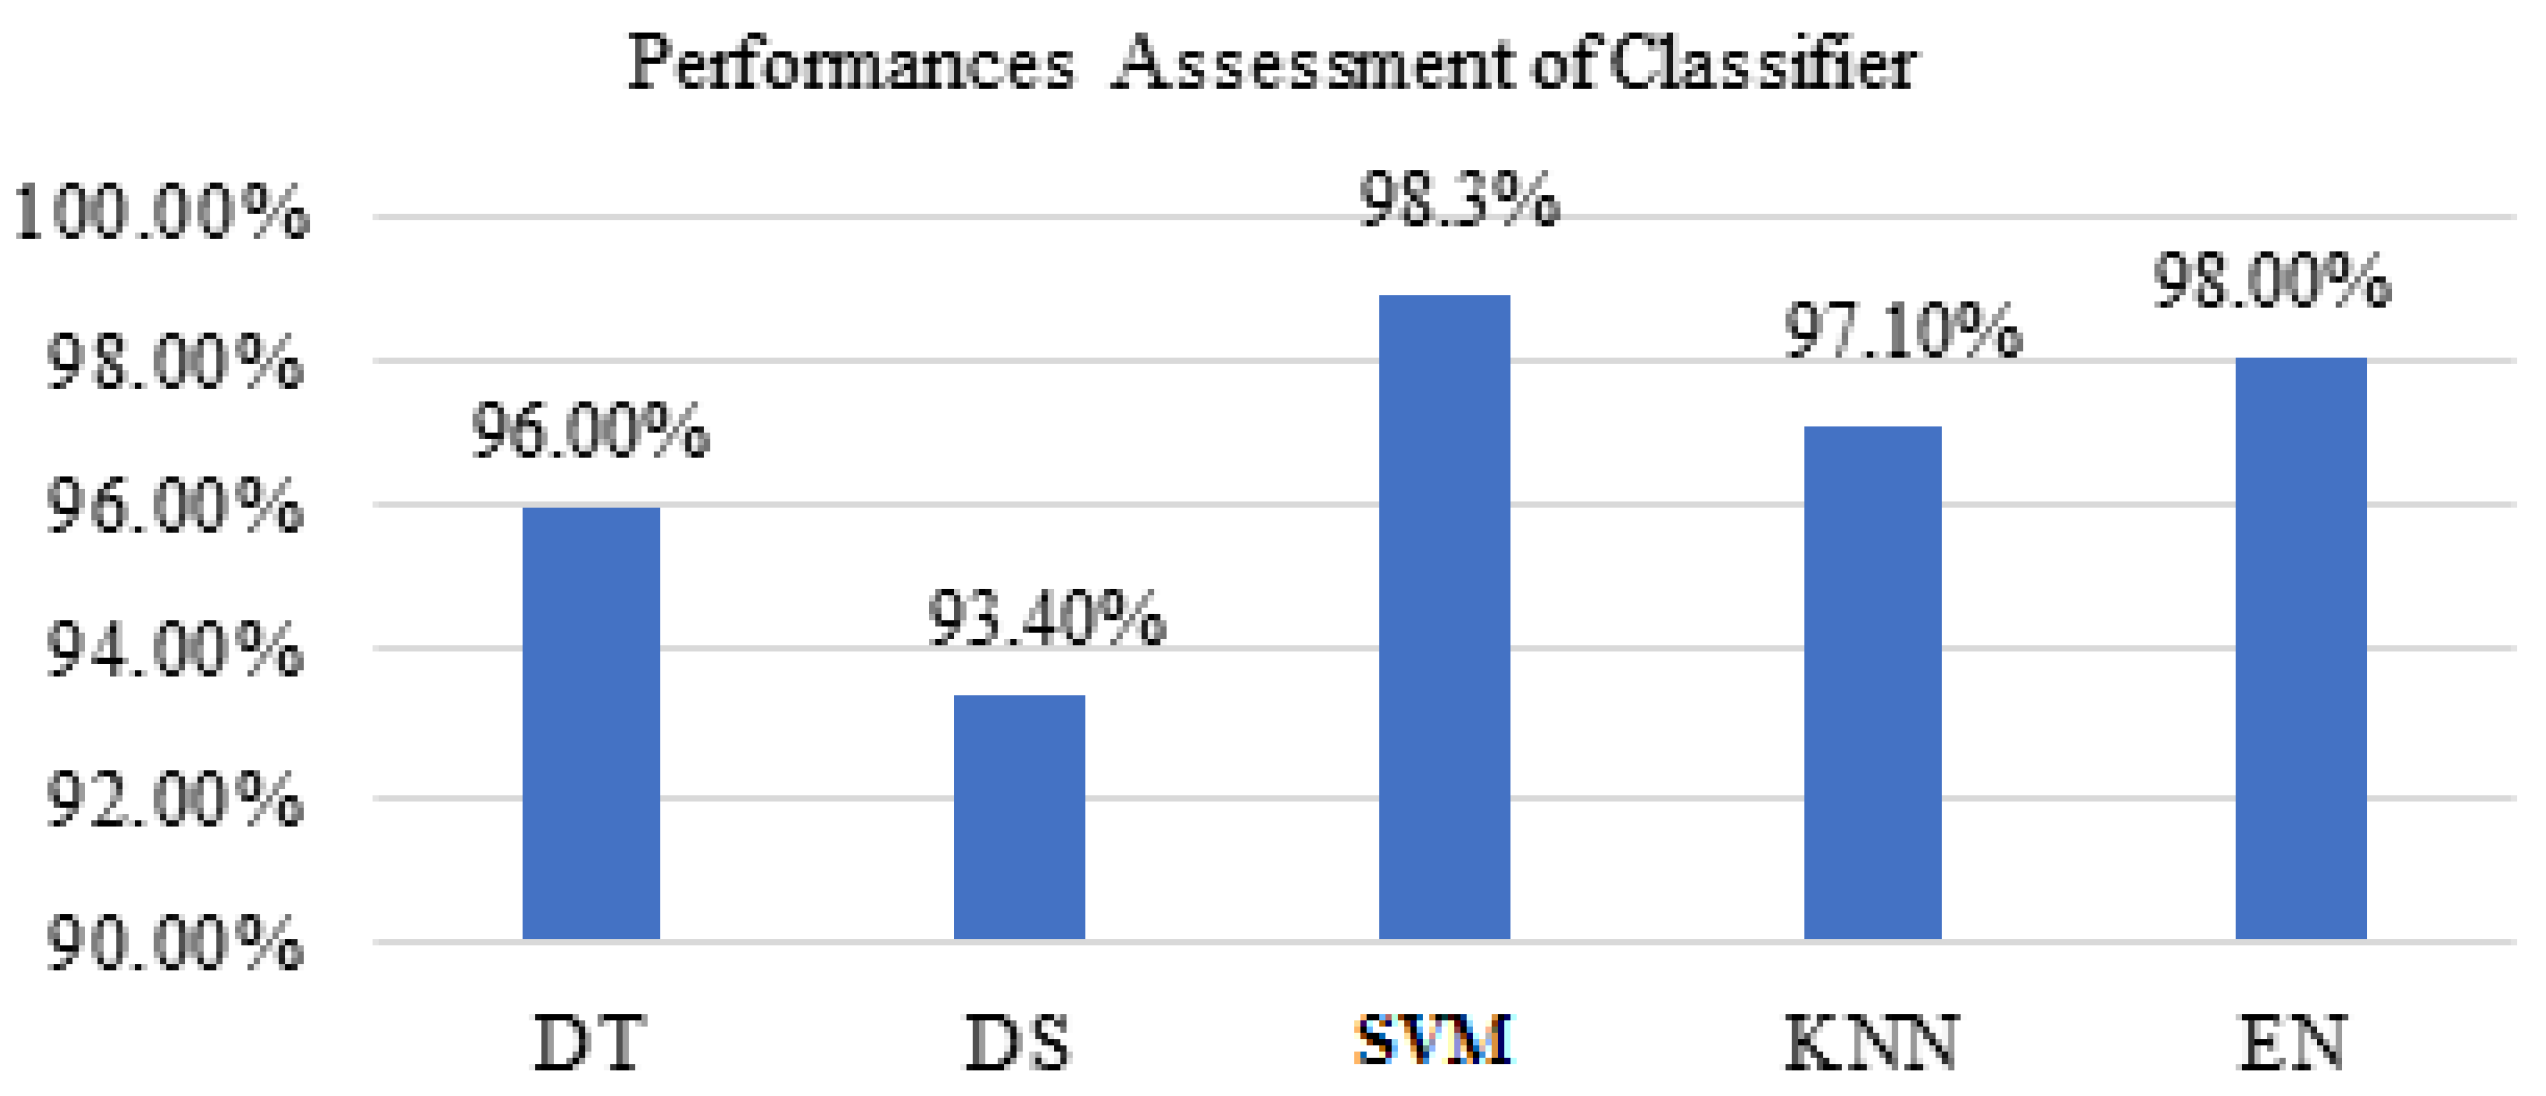
Comparative Analysis between Proposed Classifier and Other Techniques

A comparative examination of the suggested technique’s classification accuracy compared to other methods is shown in Figure 15. The figure makes it evident that the proposed strategy offers greater accuracy when compared to other methods currently in use.
Figure 15. Performances Assessment of Classifier.
Where DT represents decision trees, DS represents discriminators analysis, SVM represents support vector machine, KNN represents nearest neighbor, and EN represents ensembles.

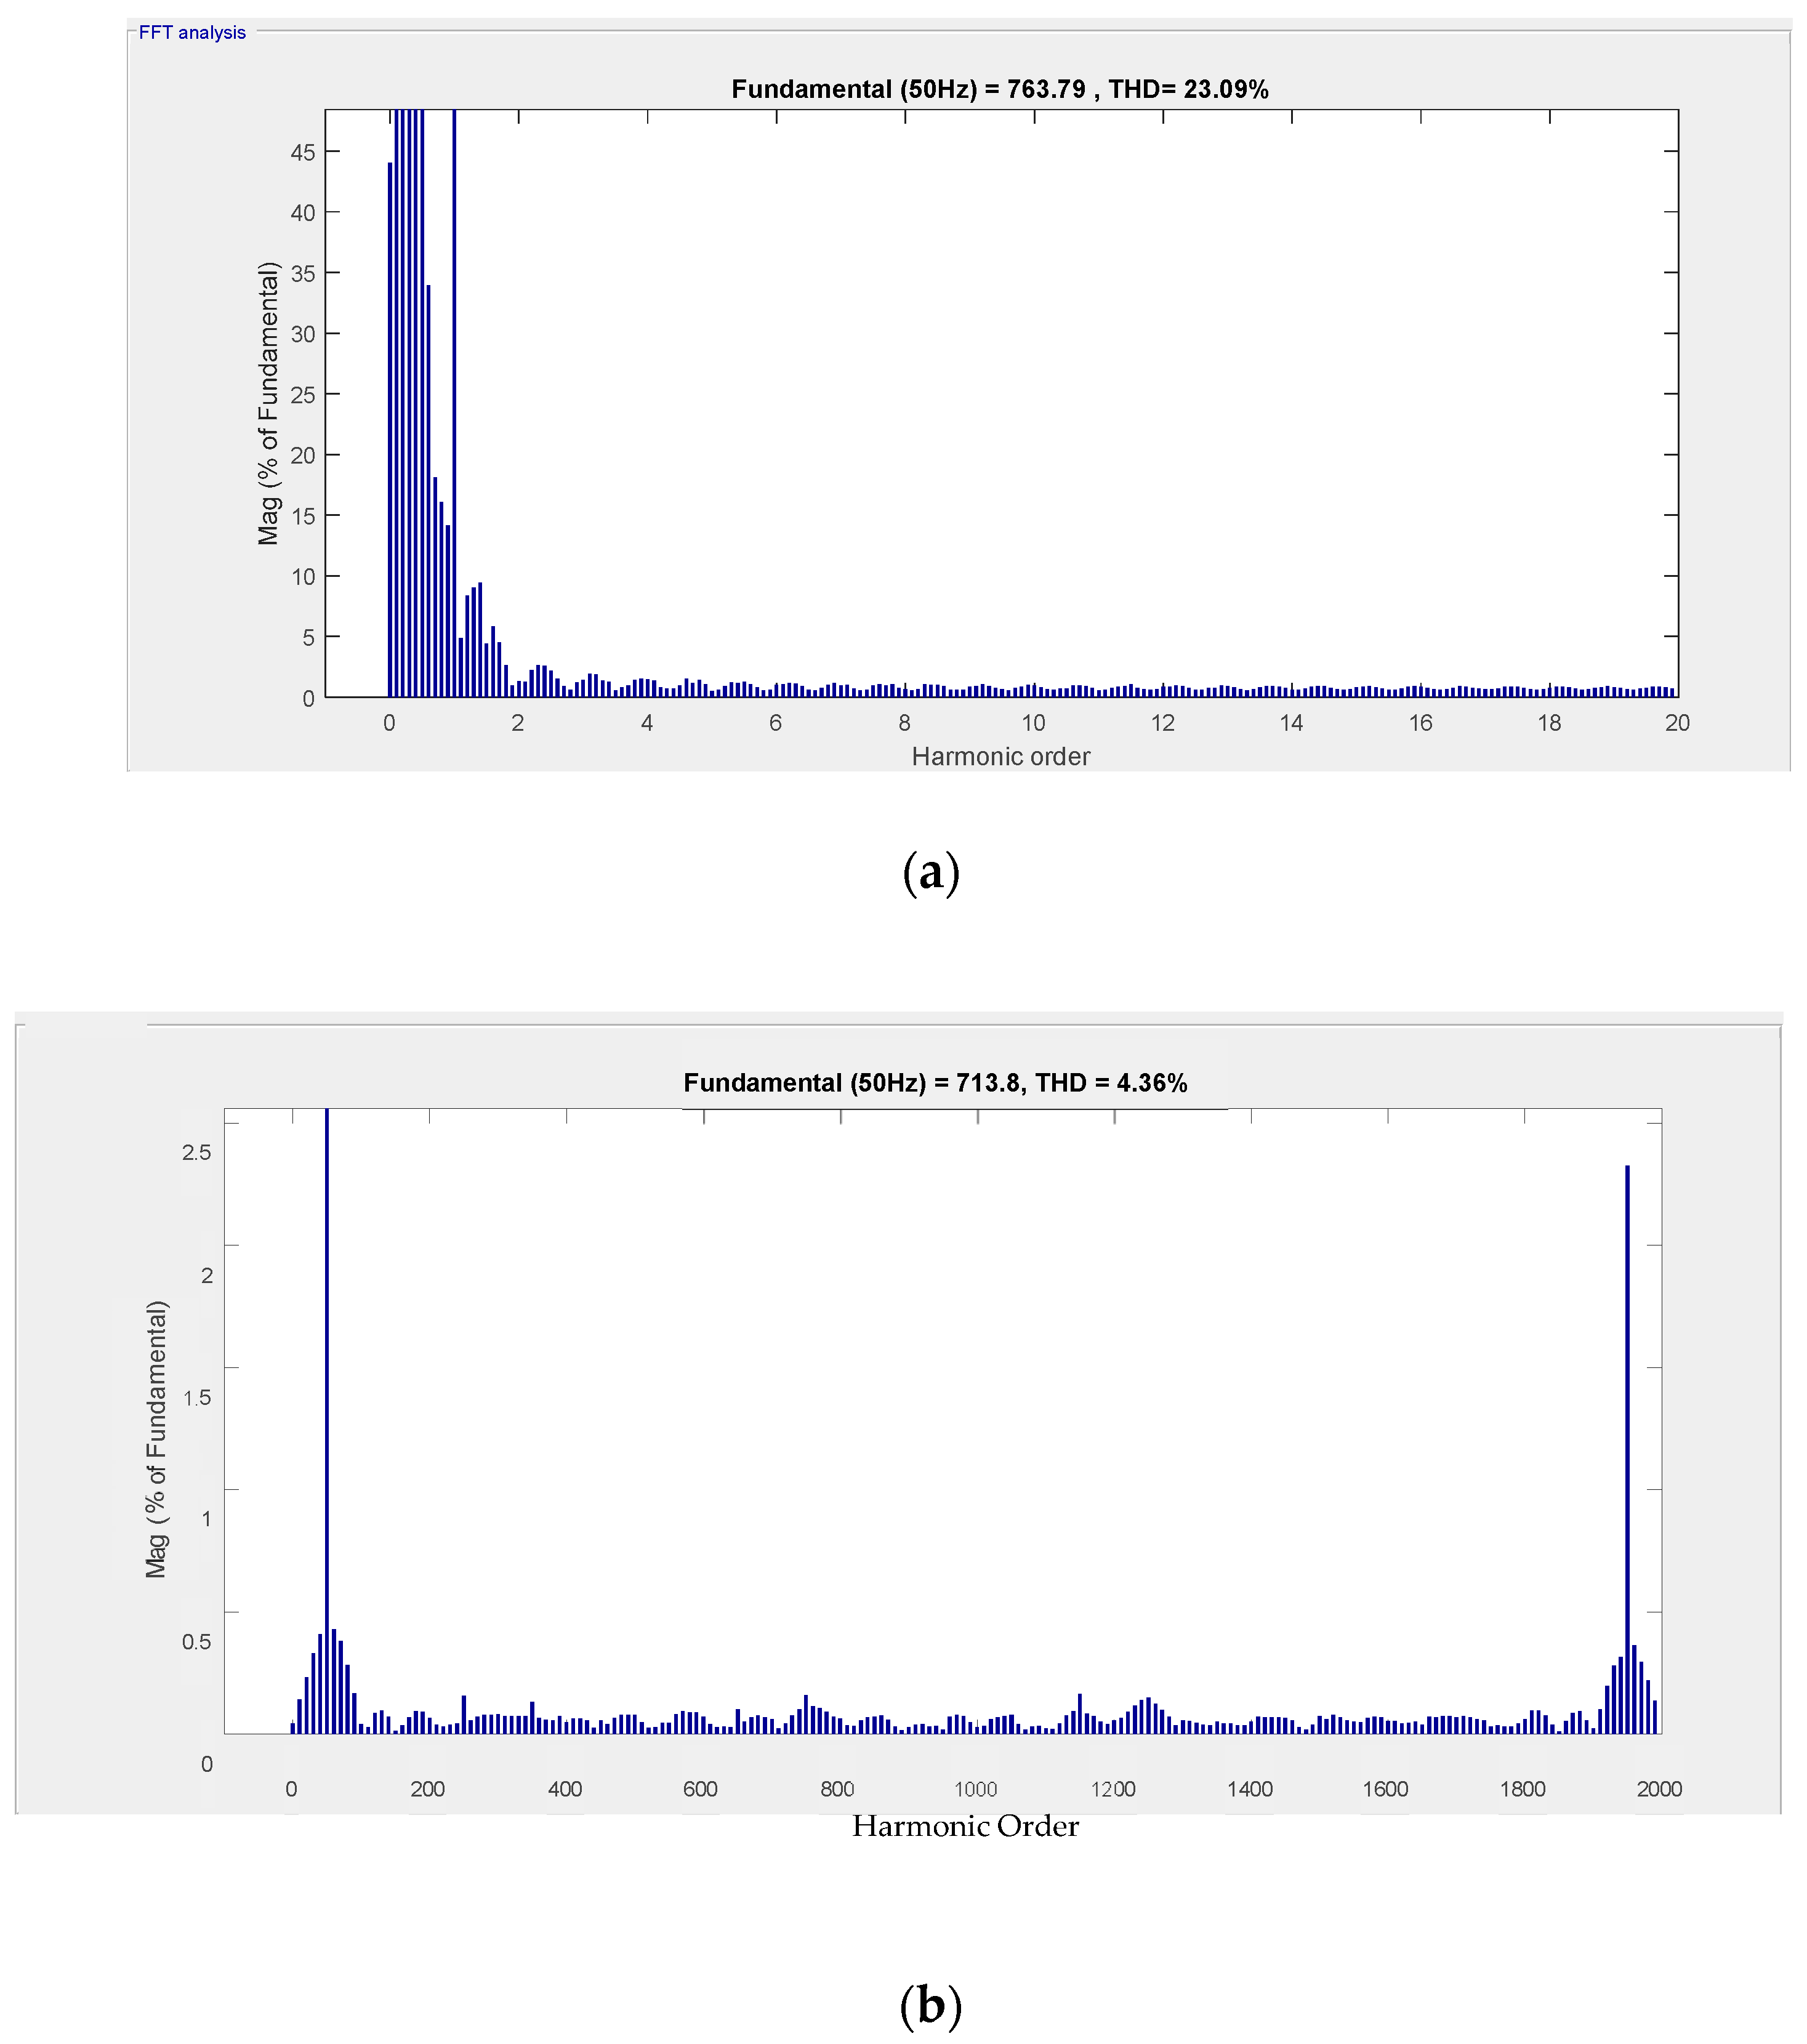
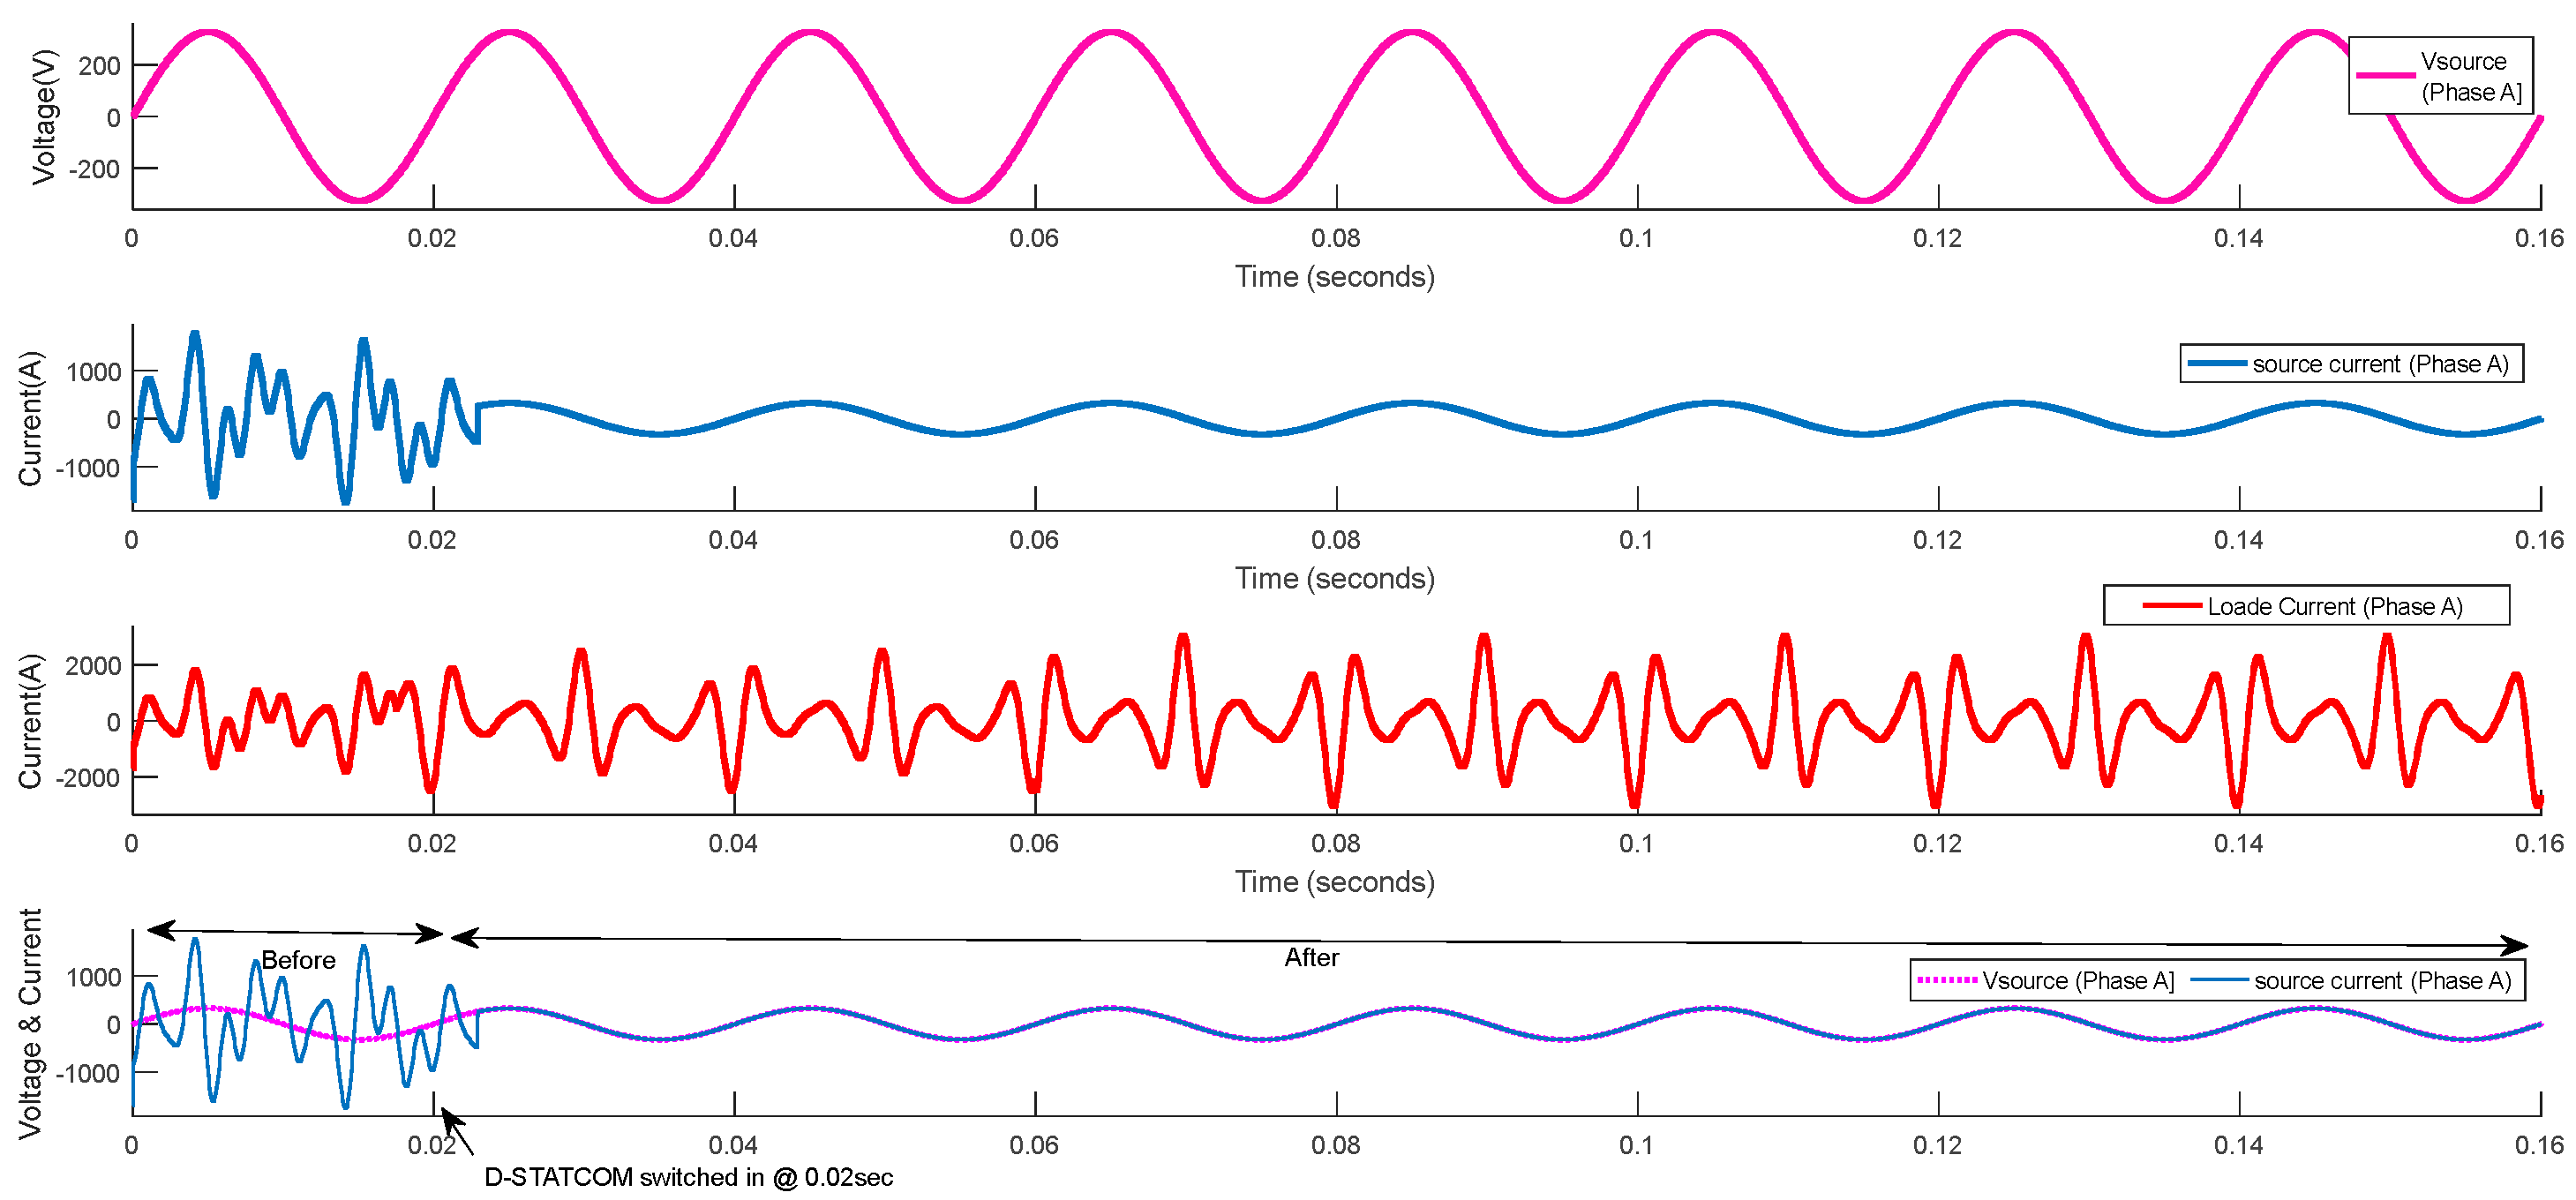
4.3. Mitigation of Harmonic Current Distortion Caused by Induction Motor Using D-STATCOM

The harmonic current distortion brought on by starting a high-power industrial induction motor is simulated by the induction motor beginning model. Once the motor starting contactor is closed at 0.02 s, a 75 kW (100 hp) induction motor starts, producing a three-phase harmonic current instantaneous waveform. The induction motor’s starting speed is set to 1 rad/sec. Through the transformer and upstream to the 33 kV feeder bus, the harmonic current at the 0.4 kV bus travels. Figure 16 presents the harmonic current distortion waveform results.
Figure 16. Harmonic current distortion waveform.
Figure 17 presents the results of voltage and current waveforms with and without D-STATCOM, which is connected to the system at 0.02 s. Furthermore, Figure 18a displays the harmonic spectrum result of the source current in the absence of D-STATCOM. Figure 18b presents the harmonic spectrum result of the source current with D-STATCOM.
Figure 17. Voltage and current waveforms with and without D-STATCOM.
Figure 18. (a) Harmonic spectrum of the source current without D-STATCOM, (b) Harmonic spectrum of the source current with D-STATCOM.
The simulation findings demonstrate that within 0.02 s (one cycle) of the D-STATCOM being turned on for the system makes the current waveform sinusoidal and in phase with voltage. Furthermore, THDI level falls below 4.36%, as shown from the harmonic spectrum, once the D-STATCOM is in use, below the limitations advised by IEEE standards [27].

5. Conclusions

The authors in this study used the ST, SVM algorithm, and D-STATCOM positioning, respectively, to identify, categorize, and mitigate PQ irregularities. In the MATLAB/Simulink environment, a real distribution network of the Awada industrial zone in Ethiopia is used for this. The PQ disturbances are detected with around 98% accuracy by the utilized ST. Additionally; the SVM method has a 98% confidence level for classifying PQ disturbances. In this study, D-STATCOM is used to mitigate PQ difficulties. The simulation findings demonstrate that within 0.02 s (one cycle) of the corresponding D-STATCOM being enabled, the system makes the current waveform sinusoidal and in phase with the voltage. Furthermore, the THDI level falls below 4.36%, as shown from the harmonic spectrum, once the D-STATCOM is in use, below the limitations advised by IEEE standards.
The unviability of the hardware model, which can be used to perform future enactment of this work, is a limitation of this work.
Moreover, as a future enhancement of this work, more advanced hybrid signal processing techniques can be utilized to detect PQ disturbances. Furthermore, recent artificial techniques can be utilized for the classification of PQ disturbances. Moreover, mitigation of PQ emissions can be performed by optimally coordinated flexible AC transmission system controllers.

Author Contributions

Conceptualization, E.M., B.K., Y.Q., A.S.A., M.Z., A.B.A., M.G.B.A., S.G.A. and C.M.P.-O.; methodology, E.M. and B.K.; software, E.M. and B.K.; validation, E.M., Y.Q. and B.K.; formal analysis, E.M., B.K., Y.Q., A.S.A., M.Z., A.B.A., M.G.B.A., S.G.A. and C.M.P.-O.; investigation, E.M., B.K., Y.Q., A.S.A., M.Z., A.B.A., M.G.B.A., S.G.A. and C.M.P.-O.; resources, E.M., B.K., Y.Q., A.S.A., M.Z., A.B.A., M.G.B.A., S.G.A. and C.M.P.-O.; data curation, E.M., B.K., Y.Q., A.S.A., M.Z., A.B.A., M.G.B.A., S.G.A. and C.M.P.-O.; writing—original draft preparation, E.M. and B.K.; writing—review and editing, E.M., B.K., Y.Q., A.S.A., M.Z., A.B.A., M.G.B.A., S.G.A. and C.M.P.-O.; visualization, E.M., B.K., Y.Q., A.S.A., M.Z., A.B.A., M.G.B.A., S.G.A. and C.M.P.-O.; supervision, E.M., B.K., Y.Q., A.S.A., M.Z., A.B.A., M.G.B.A., S.G.A. and C.M.P.-O.; project administration, E.M., B.K., Y.Q., A.S.A., M.Z., A.B.A., M.G.B.A., S.G.A. and C.M.P.-O. All authors have read and agreed to the published version of the manuscript.

Funding

This research is supported by the deputyship for research and innovation, ministry of education in Saudi Arabia under project number (IFP-2022-35).

Institutional Review Board Statement

Not applicable.

Data Availability Statement

Data will be available on request.

Acknowledgments

The authors extend their appreciation to the deputyship for research and innovation, ministry education in Saudi Arabia for funding this research work through the project number (IFP-2022-35).

Conflicts of Interest

The authors declare no conflict of interest.

References

  1. Singh, U.; Singh, S.N. A new optimal feature selection scheme for classification of power quality disturbances based on ant colony framework. Appl. Soft Comput. 2019, 74, 216–225. [Google Scholar] [CrossRef]
  2. Lin, W.M.; Wu, C.H.; Lin, C.H.; Cheng, F.S. Detection and classification of multiple power-quality disturbances with wavelet multiclass SVM. IEEE Trans. Power Del. 2008, 23, 2575–2582. [Google Scholar] [CrossRef]
  3. Hooshmand, R.; Enshaee, A. Detection and classification of single and combined power quality disturbances using fuzzy systems oriented by particle swarm optimization algorithm. Electr. Power Syst. Res. 2010, 80, 1552–1561. [Google Scholar] [CrossRef]
  4. Mahela, O.P.; Khan, B.; Alhelou, H.H.; Tanwar, S. Assessment of power quality in the utility grid integrated with wind energy generation. IET Power Electron. 2020, 13, 2917–2925. [Google Scholar] [CrossRef]
  5. Zhong, T.; Zhang, S.; Cai, G.; Huang, N. Power-quality disturbance recognition based on time-frequency analysis and decision tree. IET Gener. Transm. Distrib. 2018, 12, 4153–4162. [Google Scholar] [CrossRef]
  6. Zhong, T.; Zhang, S.; Cai, G.; Li, Y.; Yang, B.; Chen, Y. Power quality disturbance recognition based on multiresolution s-transform and decision tree. IEEE Access 2019, 7, 88380–88392. [Google Scholar] [CrossRef]
  7. Lin, L.; Wang, D.; Zhao, S.; Chen, L.; Huang, N. Power quality disturbance feature selection and pattern recognition based on image enhancement techniques. IEEE Access 2019, 7, 67889–67904. [Google Scholar] [CrossRef]
  8. Mahela, O.; Khan, B.; Alhelou, H.H.; Siano, P. Power quality assessment and event detection in distribution network with wind energy penetration using stockwell transform and fuzzy clustering. IEEE Trans. Ind. Inform. 2020, 16, 6922–6932. [Google Scholar] [CrossRef]
  9. Khalili-Damghani, K.; Abdi, F.; Abolmakarem, S. Hybrid soft computing approach based on clustering, rule mining, and decision tree analysis for customer segmentation problem: Real case of customer-centric industries. Appl. Soft Comput. 2018, 73, 816–828. [Google Scholar] [CrossRef]
  10. De, S.; Debnath, S. Real-time cross-correlation-based technique for detection and classification of power quality disturbances. IET Gener. Transm. Distrib. 2017, 12, 688–695. [Google Scholar] [CrossRef]
  11. Ema, A.M.; Stevan, R.; Martin, C.; Ziad, A.M.; Hany, H.M.; Rania, T.A.; Shady, A.A.H.E. BONMIN solver-based coordination of distributed FACTS compensators and distributed generation units in modern distribution networks. Ain Shams Eng. J. 2022, 13, 101664. [Google Scholar]
  12. Mohsen, T.; Hasan, K.; Haidar, S.; Ziad, A.M. Islanding Detection Scheme Using Potential Energy Function Based Criterion. Electr. Power Syst. Res. 2022, 209, 108047. [Google Scholar]
  13. Fayza, M.S.; Ahmed, D.Z.A.; Ziad, A.M.; Abou-Hashema, E.M.; Thamer, A.; Mahrous, A.; Husam, R.A. Optimal sizing of smart hybrid renewable energy system using different optimization algorithms. Energy Rep. 2022, 8, 4935–4956. [Google Scholar]
  14. Martin, C.; Shady, A.A.E.H.; Hany, H.M.; Zuhair, A.M.; Ziad, A.M. An innovative approach for mathematical modeling and parameter estimation of PEM fuel cells based on iterative Lambert W function. Energy 2023, 264, 126165. [Google Scholar]
  15. Mahendiran, V.; Muhyaddin, R.; Sultan, A.; Abdullah, A.A.; Ziad, A.M.; Rania, T.A.; Mohamed, R.M.; Shady, A.A.E.H. Maximum hosting capacity estimation for renewables in power grids considering energy storage and transmission lines expansion using hybrid sine cosine artificial rabbits algorithm. Ain Shams Eng. J. 2023, 14, 102092. [Google Scholar]
  16. Mustafa, I.; Mehmet, A.S. A modified energy management scheme to support phase balancing in grid interfaced photovoltaic/fuel cell system. Ain Shams Eng. J. 2021, 12, 2809–2822. [Google Scholar]
  17. Mustafa, I. Active/reactive energy control scheme for grid-connected fuel cell system with local inductive loads. Energy 2020, 197, 117191. [Google Scholar]
  18. Mehmet, B.; Mustafa, I.; Adnan, T.; Mehmet, T. Improved instantaneous power theory based current harmonic extraction for unbalanced electrical grid conditions. Electr. Power Syst. Res. 2019, 177, 106014. [Google Scholar]
  19. Mustafa, I. Interline fuel cell (I-FC) system with dual-functional control capability. Int. J. Hydrogen Energy 2020, 45, 891–903. [Google Scholar]
  20. İnci, M.; Bayindir, K.Ç.; Tümay, M. The performance improvement of dynamic voltage restorer based on bidirectional dc–dc converter. Electr. Eng. 2017, 99, 285–300. [Google Scholar] [CrossRef]
  21. Li, Y.; Zhang, H.; Liang, X.; Huang, B. Event-Triggered-Based Distributed Cooperative Energy Management for Multienergy Systems. IEEE Trans. Ind. Inform. 2019, 15, 2008–2022. [Google Scholar] [CrossRef]
  22. Yu, Y.; Ju, P.; Peng, Y.; Lou, B.; Huang, H. Analysis of dynamic voltage fluctuation mechanism in interconnected power grid with stochastic power disturbances. J. Mod. Power Syst. Clean Energy 2020, 8, 38–45. [Google Scholar] [CrossRef]
  23. Pan, J.; Yang, Y.; Cai, H.; Xu, L. Capacitor Voltage Fluctuation Minimization for Four-Level Hybrid Clamped Converter Using Improved Common-Mode Voltage Injection. IEEE Trans. Power Electron. 2020, 35, 7563–7573. [Google Scholar] [CrossRef]
  24. Ethiopian Electric Utility. Available online: https://www.ethiopianelectricutility.gov.et/ (accessed on 25 November 2022).
  25. Stockwell, R.G.; Mansinha, L.; Lowe, R.P. Localization of the complex spectrum: The S transform. IEEE Trans. Signal Process. 1996, 44, 998–1001. [Google Scholar] [CrossRef]
  26. Sahu, G.; Mahapatra, K.; Sahu, S.K. Design and Performance Analysis of DSTATCOM for Non-linear Load Composite Compensation. Jordan J. Electr. Eng. 2014, 2, 337–344. [Google Scholar]
  27. IEEE Std 519-2014 (Revision of IEEE Std 519-1992); Recommended Practice and Requirements for Harmonic Control in Electric Power Systems. IEEE: Piscataway, NJ, USA, 2014.
Disclaimer/Publisher’s Note: The statements, opinions and data contained in all publications are solely those of the individual author(s) and contributor(s) and not of MDPI and/or the editor(s). MDPI and/or the editor(s) disclaim responsibility for any injury to people or property resulting from any ideas, methods, instructions or products referred to in the content.

Article Metrics

Citations

Article Access Statistics

Multiple requests from the same IP address are counted as one view.