Article

The Impact of Green Capital Structure on Enterprise Development and the Regulation of Technological Innovation under Carbon Peaking

School of Business Administration, Liaoning Technical University, Huludao 125105, China
*
Authors to whom correspondence should be addressed.
Sustainability 2023, 15(7), 5743; https://doi.org/10.3390/su15075743
Submission received: 26 February 2023 / Revised: 19 March 2023 / Accepted: 21 March 2023 / Published: 24 March 2023

Abstract

:
The introduction of the “double carbon” target has placed higher and newer demands on China’s economic development, which must rely on investment in green capital. In today’s knowledge-based economy, one of the most important factors influencing the growth of enterprises is technological innovation. Based on the data of A-share listed companies in China from 2016 to 2020, this paper empirically tests whether the green capital structure of enterprises can promote the development of enterprises through regression analysis. The study shows that green capital structure has a significant promotion effect on enterprise development; technological innovation will weaken the promotion effect of green capital structure on enterprise development to a certain extent. The paper further shows that the higher the cash flow from operating activities, the higher the concentration of equity and the non-state-owned enterprises, the more conducive the green capital structure is to enterprise development. Finally, the article’s findings are supported by robustness tests. It is conducive to promoting the development of a green economy and facilitating the transformation and upgrading of China’s economy while protecting the environment.

1. Introduction

From “green water and green mountains are golden mountains” to the climate targets of “peak carbon by 2030 and carbon neutral by 2060”, green development has become the mainstream development direction of China’s future [1], and China’s economy is gradually transforming and upgrading. As the foundation of the national economy, enterprises have strong financial strength, abundant data resources, and advanced technology, which are the keys to environmental management and technological innovation. The concept of green financial development is coordinated and sustainable, and contributes to the goal of building a beautiful China [2]. The state has quickly issued relevant policies [3], green bond issuance guidelines, environmental protection laws and guidelines for building a green financial system [4], which can better promote the development of China’s green capital market, effectively meet the financing needs of Chinese enterprises and reduce their financing costs [5]. With the development of China’s green economy and green finance, most enterprises have started to transform and upgrade their industrial and energy structures and move closer to the direction of green environmental protection. In the current economic environment, green financing has great advantages in the capital market.
Factors such as the way a company is financed, the proportion of each financing method and the degree of stakeholder control in the company are closely related to its capital structure and are important for its future progress. Research in China in areas related to capital structure and corporate development has started late, but is developing rapidly. By examining the domestic and international literature, the main findings can be summarized as a linear positive and negative effect, which is gradually refined into an “inverted U-shaped” relationship and a threshold effect. Lv Hao-Xin (2020) concluded from an empirical analysis that for pharmaceutical and medical companies, capital structure has a significant positive relationship with firm performance [6]. Qie Haituo et al. (2020) concluded that there is a significant double threshold effect between capital structure and firm performance [7]. Yao, Beibei (2018) used the 2016–2020 study sample of China’s GEM listed companies and concluded that equity concentration and equity checks and balances are positively correlated with firm performance [8]. Studies on the correlation between capital structure and corporate development mainly use statistical analysis and regression analysis for testing. Therefore, the article takes the capital structure of A-share listed companies as the research object, studies the direction of financing related to green environmental protection, studies the relationship between green capital structure and enterprise development, and introduces technological innovation as a moderating variable. The article also introduces technological innovation as a moderating variable to study its impact on the relationship between green capital structure and enterprise development. This study will help Chinese enterprises to transform and upgrade themselves, provide a theoretical basis for their green development, and contribute to the development of the green capital market.
In summary, in order to promote the development of China’s green economy and achieve the dual carbon target, the following questions need to be urgently addressed: (1) Whether green capital structure has a facilitating effect on enterprise development. (2) How does technological innovation play a moderating role in green capital structure and enterprise development? (3) What are the effects of different property rights, different net cash flows from operating activities, and different equity concentration on green capital structure on firm development? In order to address the above questions, this paper constructs a model to test them. The main innovations are: first, a more detailed division of capital structure is made to study financing related to environmental protection direction, called green capital structure, thus extending the research in this area of capital structure; second, technological innovation is used as a moderating variable to explore the impact it would have in the relationship between green capital structure and corporate development. Third, the type of ownership, net cash flow from operating activities and equity concentration are considered in depth and comprehensively to examine how the impact of green capital structure on corporate development differs under these factors.

2. Theory and Hypotheses

2.1. The Relationship between Green Capital Structure and Corporate Development

In the study of financial analysis and financial management, capital structure is one of the important indicators. Different financing results caused by enterprises’ capital composition, financing method, and financing ratio can be well reflected by capital structure. At the same time, capital structure has more impact on enterprises, such as: enterprise value, enterprise development, and business decision. The generalized capital structure includes debt structure and equity structure. In the context of the current green economy and green finance, the country strongly supports the environmental protection industry. Financing is mainly divided into internal financing and external financing. When internal financing is insufficient, enterprises need external financing. On the one hand, enterprises can directly raise funds through green credit of the financial market, and the carbon trading market in our country has developed rapidly and matured gradually. Carbon exchange financing projects and carbon exchange asset management have received the support of financial institutions, which have applied for green financial products, reduced financing costs and increased financing quotas. Enterprises can use government subsidies to solve financing problems. Both direct and indirect government subsidies to enterprises can play a role in promoting technological innovation; government subsidies can support funds or non-monetary assets.
Under the guidance of the National Carbon Peak and Carbon Neutrality, financial institutions such as banks have imposed funding restrictions on the traditional coal-fired high energy consumption industry. It is difficult for these companies to obtain long-term loans to avoid the potential environmental risks. In the face of increasingly stringent environmental regulatory policies, heavily polluting enterprises often actively adjust their behavioral decisions to better cope with the potential threats posed by environmental regulations. Many enterprises will adjust their industrial structure according to their own conditions. Responding to the national call and developing the green economy. China Green Finance promotes the industrial structure of Chinese enterprises, and the energy structure is adjusted and upgraded.
China’s environmental protection business started slowly, but developed rapidly. In a short period of time, enterprises will invest many costs. For energy equipment, technical development, professional introduction, and training, they will put a heavy burden on enterprises, which will affect the profitability of enterprises in a short period of time [9]. Therefore, our country provides certain tax incentives for the development of environmental protection, and then helps enterprises to solve the dilemma of cash flow shortage and stabilizing the stock price of enterprises. The more stable the equity structure, the more stable the capital structure, the better the development capability of the enterprise, and the more favorable the external financing [10]. At present, the concept of green development is deeply rooted in people’s hearts. Consumers and investors are very supportive of green development enterprises [11]. Consumers are losing confidence in polluting and energy-intensive enterprises, so it is relatively easier to obtain financing in the direction of environmental protection.
In the context of green finance and the green economy, this paper focuses on raising funds for environmental protection. The green capital structure is represented by the net amount raised divided by the capital stock.
Based on the above analysis, this hypothesis is proposed as follows:
Hypothesis 1 (H1). 
The higher the green capital structure of the company, the better the development of the company.

2.2. The Moderating Effect of Technological Innovation on the Relationship between Green Capital Structure and Corporate Development

Investment in R&D is a key factor in the rapid development of the knowledge-based economy and its gradual emergence as a global trend. As technological innovation is a long-term and continuous process, corporate R&D activities are inherently risky, temporally rewarding, and information asymmetric [12]. Therefore, when investigating the relationship between green capital structure and firm performance, the impact of technological innovation needs to be considered. Investment in technological innovation has a constraining effect on the overall level of debt and the ability of firms to raise finance. When companies raise finance, they are generally required to use tangible assets as collateral, and intangible assets such as developed patented technologies cannot be used as collateral, which affects the financing of companies. Technological innovation is characterized by uncertain returns and long lead times, which can increase managerial decision pressure and the likelihood of financial crises (Browyn H.Hall, 2002) [13]. Innovation inputs play a negative moderating role in the impact of corporate debt financing on firm performance (Weimeng, 2017) [14]. As technological innovation is riskier and more uncertain, it requires firms to properly disclose information about some of their projects in order to gain investors’ trust when raising external finance. This may increase the cost of corporate financing and may also affect firm’s financing decisions and financing philosophy, which in turn may change the capital structure of the firm.
Enterprises need to continuously invest a large amount of capital to carry out R&D activities. The efficiency of transformation research results cannot be guaranteed, the cycle of technological innovation is relatively long, and the related resources are in great demand. At the same time, the company’s debt needs to be repaid on schedule, which may lead to the problem that technological R&D urgently needs funds, but has to repay the outstanding amount, further affecting the company’s development (Li Huidong, 2013) [15]. The capital structure of an enterprise affects the relationship between technological R&D investment and enterprise development. If the capital structure is unreasonable, financial problems such as financing difficulties may occur, which are not conducive to more efficient R&D activities and corporate development. Studies in the relevant literature have found that innovation leads to small gains for firms and even has a negative impact on firm performance. The fact that firms invest large amounts of money in technological research and development affects the supply of products in their day-to-day target markets, which in turn affects their position in the market, exposes them to a greater risk of failure, makes it difficult to see results in the short term [16], diverts funds from R&D that should be used for other production, and at the same time encourages firms to continue to raise more funds, which may lead to changes in their capital structure [17].
Therefore, technological innovation will increase the financial risk of enterprises, the uncertainty of enterprise growth, and will have a certain negative impact on the relationship between green capital structure and enterprise development; its main impact mechanism is: First of all, technology research and development requires a large amount of continuous capital, and the risk of research and development is large, cannot be used in the bank mortgage, has a certain impact on the ability of enterprise financing, furthermore, it will affect the concept of enterprise financing, enterprises’ ability to carry out the green direction of the financing concept may be affected, affecting the green capital structure of enterprises, and ultimately will affect the progress of enterprise development.
In summary, it can be expected that technological innovation will have a negative moderating effect on the relationship between green capital structure and firm development due to the high level of uncertainty associated with technological innovation. Based on the above analysis, this hypothesis is proposed as follows:
Hypothesis 2 (H2). 
Investment in technological innovation negatively moderates the relationship between green capital structure and firm development.

3. Research Design

3.1. Sample Selection and Data Source

In this article, Chinese A-share listed companies in 2016–2020 were selected for the research sample analysis. Based on the research results of professional scholars in relevant fields at home and abroad, in order to make the sample data objective, the selected sample has undergone the following screening process: (1) *ST and ST listed companies are excluded; (2) financial insurance listed companies are excluded; (3) companies that exclude listed in 2016–2020; (4) manually screen out companies whose fundraising direction is related to the direction of green environmental protection; (5) in addition, companies with shortlisting years that cannot extract the data needed for the research are excluded; and (6) in order to eliminate the effects of extreme values, the data are treated with a level of 1%. In the end, 200 companies were obtained, resulting in 760 valid research data. The research sample data are obtained from the Cathayan Database (CSMAR), and the data processing is done using STATA15.0 and Excel spreadsheets.

3.2. Research Variables

First, the explanatory variable—enterprise development (ED): To date, there is no single standard for its measurement and this paper uses the basic earnings per share indicator. It is determined on the basis of the intrinsic link between the relevant items in a company’s balance sheet, rather than a simple quantitative indicator. Basic earnings per share are the earnings per share that a company should calculate by dividing the net profit for the period attributable to ordinary shareholders by the weighted average number of additional ordinary shares in issue [18]. Basic earnings per share (ED) is an important indicator of a company’s overall profitability and can also be used to assess and evaluate a company’s ability to grow in the future.
Second, the explanatory variable—corporate green capital structure (GCS): Through existing relevant studies, this paper selects enterprises that have conducted environmental protection project fundraising from 2016 to 2020 based on the direction of research on green finance and green economy by obtaining the fundraising capital investment table from CSMAR. The green capital structure indicator is chosen to be expressed as the ratio of net proceeds raised to shareholders’ equity (GCS). The green capital structure is conducive to reflecting the financial stability of enterprises and the direction of fundraising, and to study the relationship between capital structure related to green development and enterprise development.
Third, the moderating variable—technological innovation (TA): Through research and analysis [18], the two main categories of technological innovation input and output indicators are the main sources of technological innovation activity measures, which are measured according to two main aspects: the degree of R&D input of technological innovation and the level of R&D output results [19]. Most scholars have used R&D expenditure and the ratio of R&D expenditure to total assets as indicators to measure this, but this ignores the profitability aspect of the enterprise, so this paper uses the ratio of R&D investment to operating income as a measure of technological innovation.

Control Variables

Profitability (OPM): The profitability of a company can effectively reflect the quality of its production and operation, and identify the problem areas of the company in a timely manner [20]. The operating margin indicator is an effective measure of the profitability of an enterprise’s operating income. As a net profit, operating profit is a better indicator of the net profitability of an enterprise’s operating income than gross profit margin.
Company size (SIZE): Natural logarithm of total assets at the end of the year. Larger companies tend to be well capitalized, have a good credit rating and a low risk of default. The size of a company’s total assets will affect the scale of R&D investment. Large enterprises with green ideas will be more conducive to consumer recognition and improve their competitiveness, and the economies of scale effect of enterprises will help reduce enterprise costs. Therefore, the article uses firm size as a control variable based on existing research [21].
Fixed assets ratio (FAR): Fixed assets have a significant impact on a company’s profits and are also the basis on which other types of assets in a company function. The ratio of fixed assets to total assets can be used to determine how well a company is using its capital. At the same time, the value of fixed assets measures the repayment capacity of a company, which in turn affects how well the company can raise capital and influences the capital structure [22]. The fixed asset ratio (the ratio of the value of fixed assets to the total value of assets) is therefore used as a control variable.
Operating profit growth rate (GROP): The operating profit growth rate is an important indicator for evaluating the operation of a company, reflecting the growth rate of the company’s profit level and allowing you to judge the future development potential of the company [23]. The higher the growth rate of operating profit, the higher the quality of the company’s surplus and the better it is at attracting investment capital. Profitability is the core indicator of a company’s earning power.
Accounts receivable turnover ratio (ART): The accounts receivable turnover ratio is a good indicator of a company’s ability to operate its assets, i.e., its ability to use each asset to generate profit [24]. Through the analysis of the accounts receivable turnover ratio, we can generally evaluate the level of business management and the efficiency of the use of funds, and provide direction for the future economic development of the enterprise. The article expresses the accounts receivable turnover ratio as operating income/average utilization of accounts receivable. See Table 1 for detailed definitions of the variables.

3.3. Research Model Design

In order to study the relationship between green capital structure, technological innovation, and firm development, and to explore the role of technological innovation in this process, a model of green capital structure affecting firm development was constructed in existing relevant studies by then incorporating technological innovation into the model, where i represents the firm, t represents the year, and εi,t denotes the random disturbance term.
To test hypothesis H1 and examine the impact of green capital structure on firm performance, a multiple linear regression model (1) was constructed.
ROEi,t = α0 + α1GCSi,t + α2SIZEi,t + α3OPMi,t + α4FARi,t + α5GROPi,t + α6GEPSi,t + α7CASHi,t + ∑YEAR + εi,t
To test hypothesis H2, the moderating role of technological innovation between green capital structure and firm development was tested by introducing a cross-product term based on the baseline regression model (1), as in model (2).
ROEi,t = α0 + α1GCSi,t + α2TAi,t + α3GCSi,t × TAi,t + α4SIZEi,t + α5OPMi,t + α6FARi,t + α7GROPi,t + α8GEPSi,t + α9CASHi,t + ∑YEAR + εi,t
We have constructed a schematic diagram of the theoretical framework of the study around the theoretical assumptions section, as shown in Figure 1.

4. Empirical Inspection and Analysis

4.1. Analysis of Descriptive Statistical Results

Among the core variables, the green capital structure (GCS) variable has a large difference between the maximum value of 10.91 and the minimum value of 0.197, and a median value of 1.592, reflecting to some extent that the quality of financing for some enterprises in greening needs to be further improved. The mean value of enterprise development (ED) of 0.552 is less different from the median of 0.43, indicating that there is not much difference between enterprises. The minimum value of 0.04 and the maximum value of 28.03 for technological innovation (TA) indicate that some enterprises need to pay more attention to technological innovation. The specific statistical results are presented in Table 2.

Correlation Analysis

Green capital structure plays a role in promoting enterprise development at the level of 1%. The correlation coefficient of enterprise technological innovation to enterprise development is negative, which is significant at the level of 5%. The appropriate reduction of R&D investment will promote enterprise development. From the table, it can be seen that the accounts receivable turnover rate, operating profit growth rate, and operating profit margin have promoted the development of enterprise development at the level of 1%. The regression coefficients were 0.113, 0.309, and 0.513, respectively. The ratio of fixed assets has promoted the development of enterprises at a level of 5%. Looking at the correlation coefficients between the variables, we can see that the maximum value is 0.51 and the correlation coefficients between the variables are less than 0.8, indicating that there is no problem of multicollinearity between the variables. The specific result is shown in Table 3.

4.2. Analysis of the Results of the Main Regression Inspection

4.2.1. Green Capital Structure and Enterprise Development

From the results of the regression, the level of 1% of the green capital structure promotes the development of the enterprise. The regression coefficient of 0.112 indicates that the green capital structure has significantly promoted the development of the enterprise. The greater the proportion of the net fund raised in the direction of green environmental protection in the share capital of the enterprise, the more obvious the role of promoting the development of the enterprise, hypothesis 1 is validated. Since the net fund raised is large, logarithmic processing is carried out. The variable is called GCSE. The second column of the form shows that the net funds raised in the green direction have promoted the improvement of the green capital structure. The regression coefficient reached 1.550, and significantly reached a higher level, that is, the higher the net amount of funds raised, the higher the ratio of green capital structure. Through the study of previous literature, the green capital structure will also receive many other influences at the same time, such as the concentration of equity, the cash flow of business activities, the nature of property rights, and many other aspects. The specific results are presented in Table 4.

4.2.2. Green Capital Structure, Technological Innovation and Enterprise Development

This paper presents the interaction between green capital structure and technological innovation. See the first column of the regression results. The regression coefficient is negative and significant at 1% level. The results show that the improvement of the technological innovation capability of enterprises will weaken the promotion of green capital structure in the development of enterprises to a certain extent, confirming the original hypothesis 2. The third column of the form does not add technological innovation. According to the second column, after adding technological innovation, the adjustment degree is slightly improved, which further explains that technological innovation plays a certain adjustment role between green capital structure and enterprise development.
In order to explore the impact of green capital structure on the development of firms with strong or weak technological innovation capability, this paper returns according to the median of technological innovation capability, where less than the median is 0 and greater than the median is 1. The result is the fourth and fifth columns in the table above. The results of these two columns are significant at the 1% level. The green capital structure plays a role in promoting the development of the company. The green capital structure of enterprises with strong technological innovation has less promoting effect on enterprise development than enterprises with weak technological innovation ability. It also proves that hypothesis 2, that is, enhanced technological innovation capability will slightly weaken the promotion of green capital structure in enterprise development. Technological innovation capability is beneficial to the development of enterprises. Therefore, enterprises should conduct appropriate technological research and development according to their own enterprise development level and operation methods to improve technological innovation and promote the development of enterprises, rather than blindly conducting technological R&D, which will hinder the future progress of enterprises. The specific results are presented in Table 5.

4.3. Analysis of the Results of Stability Inspection

4.3.1. Replace Key Variable Test

The stability test of this paper is first carried out by replacing the key variables. This paper borrows the research of previous scholars and uses the growth rate of net assets per share (NAPS) as a substitute variable for corporate development, that is, net profit divided by total assets [25]. For the level of technological innovation, the number of patent applications or the number of approvals is mainly used in the research [18]. This paper consists of Zhang Jinsong’s paper and uses his variables (TA2) as a replacement variable. The specific reasons are as follows: Although patent approval is lagging behind, if the patent is in the application stage, it can prove that the company is in research and development at that time and has achieved corresponding results [26]. Because the number of patent applications is particularly important, it is necessary to have a certain process, which mainly has two processing methods. One is to eliminate the effects of economies of scale. The number of patents is divided into operating income. The other is to avoid the problem of non-normal distribution of spurious data. This paper takes the different types of patent applications of enterprises as the main data. To avoid the problem of non-normal distribution, the data are summed and then added to 1 to take the natural logarithm. The first column in the table below is used as a control column and the second column is the result after the replacement. It can be obtained by the regression coefficient of green capital structure of 0.0475 and significantly related to 1%. To play a significant role in promoting, technological innovation plays a regulatory role in the green capital structure and the development of the enterprise. The specific results are listed in Table 6.

4.3.2. Placebo Test

Although the article controls for factors such as firm size, profitability, growth capacity, fixed-asset ratio, etc., there are many uncertainties that may affect the model in order to make the results more convincing and increase the objectivity of the study. In this paper, a placebo test is conducted based on the research of many scholars. By randomly selecting the experimental group and repeating 200 times, three graphs were finally derived: coefficient graph, p-value graph, and t-value graph. The specific results are shown below.
Figure 2 is a coefficient plot showing the results of the placebo test for a random sample of the experimental group against the control group performed 200 times. The horizontal coordinates show the regression coefficients and the vertical coordinates show the kernel densities. The solid line shows the true value and the dashed line shows the value after randomization. It can be seen visually that there is a large difference between the two, with the randomized group clustering to the left of 0, which is negative, and the true coefficient being close to 0.01. This suggests that other unobservable factors had little effect on our results, which means that the results pass the placebo test. The specific results are shown in Figure 2.
Figure 3 shows a plot of the p-values for the placebo test, with the dashed line showing the value for the randomized treatment group, the solid line at around 0.01 showing the true value, and the dashed line concentrated to the left of 0 deviating from the solid line with a large gap between the two. The p-values for the treatment group are mostly greater than 0.1, which is not significant, while the true group is significantly correlated, so it can be concluded that the other factors did not influence the conclusions of the article, which passed the placebo test, and the conclusions have stability and credibility. This is shown in Figure 3.
Figure 4 shows a plot of the placebo test t-values, with the horizontal coordinates showing the t-values and the vertical coordinates showing the kernel density, with the dashed line showing the randomized group, which is concentrated to the left of 0, and the solid line showing the true t-value, which is around 3.2, with a large difference between the two. Both the randomized kernel density and the t-values deviate from the true value, and the above placebo test leads to the consistent conclusion that the effect of green capital structure on firm development is not due to the influence of other unobservable factors, and that, taken together, the estimates are not seriously biased by omitted variables. Finally, the results of the article pass the robustness test as shown in Figure 4.

5. Further Analysis

5.1. The Impact of the Cash Flow of the Business Activity on the Green Capital Structure and the Development of the Company

Cash is the precious blood of the company, and cash flow is the blood circulation of the company [27,28]. The abundance of the enterprise’s cash flow will affect the enterprise’s investment and financing activities. The more abundant cash flow can provide stable sources of funds for enterprise investment and financing, and can stabilize the company’s stock price, increase investor confidence, and better enterprises can better their methods of financing [29]. In this article, operating cash flow is expressed as net operating cash flow divided by total assets at the end of the period, and further explores whether the cash flow of operating activities will have on the effect of green capital structure and the development of the enterprise. The first column below shows that operating cash flow has promoted the development of the company, which is significant at 1% level, and the regression coefficient is 1.783. After adding this variable, the green capital structure still promotes the development of enterprise development, and it is extremely significant, the regression coefficient is 0.178. The second column of the form reflects the effect of operating cash flow on firm development. As a control column, the result is still significant. As a result, the higher the cash flow from operating activities, the better the development of the company, and the higher the cash flow of the company, the higher the development of the company. The green capital structure is more important for the development of the enterprise. See Table 7 for specific results.

5.2. The Impact of Capital Concentration on Corporate Development

Capital structure is broadly divided into debt structure and equity structure. The senior managers of the company are very important in the development of the company, so the equity structure is closely related to the development of the company [30,31]. This article uses the Z indicator to represent the equity concentration, and uses the ratio of the largest shareholder to the second largest shareholder. This paper uses Z to represent the green capital structure of return. As a result, as shown in the third column of Table 7, the concentration of equity is significantly related to the development of the company at a level of 10%. The regression coefficient is positive. It proves that the higher the degree of equity concentration, the better the development of the company. In the study of the promotion of green capital structure in the development of enterprises, a higher degree of equity concentration is more significant, and can further promote enterprise performance. The concentration of equity means that the more unified the opinions of senior managers on the future development strategy of the enterprise are, the more unified the opinions, and the more conducive to the enterprise’s green environmental protection and financing activities. See Table 7 for specific results.

5.3. The Impact of Green Capital Structures with Different Property Rights on Business Development

Compared with non-state enterprises, state-owned enterprises enjoy greater political support and can be protected by many governments [32,33]. Non-state-owned enterprises have richer sources of financing and a certain degree of risk. Non-state-owned enterprises have foreign-invested shares, and some foreign investment participation will lead to a different internal culture of the enterprise [34]. It will affect the company’s investment and financing decisions, leading to different capital structures and different equity concentrations. What role can the nature of different property rights play in the process of green capital structure affecting firm growth? We will conduct further research. The group regression method is divided into two groups, the first column is used as a control list, and the second column is for non-state-owned enterprises. The third column represents state-owned enterprises. From the following results, we can ascertain that among non-state-owned enterprises, the promotion of green capital structure on the development of enterprises is significant at the level of 1%, and the regression coefficient is 0.134. Among the sample enterprises, the green capital structure was more significant in non-state enterprises compared to state-owned enterprises in terms of its contribution to corporate development, as can be seen in Table 8.

6. Discussion

6.1. Conclusions

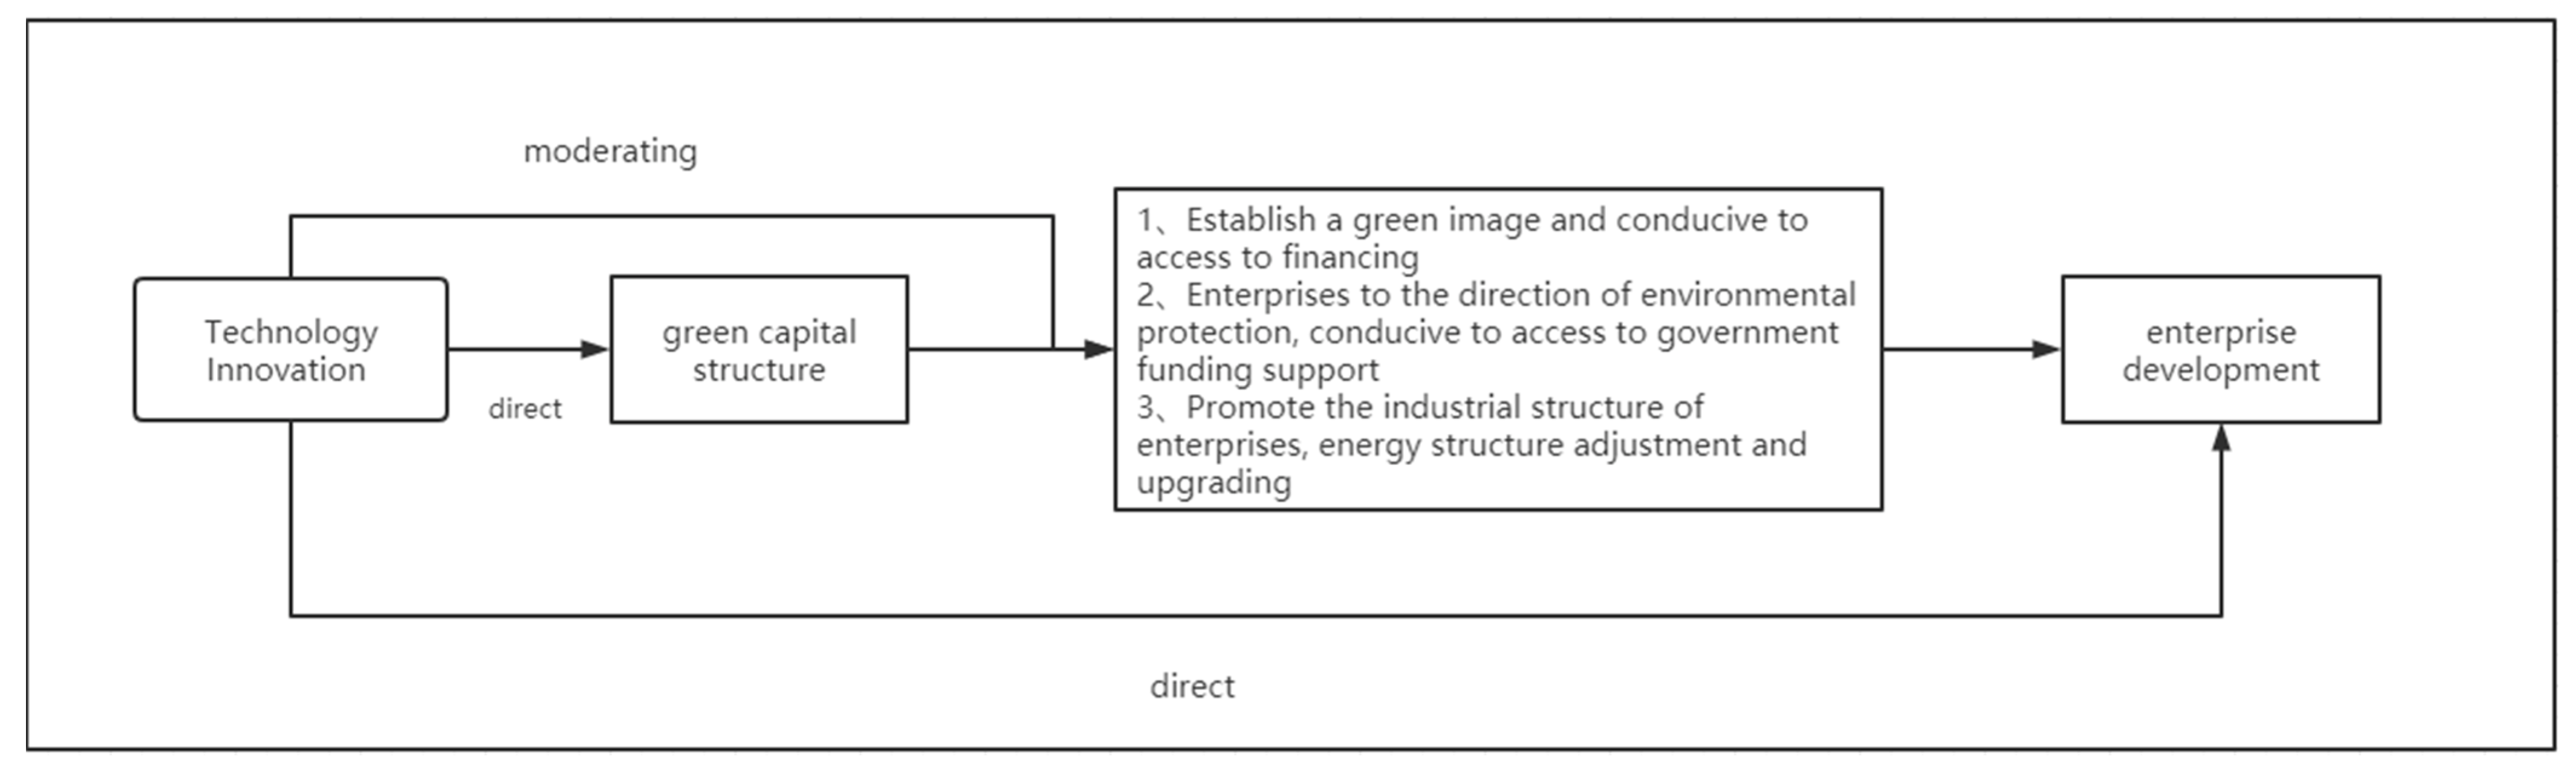
Based on the background of green economy and green finance, it has become imperative for enterprises to transform and upgrade. A reasonable capital structure plays a key role in the transformation, and a green capital structure is conducive to achieving the dual carbon target, developing enterprises in a green direction, and improving their competitiveness [35]. Technological innovation also plays a moderating role in the impact of green capital structure on corporate development. A more in-depth discussion of the impact of ownership nature, net cash flow from operating activities, and equity concentration on green capital structure on firm development would also make the study more in-depth and comprehensive. Therefore, this paper integrates green capital structure, technological innovation, and firm development into the same framework and constructs regression models to test the rationality of the hypotheses through a series of empirical analyses. The main results are as follows.
Firstly, green capital structure helps to promote enterprise development. By raising funds related to environmental protection, enterprises establish a corporate image of green and healthy development, which is in line with national policies and positively responds to the call of the state, and is conducive to attracting funds, gaining access to relevant capital support policies of the state, and making it easier to obtain loans. The green capital structure of the company helps to gain public trust and attract more investment, which further promotes the development of the company.
Second, technological innovation capacity has a moderating effect on green capital structure and enterprise development. An increase in funding for R&D investment may, to some extent, weaken the role of green capital structure in promoting enterprise development. Technological innovation is a long-term and continuous process with risks and lags, which requires a large amount of capital investment and needs to raise a large amount of funds, which may affect the financing concept of the green direction of enterprises, which will change the capital structure of enterprises and ultimately affect the progress of enterprise development. Therefore, the increase in funding for R&D investment will, to a certain extent, weaken the role of green capital structure in promoting the development of enterprises.
Third, the higher the cash flow from operating activities, the more important the role of green capital structure in promoting enterprise development. Operating cash flow is the first element of an enterprise’s production and operation activities, which can reflect the enterprise’s profitability and solvency, and further reflect the enterprise’s market value. The higher the cash flow from operating activities, the higher the value of the enterprise and the better its profitability, which is conducive to stabilizing the share price, increasing investors’ willingness to invest, and better for attracting investment, so the green capital structure plays a more important role in promoting enterprise development.
Fourth, the higher the concentration of equity, the greater the contribution of the green capital structure to the development of the company. The higher the equity concentration, the more unified the views on key issues, and the more the management has a green philosophy, the more it influences the attitudes of employees and the way they work, which in turn has a significant impact on the direction of corporate finance. This further affects business development.
Fifth, the green capital structure of non-state-owned enterprises plays a more important role in promoting enterprise development. Non-state enterprises have more sources for financing and are more flexible. The presence of foreign capital in non-state-owned enterprises will lead to a different culture within the enterprise, which will make timely adjustments in accordance with national development policies and directions and adhere to the concept of green development, thus further influencing the investment and financing decisions of the enterprise, which is more conducive to the development of green capital structure.

6.2. Research Importance

The article contributes to several directions of accounting research. First, it complements the research in the area of capital structure in firm development by investigating the mechanism of the role of green capital structure in influencing firm development [36]. In the existing literature, there is no detailed classification of capital structure. Based on the concept of green development, this article selects enterprises that raise capital in the direction of environmental protection research, thus enriching the research field of capital structure. Second, it constructs an empirical model of regulation and introduces technological innovation as a moderating variable to complement previous studies of capital structure in enterprise development. The article integrates green capital structure, technological innovation, and corporate development into the same framework and explores the relationship between the three in depth, while also taking into account factors such as ownership type, net cash flow from operating activities, and equity concentration, making the study more comprehensive and profound. The article provides new insights based on the previous work.

6.3. Research Limitations

First, the article chooses Chinese enterprises as the research object. The universality of research results is not sufficient, there are certain gaps in the social background and economic policies of different countries, so future research can cover a broader area and scope, furthering more in-depth research on the impact of green capital structure on enterprise development [37].
Secondly, limitations of the R&D input variables. The main elements of R&D innovation are people, capital, and technology, etc. The article ignores human and patented technology, etc. Since there is a serious lack of information on R&D personnel and patented technology in listed companies, only R&D capital is considered in the research process. With the improvement of data and information in the future, a more comprehensive study can be conducted [38].
Thirdly, the article mainly focuses on listed companies and does not include unlisted companies in the study, so the results may not be suitable for unlisted companies.

6.4. Research Recommendations

First, at the company level, optimize the green capital structure and employ managers who value green development. Different types of enterprises are at different stages of their own development, and enterprises should attach great importance to the arrangement and planning of their green capital structure. They should have a detailed plan drawn up after detailed analysis and examination by a specialist, keeping in mind the objectives and understanding information in many ways during the planning process to avoid information asymmetry [39,40]. Once the plan has been drawn up, it should be implemented in accordance with the plan so that the funds raised are used to maximum effect. The role and conditions of managers in the capital restructuring process should be taken into account. The will of management is very important in choosing the direction of the company’s development, so when appointing and training management personnel, the company should focus on developing and assessing management’s environmental awareness, choosing a management team that focuses on the long-term interests of the company and has a strategic vision for development, and focusing on the supervisory role of the supervisory board. Environmental performance can be included in the performance evaluation criteria for managers, so that management can really focus on the sustainable development of the company.
Second, at the government level, it actively plays a role in improving the financing environment. It is important to have a good capital environment for corporate financing, and although China’s capital market has made great progress, it still needs to be further improved [41,42,43]. The government should play a role by, for example, establishing a reasonable and effective financing system based on relevant research and studies and vigorously developing the bond market, all of which will facilitate further financing and development of enterprises [44]. The government should effectively regulate the market. China’s current financing channels are still relatively single, can actively innovate to develop a diversified new channel, as far as possible to enable enterprises to lower the cost of financing, to further meet the environmental protection class capital needs, both to improve the development of enterprises, but also to protect the environment.
Third, at the public level, vigorously promote environmental protection, starting with the smallest things in life. Green education should start at an early age and cultivate children’s awareness of environmental protection. Encourage the public to engage in green consumption and cultivate public awareness of green investment, thus gradually promoting the development of a green economy.

6.5. Prospects for the Future

In the context of the development of the green economy, future research deserves further attention in the following areas.
(1) To examine the impact of green capital structure on corporate development and macroeconomics in the post-epidemic era.
The impact of the Corona Virus Disease 2019 has been significant and has affected many companies, affecting their production and business models and values, and therefore their capital structure. The impact of the Corona Virus Disease 2019 has been felt by everyone, from the smallest to the largest, in the national and global economy, and at the same time has had a huge impact on the global ecological environment, further influencing changes in environmental laws and policies. Therefore, it is necessary to study the impact of green capital structure on corporate development and macroeconomics in the post-epidemic era future.
(2) Introduction of other variables to examine the relationship between green capital structure and corporate development.
The article examines the relationship between technological innovation and the impact of green capital structure on firm development [45]. There are many factors that influence green capital structure and enterprise development, and future research can be further expanded, such as: environmental regulation, the impact of government macro-regulation, etc., which will help to make the theoretical study of green capital structure on enterprise development more complete.

Author Contributions

Conceptualization, M.Z. and R.F.; methodology, R.F.; software, R.F.; validation, R.F.; formal analysis, R.F.; investigation, R.F.; resources, R.F.; data curation, R.F.; writing—original draft preparation, R.F.; writing—review and editing, R.F.; visualization, R.F.; supervision, R.F.; project administration, R.F.; funding acquisition, M.Z. All authors have read and agreed to the published version of the manuscript.

Funding

This research was funded by University Research Fund of Education Department of Liaoning Province grant number LJKR0140. The APC was funded by Liaoning Technical University.

Institutional Review Board Statement

Not applicable.

Informed Consent Statement

Not applicable.

Data Availability Statement

The data presented in this study are available on request from the corresponding author. The data are not publicly available, owing to privacy concerns.

Conflicts of Interest

The authors declare no conflict of interest.

References

  1. Xu, J.; Cui, J. Low carbon cities and enterprise green technology innovation. China Ind. Econ. 2020, 12, 178–196. [Google Scholar]
  2. Cai, H.J.; Xie, Q.; Zhang, W.M. Power or profit: The institutional logic of financialization of real enterprises from the perspective of environmental regulation. Account. Res. 2021, 4, 78–88. [Google Scholar]
  3. Liu, Y.-Y.; Huang, Z.Y.; Liu, X.-X. Environmental regulation, executive compensation incentives and corporate environmental investment—Evidence from the implementation of the Environmental Protection Act of 2015. Account. Res. 2021, 5, 175–192. [Google Scholar]
  4. Li, Z.B.; Huang, X.Y. New Environmental Protection Law, Corporate Strategy and Technological Innovation: A Study on Listed Companies in Heavy Pollution Industry. Res. Financ. Econ. 2021, 7, 130–137. [Google Scholar]
  5. Cao, M.; Shi, X.; Yang, Y.Y.; Lu, M. The “double carbon” target and green capital: A study on the system and mechanism for building an orderly flow of capital. South. Financ. 2021, 6, 59–68. [Google Scholar]
  6. Lv, H.X. Relationship between capital structure and enterprise value of listed pharmaceutical and medical companies--an empirical analysis based on panel data model. Bus. News 2020, 27, 10–12. [Google Scholar]
  7. Qie, H.; Geng, Z.; Zhang, Z. The relationship between capital structure and business performance of high-tech enterprises: A perspective based on different R&D intensity. Sci. Technol. Manag. Res. 2020, 40, 123–132. [Google Scholar]
  8. Yao, B.; Lin, A. Shareholding structure, agency costs and corporate performance. Financ. Account. Commun. 2018, 27, 56–59. [Google Scholar]
  9. Pan, Y. A study on the interaction between capital structure and firm performance—A comparative analysis based on extractive industries and agriculture. Friends Account. 2016, 14, 42–48. [Google Scholar]
  10. Wang, Z.Q.; Wang, H.; Wang, Z.J. Corporate green development, government subsidies and R&D expenditures: A discussion of the ethical development hierarchy of firms. Contemp. Financ. 2021, 2, 75–87. [Google Scholar]
  11. Gong, Y.; Xia, Y. Internal control quality, R&D investment and corporate performance. Friends Account. 2017, 18, 35–39. [Google Scholar]
  12. Wang, C.; Feng, Y.; Liu, H.; Chen, C. Research on the influence of intellectual capital on capital structure of high-tech enterprises. Friends Account. 2017, 7, 26–30. [Google Scholar]
  13. Hall, B. The Financing of Research and Development; NBER Working Paper 8873; NBER: Cambridge, MA, USA, 2022. [Google Scholar]
  14. Wei, M.; Wang, R.Z. An empirical study on the impact of financing structure on firm performance—A moderating effect based on firm innovation. Shanghai Econ. 2017, 3, 84–99. [Google Scholar]
  15. Li, H.; Tang, Y.; Zuo, J. Innovating with your own money or with other people’s money?—A study on the financing structure and corporate innovation of Chinese listed companies. Financ. Res. 2013, 2, 170–183. [Google Scholar]
  16. Cao, Y.; Min, X. Research on the problem of optimizing capital structure of enterprises. China Bus. Theory 2017, 19, 78–79. [Google Scholar]
  17. Zhu, M.Q.; Zhang, F.H. Executive team, corporate innovation and corporate performance-an empirical study based on the mediating role of corporate innovation. Friends Account. 2018, 22, 64–71. [Google Scholar]
  18. Gong, L.; Lin, D. Resource allocation efficiency and high-quality economic development. J. Peking Univ. (Philos. Soc. Sci. Ed.) 2020, 57, 105–112. [Google Scholar]
  19. Wang, Z.; Gao, Y.S. Digital finance and the speed of dynamic adjustment of capital structure. Mod. Financ. Econ. (J. Tianjin Univ. Financ. Econ. 2023, 43, 32–49. [Google Scholar]
  20. Ji, L.Y.; Qian, H.H. The impact of carbon information disclosure quality on corporate green technology innovation: Paths and effects. Financ. Account. Mon. 2022, 13, 1–10. [Google Scholar]
  21. Li, F.; Xue, B. Research on the impact mechanism of corporate technological innovation on credit risk. Soft Sci. 2022, 36, 103–109. [Google Scholar]
  22. Zhang, W. Constructing the basic policy of enterprise development in China. New Vis. 2020, 6, 5–13. [Google Scholar]
  23. Zhang, L.; Zhang, J.; Luo, Q. Research on the impact of economic policy uncertainty on capital structure decisions of agricultural listed companies. Agric. Technol. Econ. 2019, 11, 45–59. [Google Scholar]
  24. Tian, J. Reflections on corporate financial management objectives and capital structure optimization. Financ. Account. Study 2019, 20, 90. [Google Scholar]
  25. Liu, W. A literature review on the impact of capital structure on R&D investment. Shandong Text. Econ. 2018, 3, 16–19. [Google Scholar]
  26. Zhang, J.; Wang, H.; Zhang, X. Financing structure, innovation stage and corporate innovation investment. J. Beijing Univ. Technol. (Soc. Sci. Ed.) 2017, 17, 35–46+57. [Google Scholar]
  27. Wu, H.; Hu, S. Digital transformation, technological innovation and high-quality development of enterprises. J. Zhongnan Univ. Econ. Law 2023, 1, 136–145. [Google Scholar]
  28. Yue, Y.; Ma, Y.; Zhang, L. Government subsidies, technological innovation and high-quality development of high-tech enterprises. J. Nanjing Univ. Financ. Econ. 2022, 2, 46–54. [Google Scholar]
  29. Yue, Y.J.; Zhang, L.E.L. Enterprise informatization, technological innovation and high-quality development of GEM companies. Technol. Econ. 2022, 41, 25–34. [Google Scholar]
  30. Yue, Y.J.; Zhang, L.E.R.; Ji, M. Government subsidies, technological innovation and high-quality development of GEM firms. J. Harbin Univ. Commer. (Soc. Sci. Ed.) 2022, 2, 3–14. [Google Scholar]
  31. Li, H.; Cao, Y. Development stages, techno-logical orientation and innovation behavior of start-ups. Sci. Technol. Manag. Res. 2020, 40, 127–137. [Google Scholar]
  32. Chen, L.; Fu, Y. Dynamic characteristics of technological innovation affecting the high-quality development of enterprises under financing constraints. China Soft Sci. 2019, 12, 108–128. [Google Scholar]
  33. Wu, Y. Synergistic development of technological innovation and non-technological innovation--micro empirical evidence of collaborative innovation in Chinese industrial enterprises. J. Seek. Knowl. 2019, 46, 89–97. [Google Scholar]
  34. Li, H.; Zhang, Y.; Chen, Z. Technology logic, institutional logic and innovation performance of start-ups--analysis based on the development stage of start-ups. Sci. Technol. Prog. Countermeas. 2017, 34, 83–89. [Google Scholar]
  35. Wei, L.; Ma, M. The development of digital economy and green innovation of enterprises: A quasi-natural experiment based on the pilot construction of “smart city”. Mod. Financ. Econ. (J. Tianjin Univ. Financ. Econ.) 2022, 42, 24–40. [Google Scholar]
  36. Lv, Z.; Bao, Q.; Ren, L.; Li, Y. Can digital finance promote the development of green transformation of industrial economy? --An empirical analysis based on data of industrial enterprises above the scale. Sci. Technol. Manag. Res. 2021, 41, 184–194. [Google Scholar]
  37. Zhu, Y.; Gao, H.; Xiao, T. Green technology innovation, industrial structure optimization and high-quality economic development of industrial enterprises. Stat. Decis. Mak. 2021, 37, 111–115. [Google Scholar]
  38. Bian, Y.; Wu, L.; Bai, J.; Yang, Y. Does factor market distortion inhibit green economic growth? World Econ. J. 2021, 2, 105–119. [Google Scholar]
  39. He, Y.J.; Cai, D. Analysis of green technology innovation efficiency of industrial enterprises in Yangtze River Delta and its influencing factors. Chongqing Soc. Sci. 2021, 1, 49–63. [Google Scholar]
  40. Wang, W.; Dai, Y.; Qiao, G. A quasi-natural experiment on the impact of green credit policy on the competitiveness of commercial banks based on regional commercial banks. Res. Financ. Econ. 2021, 8, 62–71. [Google Scholar]
  41. Zhang, X.; Shi, X. A discussion of accounting and financial issues based on dual carbon objectives. Account. Res. 2021, 9, 24–34. [Google Scholar]
  42. Lu, J.; Yan, Y.; Wang, T. The micro effects of green credit policy: A perspective of technological innovation and resource reallocation. China Ind. Econ. 2021, 1, 174–192. [Google Scholar]
  43. Rong, J.; Liu, X.; Tong, Z. A study on the relationship between knowledge stock, dual learning and firm performance. Ind. Technol. Econ. 2016, 35, 68–74. [Google Scholar]
  44. Li, C.; Nie, J. The relationship between the scope and proportion of equity incentives and firm performance—Based on the perspective of industrial factor intensity. Friends Account. 2018, 2, 87–94. [Google Scholar]
  45. Kong, N.N.; Zhang, X.M.; Tang, J. Study on the relationship between strategy, capital structure and performance of high-tech enterprises in China. China Ind. Econ. 2010, 9, 112–120. [Google Scholar]
Figure 1. Schematic diagram of the research framework.
Sustainability 15 05743 g001
Figure 2. Placebo test coefficient diagram.
Sustainability 15 05743 g002
Figure 3. Test p-value diagram of placebo.
Sustainability 15 05743 g003
Figure 4. Test T-value diagram of placebo.
Sustainability 15 05743 g004
Table 1. Variable definition table.
Variable TypeVariable SymbolVariable NameVariable Description
Explanatory variablesGCSGreen capital structureThe net fund fundraising of environmental protection directions/share capital
Explained variableEDEnterprise developmentBasic earnings per share
ModeratorTATechnical innovationR&D investment/operating income
Control variableOPMProfitabilityBusiness profit/operating income
SIZEEnterprise scaleNature of total assets at the end of the year
FARFixed asset ratioNet assets/total assets
GROPBusiness profit growth rate(business profit this year − last year’s business profit)/last year’s business profit
ARTAccounts receivable turnover rateBusiness income/accounts receivable average occupation
YEARAnnual variablevirtual variable
Table 2. Description statistical analysis.
VariableNminMeanMaxp25p50p75sd
ED760−1.0300.5522.8500.2000.4300.7600.576
GCS7600.1972.09810.911.0051.5922.5691.745
TA7600.0434.27228.032.2953.5804.8554.101
SIZE76020.1922.5026.8121.4422.3623.331.366
FAR7600.0160.2010.5630.1100.1860.2720.120
OPM760−0.4970.0980.5090.0450.0940.1460.120
GROP760−5.9790.32512.39−0.1560.1170.4071.862
ART7600.96815.43299.72.5364.4239.13640.26
Table 3. Pearson correlation analysis.
EDGCSTASIZEFAROPMGROPART
ED1
GCS0.338 ***1
TA−0.072 **0.157 ***1
SIZE0.00700−0.0220−0.211 ***1
FAR0.076 **−0.069 *−0.198 ***0.100 ***1
OPM0.513 ***0.05000.0160−0.163 ***−0.03501
GROP0.309 ***0.0290−0.066 *0.04700.085 **0.358 ***1
ART0.113 ***−0.082 **−0.177 ***0.170 ***0.256 ***−0.03100.067 *1
Standard errors in parentheses. *** p < 0.01, ** p < 0.05, * p < 0.1.
Table 4. Inspection of the relationship between green capital structure and corporate development.
(1)(2)
VariablesEDGCS
GCS0.112 ***
(0.00937)
TA−0.0120 ***0.0227
(0.00415)(0.0138)
SIZE0.0182−1.064 ***
(0.0124)(0.0769)
FAR0.276 *−0.581
(0.141)(0.468)
OPM2.252 ***−0.208
(0.146)(0.487)
GROP0.0343 ***0.0430
(0.00937)(0.0311)
ART0.00159 ***−0.00311 **
(0.000421)(0.00140)
GCSE 1.550 ***
(0.0918)
Constant−0.353−5.866 ***
(0.286)(1.034)
YearIndControl
Observations760760
R-squared0.4140.298
Standard errors in parentheses. *** p < 0.01, ** p < 0.05, * p < 0.1.
Table 5. Test the relationship between green capital structure, technological innovation, and corporate development.
(1)(2)(3)(4)0(5)1
VariablesEDEDEDEDED
GCS0.136 ***0.112 ***0.108 ***0.108 ***0.105 ***
(0.0117)(0.00937)(0.00932)(0.0145)(0.0116)
TA0.00420−0.0120 ***
(0.00637)(0.00415)
GCS × TA−0.00426 ***
(0.00128)
SIZE0.0262 **0.01820.0246 **0.02030.00751
(0.0125)(0.0124)(0.0122)(0.0186)(0.0169)
FAR0.318 **0.276 *0.335 **0.1870.405 *
(0.141)(0.141)(0.141)(0.194)(0.212)
OPM2.205 ***2.252 ***2.258 ***2.744 ***2.142 ***
(0.146)(0.146)(0.147)(0.283)(0.160)
GROP0.0368 ***0.0343 ***0.0354 ***0.0509 ***0.00717
(0.00934)(0.00937)(0.00941)(0.0142)(0.0121)
ART0.00167 ***0.00159 ***0.00171 ***0.00137 **0.00251 ***
(0.000419)(0.000421)(0.000421)(0.000535)(0.000780)
Constant−0.614 **−0.353−0.555 **−0.423−0.206
(0.295)(0.286)(0.279)(0.433)(0.375)
YearIndControl
Observations760760760378382
R-squared0.4220.4140.4070.3980.463
Standard errors in parentheses. *** p < 0.01, ** p < 0.05, * p < 0.1.
Table 6. The test of the relationship between green capital structure, technological innovation, and enterprise development.
(1)(2)
VariablesEDNAPS
GCS0.112 ***0.0475 ***
(0.00937)(0.00652)
TA−0.0120 ***
(0.00415)
SIZE0.01820.0230 ***
(0.0124)(0.00855)
FAR0.276 *−0.151
(0.141)(0.0982)
OPM2.252 ***0.410 ***
(0.146)(0.103)
GROP0.0343 ***0.0183 ***
(0.00937)(0.00658)
ART0.00159 ***0.000391
(0.000421)(0.000295)
TA2 −0.00169
(0.00927)
Constant−0.353−0.541 ***
(0.286)(0.195)
YearIndControl
Observations760760
R-squared0.4140.121
Standard errors in parentheses. *** p < 0.01, * p < 0.1.
Table 7. Cash flow and equity concentration of business activities.
(1)(2)(3)
VariablesEDEDED
CASH1.783 ***1.821 ***
(0.287)(0.312)
GCS0.107 ***
(0.00910)
SIZE0.0243 **0.0242 *0.0212
(0.0120)(0.0130)(0.0134)
FAR0.0855−0.002160.238
(0.143)(0.155)(0.152)
OPM1.975 ***2.026 ***2.289 ***
(0.150)(0.164)(0.160)
GROP0.0391 ***0.0416 ***0.0387 ***
(0.00921)(0.0100)(0.0102)
ART0.00132 ***0.000990 **0.00137 ***
(0.000416)(0.000452)(0.000456)
Z 0.00404 *
(0.00231)
Constant−0.548 **−0.306−0.254
(0.272)(0.295)(0.303)
YearIndControl
Observations760760760
R-squared0.4360.3320.304
Standard errors in parentheses. *** p < 0.01, ** p < 0.05, * p < 0.1.
Table 8. Effects of the nature of different property rights.
(1)(2)0(3)1
VariablesEDEDED
GCS0.112 ***0.134 ***0.0157
(0.00937)(0.0103)(0.0202)
TA−0.0120 ***−0.0231 ***0.0160 **
(0.00415)(0.00507)(0.00663)
SIZE0.0182−0.009670.0877 ***
(0.0124)(0.0167)(0.0223)
FAR0.276 *0.363 **0.411 *
(0.141)(0.171)(0.246)
OPM2.252 ***2.016 ***3.249 ***
(0.146)(0.159)(0.351)
GROP0.0343 ***0.0417 ***0.00151
(0.00937)(0.0100)(0.0233)
ART0.00159 ***0.00137 *0.00159 ***
(0.000421)(0.000790)(0.000482)
Constant−0.3530.284−2.030 ***
(0.286)(0.369)(0.553)
YearIndControl
Observations760574186
R-squared0.4140.4480.454
Standard errors in parentheses. *** p < 0.01, ** p < 0.05, * p < 0.1.
Disclaimer/Publisher’s Note: The statements, opinions and data contained in all publications are solely those of the individual author(s) and contributor(s) and not of MDPI and/or the editor(s). MDPI and/or the editor(s) disclaim responsibility for any injury to people or property resulting from any ideas, methods, instructions or products referred to in the content.

