Article

Optimal Elasto-Plastic Analysis of Prestressed Concrete Beams by Applying Residual Plastic Deformation Limitations

by
Sarah Khaleel Ibrahim
and
Majid Movahedi Rad
*
Department of Structural and Geotechnical Engineering, Széchenyi István University, 9026 Gyor, Hungary
*
Author to whom correspondence should be addressed.
Sustainability 2023, 15(7), 5742; https://doi.org/10.3390/su15075742
Submission received: 20 February 2023 / Revised: 15 March 2023 / Accepted: 22 March 2023 / Published: 24 March 2023
(This article belongs to the Special Issue Structural Engineering Simulation and Optimization for Sustainability)

Abstract

:
This work introduces elasto-plastic analysis of prestressed reinforced concrete beams under different prestressing conditions by limiting the residual plastic behaviour inside the steel bars using complementary strain energy. A non-linear optimal method was used to limit residual plastic deformations in steel bars, including prestressed tendons, used to reinforce beams from two previous research investigations. This was considered by using an optimization approach with an objective function to find the maximum loading while applying constraints on the complementary strain energy of residual internal forces in steel elements to control residual plastic deformations. Thus, an elasto-plastic optimization programme was linked to models simulated by ABAQUS, as concrete was calibrated by the concrete damage plasticity (CDP) model. Some variables were considered regarding the force applied inside prestressed tendons and the number of tendons used inside the models. Thus, limits on complementary strain energy affected load values and model damage where an increase in the permissible strain energy value leads to an increase in the corresponding loading values produced; thus, this produces a higher stress intensity in steel and tension-damaged areas in concrete. Based on these data, many comparisons have been made to determine when beams behaved elastically and how they turned into plastic.

1. Introduction

Prestressed concrete structures are commonly utilised because they are stronger, perform better, and allow for construction modifications [1]. Even if the structures were totally unloaded, the steel in the cracked locations is normally in a high-stress condition. Recently, prestressed concrete beam research has increased; Padmarajaiah and Ramaswamy [2] estimated the flexural behaviour of fully and partially prestressed high-strength concrete beams in 2002 using three-dimensional non-linear finite elemental analysis. Furthermore, Kim et al. [3] used non-linear finite element analysis to study the flexure behaviour of prestressed concrete beams strengthened with carbon-fibre-reinforced polymer (CFRP) sheets, focusing on ductility and cracking. In addition, Badawy et al. [4] examined the failure causes, ultimate load capacity, and deflection at critical sections of prestressed beams, prestressed beams with steel addition, and reinforced concrete beams. Bonopera et al. [5] tested a large-scale high-strength Prestressed Concrete I (PCI) beam with a parabolic unbonded tendon to simulate a prestressed bridge member. The simply supported PCI beam was exposed to free transverse vibrations with varying prestress forces to show that its fundamental frequency was unaffected. Noble et al. [6] described the results of static three-point bending testing and output-only experimental modal analysis on nine post-tensioned concrete beams where each of the nine beams underwent static three-point bending and dynamic impact testing at various post-tensioning forces.
The theory of structural optimization has advanced greatly in recent decades, with several books, surveys, and papers defining it. Cohn and Dinovitzer [7] presented 500 published optimization examples coordinated with developers’ specifications to highlight the importance of optimization in structural engineering. Leps and Sejnoha [8] optimized reinforced concrete structures using algorithm-based methods. Coello et al. [9] developed a method for determining the optimal design of reinforced concrete beams under a specific group of restrictions using a new optimization model for more sensible and valuable designs. Rahmanian et al. [10] reviewed optimization literature by considering reinforced concrete beams and setting an optimization objective, such as minimising cost or weight, realising that the design variables and constraints differ widely, and using various optimization techniques to provide the optimal design of the beams. Chutani and Singh [11] developed a conventional optimization technique to find the optimal design of reinforced concrete beams, indicating that the optimal cross-sectional sizing of an RC beam saves money, although it cannot be standardized for all design factors.
Gokul and Sabarigirivasan [12] presented RC beam finite element analysis using ABAQUS where the non-linear finite element approach was employed to examine the structural behaviour of reinforced concrete beams with and without openings aiming to minimise the beams’ self-weight as well as the overall structure. Lezgy-Nazargah et al. [13] evaluated the accuracy and dependability of the bond–slip laws used for numerical modelling of FRP/concrete interactions, with a 3D non-linear finite element (FE) model being used to represent RC beams retrofitted with external FRP. Yeganeh-Salman and Lezgy-Nazargah [14] studied a non-linear static analysis of reinforced concrete (RC) structures using the 3D finite element method, which is a time-consuming and challenging task.
Plastic methods reveal post-yield behaviour and structure breakdown, allowing significant material savings by using the plastic reserve. Yet, this results in the creation of plastic deformations, which accumulate and remain after unloading, causing structural failure. Thus, Bendsee and Sokolowski [15] examined the problem of defining the deviation in structural response as a general result acquired for discrete structures where optimal design is important, and the sensitivity result is used in the solution process for an optimization problem of a simple truss structure that undergoes elastoplastic deformation. Newman and Armen [16] argued that residual plastic deformations in the direction of an advancing fracture end generate a crack closure phenomenon. Several approaches, solutions, and studies have been developed to estimate inelastic deformations in the plastic analysis [17,18,19,20]. In 1997, Kaliszky and Logo compared optimal plastic design methods for bar structures using volume as the aim function and minimising residual deformations by reducing the complementary strain energy of residual internal forces [21]. Then, in 1999, Kaliszky and Logo [22] proposed a design method for optimally strengthening trusses, where the goal was to strengthen the truss by applying additional elasto-plastic bars and supports while ensuring, in light of constraints on overall plastic deformations, that the truss did not undergo excessive plastic deformations.
Optimization has the potential to greatly improve the long-term durability of buildings, particularly those created from reinforced concrete (RC). Because of its strength, durability, and resistance to fire, reinforced concrete is frequently employed in the construction of buildings. Yet, major environmental implications, including greenhouse gas emissions, energy consumption, and resource depletion, resulting from the production of concrete and the usage of steel reinforcing. By employing optimization strategies, RC buildings can have a smaller ecological footprint without sacrificing performance or security. The embodied carbon and material requirements can be decreased by optimizing the design of the structure to utilize as little concrete and steel as possible. Advanced structural analysis technologies like finite element analysis can help with this, as can streamlining the building process to cut down on waste, energy use, and emissions [23,24].
Rad et al. [25] recently presented an approach to control the plastic behaviour of RC non-prismatic beams by using the complementary strain energy of the remaining forces formed in the steel reinforcing bars. Accordingly, and as a continuation of that work, this study for the first time applies a novel approach of the non-linear optimum elasto-plastic analysis with the goal of controlling the plastic behaviour of prestressed concrete beams under various prestressing conditions. This approach is used by limiting residual plastic deformations rising within the steel bars—including prestressed tendons—which are used in reinforcing the prestressed beams by imposing the complementary strain energy of the residual forces as a constraint, which is a known displacement limitation. Firstly, four different prestressed concrete beams were collected as benchmarks from two previous studies conducted by Padmarajaiah and Ramaswamy [2] and Badawy et al. [4], as these selected models were numerically calibrated using ABAQUS [26] with the help of the concrete damage plasticity (CDP) model, which is used to represent the behaviour of concrete in both tensile and compressive states. Then, new models were derived from the four benchmarks by modifying the number of prestressed tendons and the value of the prestressed force applied inside these tendons. Considering these obtained models and the original benchmarks, an optimization process for the applied plastic load was considered by defining an objective function to find the maximum loading. At the same time, the complementary strain energy was set as a controller of the residual plastic deformations initiated inside the steel elements. For this purpose, and considering the presence of constraints and the objective function, the authors created a novel non-linear optimization programme and linked it to the numerical models obtained by ABAQUS. Later, the complementary strain energy effect on the plastic bearing limited loading of prestressed beams having different prestressing cases is inspected, where limits on complementary strain energy have affected load values and model damage and where an increase in the permissible strain energy value leads to an increase in the corresponding loading values produced; thus, this produces a higher stress intensity in steel and tension-damaged areas in concrete.
After this introduction, a detailed explanation of the theory used in this research concerning limiting the residual plastic deformations inside steel elements is presented in the second section. Meanwhile, Section 3 deals with the formation of the optimization problem, whilst Section 4 contains the numerical calibration and the application of the optimization problem of the first set of models. Section 5 deals with the other set of prestressed beams in terms of numerical modelling and the application of the optimization problem. Finally, conclusions are illustrated in Section 6.

2. The Theory of Limited Residual Plastic Deformation Inside Steel Elements

Different previous studies [27,28,29,30,31] applied and developed the theory presented here, where an appropriate computational technique was established so that the complementary strain energy of residual forces can be recognised as a comprehensive assessment of the plastic behaviour of materials when such energy amount limits are required to regulate residual deformations. Introducing Euler’s notation and assuming a body divided into an elastic-plastic material that is time- and temperature-independent, with surface S and volume V, a section of S , S u , undergoes a surface displacement with zero value; however, the other section, S q , undergoes surface tractions, which is quasi-static q i ( t ) . At time t , the next quantities related to the tractions at the surface q i ( t ) are expressed as [32]:
  • σ i j t = actual stresses.
  • ϵ i j t and u i t = actual strains and displacements.
  • σ i j e l t = fictitious stresses that would occur if the material were purely elastic.
  • ϵ i j e l t and u i e l = fictitious elastic strains and displacements corresponding to σ i j e l t .
In addition, the following different self-stress distributions are introduced:
  • σ i j R ( t ) = actual residual stress distribution.
  • σ i j R = any arbitrary, time-independent self-stress distribution.
The actual strain is formed of elastic and plastic parts, as illustrated in Equation (1). Using the new symbol, the components of elastic strain are connected to the factual stresses according to the constitutive rule:
ϵ i j = ϵ i j e l + ϵ i j p l
ϵ i j e l = C i j k l σ k l e l
as C i j k l is the elastic tensor, and the plastic strain ϵ i j p l is presented by the associated flow rule:
ϵ i j p l = λ f σ i j ,   λ 0   i f   f = 0   a n d   f ˙ = 0 ,       otherwise   λ = 0
where f ( σ i j ) is the yield function, and f ( σ i j ) = 0 shows that the surface is convex in the stress area.
Subsequently, the factual stresses σ i j t , the fictional elastic stresses σ i j e l t , and the existing remaining stresses σ i j R have to satisfy the following:
σ i j t = σ i j e l t + σ i j R
as σ i j e l t is linked to the fictitious elastic strain ϵ i j e l ( t ) by the constitutive law:
ϵ i j e l t = C i j k l σ k l e l t .
The full plastic complementary work W p ( τ ) was accomplished throughout a load track from the undisturbed case at t = 0 up to t = τ . This study might be reflected as a suitable benchmark for measuring the plastic performance and the known plastic deformation of an elastic-plastic body. Its upper limitation could be achieved using the theorem presented by Capurso et al. [32] and Capurso [33], considering any time-independent allocation of self-stresses σ i j R that could be found such that the state is the following:
f σ i j E t + σ i j R 0 .
If applied in V at any time t τ , the full complementary plastic work is at the upper limit using the state:
W p τ 1 2 C i j k l σ i j R σ k l R d V .
It may be stated that the limit can be enhanced by the suitable choice of ( σ i j R ) [34]. Considering the limitation on the plastic complementary work described by Equation (7), in order to prevent extra plastic deformations, properly selected permissible limit W p 0 on the work in its plastic state W p must be set. The limitations of the plastic deformations are defined by the real residual stresses, i.e., it is presumed that:
σ i j R σ i j R .
This assumption provides a good upper limit and allows a suitable formulation of the problem. Therefore, the plastic deformation restriction would have the form:
W p ( τ ) = 1 2 V C i j k l σ i j R σ k l R d V W p 0 0 .
In order to constrain the remaining deformations, an appropriate computational technique was proposed which described the complementary strain energy of the remaining forces as a generic measurement of the structure’s plastic behaviour [22,25,30]. After developing Equation (9) with bar elements in mind, the complementary strain energy was calculated as follows using the remaining forces:
W p = 1 2 E i = 1 n l i A i N i R 2 W p 0
where W p 0 is an appropriate allowable energy value for W p and can result from the elastic strain energy of the structure (as presented by Kaliszky and Lógó, 1997 [21]). Moreover, l i , ( i = 1 , 2 , , n ) indicates the member’s length of bar elements, and the cross-sectional area of the bar elements is represented by A i , ( i = 1 , 2 , , n ) while N i R symbolizes the residual force of the bar members, and E is Young’s modulus of the material of bars. By applying Equation (10), the plastic deformations inside the bar elements are constrained as an appropriate limit value W p 0 is introduced.
Furthermore, the remaining forces N R that remain in the structure after completing the unloading are presented according to the inner plastic force N p l that will appear in the structure if the load P 0 and the elastic inner force N e l are applied:
N R = N p l N e l
where:
N e l = F 1 G T K 1 P 0 .
Hereby, the matrix of flexibility is represented by F, while the geometrical matrix is described by G; moreover, the matrix of stiffness is symbolized by K.

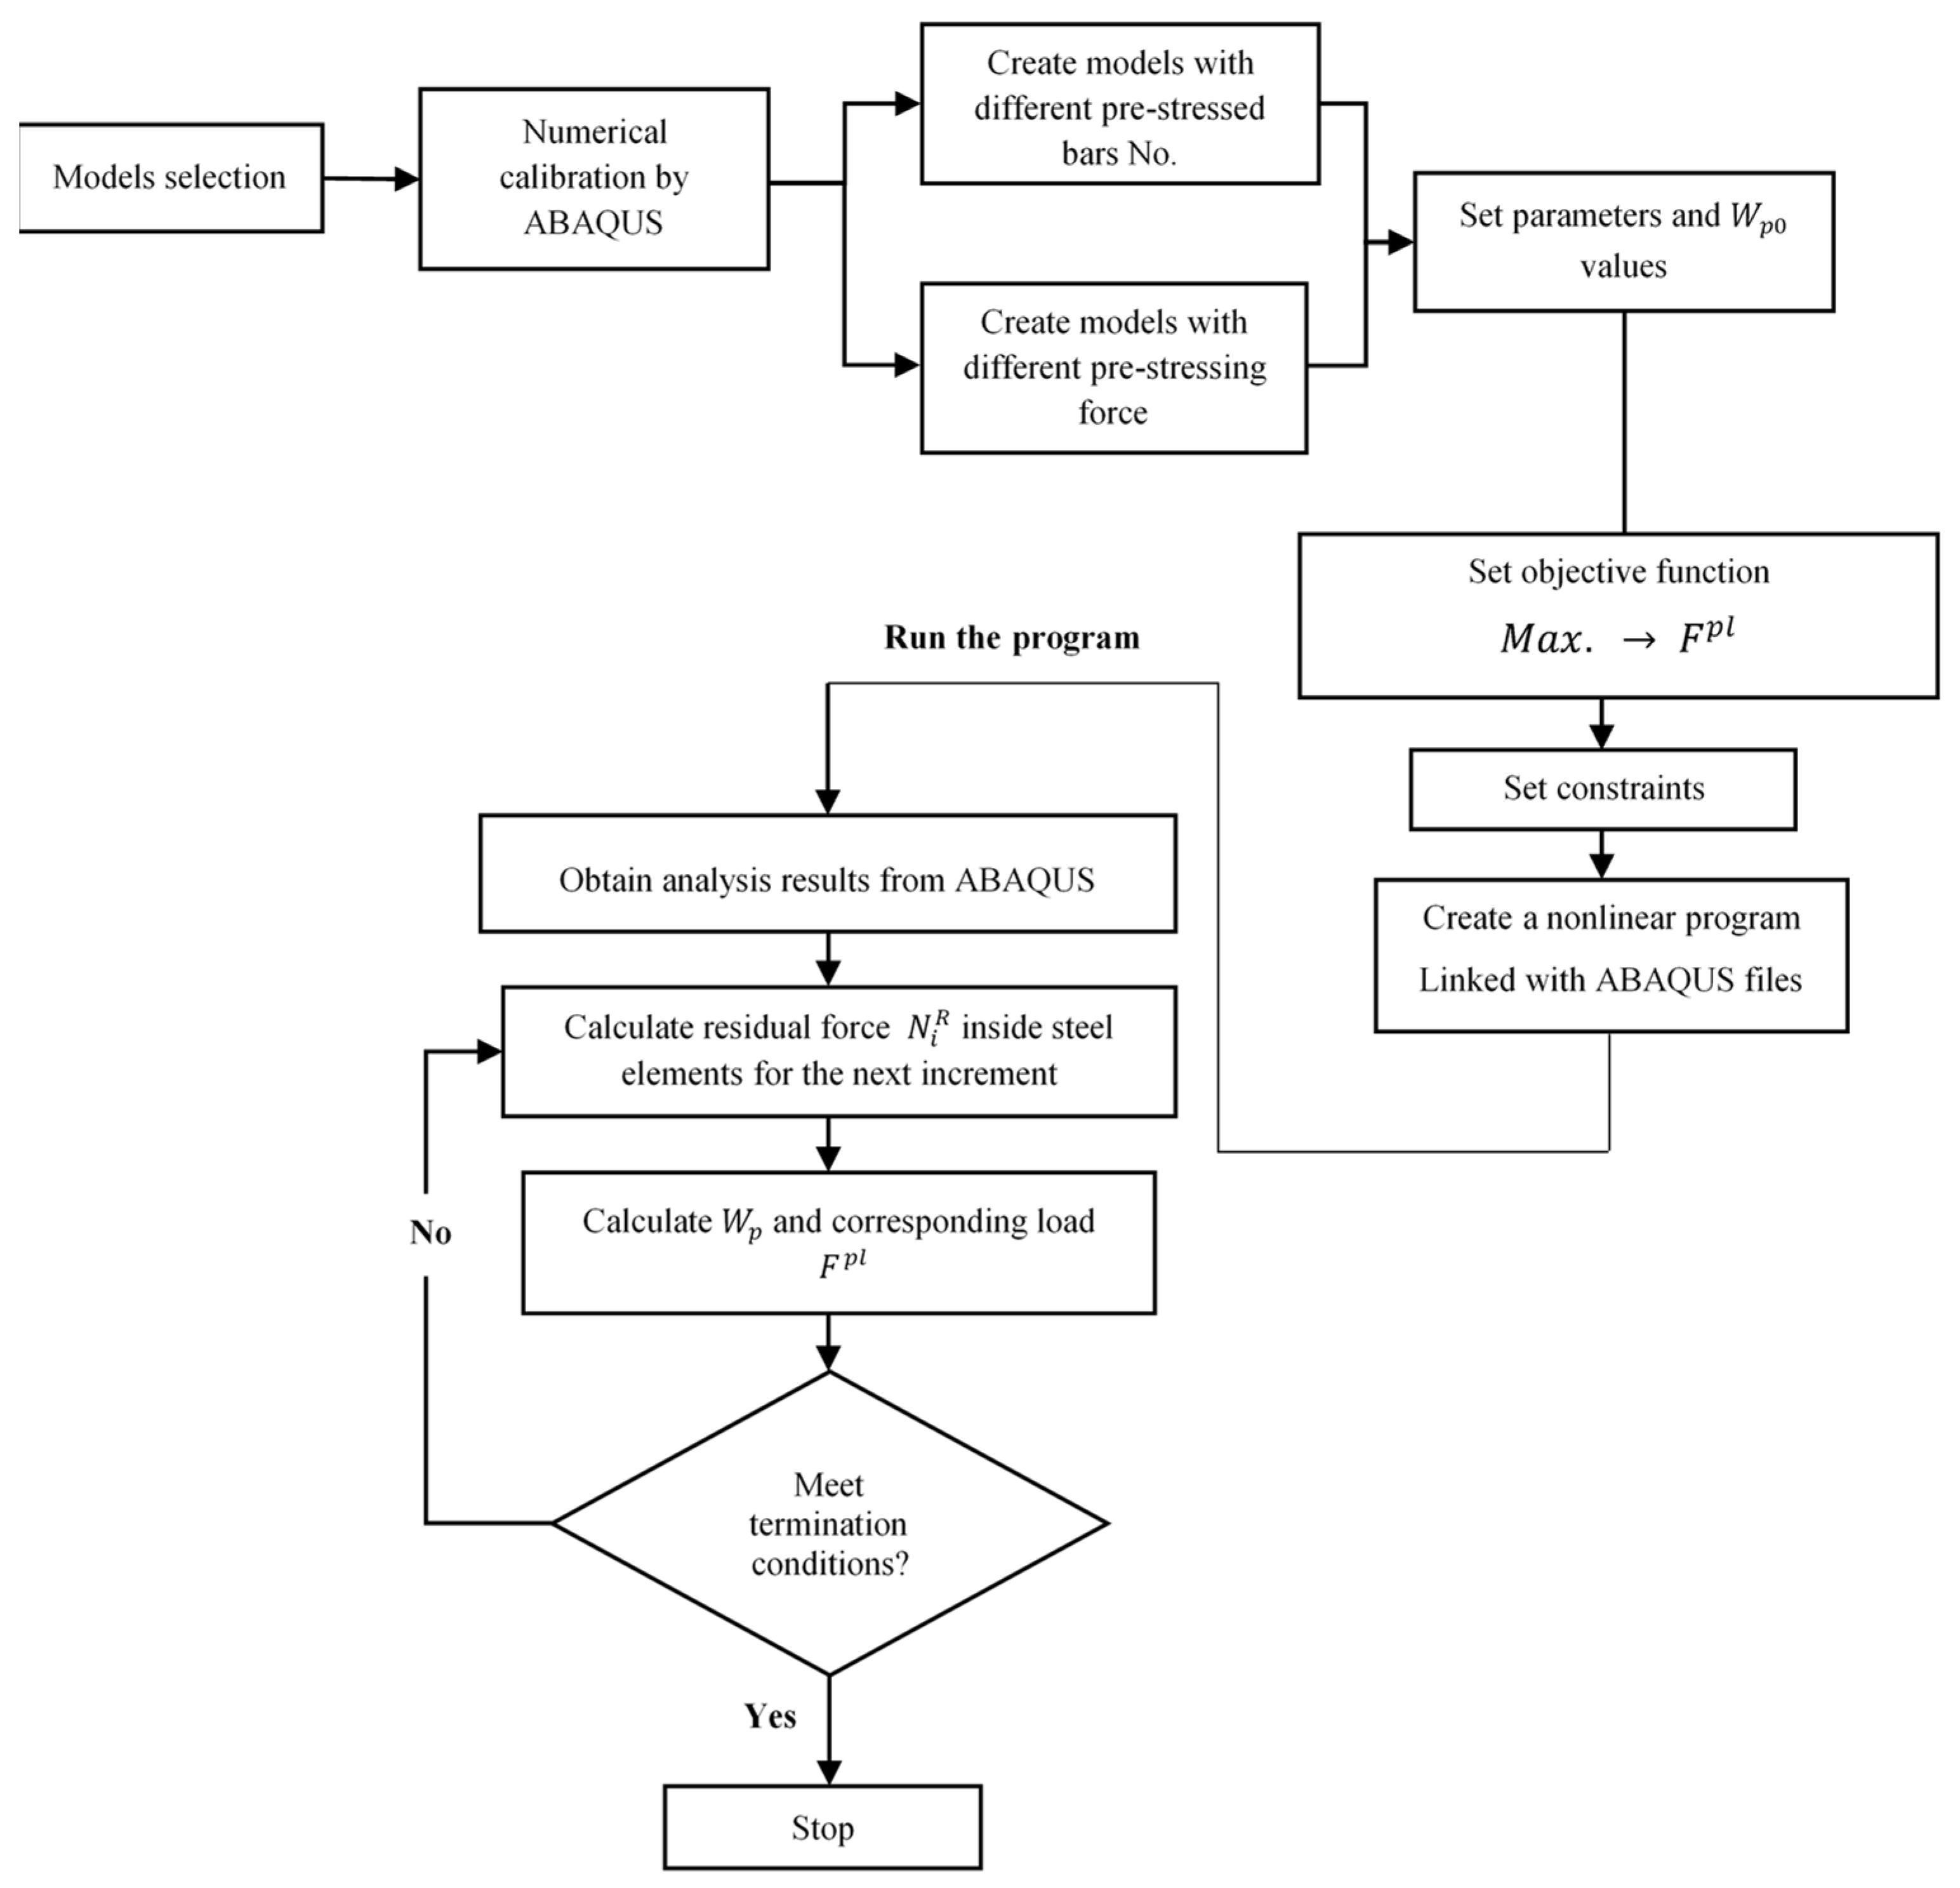
3. Optimization Problem

The mathematical procedure that is set to find the optimal loading value of reinforced concrete and prestressed beams with different prestressing conditions is explained in this section, where a non-linear optimization method is proposed to determine the maximum optimal plastic loading ( F p l ) applied to the studied models. The heeded equations define the features employed by the optimization code, whereas the objective is to maximise the applied loading ( F p l ) while the plastic deformation is controlled ( W p 0 value) by employing the limitations delivered, as A i and l i characterize the cross-sectional area and each steel element length, respectively.
M a x . F p l
S u b j e c t e d   t o : N e l = F 1 G K 1 P 0
N p l N P l N p l
1 2 E i = 1 n l i A i N i R 2 W p 0 .
Equation (14) reveals the computation of the elastic fictitious inner normal forces generated in the steel elements, as the inequality Equation (15) reveals the lower and upper plastic limitations and that N p l is the ultimate plastic limited load. Furthermore, the boundary of Equation (16) indicates the constraint on the complementary strain energy of residual forces used to control the plastic deformations of steel elements, considering it as a global estimation of structures’ plastic behaviour. Figure 1 displays the optimization problem process, and it is worth mentioning that CDP parameters inside the optimization problem are considered constants. This optimization problem was applied by running a non-linear programme that was linked with the produced ABAQUS files in order to calculate the internal residual loads for each increment, and as a result, the optimal load values corresponding to the specified permissible complementary strain energy were determined for each model.

4. Models with Different Prestressing Tendon Numbers

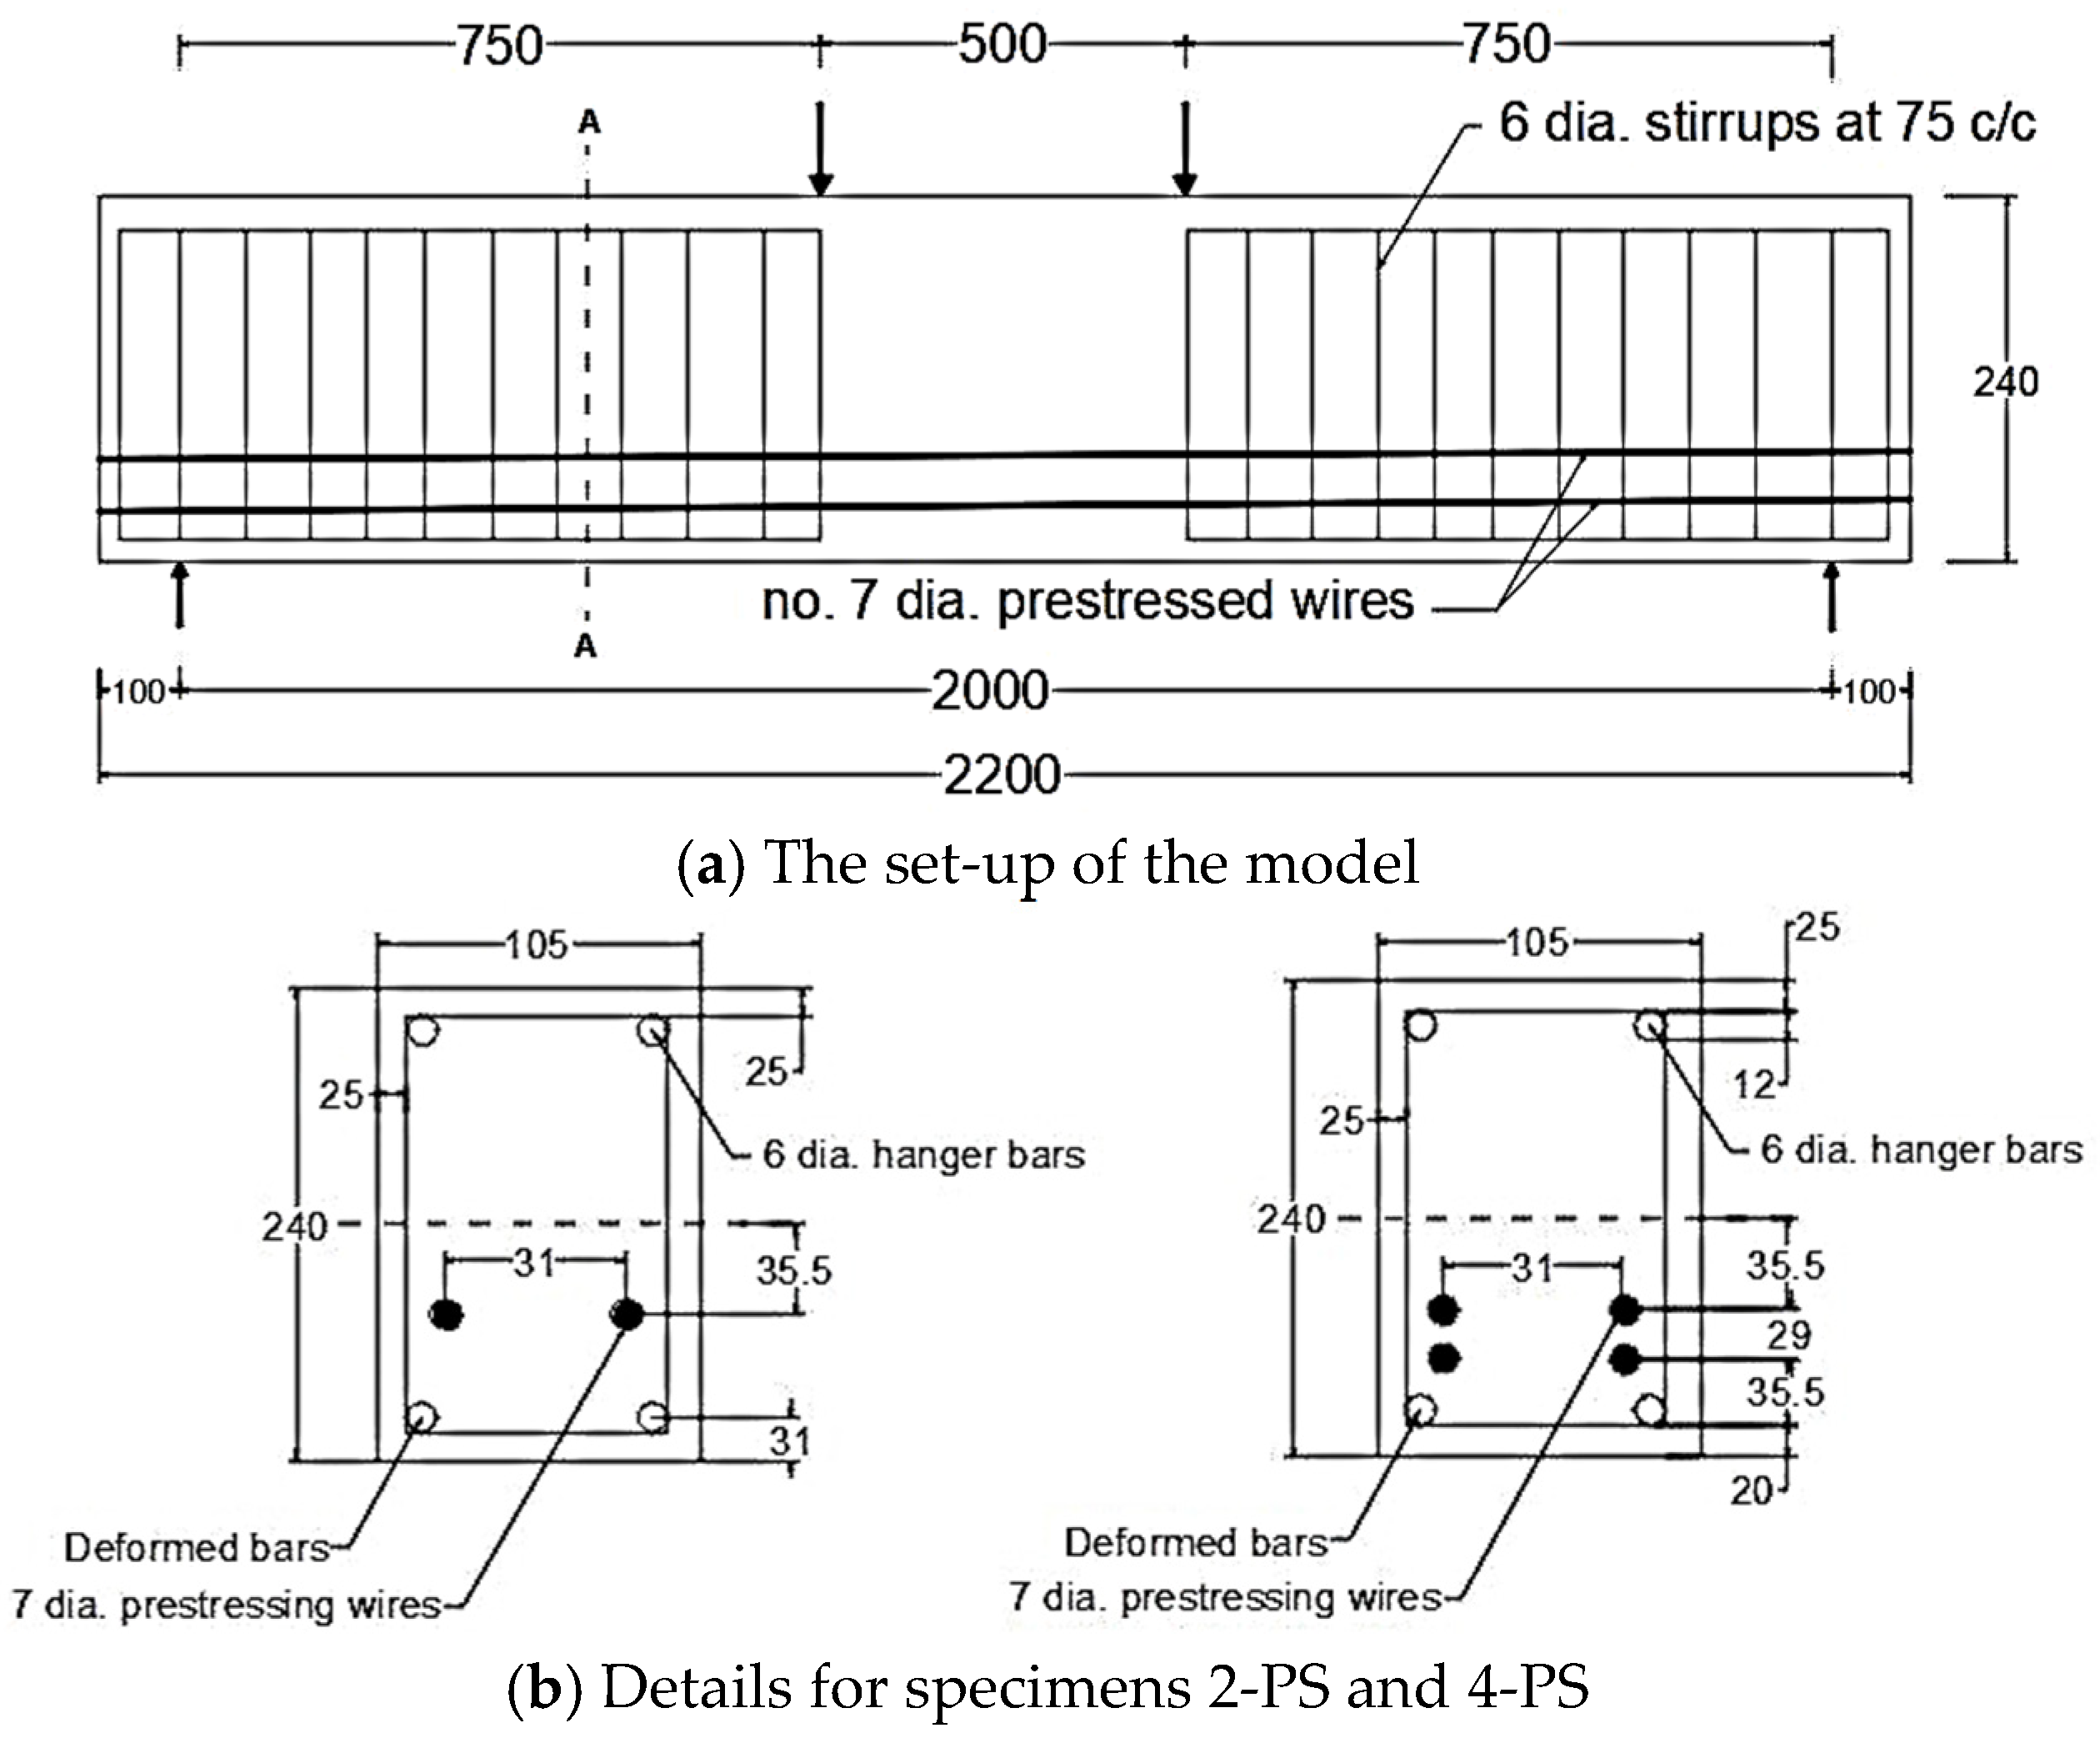
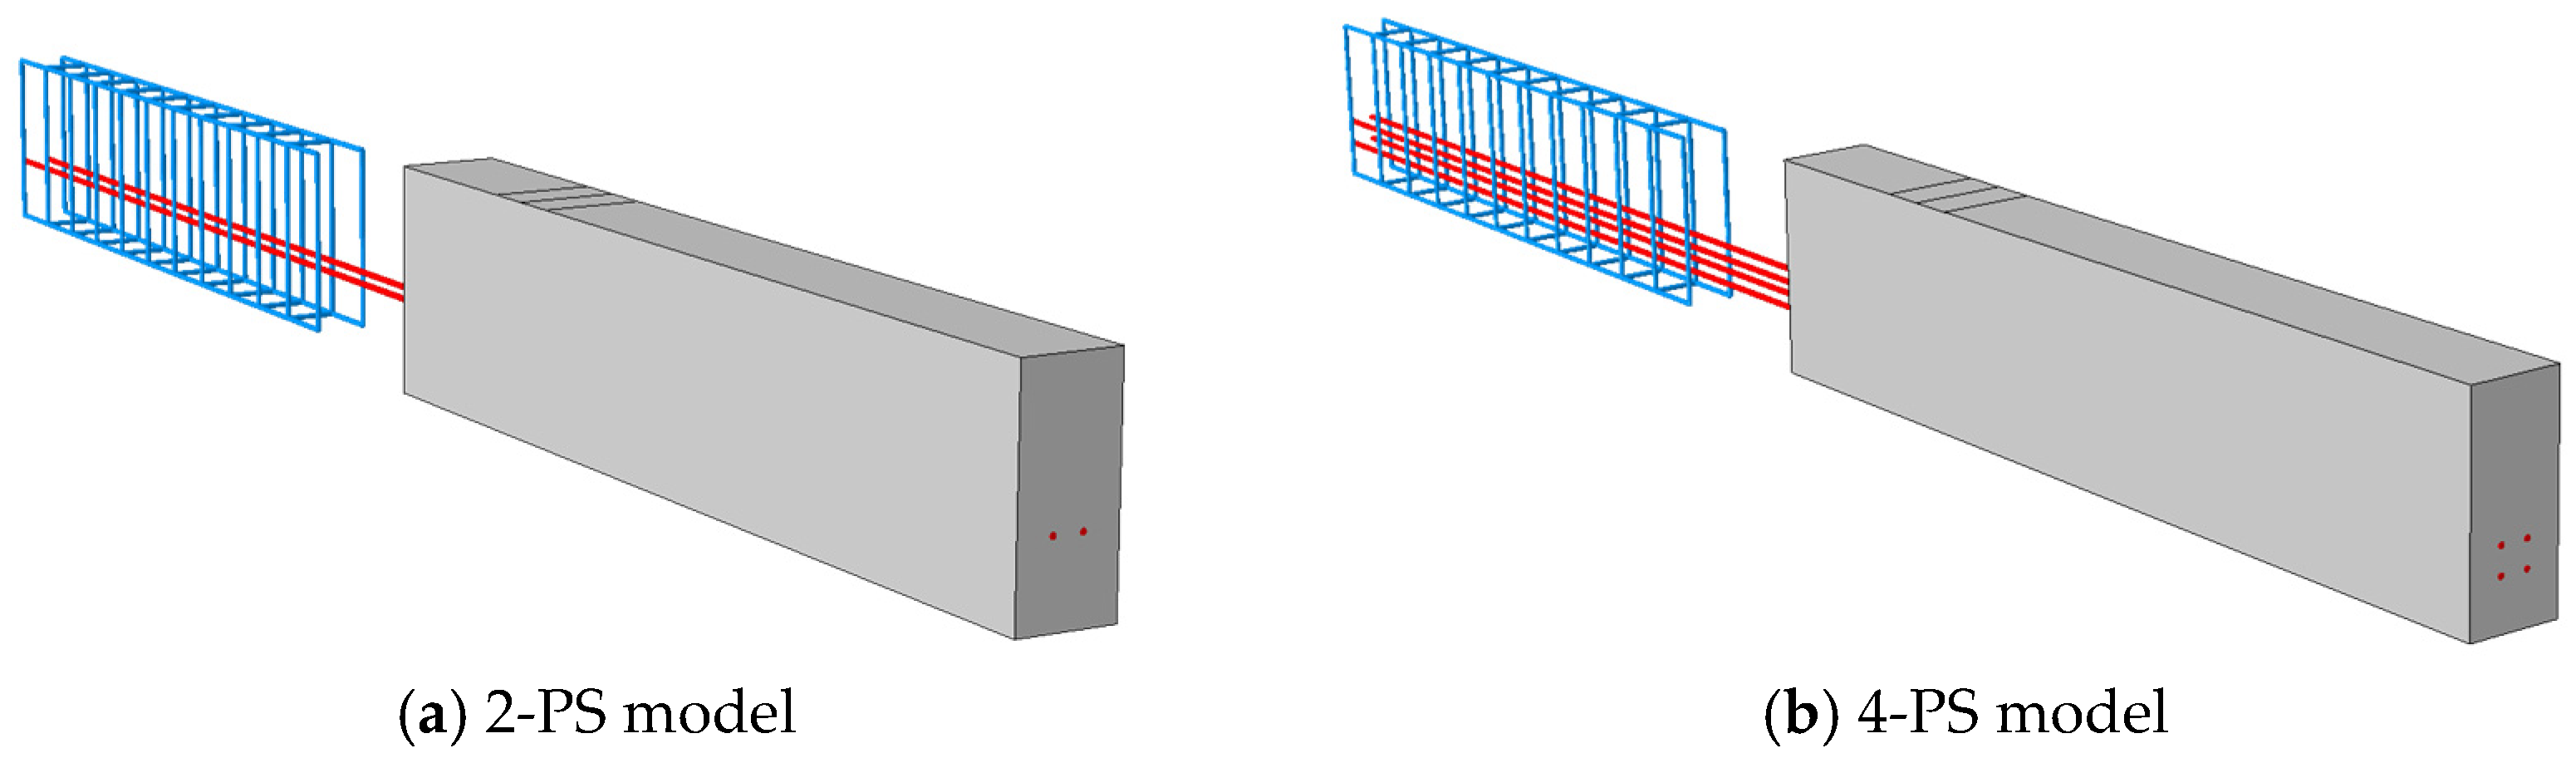
4.1. Numerical Modelling of the Benchmarks

To investigate the effect of the prestressing level, prestressed beams with different prestressed tendon numbers, having the same plain concrete strength of 65 MPa, are explored in this section, where model geometry and material properties are considered according to the study conducted by Padmarajaiah and Ramaswamy [2]. The testing programme mentioned in their study included the fabricating and testing of beams having an identical rectangular cross-section of 105 × 240 mm and a length of 2200 mm, under a four-point loading condition and specified reinforcement details as shown in Figure 2. Each prestressed tendon was tensioned up, producing a total applied prestress of 3670.67 MPa (in the case of four tendons, i.e., 4-PS model) and 1835.34 MPa in the other prestressed beams (in the case of two tendons, i.e., 2-PS model). Obviously, Figure 2a,b shows the details of these two prestressed models with two different prestressed tendon numbers that were selected, as the 2-PS beam represents the case of the prestressed beam with two tendons, while the 4-PS beam represents the case of the prestressed beam with four tendons. These two benchmarks were modelled numerically by ABAQUS and the CDP model, as illustrated in Figure 3. Concrete and reinforcing bars were used to construct the finite element model; the former was represented by a solid element with eight nodes (C3D8: eight-node first-order hexahedral element with an exact numerical integration), while the latter was modelled using beam elements with a two-node linear beam in space (B31: Timoshenko beam). An embedded zone was used to mimic the link between the reinforcement and the concrete. The non-linear behaviour of the beams was modelled using a damage plasticity model, and the analysis was performed using finite elements. Boundary conditions were selected to correspond with the assumptions made by the researchers. In addition, identical experimental circumstances were achieved by applying a vertical concentrated load at each point load of the beams and then distributing the loads through the coupling effect. The effects of mesh size on numerical accuracy and calculation time were analysed, and it was found that a mesh size of 15 provided the most accurate values. Moreover, using the data provided by the considered study, a predefined heating loading was considered to represent the prestress effect inside the tendons. As a consequence, the crack and load–deflection response patterns were acquired for each model, as displayed in Figure 4 and Figure 5, where these results are considered compatible with the experimental ones presented by the study. In addition, Figure 4 shows the intensity of the damaged areas that occur in concrete caused by the tension effect, where this intensity ranges by colour, as blue denotes the undamaged areas while red denotes the fully damaged areas, providing a general view of where the most damaged parts would be.
After accomplishing the numerical modelling of the two benchmarks, the number of prestressed tendons used along the beam was modified by accepting that there were two cases taken into account, which are the case of two tendons (2-PS model) and the case of four tendons (4-PS model). The number of tendons was adjusted to be only a case of one tendon, producing the model 1-PS, as well as a case of three tendons, giving the model 3-PS as indicated in Figure 6; thus, these models will be entered into the optimization process to study the presence of these variables on the results obtained.

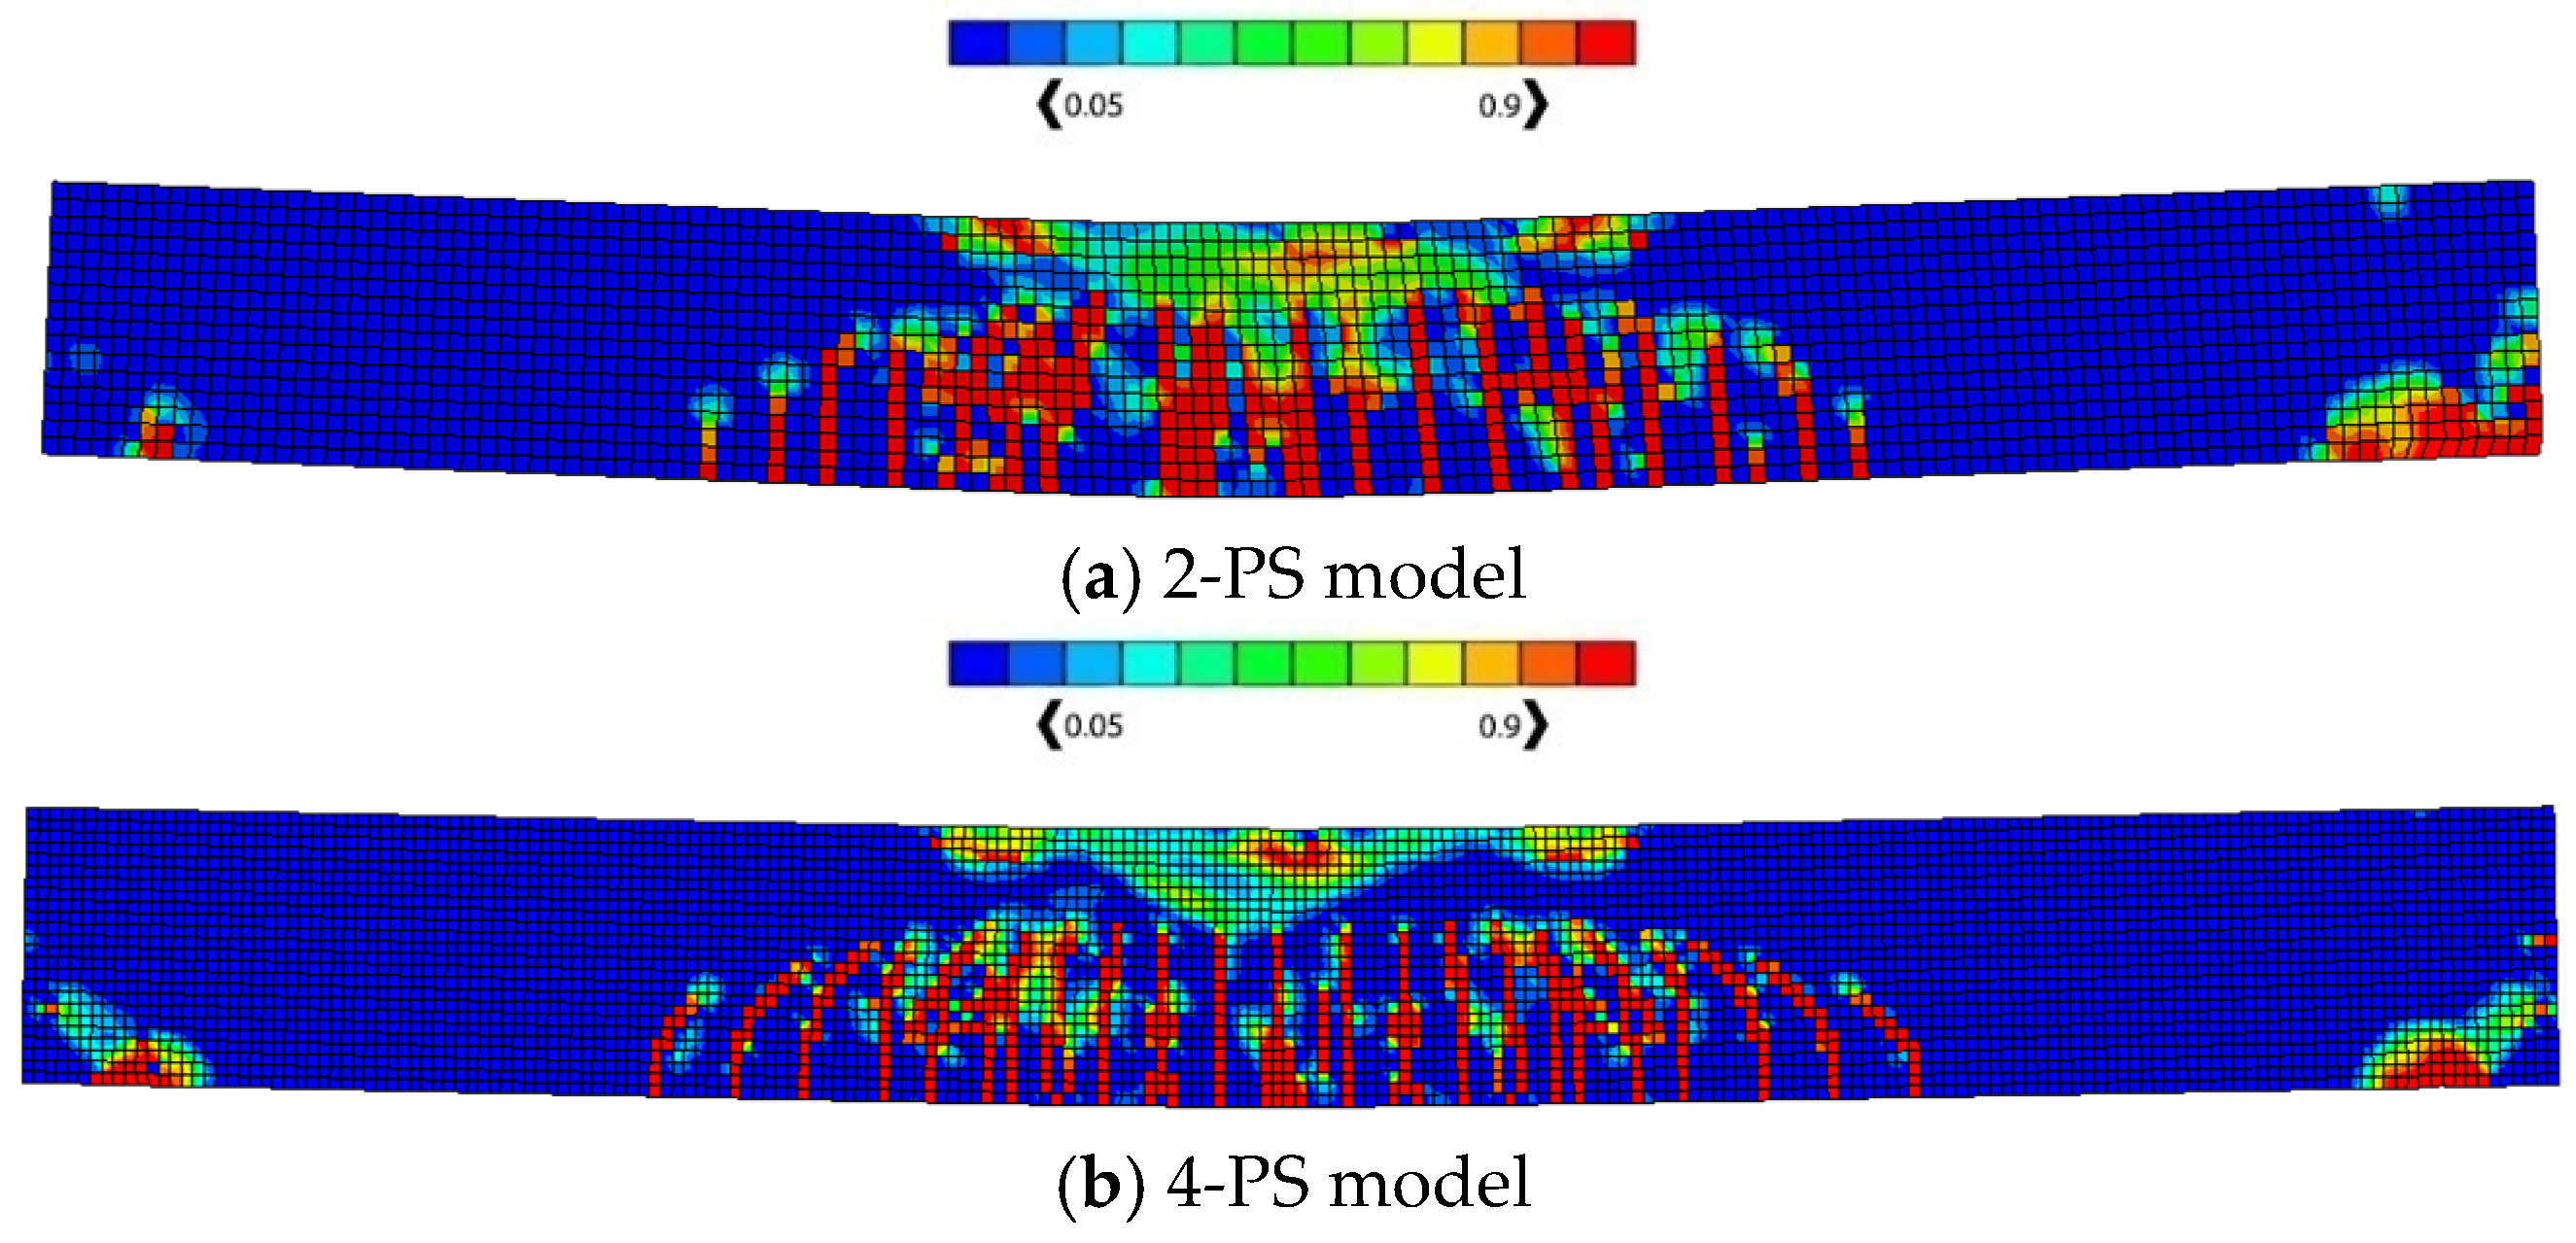
4.2. Results and Discussion of the Application of the Optimization Problem

In this section, the optimization results of four different prestressed models (1-PS, 2-PS, 3-PS, and 4-PS) are illustrated, and it is worth mentioning that prestressed tendons are the only yielded steel inside these models, as they fail in flexure. Firstly, the optimization process was applied to the benchmarks (2-PS and 4-PS), acquiring the results shown in Figure 7, which displays the load response for the 2-PS and 4-PS models. From this figure, the behaviour of the curves can be observed, which are apparently similar in that they are vertical at the beginning and then they begin to bend to produce an almost horizontal line; moreover, the two curves show the same relationship based on the fact that an increase in the permissible energy W p 0 leads to a rise in the corresponding produced load. In contrast to this similarity, there are differences in the values of the produced loads in each model, wherein, in the case of the 2-PS model, the curve begins to take the direction of the horizontal line with loads less than their counterpart in the 4-PS model. This can be explained by the fact that the 4-PS model contains a larger number of tendons so that the damages resulting from the internal stresses generated inside them are delayed in formation and accumulate more slowly compared to the other model. Thus, if a specific value of permissible energy W p 0 is selected, the corresponding load will be less in the case of 2-PS than in the case of 4-PS, which means that the yielded elements accumulate more in the first model, causing faster failure under a lower load. Moreover, this behaviour of the curves reflects the models passing through the stages of elastic, elasto-plastic, and then plastic and failure states, such that when the value of permissible energy is almost zero, a reflection of a general elastic behaviour is produced within the limits of the initial loads; however, with an increase in this value, the curves begin to take a path that leads to the plastic behaviour, passing through the elasto-plastic state where the behaviour of these curves continues in the horizontal form till the failure of the model.
For more clarification, Table 1 and Table 2 show some cases to elicit the effect of having different permissible energy values W p 0 on the load value, concrete damage intensity, and steel stress intensity for both the 2-PS and 4-PS models, where the third column has models showing the left side representing concrete damage intensity and the right side showing the steel stress intensity. By comparing, we can see that the red areas, which represent high-stress intensity in steel and damaged areas in concrete, increase as the entered permissible energy value W p 0 increases where the colours range from blue, representing low-stress/damage intensity in models, to red, representing high-stress/damage intensity in models. Moreover, it is noticeable that the cracked, damaged areas in concrete do not show huge differences as W p 0 increases due to the small increment in the corresponding loading values, but the stress intensity in steel develops more clearly, reflecting the case of close failure. Finally, having such effects proves the efficacy of the complementary strain energy as a plasticity controller, which enables the prediction and control of the plastic failure behaviour of the structures.
On the other hand, the optimization results of the derived models (1-PS and 3-PS) are obtained and illustrated in Figure 8, where this bar chart shows a general comparison between all models (1-PS, 2-PS, 3-PS, and 4-PS) in order to understand the effects different tendon numbers have on the models’ behaviour, where it can be noticed that increasing the number of the prestressed tendons produces higher load values for lower W p 0 . Such results happen due to the strengthening added by increasing the number of the prestressed tendons, where increasing the number of these tendons increases the required load, causing the yield inside the steel elements; therefore, the corresponding W p 0 value, which depends on the number and value of the yielded steel elements, decreases too.

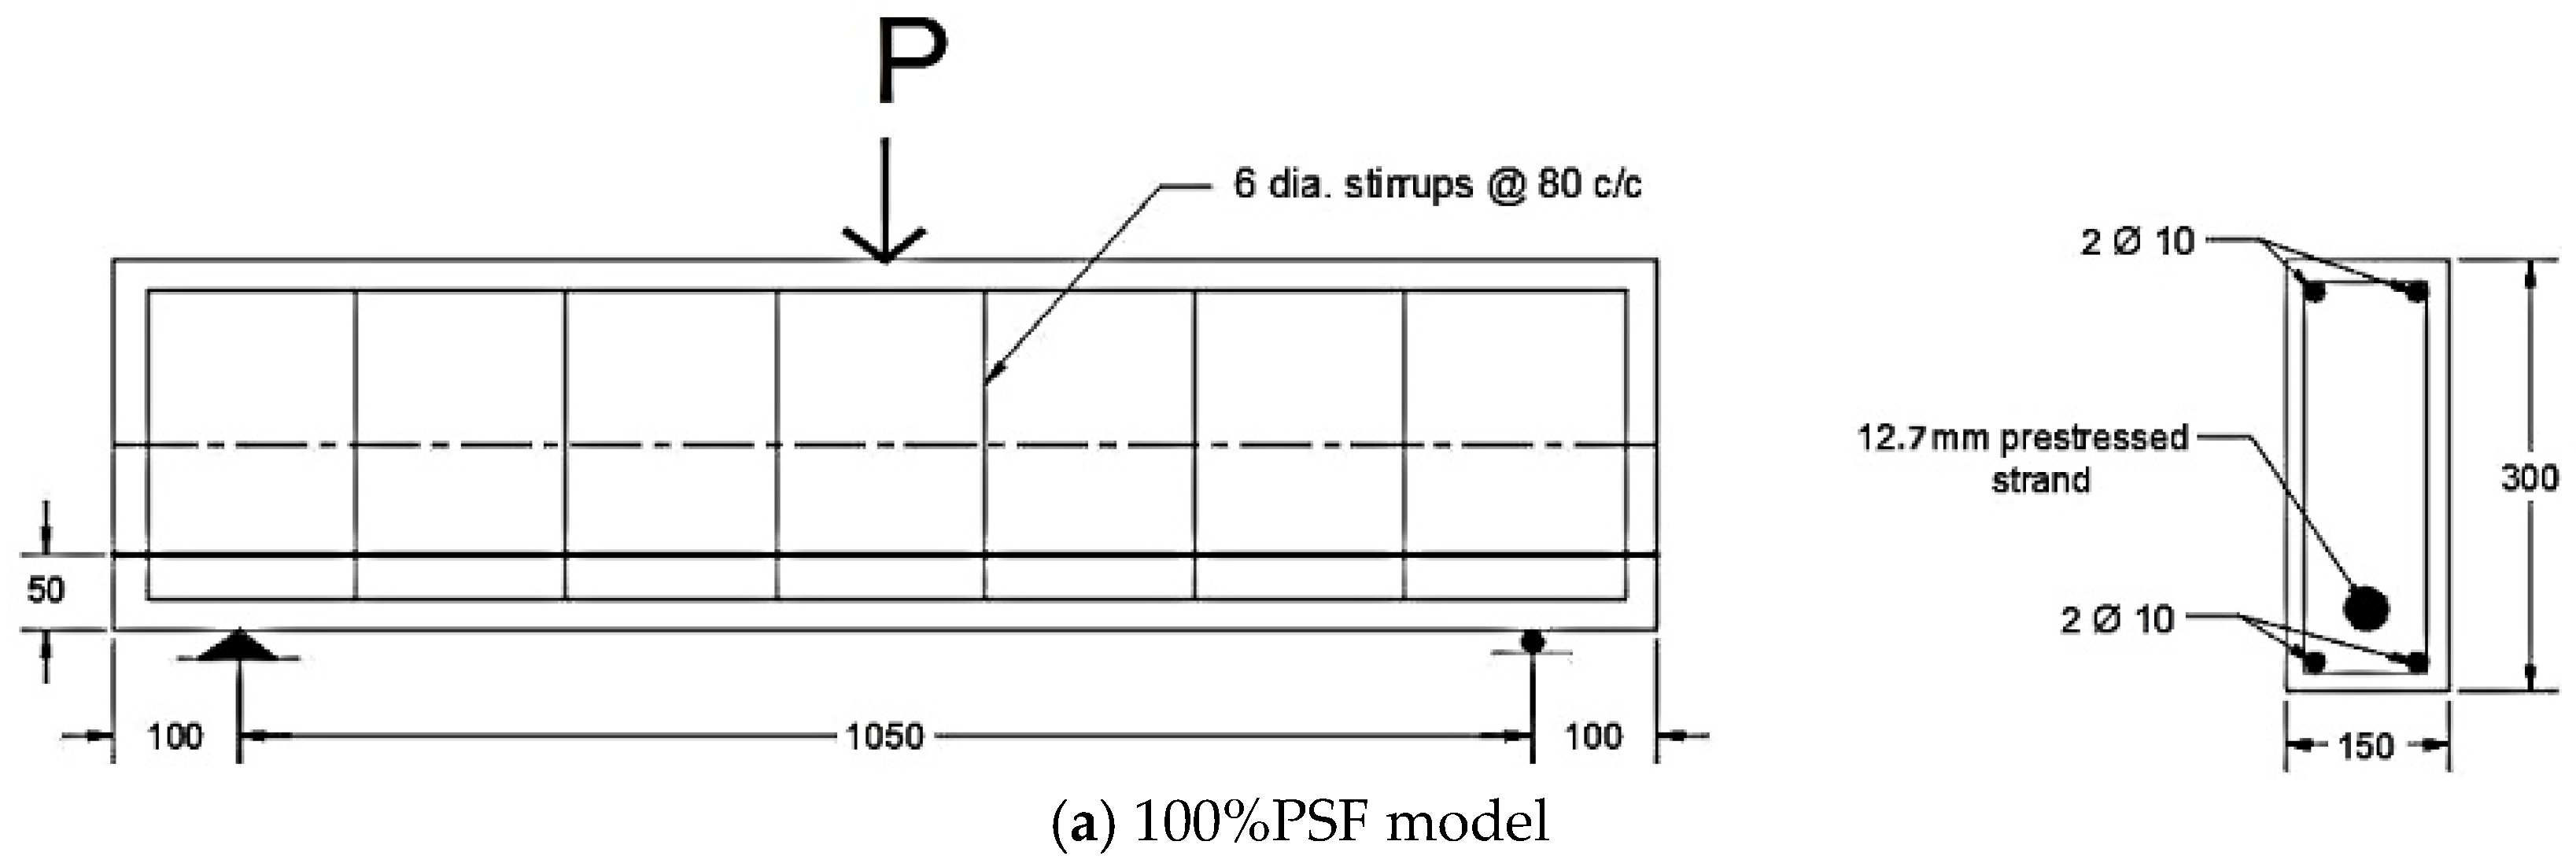
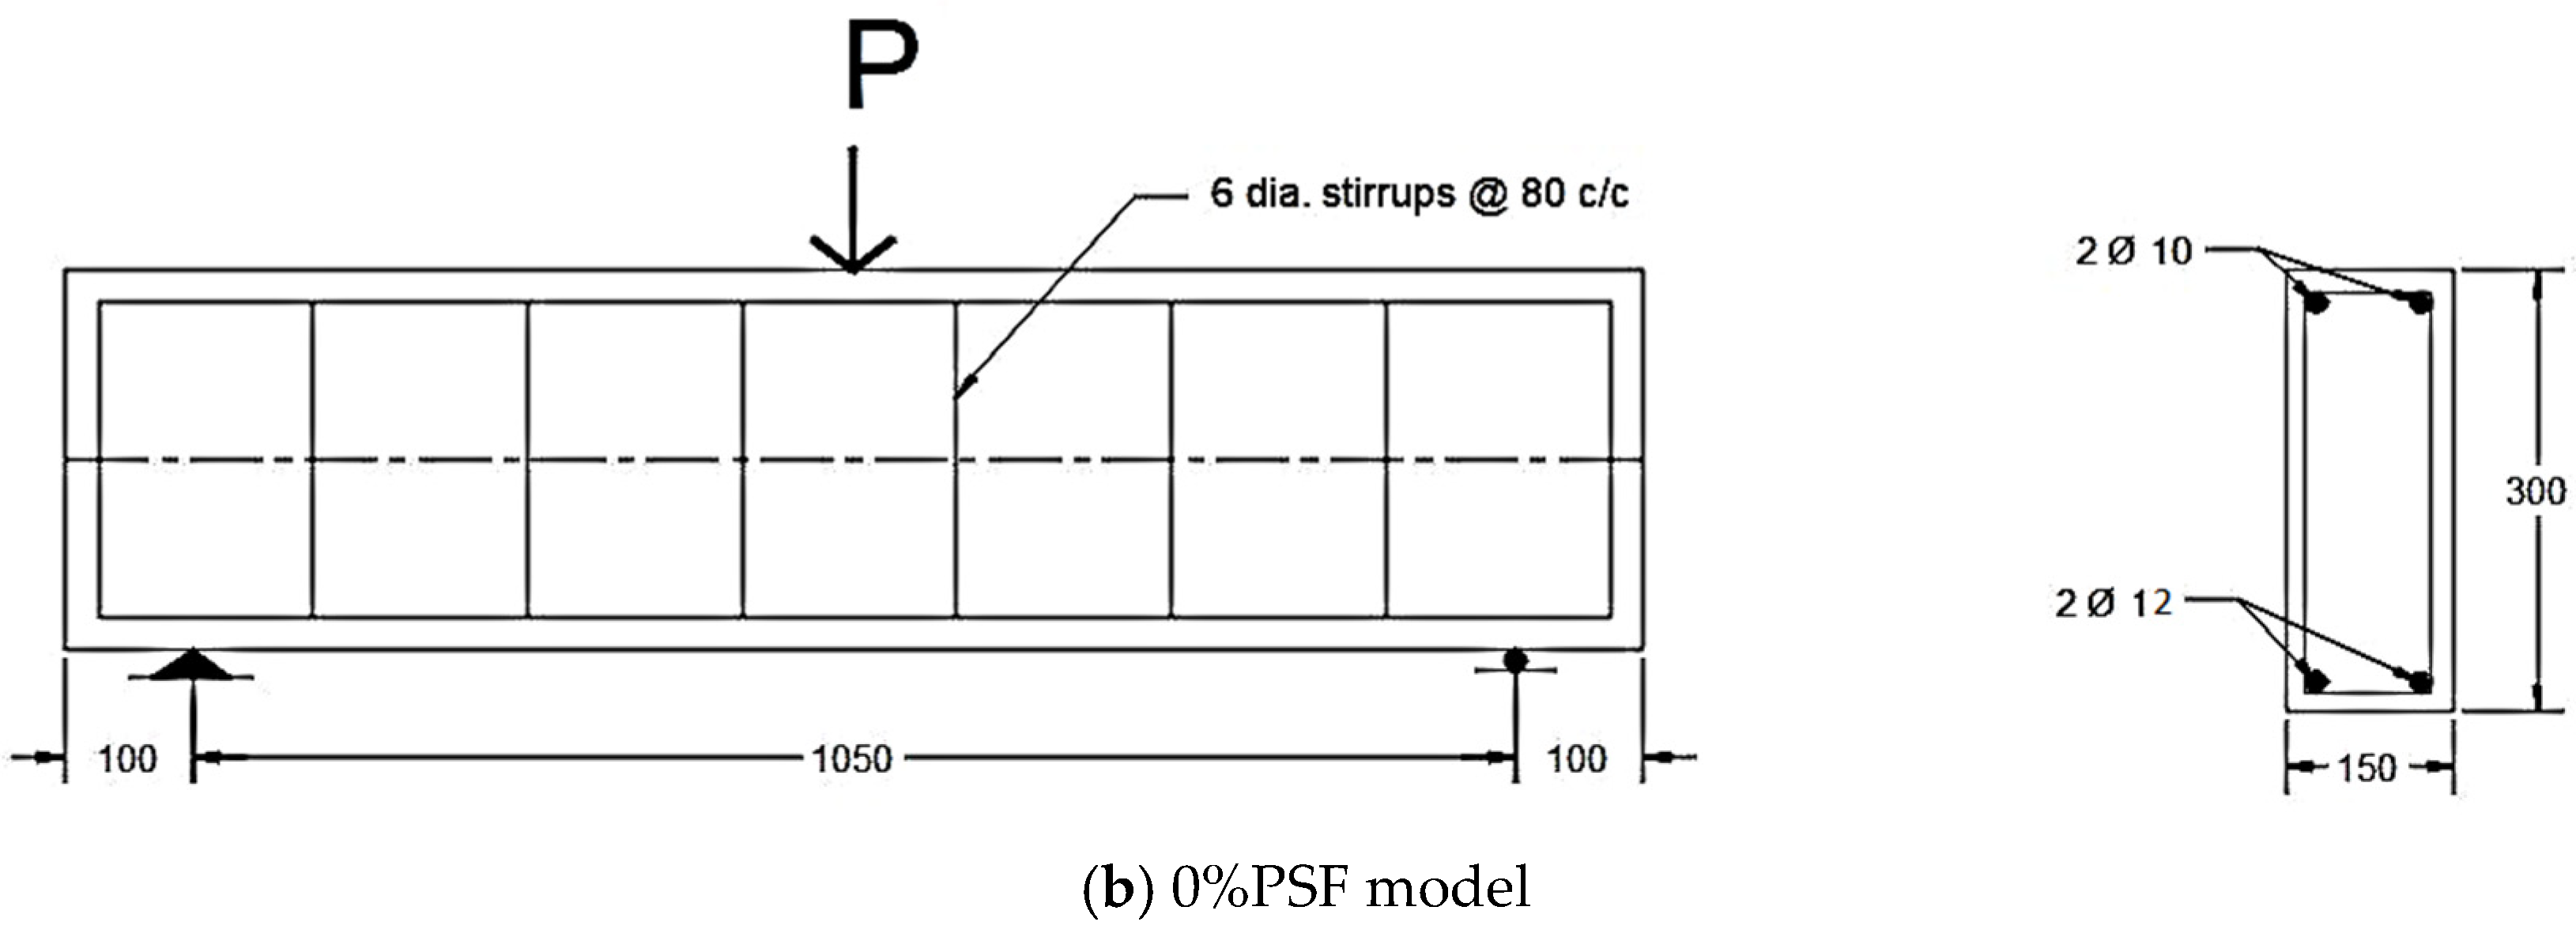
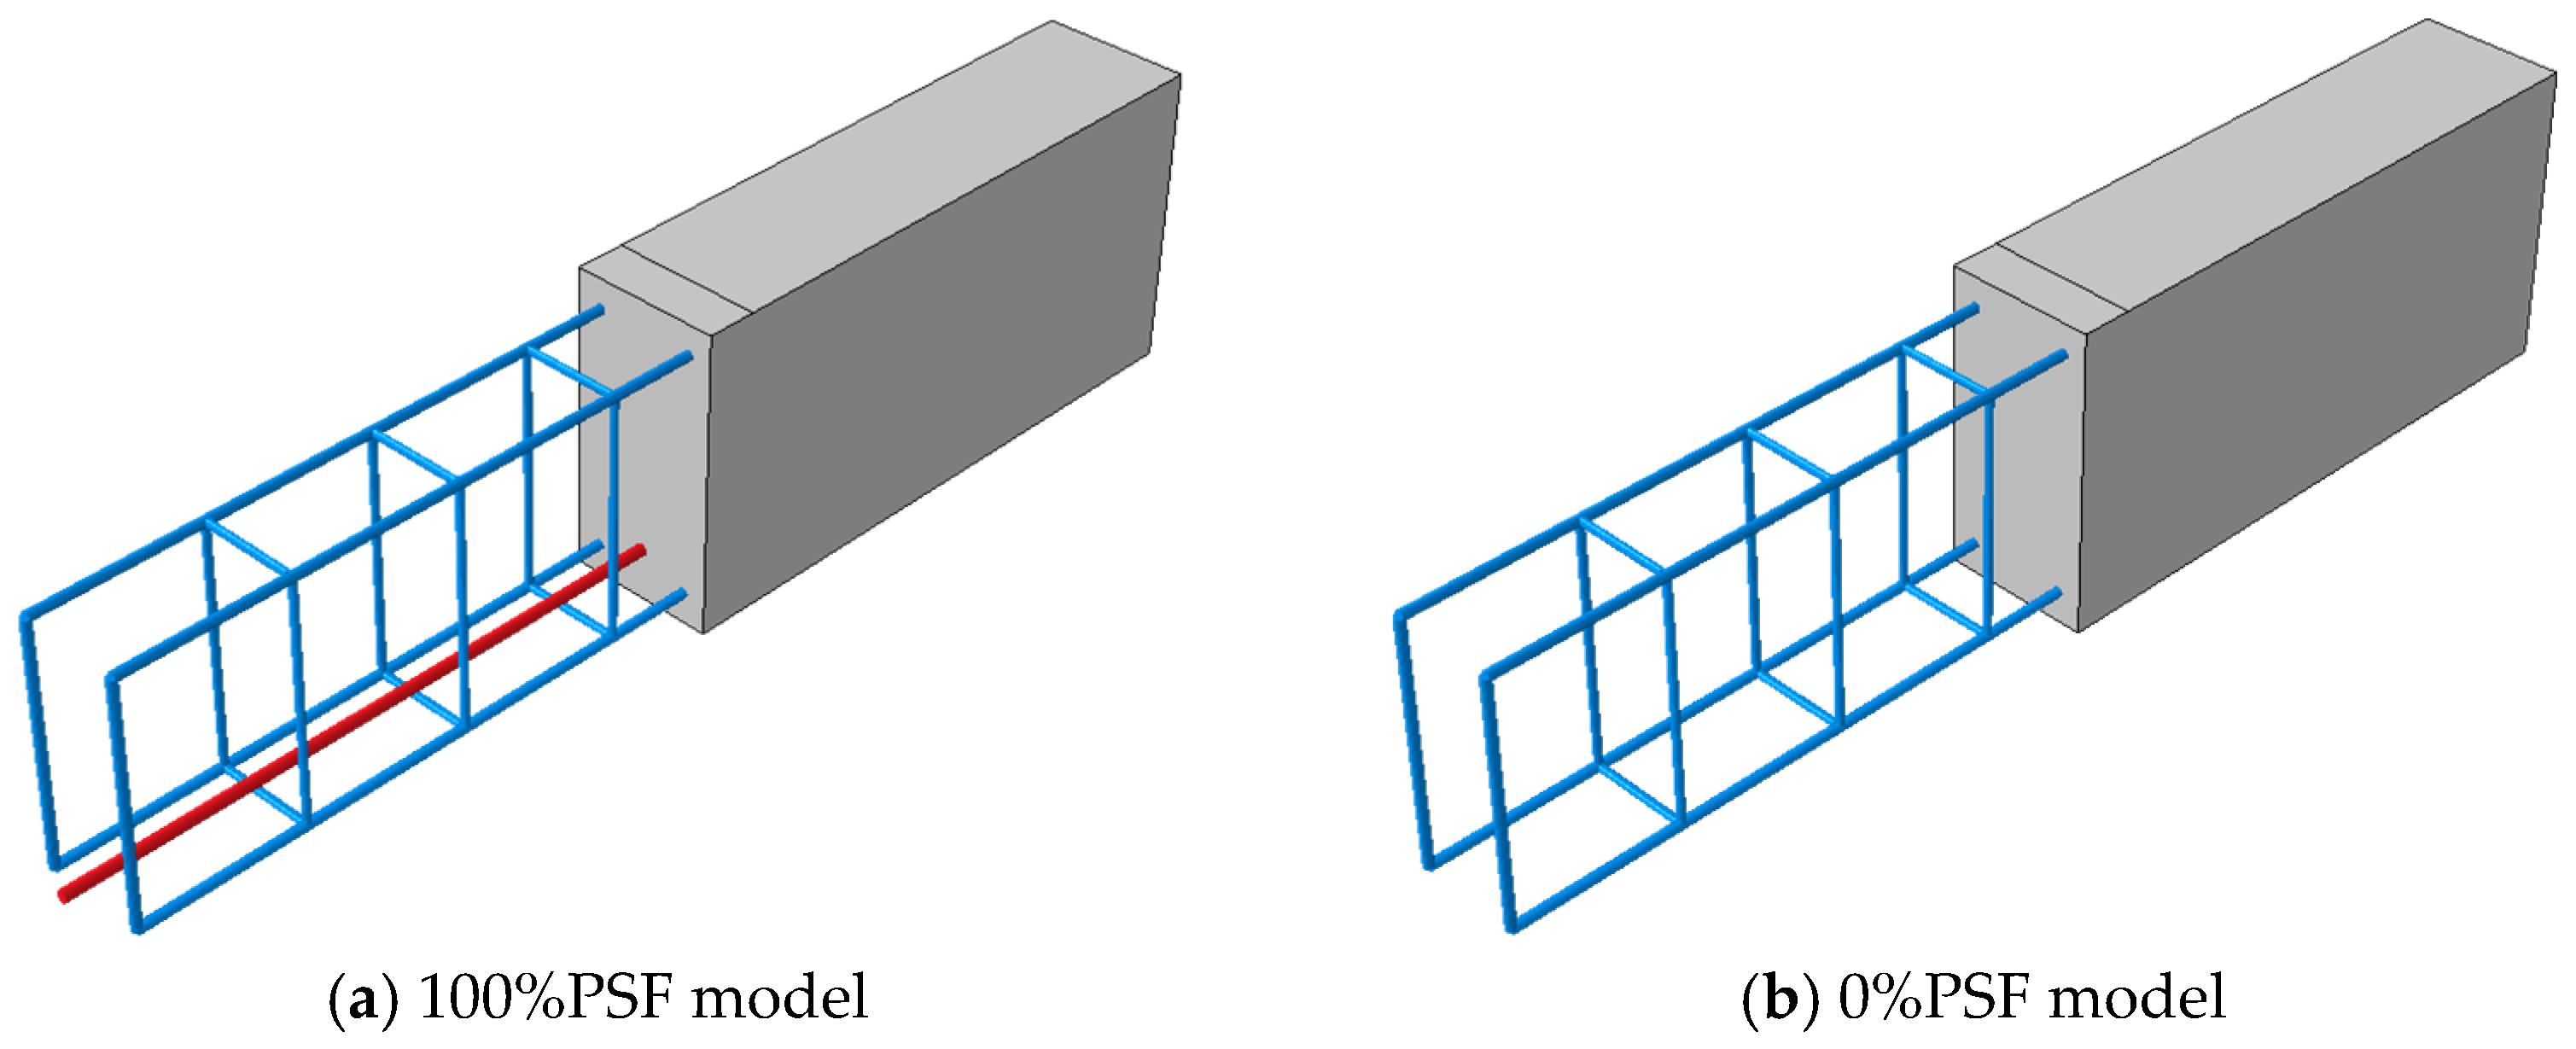
5. Models with Different Prestressing Forces

5.1. Numerical Modelling of the Benchmarks

In this section, the second set of benchmarks is considered in order to study the effect of prestressing existence and the effect of prestressing force level. The overall width, depth, and length of the two selected beams are 150 mm, 300 mm, and 1250 mm, as described by Badawy et al. [4]. The beams also share the same shear reinforcement, material properties, and dimensions. The beams were simply supported with a clear span of 1050 mm; the stirrups were 8 mm diameter bars every 170 mm to prevent the possibility of shear failure; and the prestressing strand was covered by concrete at a thickness of 50 mm. One 12.7 mm prestressed tendon and two 10 mm steel bars were utilised to create the 100%PSF model depicted in Figure 9a. Secondly, two steel bars of 12 mm in diameter were used while no prestressed tendons were available, giving the 0%PSF model as shown in Figure 9b. These two models were calibrated using ABAQUS and the CDP model, as shown in Figure 10. The finite element model was composed of concrete and reinforcement materials, with the concrete represented by an eight-node solid element (C3D8: eight-node first-order hexahedral element with exact numerical integration) and the reinforcement bars represented by beam elements with a two-node linear beam in space (B31: Timoshenko beam). An embedded region was used to model the bond between the reinforcement and the concrete. The damage plasticity model was used in a finite element failure analysis to represent the non-linear behaviour of the beams. The concrete damage plasticity data consist of compressive crushing and tensile cracking as material failure mechanisms taken from study properties that provided the value of concrete having a compressive strength of 40 MPa, whereas these properties are inserted in ABAQUS to obtain the CDP parameters that reflect the required damage behaviour of the concrete. The prestress effect was applied to the selected tendons, while taking temperature type into account, using the predefined field effect. The boundary conditions were designed to meet the researchers’ supporting conditions. Additionally, to produce identical experimental circumstances, a vertical concentrated load was placed at each point load of the beam, and these loads were spread by utilising the coupling effect. Mesh size has an effect on numerical accuracy as well as computation time, and it was discovered that a mesh size of 25 offered the closest result values. After the simulation process that relied on the presented data, crack patterns and load–deflection responses were obtained for each model, as shown in Figure 11 and Figure 12, and these results are considered in good agreement with the experimental ones presented by the study. Similarly, Figure 11 clarifies the intensity of damaged areas in tension, which ranges by colour, as the blue represents the undamaged areas while the red represents the fully damaged areas, indicating the parts that may have the expected cracks, which cause the damage in concrete.
According to the selected study, the effective prestressed force passing through the tendon in the previous model (100%PSF) equals 74.4 kN, which is assumed to be the full force ratio. In addition to that model, and while keeping the number of tendons constant, the proportion of that force was modified to obtain three other models. Where 25% of this force was assumed to obtain the model (25%PSF) with an effective prestressed force equalling 18.6 kN, 50% was also considered to produce the model (50%PSF) with an effective prestressed force that equals 37.2 kN, and finally, 75% was taken into consideration to obtain the model (75%PSF), as the magnitude of the effective prestressed force passing inside the tendon equalled 55.8 kN. Thus, these prestressed models will be introduced into the optimization process to study the effect of changing the value of the prestressed force that passes inside the tendons on their behaviour.

5.2. Results and Discussion of the Application of the Optimization Problem

This section presents and discusses the optimization results of the second group of models. Firstly, the results of the two benchmarks with and without prestressed tendons (100%PSF and 0%PSF) are explained, and it is worth mentioning that in this part, prestressed tendons, stirrups, and longitudinal bars are yielded and considered in the optimization problem. The optimization results of these models are given in Figure 13, as it shows a comparison of load– W p 0 relationships for both 100%PSF and 0%PSF. According to that figure, it can be seen that the two curves have almost similar behaviour, revealing that an increase in the permissible energy W p 0 value causes an increase in the affiliated load values, referring to a state of higher plasticity being achieved. Obviously, as W p 0 was valued at zero, elastic behaviour controls for both models; nevertheless, the plastic behaviour starts to appear as the curves begin to gain higher load values, which are produced when considering higher W p 0 values, which push the curves to take a horizontal direction until the models’ failure. Furthermore, it is evident that the 0%PSF model produced lower load values than the 100%PSF model if compared at a specific permissible energy W p 0 value; this could indicate that the steel used in the 0%PSF model undergoes higher stresses under lower loads if compared with the other model, and this can reflect the general damage behaviour of the beams, as higher formed stresses inside the steel indicate higher damages transferring in the beam parts. On the other hand, using a prestressed tendon in the 100%PSF model reinforced the beam and delayed the appearance of the stresses inside the steel elements; thus, smaller W p 0 values produced higher load values, which can occur because the process of having yielded elements, in this case, requires higher loads to be achieved.
Additionally, Table 3 and Table 4 represent models having different W p 0 values, aiming to observe the effect of W p 0 on the load value and the concrete tension damage/stress intensity of the steel for both the 100%PSF and 0%PSF models, where the third column contains models showing the left side representing concrete damage intensity and the right side showing the steel stress intensity. Obviously, and by comparing, it can be realized that the red areas, which indicate high-stress/damage intensity, increase as the W p 0 value increases, where the colours range between blue (low-stress/damage intensity in models) and red (high-stress/damage intensity in models). Finally, having such effects confirms the effectiveness of the complementary strain energy as a plasticity constraint, which makes it possible to indicate and limit the plastic failure behaviour of the structures.
In addition, the optimization results of the derived models owning different prestressing forces (25%PSF, 50%PSF, and 75%PSF) are illustrated in Figure 14. This bar chart delivers a comparison between different models (25%PSF, 75%PSF, 50%PSF, and 100%PSF) where it can be detected that the results given in this figure seem somehow different if compared to the results presented in Figure 8, and this difference could be due to the presence of different types of steel bars that yield with the prestressed tendon. However, the assumed W p 0 value still produces higher loads when the prestressed force rate increases. Such results occur due to the strengthening added to the models by increasing the prestressing force inside the tendon, where raising this force would increase the required load, causing the yield inside the steel elements, and the corresponding W p 0 value, which depends on the number of the yielded elements, would also decrease accordingly.

6. Conclusions

Within the scope of this study, the optimal analysis problem of reinforced concrete beams with varying prestressing conditions was investigated. In order to accomplish this, an ABAQUS numerical validation technique was carried out to model the beams. In this procedure, the concrete damage plasticity (CDP) constitutive model was utilised to accurately describe the behaviour of the concrete that was used. As a result, an optimization problem was applied to maximise the plastic loading while the plastic deformations were controlled by making use of the complementary strain energy of the residual internal forces as a limitation; this procedure resulted in a number of conclusions, which can be summarised as follows:
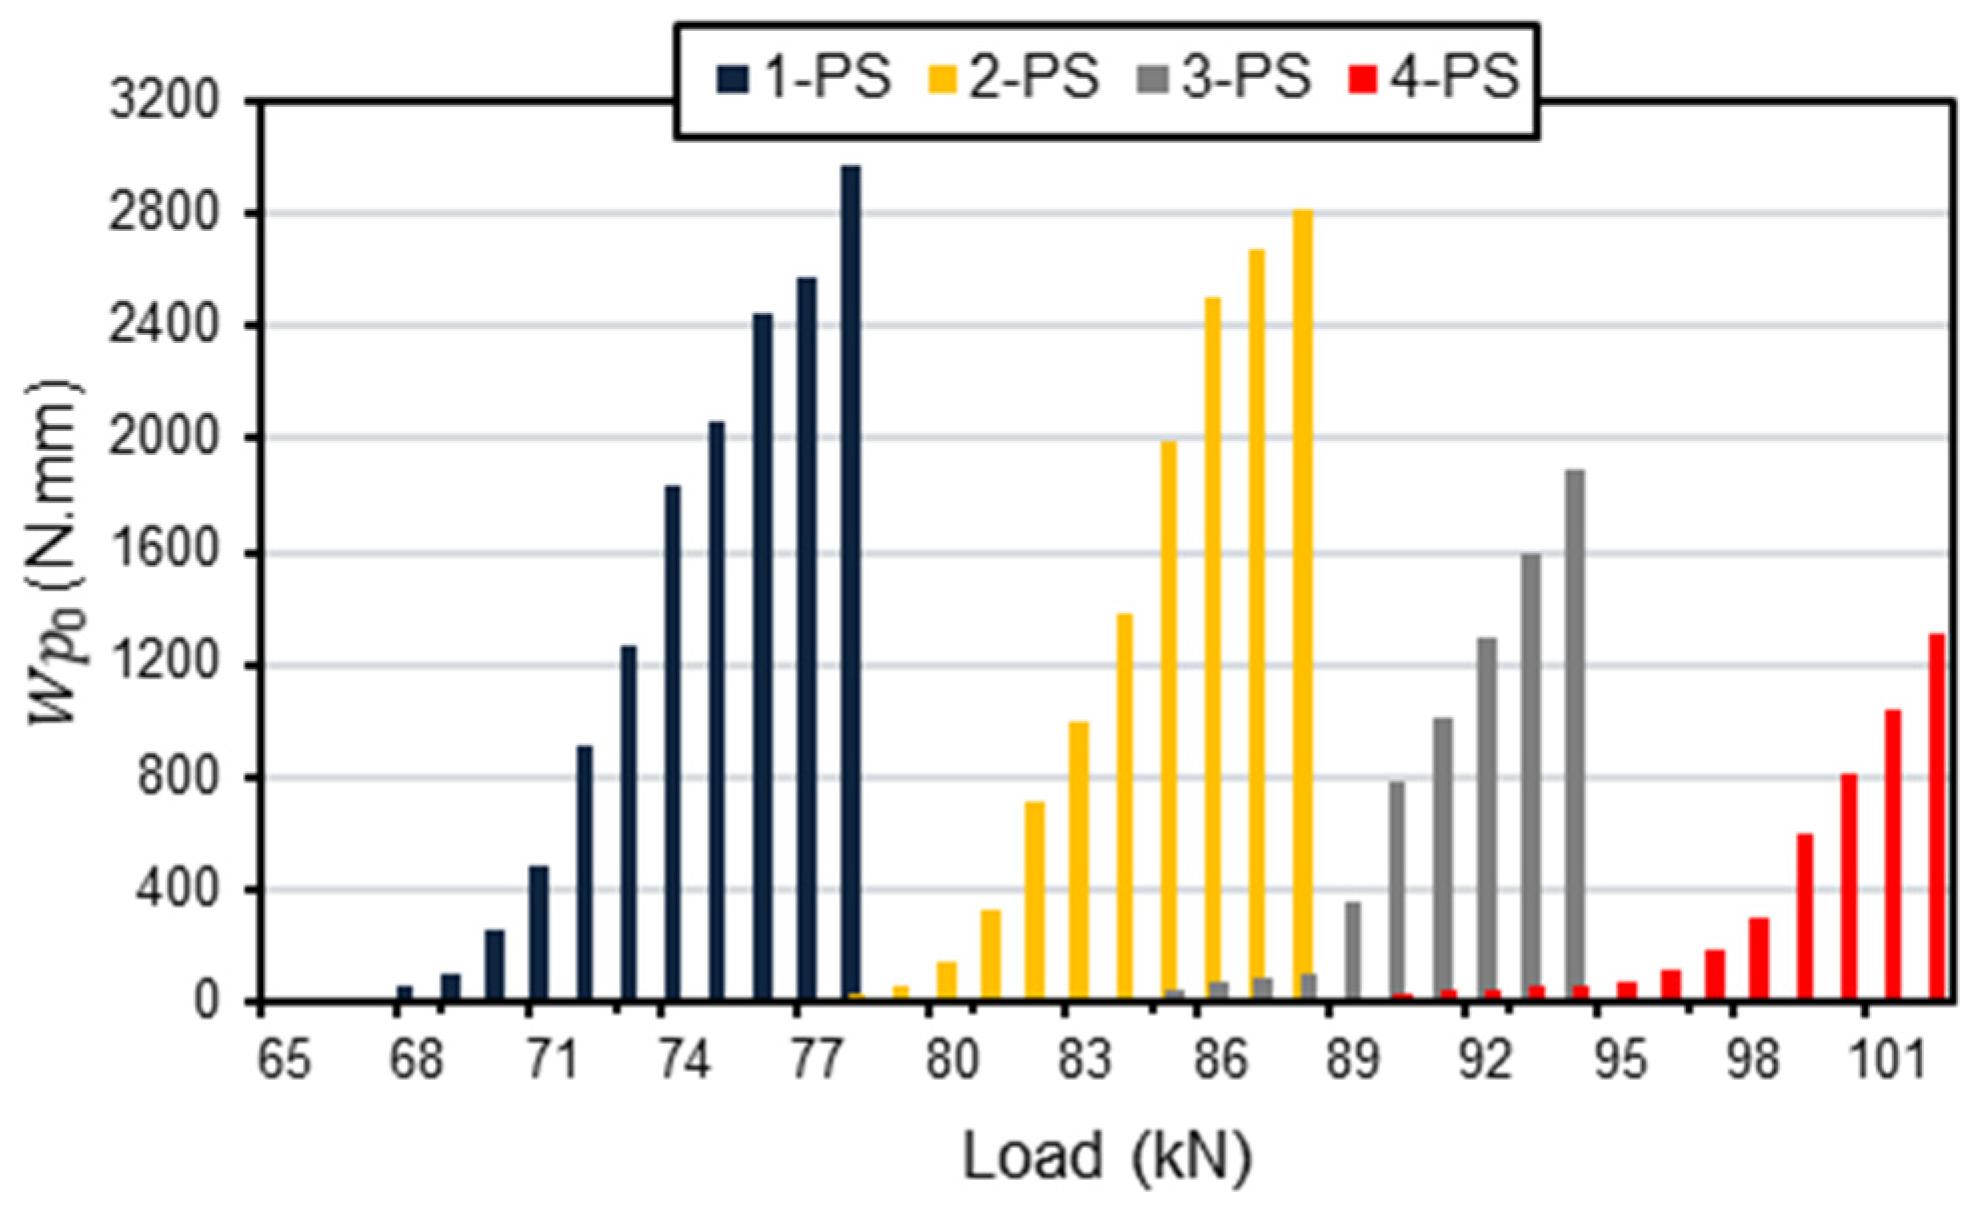
  • In most cases, an increase in the value of the allowable amount of energy will increase the corresponding loading values produced.
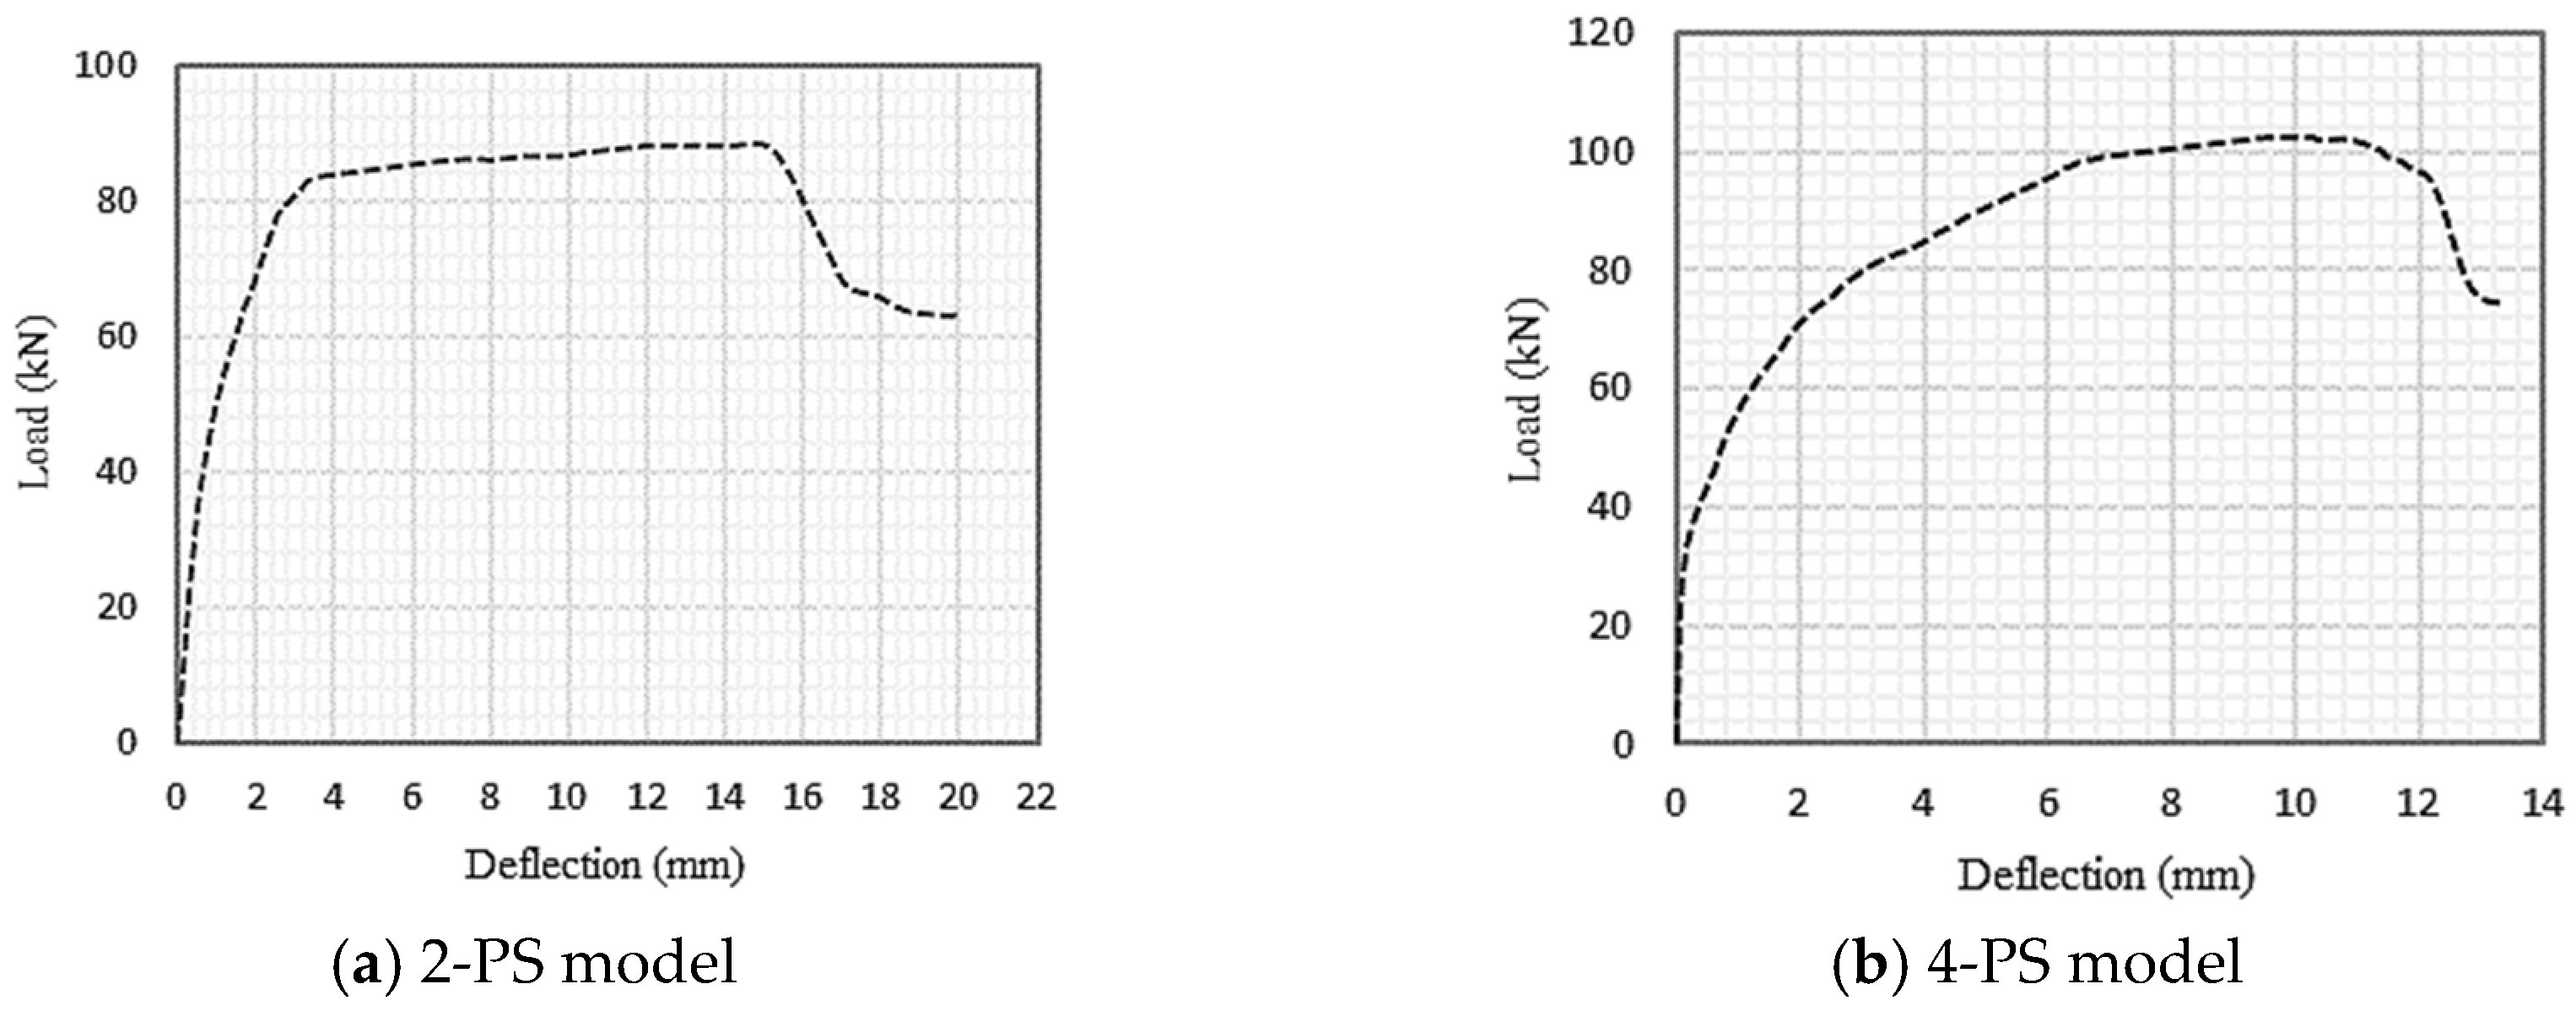
  • The load– W p 0 curve in the 2-PS model begins to take the direction of the horizontal line with lower loads than its counterpart in the 4-PS model, which can be explained by the fact that the 4-PS model contains more tendons, so the damages caused by internal stresses generated inside them are delayed in formation and accumulate more slowly compared to the other model.
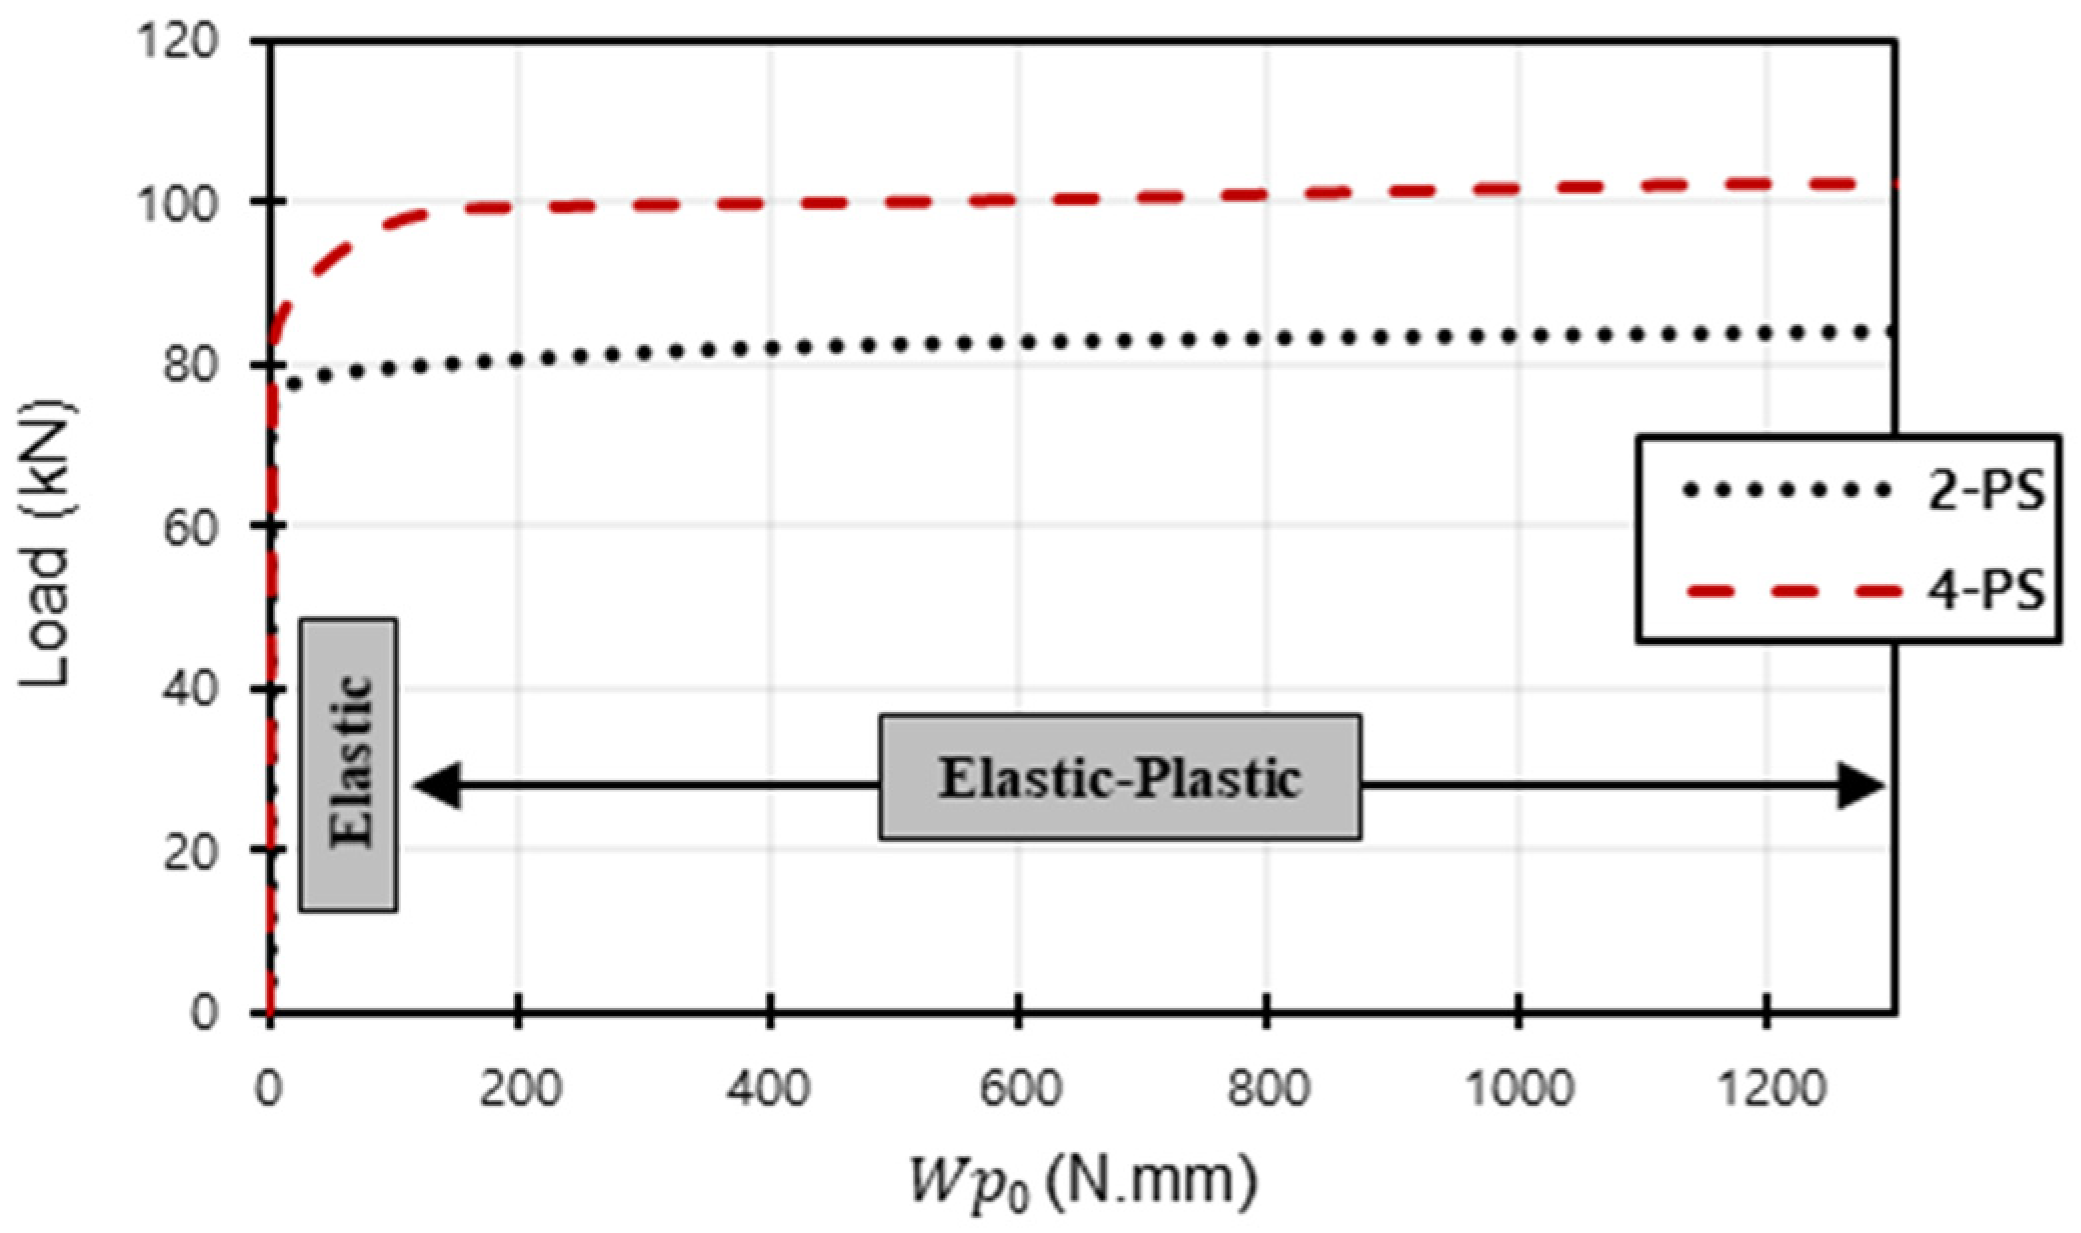
  • With a given value of allowed complementary strain energy, the corresponding load in the case of 2-PS will be smaller than in the case of 4-PS, implying that the yielded steel elements accumulate more in the first model, resulting in faster failure under lower loads.
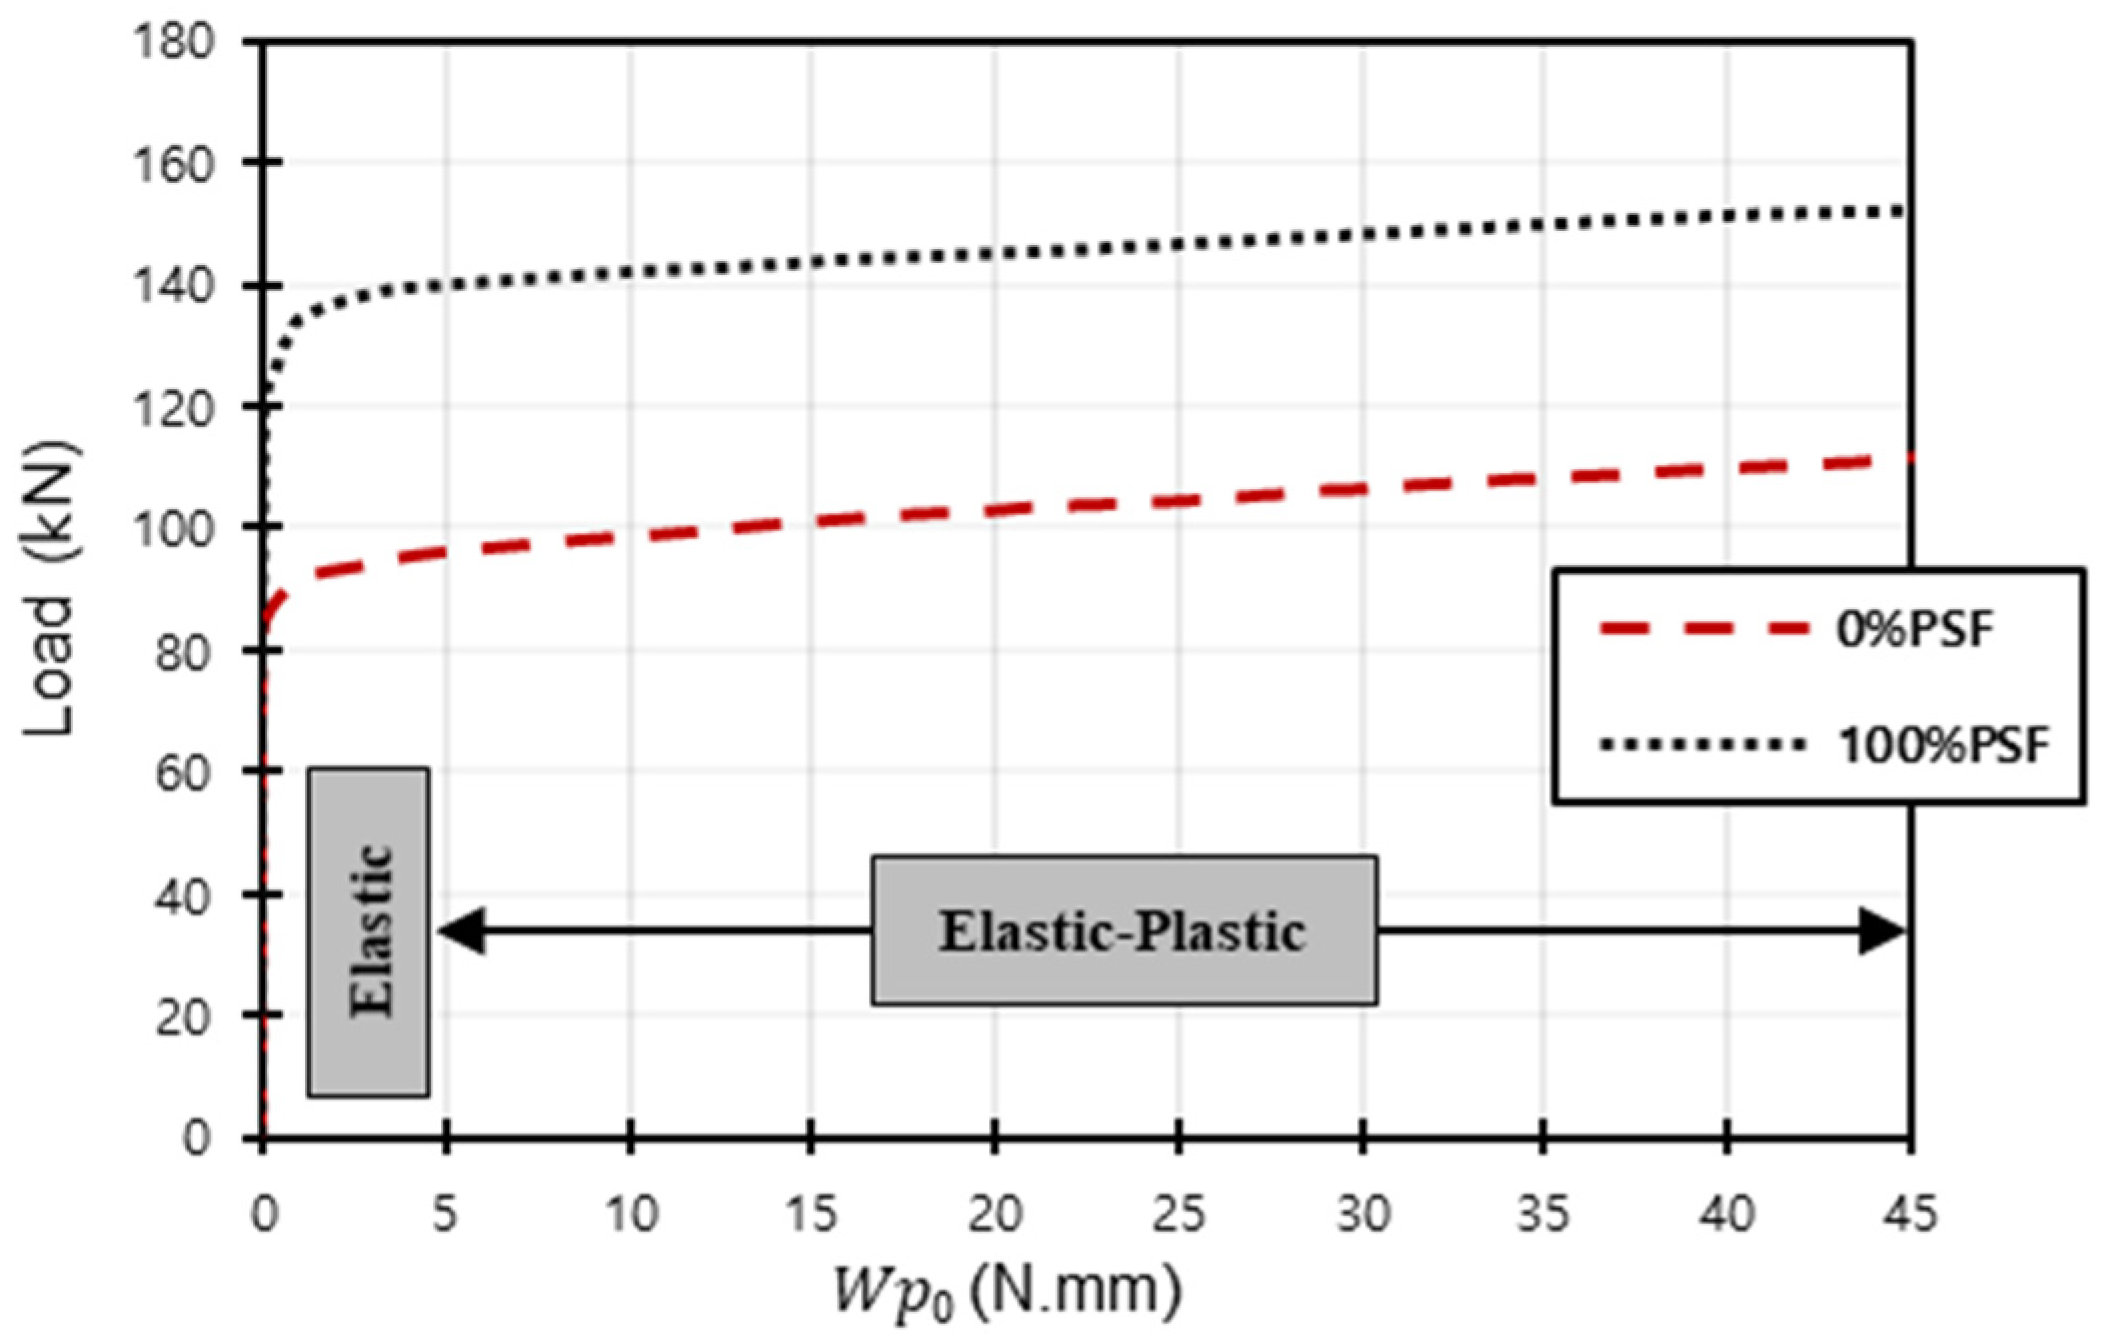
  • When the permissible complementary strain energy is almost zero, a reflection of general elastic behaviour is produced within the limits of the initial loads; however, as this value increases, the load– W p 0 curves begin to take a path that leads to plastic behaviour, passing through the elasto-plastic region.
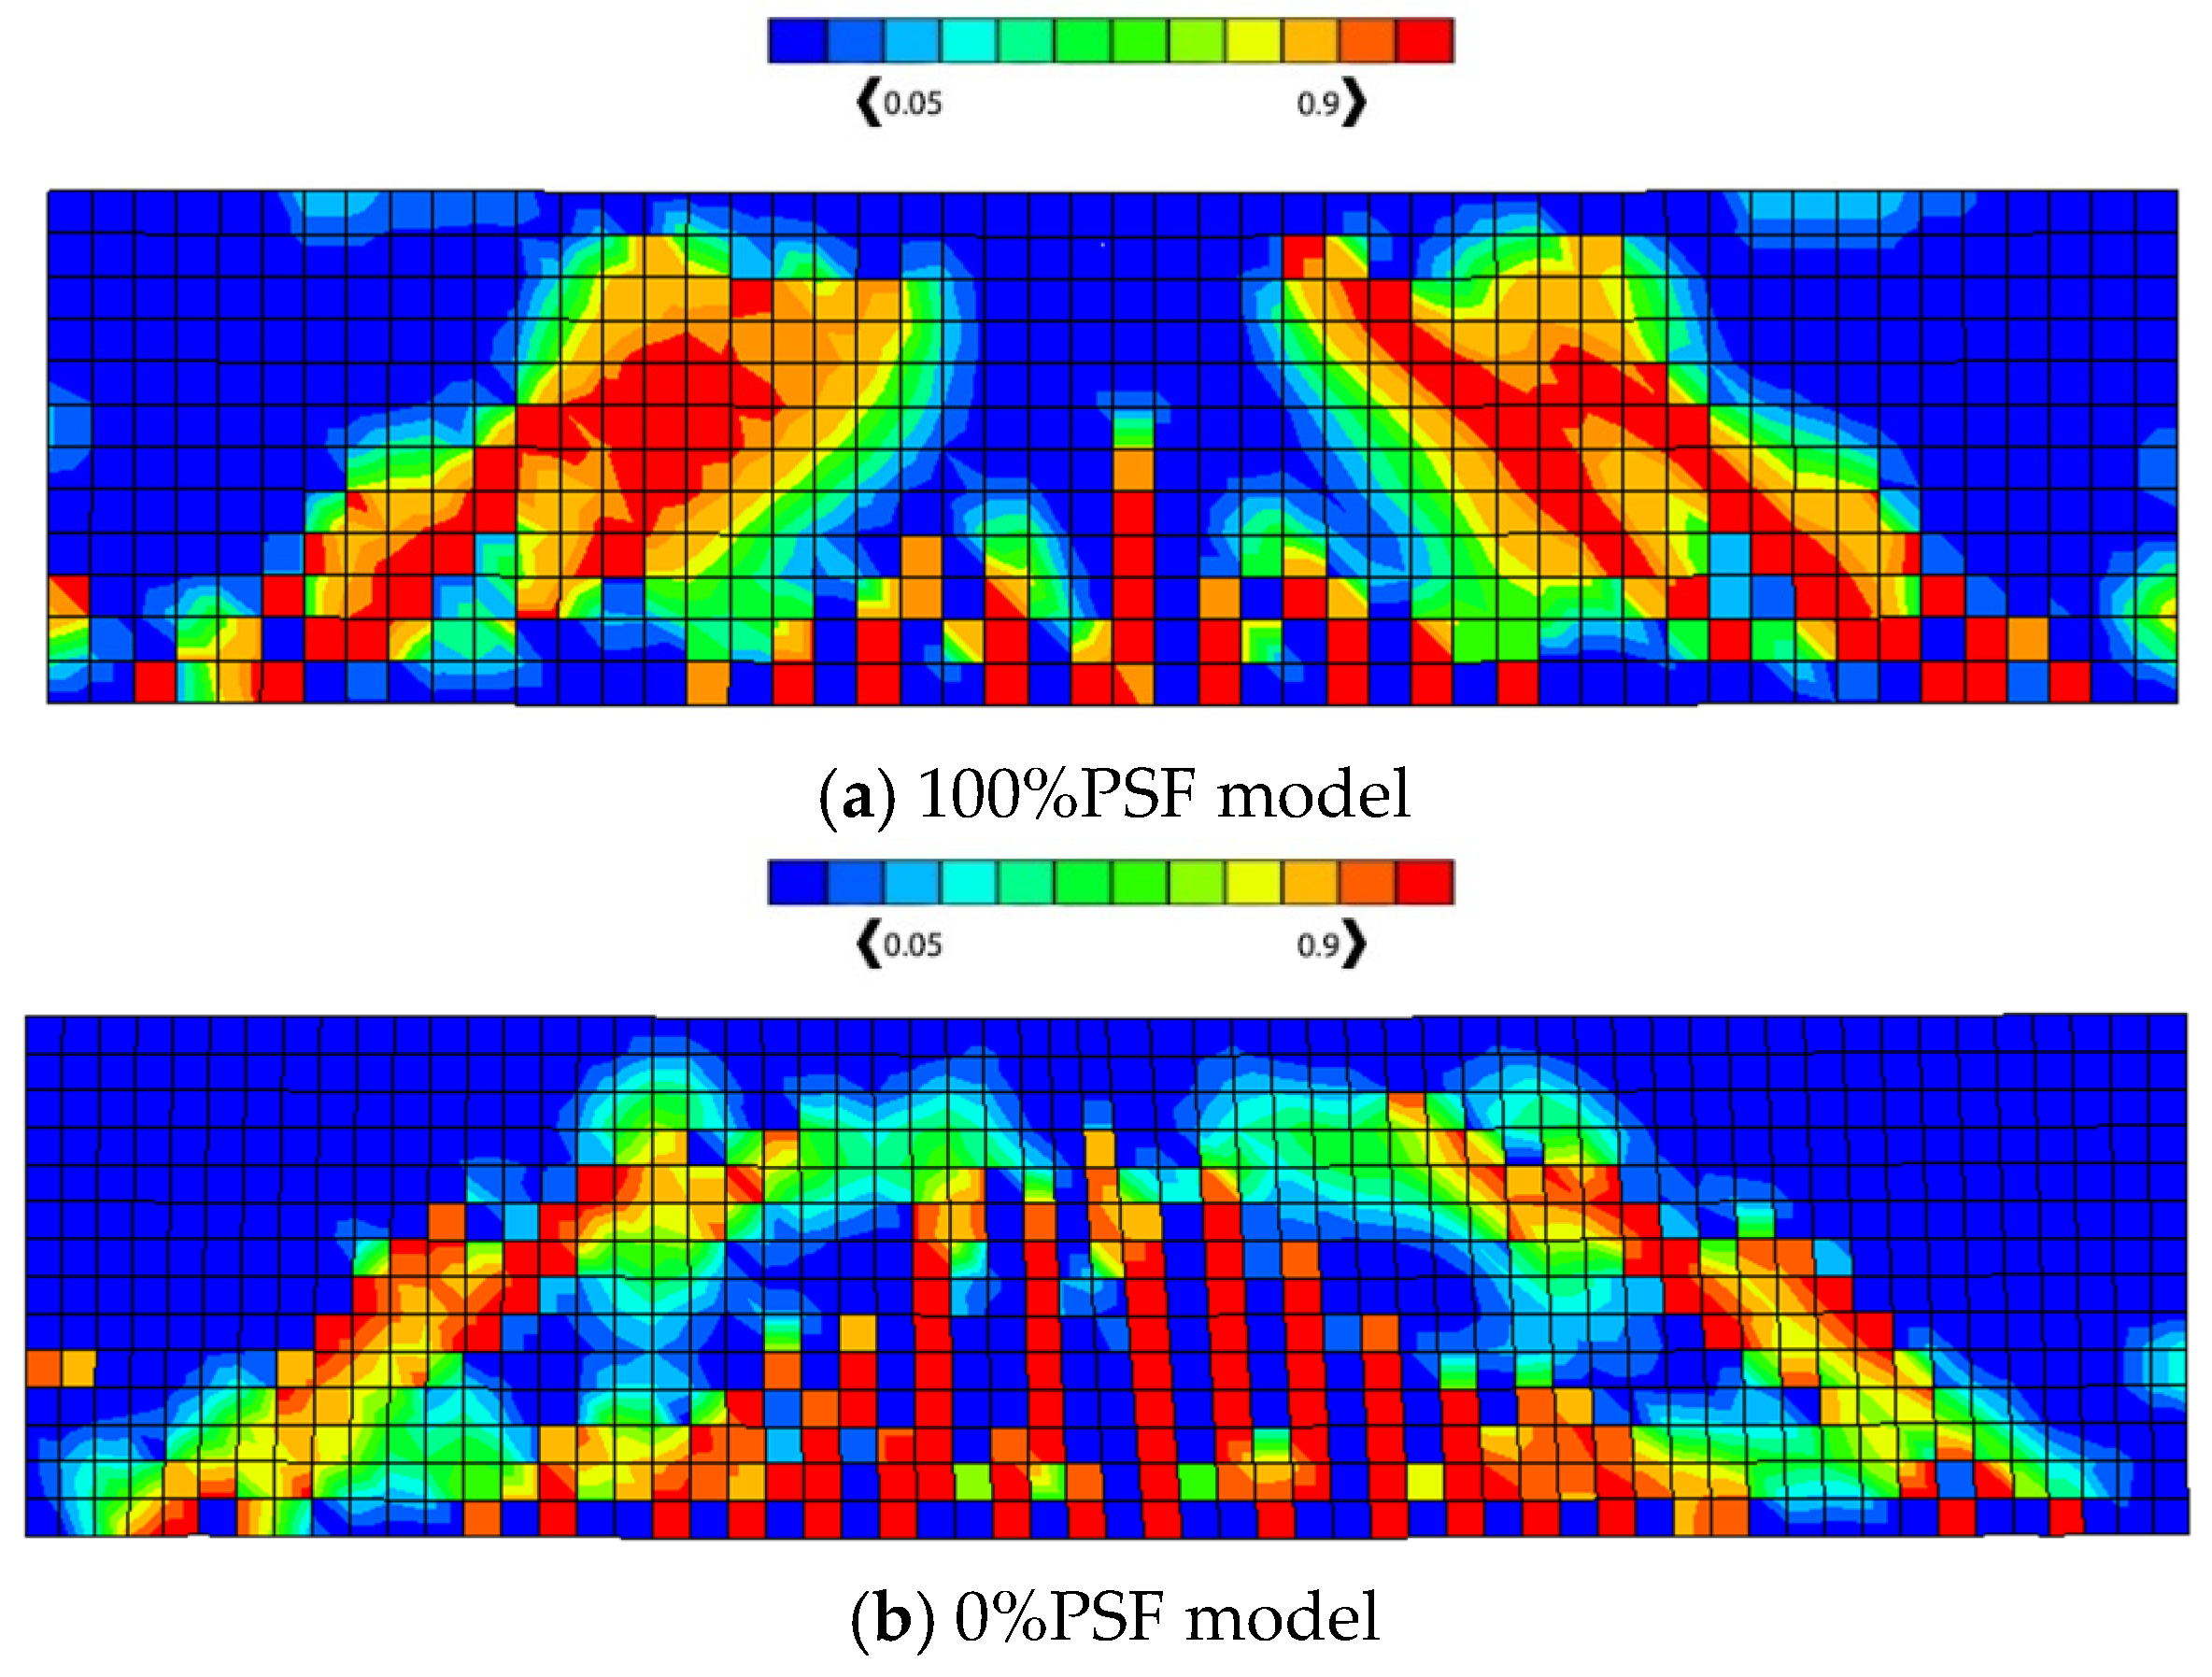
  • When the provided allowable complementary strain energy value grows, so does the damage caused by high-stress intensity in steel and tension-damaged areas in concrete.
  • Increasing the number of prestressed tendons results in higher load values for lower permissible complementary strain energy. This occurs as a result of the strengthening added by increasing the number of prestressed tendons, where increasing the number of these tendons would increase the required load to cause the yield inside the steel elements.
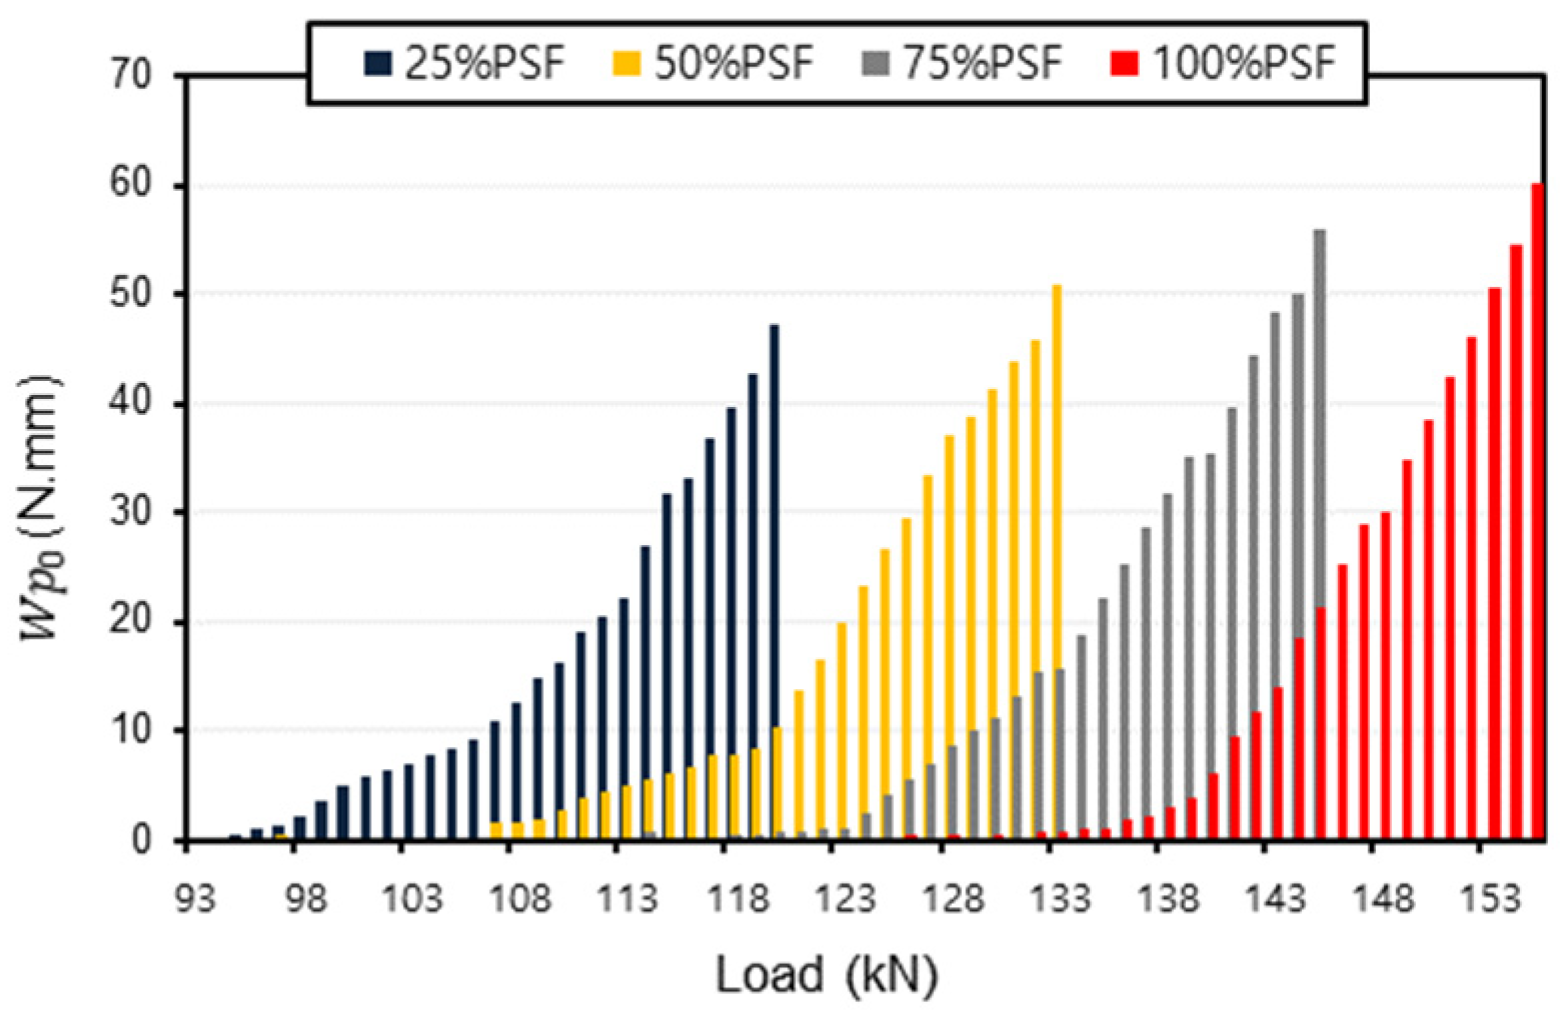
  • The allowable complementary strain energy value produces an increase in the associated load values, indicating that a higher plasticity state has been achieved.
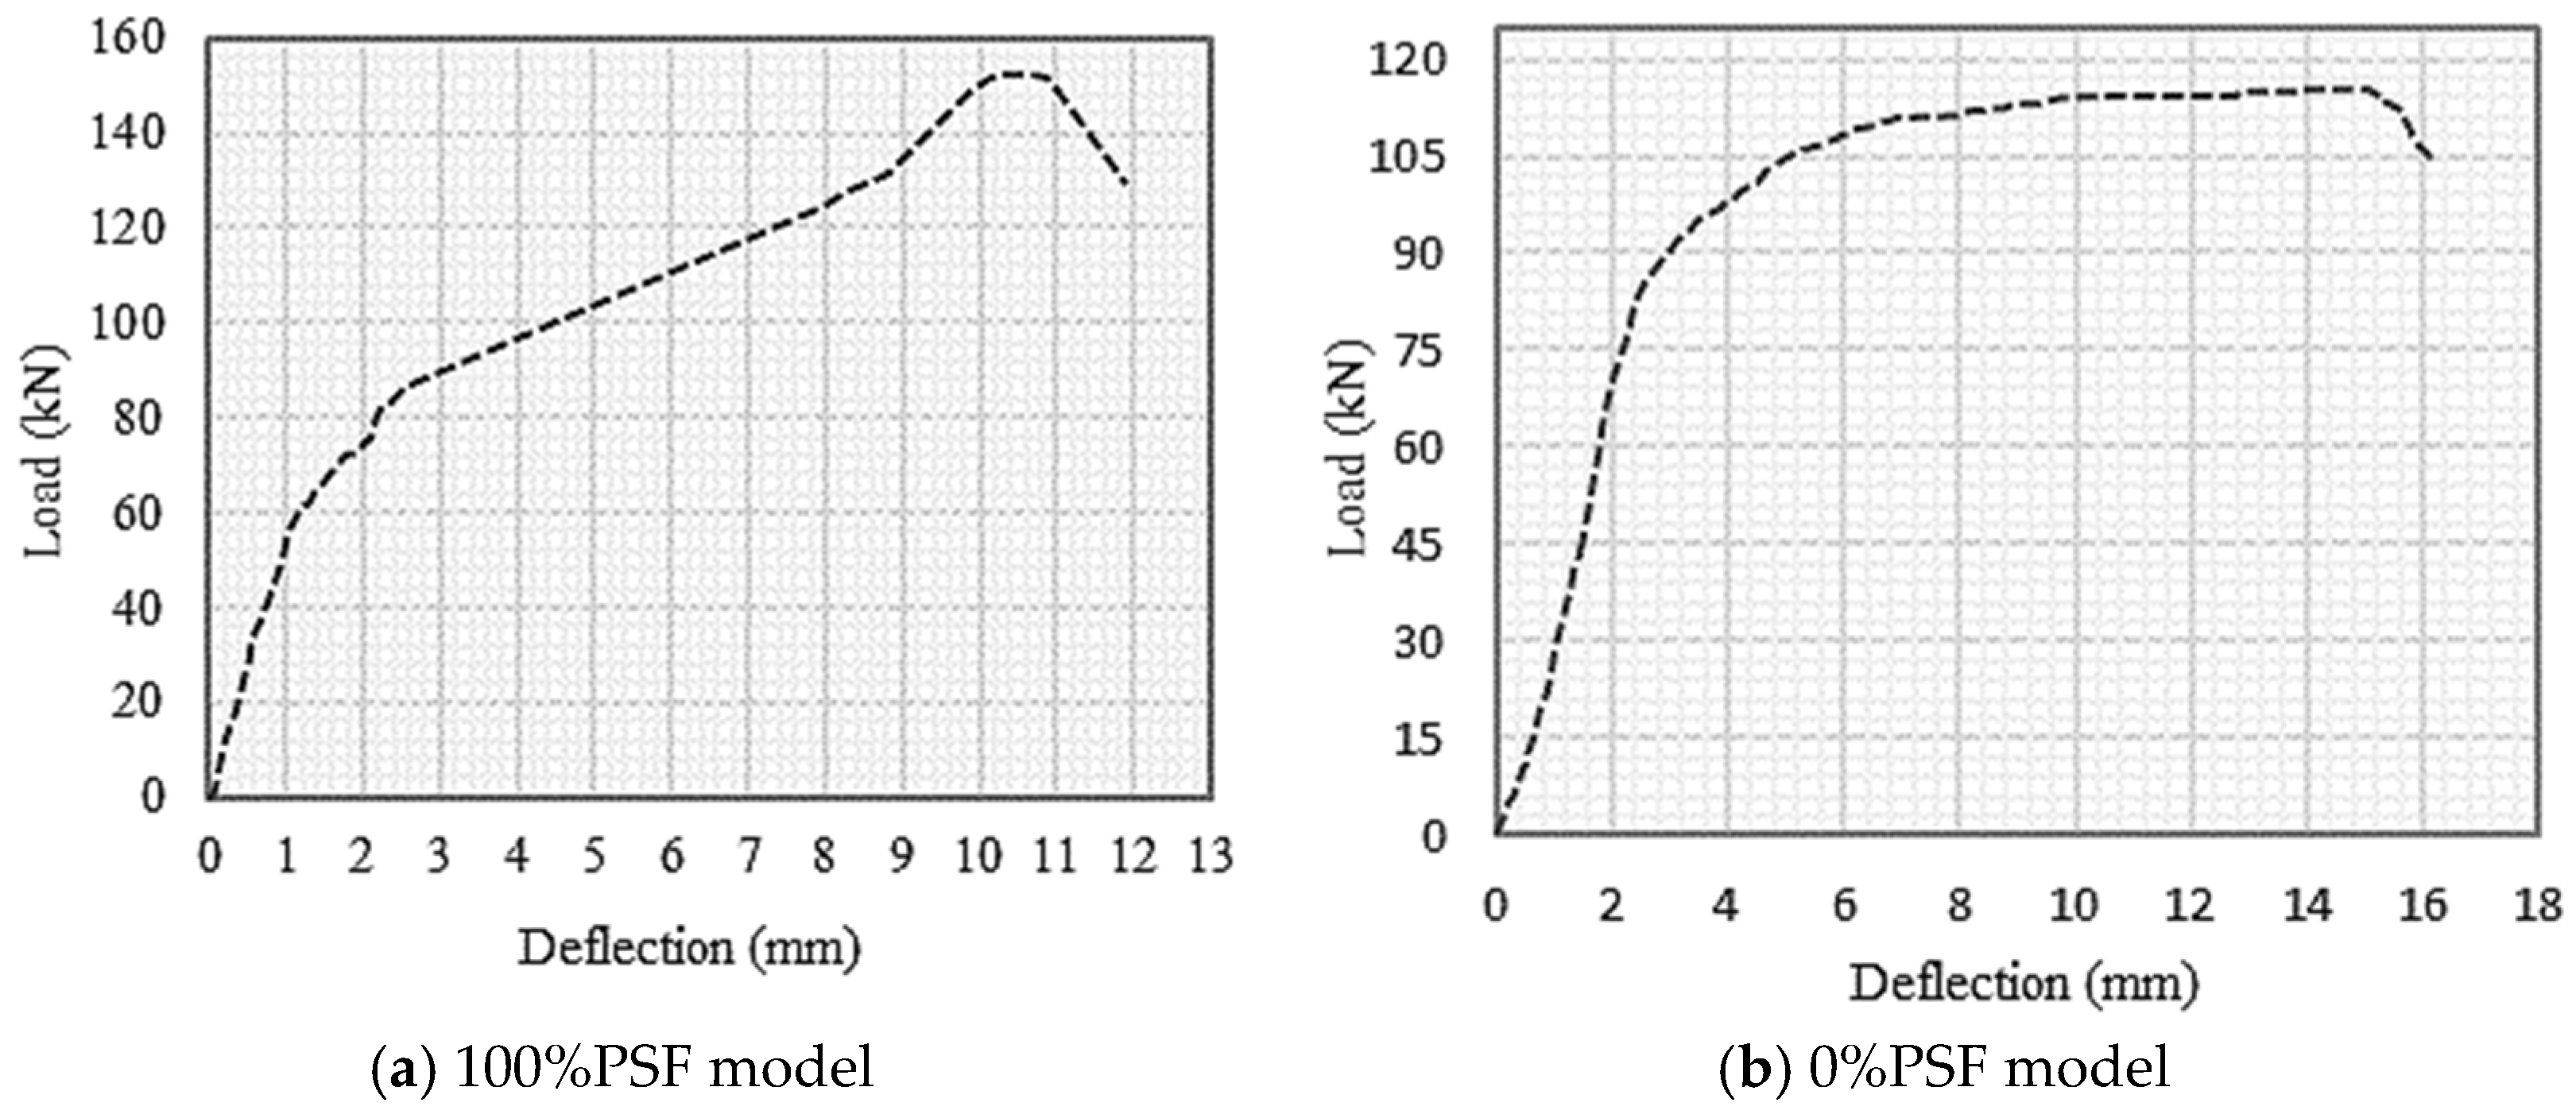
  • When compared to a specific allowable complementary strain energy value, the 0%PSF model provides lower load values than the 100%PSF model. This may suggest that the steel used in the 0%PSF model experiences higher stresses under lower loads, which may reflect the general damage behaviour of the beams.
  • The use of prestressed tendons in a 100%PSF model strengthened the beam and postponed the initiation of stresses within the steel elements, leading to higher load values and a smaller allowable complementary strain energy value. This is because the process of having yielded steel elements necessitates higher loads.
  • Increasing the prestressing force inside the tendon strengthens the models, leading to an increase in the assumed allowable complementary strain energy value, which in turn leads to an increase in the load necessary to cause yield within the steel elements and a corresponding decrease in the corresponding allowable complementary strain energy value, which depends on the number of yielded elements.
Since complementary strain energy is successfully employed in various types of structures, and in this study, it is used as a limitation of the structure’s failure, it is also important to note that the presented method is used for plastic analysis and design where residual stresses exist. Notwithstanding these constraints, many mechanical experimental testing methods and reinforced concrete structures can be explored for any future work.

Author Contributions

Conceptualization, methodology, and investigation were performed by S.K.I. and M.M.R.; writing—original draft preparation, S.K.I.; supervision, M.M.R.; all authors are involved in the final editing. All authors have read and agreed to the published version of the manuscript.

Funding

This research received no external funding.

Institutional Review Board Statement

Not applicable.

Data Availability Statement

The datasets that were generated and analysed during the current study are available in the main manuscript, and any additional details can be obtained from the authors.

Conflicts of Interest

The authors declare that they have no known competing financial interests or personal relationships that could have appeared to influence the work reported in this paper.

References

  1. Liu, Y.; Fan, Y. Experimental study on flexural behavior of prestressed concrete beams reinforced by CFRP under chloride environment. Adv. Civ. Eng. 2019, 2424518. [Google Scholar] [CrossRef] [Green Version]
  2. Padmarajaiah, S.K.; Ramaswamy, A. A finite element assessment of flexural strength of prestressed concrete beams with fiber reinforcement. Cem. Concr. Compos. 2002, 24, 229–241. [Google Scholar] [CrossRef]
  3. Kim, Y.J.; Shi, C.; Green, M.F. Ductility and cracking behavior of prestressed concrete beams strengthened with prestressed CFRP sheets. J. Compos. Constr. 2008, 12, 274–283. [Google Scholar] [CrossRef]
  4. Badawy, A.H.; Hassan, A.; El-Kady, H.; El-Hafaz, A. The behavior of reinforced and pre-stressed concrete beams under elevated temperature. Int. J. Eng. Res. Afr. 2020, 47, 15–30. [Google Scholar] [CrossRef]
  5. Bonopera, M.; Chang, K.C.; Chen, C.C.; Sung, Y.C.; Tullini, N. Experimental study on the fundamental frequency of prestressed concrete bridge beams with parabolic unbonded tendons. J. Sound Vib. 2019, 455, 150–160. [Google Scholar] [CrossRef]
  6. Noble, D.; Nogal, M.; Pakrashi, V. The effect of prestress force magnitude and eccentricity on the natural bending frequencies of uncracked prestressed concrete beams. J. Sound Vib. 2016, 365, 22–44. [Google Scholar] [CrossRef] [Green Version]
  7. Cohn, M.Z.; Dinovitzer, A.S. Application of structural optimization. J. Struct. Eng. 1994, 120, 617–650. [Google Scholar] [CrossRef]
  8. Lepš, M.; Šejnoha, M. New approach to optimization of reinforced concrete beams. Comput. Struct. 1994, 81, 1957–1966. [Google Scholar] [CrossRef]
  9. Coello, C.C.; Hernández, F.S.; Farrera, F.A. Optimal design of reinforced concrete beams using genetic algorithms. Expert Syst. Appl. 1997, 12, 101–108. [Google Scholar] [CrossRef]
  10. Rahmanian, I.; Lucet, Y.; Tesfamariam, S. Optimal design of reinforced concrete beams: A review. Comput. Concr. 2014, 13, 457–482. [Google Scholar] [CrossRef]
  11. Chutani, S.; Singh, J. Design optimization of reinforced concrete beams. J. Inst. Eng. India Ser. A 2017, 98, 429–435. [Google Scholar] [CrossRef]
  12. Gokul, P.; Sabarigirivasan, L. Finite element analysis of RC beams with and without openings. Mater. Today Proc. 2022, 68, 2541–2550. [Google Scholar] [CrossRef]
  13. Lezgy-Nazargah, M.; Dezhangah, M.; Sepehrinia, M. The effects of different FRP/concrete bond-slip laws on the 3D nonlinear FE modeling of retrofitted RC beams—A sensitivity analysis. Steel Compos. Struct. 2018, 26, 347–360. [Google Scholar] [CrossRef]
  14. Yeganeh-Salman, A.; Lezgy-Nazargah, M. Evaluating the accuracy of mass scaling method in non-linear quasi-static finite element analysis of RC structures. Struct. Eng. Mech. 2023, 8, 485–500. [Google Scholar] [CrossRef]
  15. Bendsee, M.P.; Sokolowski, J. Design sensitivity analysis of elastic-plastic analysis problems. Mech. Struct. Mach. 1988, 16, 81–102. [Google Scholar] [CrossRef]
  16. Newman, J.C., Jr.; Armen, H., Jr. Elastic-plastic analysis of a propagating crack under cyclic loading. AIAA J. 1975, 13, 1017–1023. [Google Scholar] [CrossRef]
  17. Tin-Loi, F. Optimum shakedown design under residual displacement constraints. Struct. Multidiscip. Optim. 2000, 19, 130–139. [Google Scholar] [CrossRef]
  18. Atkočiūnas, J.; Merkevičiūtė, D.; Venskus, A. Optimal shakedown design of bar systems: Strength, stiffness and stability constraints. Comput. Struct. 2008, 86, 757–1768. [Google Scholar] [CrossRef]
  19. Weichert, D.; Maier, G. Inelastic Behaviour of Structures Under Variable Repeated Loads: Direct Analysis Methods; Springer: Vienna, Austria, 2002. [Google Scholar] [CrossRef]
  20. Levy, N.H.; Einav, I.; Hull, T. Cyclic shakedown of piles subjected to two-dimensional lateral loading. Int. J. Numer. Anal. Methods Geomech. 2009, 33, 1339–1361. [Google Scholar] [CrossRef]
  21. Kaliszky, S.; Lógó, J. Optimal plastic limit and shake-down design of bar structures with constraints on plastic deformation. Eng. Struct. 1997, 19, 19–27. [Google Scholar] [CrossRef]
  22. Kaliszky, S.; Lógó, J. Optimal strengthening of elasto-plastic trusses with plastic deformation and stability constraints. Struct. Optim. 1999, 18, 296–299. [Google Scholar] [CrossRef]
  23. De La Fuente, A.; De Brito, J. Sustainable structural design: A review focused on the optimization of reinforced concrete structures. J. Clean. Prod. 2019, 211, 528–544. [Google Scholar] [CrossRef]
  24. Ibrahim, A.M.; Al-Khafaji, Z.A.; Al-Qadi, I.L. Optimal design of reinforced concrete structures for sustainable development. Sustain. Cities Soc. 2018, 42, 341–352. [Google Scholar] [CrossRef]
  25. Rad, M.M.; Ibrahim, S.K.; Logo, J. Limit design of reinforced concrete haunched beams by the control of the residual plastic deformation. Structures 2022, 39, 987–996. [Google Scholar] [CrossRef]
  26. Simulia, D.S. ABAQUS 2018 User’s Manual. Analysis User’s Guide, Volume IV: Elements; Dassault Systems: Paris, France, 2018. [Google Scholar]
  27. Rad, M.M.; Lógó, J.; Knabel, J.; Tauzowski, P. Reliability based limit design of steel frames with limited residual strain energy capacity. Proc. Appl. Math. Mech. 2009, 9, 709–710. [Google Scholar] [CrossRef]
  28. Lógó, J.; Vásárhelyi, A.; Rad, M.M.; Stocki, R. Reliability based limit analysis of steel frames with limited residual strain energy capacity. Proc. Appl. Math. Mech. 2008, 8, 10041–10044. [Google Scholar] [CrossRef]
  29. Rad, M.M.; Ibrahim, S.K. Optimal plastic analysis and design of pile foundations under reliable conditions. Period. Polytech. Civ. Eng. 2021, 65, 761–767. [Google Scholar] [CrossRef]
  30. Kaliszky, S.; Lógó, J. Plastic behaviour and stability constraints in the shakedown analysis and optimal design of trusses. Struct. Multidiscip. Optim. 2002, 24, 118–124. [Google Scholar] [CrossRef]
  31. Lógó, J.; Rad, M.M.; Knabel, J.; Tauzowski, P. Reliability based design of frames with limited residual strain energy capacity. Period. Polytech. Civ. Eng. 2011, 55, 13–20. [Google Scholar] [CrossRef]
  32. Capurso, M.; Corradi, L.; Maier, G. Bounds on deformations and displacements in shakedown theory. Materiaux et Structures sous Chargement Cyclique. In Proceedings of the Séminaire Organisé par le Laboratoire de Mécanique des Solides, Palaiseau, France, 28–29 September 1978; Association Amicale des Ingénieursanciens Eléves de l’E.N.P.C.: Paris, France, 1978; pp. 231–244. [Google Scholar]
  33. Capurso, M. A displacement bounding principle in shakedown of structures subjected to cyclic loads. Int. J. Solids Struct. 1974, 10, 77–92. [Google Scholar] [CrossRef]
  34. Gervytė, A.; Jarmolajeva, E. Analysis and optimization of elastic-plastic framing structures under complex constraints. Eng. Struct. Technol. 2013, 5, 159–166. [Google Scholar] [CrossRef]
Figure 1. Optimization problem process.
Sustainability 15 05742 g001
Figure 2. Model details.
Sustainability 15 05742 g002
Figure 3. Numerical models.
Sustainability 15 05742 g003
Figure 4. Concrete crack patterns in tension (DamageT).
Sustainability 15 05742 g004
Figure 5. Load–Deflection relationship.
Sustainability 15 05742 g005
Figure 6. Models with different tendon numbers.
Sustainability 15 05742 g006
Figure 7. Load– W p 0 relationship for 2-PS model and 4-PS model.
Sustainability 15 05742 g007
Figure 8. Load– W p 0 relationship for different prestressing cases.
Sustainability 15 05742 g008
Figure 9. Model details.
Sustainability 15 05742 g009aSustainability 15 05742 g009b
Figure 10. Numerical models.
Sustainability 15 05742 g010
Figure 11. Concrete crack patterns in tension (DamageT).
Sustainability 15 05742 g011
Figure 12. Load–Deflection relationship.
Sustainability 15 05742 g012
Figure 13. Load– W p 0 relationship for 100%PSF model and 0%PSF model.
Sustainability 15 05742 g013
Figure 14. Load– W p 0 relationship for different prestressing cases.
Sustainability 15 05742 g014
Table 1. W p 0 –load effect on the behaviour of 2-PS model.
W p 0 ( N . m m ) P (kN) Concrete   Damage   Intensity / Steel   Stress   Intensity   ( σ / σ y )
Sustainability 15 05742 i001
070Sustainability 15 05742 i002
3178Sustainability 15 05742 i003
77083Sustainability 15 05742 i004
278887Sustainability 15 05742 i005
Table 2. W p 0 –load effect on the behaviour of 4-PS model.
W p 0 ( N . m m ) P (kN) Concrete   Damage   Intensity / Steel   Stress   Intensity   ( σ / σ y )
Sustainability 15 05742 i006
080Sustainability 15 05742 i007
7095Sustainability 15 05742 i008
29898Sustainability 15 05742 i009
1300100Sustainability 15 05742 i010
Table 3. W p 0 –load effect on the behaviour of 100%PSF model.
W p 0 P (kN) Concrete   Damage   Intensity / Steel   Stress   Intensity   ( σ / σ y )
Sustainability 15 05742 i011
070Sustainability 15 05742 i012
2125Sustainability 15 05742 i013
60155Sustainability 15 05742 i014
Table 4. W p 0 –load effect on the behaviour of 0%PSF model.
W p 0 P (kN) Concrete   Damage   Intensity / Steel   Stress   Intensity   ( σ / σ y )
Sustainability 15 05742 i015
080Sustainability 15 05742 i016
2.592Sustainability 15 05742 i017
40114Sustainability 15 05742 i018
Disclaimer/Publisher’s Note: The statements, opinions and data contained in all publications are solely those of the individual author(s) and contributor(s) and not of MDPI and/or the editor(s). MDPI and/or the editor(s) disclaim responsibility for any injury to people or property resulting from any ideas, methods, instructions or products referred to in the content.

