Article

Digital Economy and 3E Efficiency Performance: Evidence from EU Countries

1
School of Economics and Management, Beijing University of Technology, Beijing 100124, China
2
Irish Institute for Chinese Studies, University College Dublin, D04 V1W8 Dublin, Ireland
*
Authors to whom correspondence should be addressed.
Sustainability 2023, 15(7), 5661; https://doi.org/10.3390/su15075661
Submission received: 24 February 2023 / Revised: 18 March 2023 / Accepted: 22 March 2023 / Published: 23 March 2023

Abstract

:
Nowadays, sustainability has become an important and widely accepted concept. Energy conservation and emission reduction are closely related to sustainable economic development. Therefore, a 3E efficiency approach, based on the “Energy–Environmental–Economic” (3E) system, can assess the coordination relationships among these three factors from the perspective of energy conservation and emission reduction. The digital economy is a new driving force for economic growth, but few studies have dealt with the question on whether it affects 3E efficiency. The purpose of this paper is to examine the relationship between the digital economy and 3E efficiency in EU countries. The empirical results indicate that: (1) overall 3E efficiency of EU countries showed an upward trend from 2011 to 2019; (2) in terms of the relationship between the digital economy and 3E efficiency, the digital economy has direct and indirect (through economic growth) impacts on 3E efficiency; when GDP per capita exceeds EUR 15,580, the influence coefficient of the digital economy on 3E efficiency changes from negative to positive. This suggests that EU countries with different levels of economic development should adopt different strategies to ensure the simultaneous development of their digital economy and 3E efficiency.

1. Introduction

Sustainability is a multidisciplinary topic and should cover all countries, without exception [1]. The combination of global resource scarcity, climate change, and increasing resource consumption has made the challenge of sustainable development (SD) a major priority [2]. The topic of SD has become ubiquitous in the last 30 years, yet how to achieve such a goal, or whether it is even possible, remains a major unknown [3]. In modern economies, people consider energy efficiency and pollution emission reduction as being critical to their sustainable expansion [4]. A definition for SD was first proposed in the Brundtland Report in 1987: “Development that meets the needs of the present without compromising the ability of future generations to meet their own needs” [5]. The report highlights the importance of the balance between environmental protection, social development, and the economy of human activities.
The United Nations (UN) has played a key role in promoting sustainable development because it is constantly working to assist countries to overcome current and future sustainability challenges. In 2012, the UN Conference on Sustainable Development (UNCSD) focused on the role of the green economy in sustainable development and poverty eradication. In 2015, the United Nations (UN) General Assembly adopted 17 Sustainable Development Goals (SDGs) as an integral part of the 2030 Agenda for Sustainable Development, serving as a continuation of the Millennium Development Goals (MDGs). The SDGs mark the UN’s historic shift towards a single sustainable development agenda, following a long history of trying to integrate economic and social development with environmental sustainability [6].
Global goals such as the SDGs are believed to create a common vision and incentive for more cooperation among international organizations and institutions, and hence improve policy coherence [7]. To achieve the SDGs adopted by the UN in 2015, the European Commission (EC) has focused on concrete actions to bring about “tangible progress” on the SDGs. In 2019, the EC proposed a “European Green Deal” to make the EU economy more sustainable by turning climate and environmental challenges into opportunities. In July 2022, the EC delivered the Green Recovery Plans (GRPs), aimed at fostering a greener, more digital, more resilient Europe that provides a better fit for the current and forthcoming challenges [8]. In this context, dealing with the coordinated development of the economy, resources, and the environment has become an urgent priority for EU countries. With the expanding research on the dual system of “Energy-Economic”, “Energy-Environmental”, and “Economic–Environmental”, scholars have realized that a more comprehensive, in-depth, and systematic study can only be carried out if the “Energy-Economy-Environment” system is considered simultaneously. Therefore, the 3E efficiency measurement, based on the “Energy–Environmental–Economic” (3E) system, can investigate the coordination relationship among these three factors from the perspective of energy conservation and emission reduction.
The digital economy has developed rapidly in recent years. Supported by the development of big data, 5G technology, cloud computing, and artificial intelligence, all countries in the world regard the digital economy as strategically important and as a new driving force for economic growth in the reconstruction of national core competitiveness. The digital economy originated in the 1990s—it was first proposed by Don [9], who elaborated on the impact of the Internet on the economy and society—and is now becoming an emerging economic system. The EU is one of the most developed regions in the world, and also a region that has had an early start in the digital economy. As a representative advocate of the digital economy, the EU has introduced many policies in recent years to promote its development and address its challenges. Since 2010, the EU has promoted “Digital Europe” and sent out a strong message on the need for a stronger and more coherent Digital Europe through annual events, such as the Tallinn Digital Summit. Over the past decade, the EU has adopted many policy documents related to digitization of the EU economy, such as “A Digital Agenda for Europe” [10], “Age of Artificial Intelligence: Towards a European Strategy for Human-Centric Machines” [11], and “Towards a Thriving Data-Driven Economy” [12].
Data elements/factors, as the core driving force of the digital economy, exist in the form of virtual non-physical entities, with the environmentally friendly characteristics of low natural resource consumption and low pollution emission. In participating in economic activities, data elements/factors break with the traditional high-energy-consuming and high-pollution approach to economic growth, effectively embodying the concept of green development. This also coincides with the concept of using less cost to create greater output in efficiency measurements.
In terms of the digital economy and economic growth, most scholars have recognized the positive effect of the digital economy on economic development, which promotes economic growth by creating job opportunities and changing social structures [13,14]. The promotion of the digital economy will gradually impact on the environment. Under the restrictions of global climate change, more and more digital technologies are being applied in the fields of energy and environment. With the rapid development of Internet technology, some scholars have begun to incorporate the digital economy into the research framework of green and low-carbon development, mainly focusing on the relationship between the digital economy and energy efficiency, carbon emission, circular economy [4,15,16,17], but their views have not reached a consensus. In terms of the digital economy and energy efficiency, some scholars believed that the development of the digital economy will lead to the increase of energy efficiency [18,19,20,21,22], and they still have some different views, arguing that the application of digital technologies and the construction of digital infrastructures stimulate a surge in energy demand [23,24]. In terms of the digital economy and carbon emission, there also exist different views. On one hand, some scholars believed that developing the digital economy is beneficial to reducing carbon emissions [9,25,26,27,28], the digital economy will drive the realization path of carbon emission reduction, which, in turn, leads to a reduction in carbon emissions. On the other hand, others indicated that the developing digital economy exacerbates carbon emissions [29,30,31,32,33,34].
However, there remains a gap in the current research on the relationship between the digital economy and 3E efficiency. The development of the digital economy is an effective approach to promote economic growth, relieve pressure on the environment, and improve 3E efficiency. Therefore, inspired by the intrinsic connection between 3E efficiency and digital economy, we attempt to carry out an empirical analysis on what impact the digital economy has on 3E efficiency, and discuss how this can help to improve the environment through high-quality economic development. The purpose of this paper is to examine the relationship between the digital economy and 3E efficiency in EU countries, including direct and indirect impacts.
The contribution of this paper are as follows: (1) It sets out the construction of a digital economy variable system and measures the level of national digital economic development in EU countries using the entropy method. (2) Most current studies on the digital economy and green economy are focused on carbon emissions and energy efficiency. This paper is the first to focus on the relationship between the digital economy and 3E efficiency, which reinforces the internal requirements of sustainable development. (3) In addition, we take account of the indirect impact of the digital economy on 3E from the perspective of economic growth and explore the mediating role of economic growth. The remainder of this paper is organized as follows: Section 2 presents the Methodology and models used in this study; Section 3 introduces the variable system used for empirical estimation; Section 4 provides the results and discussions; and Section 5 offers some concluding remarks.

2. Materials and Methods

2.1. Slacks-Based Measure (SBM) Model with Undesirable Output

The CCR [35] model (by Charnes, Cooper, and Rhode) and BCC [36] model (by Banker, Charnes, and Cooper) are classical radial DEA measurement methods. However, the radial measure may lead to the absence of information of the decision making unit (DMU), thus to efficiency overestimation [37,38]. Tone proposed a non-radial and non-angular slacks-based measure model in 2001, which directly introduced the slack variable into the objective function [39]. Based on the traditional slacks-based measure (SBM) model, Tone further constructed the SBM model with undesirable outputs in 2004, taking undesirable outputs into account [40]. Therefore, this paper adopts the SBM model with undesirable output to measure 3E efficiency to better reflect the essence of efficiency evaluation.
Supposed that there are n DMUs, each D M U j ( j = 1 , 2 , , n ) has m inputs x j = ( x 1 j , x 2 j , , x m j ) , s 1 desirable outputs y j g = ( y 1 j g , y 2 j g , , y s 1 j g ) , and s 2 undesirable outputs y j b = ( y 1 j b , y 2 j b , , y s 2 j b ) . The specific model is expressed as follows:
min ρ = 1 1 m i = 1 m s i x i 0 1 + 1 s 1 + s 2 ( r = 1 s 1 s r g y r 0 g + r = 1 s 2 s r b / y r 0 b )   s . t . x 0 = X λ + s y r 0 g = Y g λ s g y r 0 b = Y b λ s b   λ 0 ,   s 0 ,   s g 0 , s b 0
where s R m , s b R s 2 , and s g R s 1 are all slacks. 0 < ρ 1 , when ρ = 1 , means the DMU is on the production frontier, which is completely efficient.

2.2. Benchmark Regression Model

Firstly, to explore the impacts of the digital economy on 3E efficiency in EU countries, we constructed the following static panel data model as our baseline regression model:
e e e i t = β 0 + β 1 d i g i t + β 2 X i t + ε i t
where e e e i t , d i g i t , and X i t represent the 3E efficiency, the digital economy development level, and control variables, respectively. In addition, i , t , β 0 , and ε are region, time, constant term, and random error term, respectively.
Then, we analyzed the indirect efficiency of the digital economy on 3E efficiency. Due to the lack of research on the relationship between the digital economy and 3E efficiency, we studied the relevant mechanisms associated with the impact of the digital economy on the green economy (such as the impact on carbon emissions and energy efficiency). In addition, based on previous literature discussing the mechanism, we hypothesized that the digital economy may indirectly affect 3E efficiency through economic growth.
Intermediate effects are defined as indirect effects of the independent variable on the dependent variable through intermediate variables [41]. Then, in order to examine whether economic growth can play the role of a mediating variable, we used the Bootstrap model [42,43] and the Sobel test for further empirical analysis.
Y = δ X + ε 1
M = α X + ε 2
              Y =   δ   X + β M + ε 3  
Equations (4)–(6) defined the standardized mediating effects model, where Y is the explained variable, M is the mediating variable, and X is the explanatory variable. The coefficient δ is the effect of X on Y, the coefficient α is the effect of X on M. After controlling for the effect of X on Y, the coefficient β is the coefficient of effect of M on Y and δ is the effect of X on Y.
In order to examine the mediating role of economic growth, the following models are established:
e e e i t = δ 0 + δ 1 d i g i t + θ X i t + ε i t
      p g d p i t = α 0 + α 1 d i g i t + θ X i t + ε i t
            e e e i t =   δ   0 +   δ   1 d i g i t + β p g d p i t + θ X i t + ε i t
where Equations (6)–(8) correspond to the above Equations (3)–(5), respectively, p g d p i t represents GDP per capita, and the rest of the variables have the same meanings as above. e e e i t , d i g i t , and X i t represent the 3E efficiency, the digital economy development level, and control variables, respectively. In addition, i , t , and ε are region, time, constant term, and, respectively, and δ 0 , α 0 , and δ 0 are random error terms.
Finally, to further explore the possible nonlinear impact of the digital economy on 3E efficiency from the perspective of economic growth, we constructed the panel threshold model. The panel threshold model, established by Hansen (1999) [44], is a classical model to investigate the nonlinear relationship between variables. In this paper, we took GDP per capita as a proxy variable for economic growth, which is chosen as the threshold variable, and the specific model is as follows:
e e e i t = δ 0 + δ 1 d i g i t · I ( p g d p γ 1 ) + δ 2 d i g i t · I ( γ 1 < p g d p γ 2 ) + δ 3 d i g i t · I ( p g d p > γ 1 ) + θ X i t + ε i t
where γ 1 and γ 2 are threshold values, γ 1 < γ 2 , I ( · ) is an indicative function, and e e e i t , d i g i t , p g d p i t , X i t represent the 3E efficiency, the digital economy development level, GDP per capita, and control variables, respectively. In addition, δ 1 , δ 2 , δ 3 , and θ are the estimated parameters.

3. Variable System

3.1. Dependent Variable

For this paper, we chose 3E efficiency as the dependent variable, using a SBM model with undesirable output to measure the 3E efficiency in EU countries. In the construction of a complete variable system on 3E efficiency, we referred to Li et al. (2020, 2022) by using value output (VO) instead of GDP, which take the value of energy input into account and consider the importance of intermediate input [45,46]. Therefore, capital stock, labor, energy consumption, intermediate materials and services, excluding energy, are chosen as input variables, while value output and greenhouse gas emissions are selected as desirable and undesirable outputs, respectively. The capital stock is measured by the perpetual inventory (PIM) method [47], and the data for capital stock, intermediate materials and services, except for energy, and value output are deflated by the GDP deflator. All data are derived from EU KLEMS database, shown in Table 1.

3.2. Independent Variable

The digital economy development level is chosen as the core explanatory variable in this study. Based on previous studies [9,21,22,25], the digital economy variable system, published by the International Telecommunication Union (ITU), the World Economic Forum (WEF), and other international institutions, as well as the availability of data and the accurate description of characteristics of the digital economy, 14 variables are selected to measure the level of digital economy development. The 14 variables comprehensively measure this from three perspectives: digital economy infrastructure, digital economy innovation environment, and national digital competitiveness. The specific variables and data sources are shown in Table 2.

3.3. Other Variables

3.3.1. Mediating Variable

Economic growth (pgdp): Economic growth intensifies greenhouse gas emissions both directly and indirectly [48], and also drives increasing energy consumption [49]. However, when the growth of GDP per capita exceeds a threshold, it will lead to the reduction of carbon emissions [50]. Therefore, GDP per capita is used as a proxy variable for economic growth and a mediating variable for examining its impact on 3E efficiency.

3.3.2. Control Variables

(1)
Energy consumption structure (es): Energy consumption structure is linked to greenhouse gas emissions [51] and is also closely related to environmental protection. If the share of renewable energy increases, then greenhouse gas emissions will decrease for the same level of energy consumption. It is believed that the use of renewable energy can mitigate against environmental degradation [52]. In this study, we use the ratio of renewable energy consumption relative to total primary energy consumption to measure the energy consumption structure [22,53];
(2)
Environment protection (epi): Generally speaking, the more government investment n pollution control, the higher the completion of the pollution control infrastructure, and the more investment there is in low-carbon technology research [26], the more benefits are seen in environmental protection. Therefore, we used the ratio of environment protection investment relative to GDP to measure the level of environmental protection;
(3)
The level of urbanization (ur): The ratio of urban population in the total population is chosen to measure the level of urbanization;
(4)
The level of government intervention (gov): The government plays a leading role in economic development, energy conservation, and emission reduction [25,54]. The proportions of government consumption expenditure in GDP are employed to measure the level of government intervention.
All the variables used in this study are shown in Table 3.

3.4. Data Sources

According to the availability of data, data from 24 countries in the European Economic Area (EEA) during the period 2011 to 2019 are selected as samples in this study. Cyprus, Croatia, Luxembourg, Malta, Iceland, and Liechtenstein were excluded due to serious data missing.
All the raw data used in this study are obtained from publicly available official data sources, including the EU KLEMS database, World Development Indicators (WDI), International Telecommunication Union (ITU), E-Government Knowledgebase (EGOVKB), and World Intellectual Property Organization (WIPO). Table 4 below presents the descriptive statistical analysis of all variables.

4. Results and Discussion

4.1. Measurement of Digital Economy Development Level

Based on the national digital economy development variable system constructed in Section 3.2, we applied the entropy method to assign weights to each variable and measure the digital economy development level of 24 countries according to the availability of data. The comprehensive levels of digital economy development were obtained after data standardization and accounting for the major economies [25].
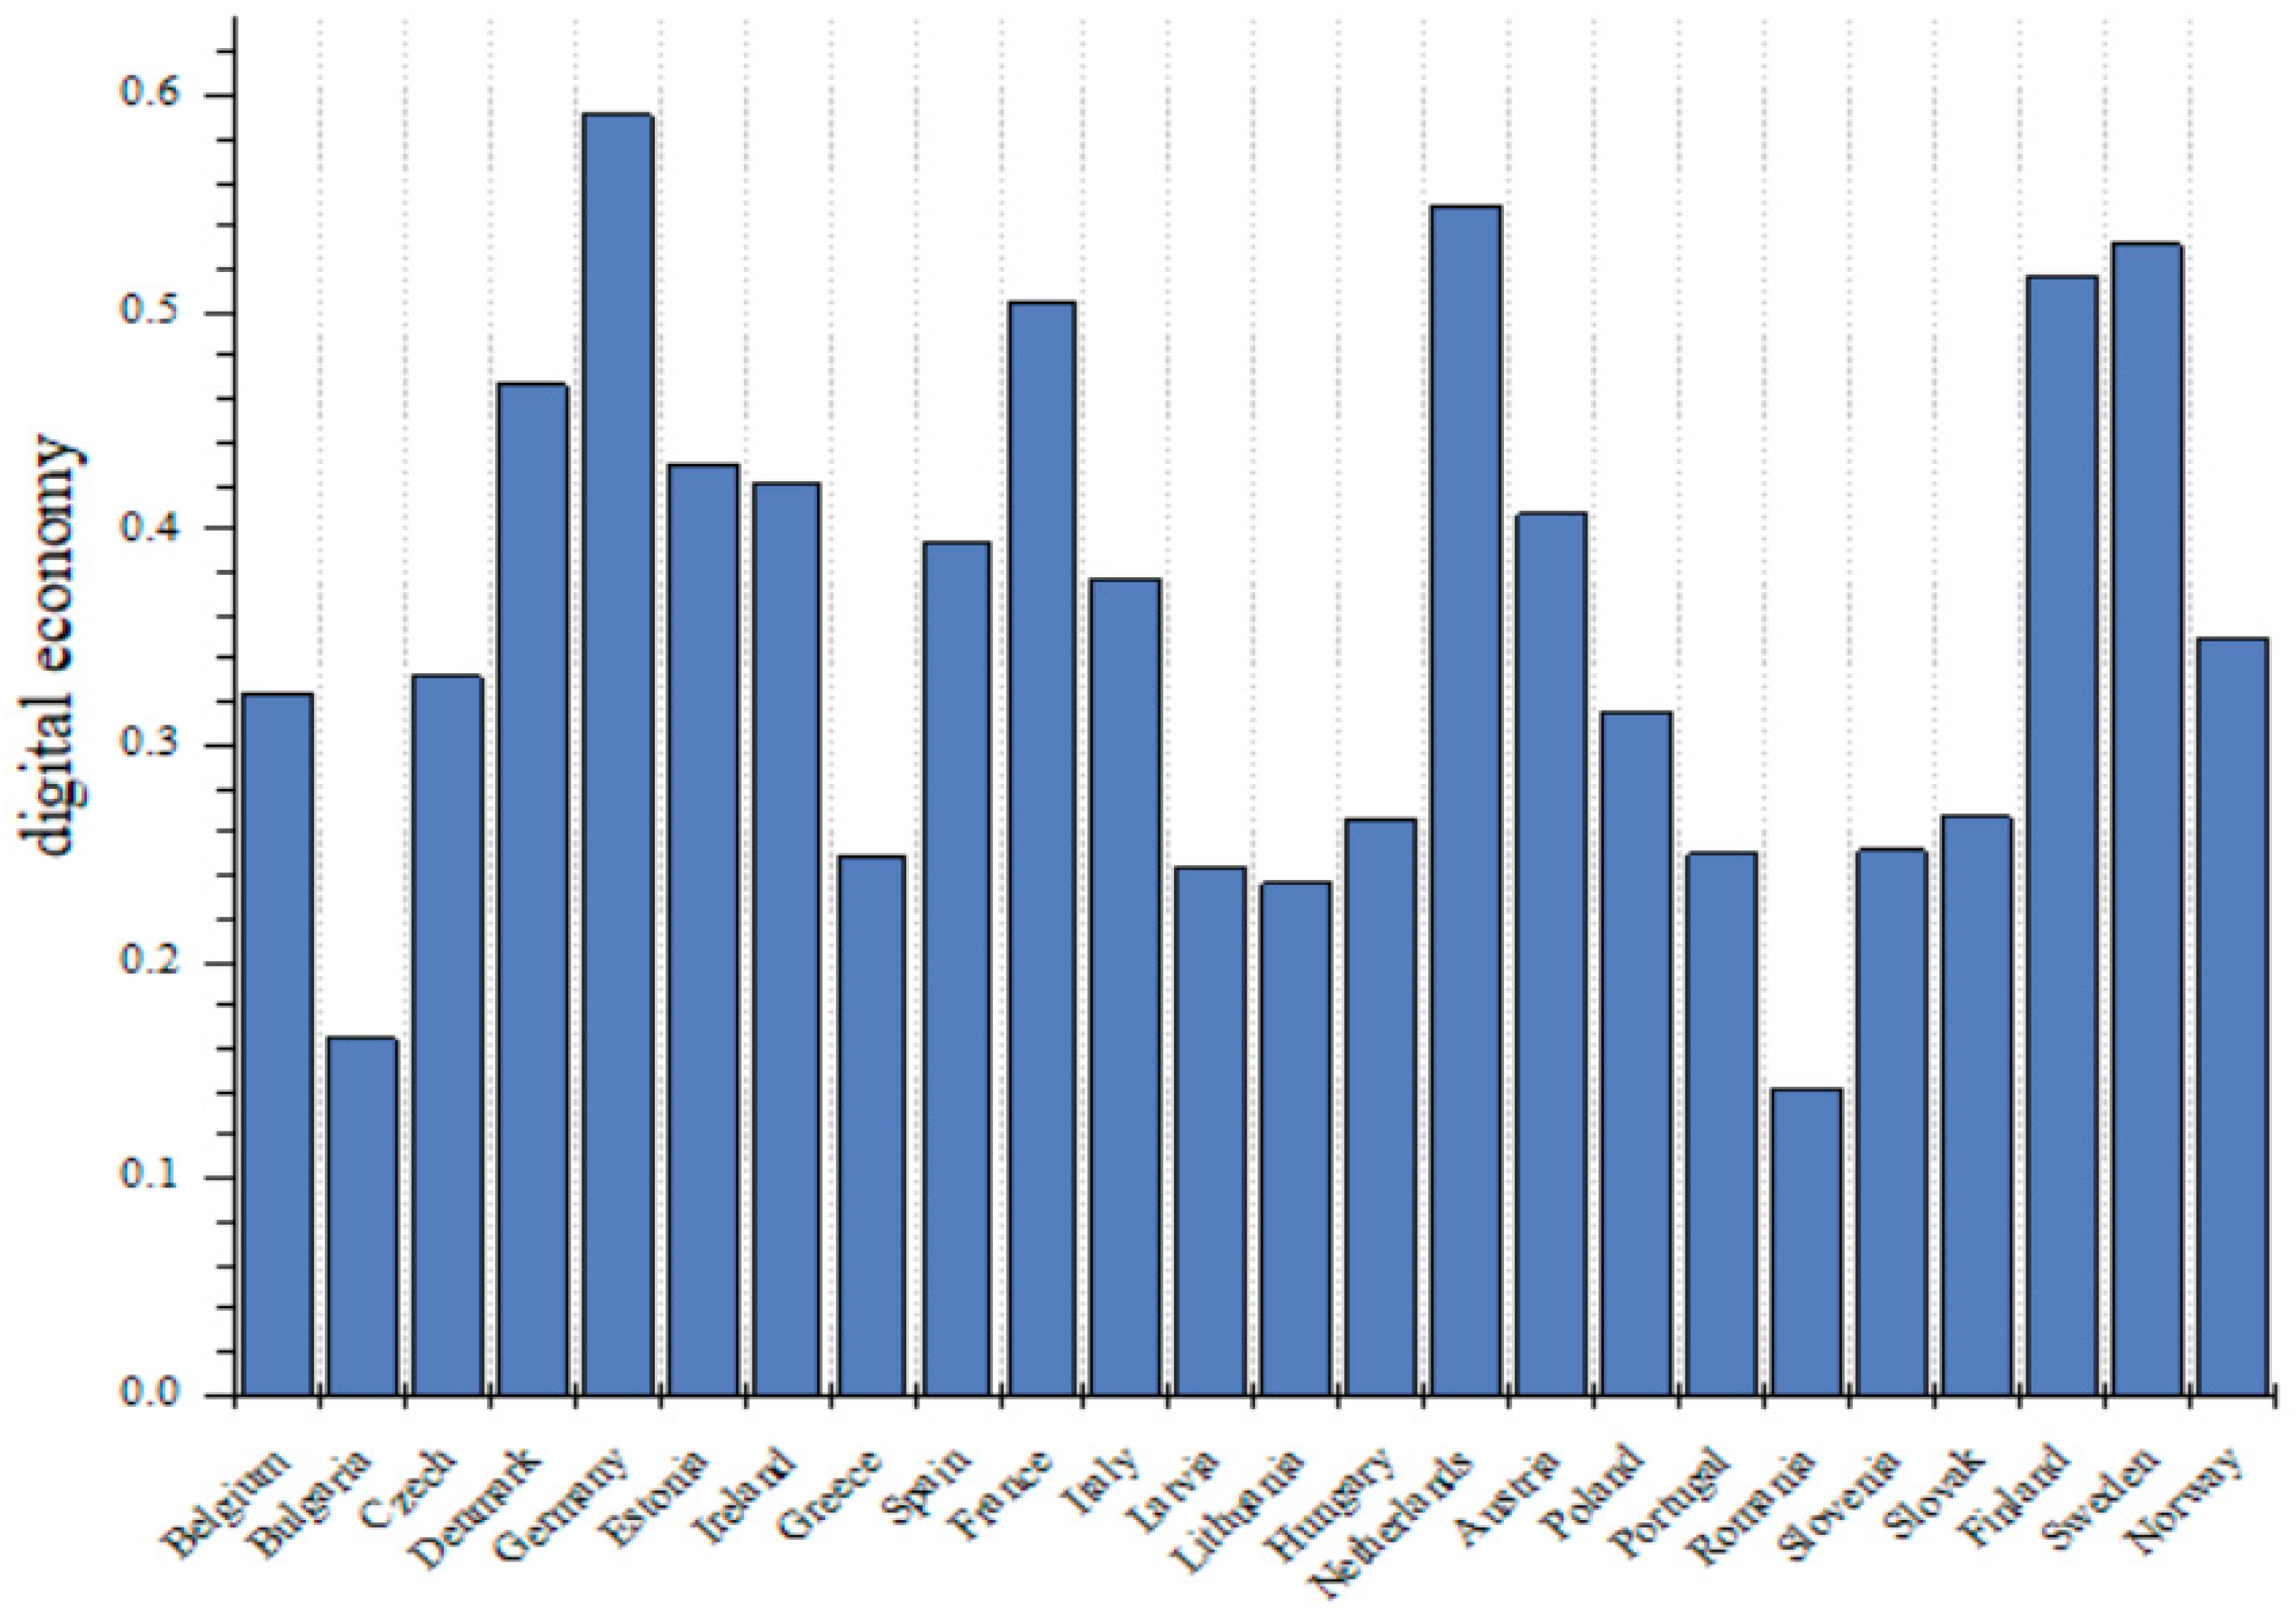
Nowadays, there is a growing discrepancy in internet access between countries with low and high digital connectivity. In the least developed countries, only one fifth of their population can connect to the internet, while four fifths of those living in developed countries have access. It can be seen in Figure 1 that the top five countries with the highest levels of digital economy development are Germany, the Netherlands, Sweden, Finland, and France, whose GDP per capita are all above USD 30,000. On the contrary, the five countries with the lowest levels of digital economy development are Romania, Bulgaria, Lithuania, Latvia, and Greece, with much lower GDP per capita.
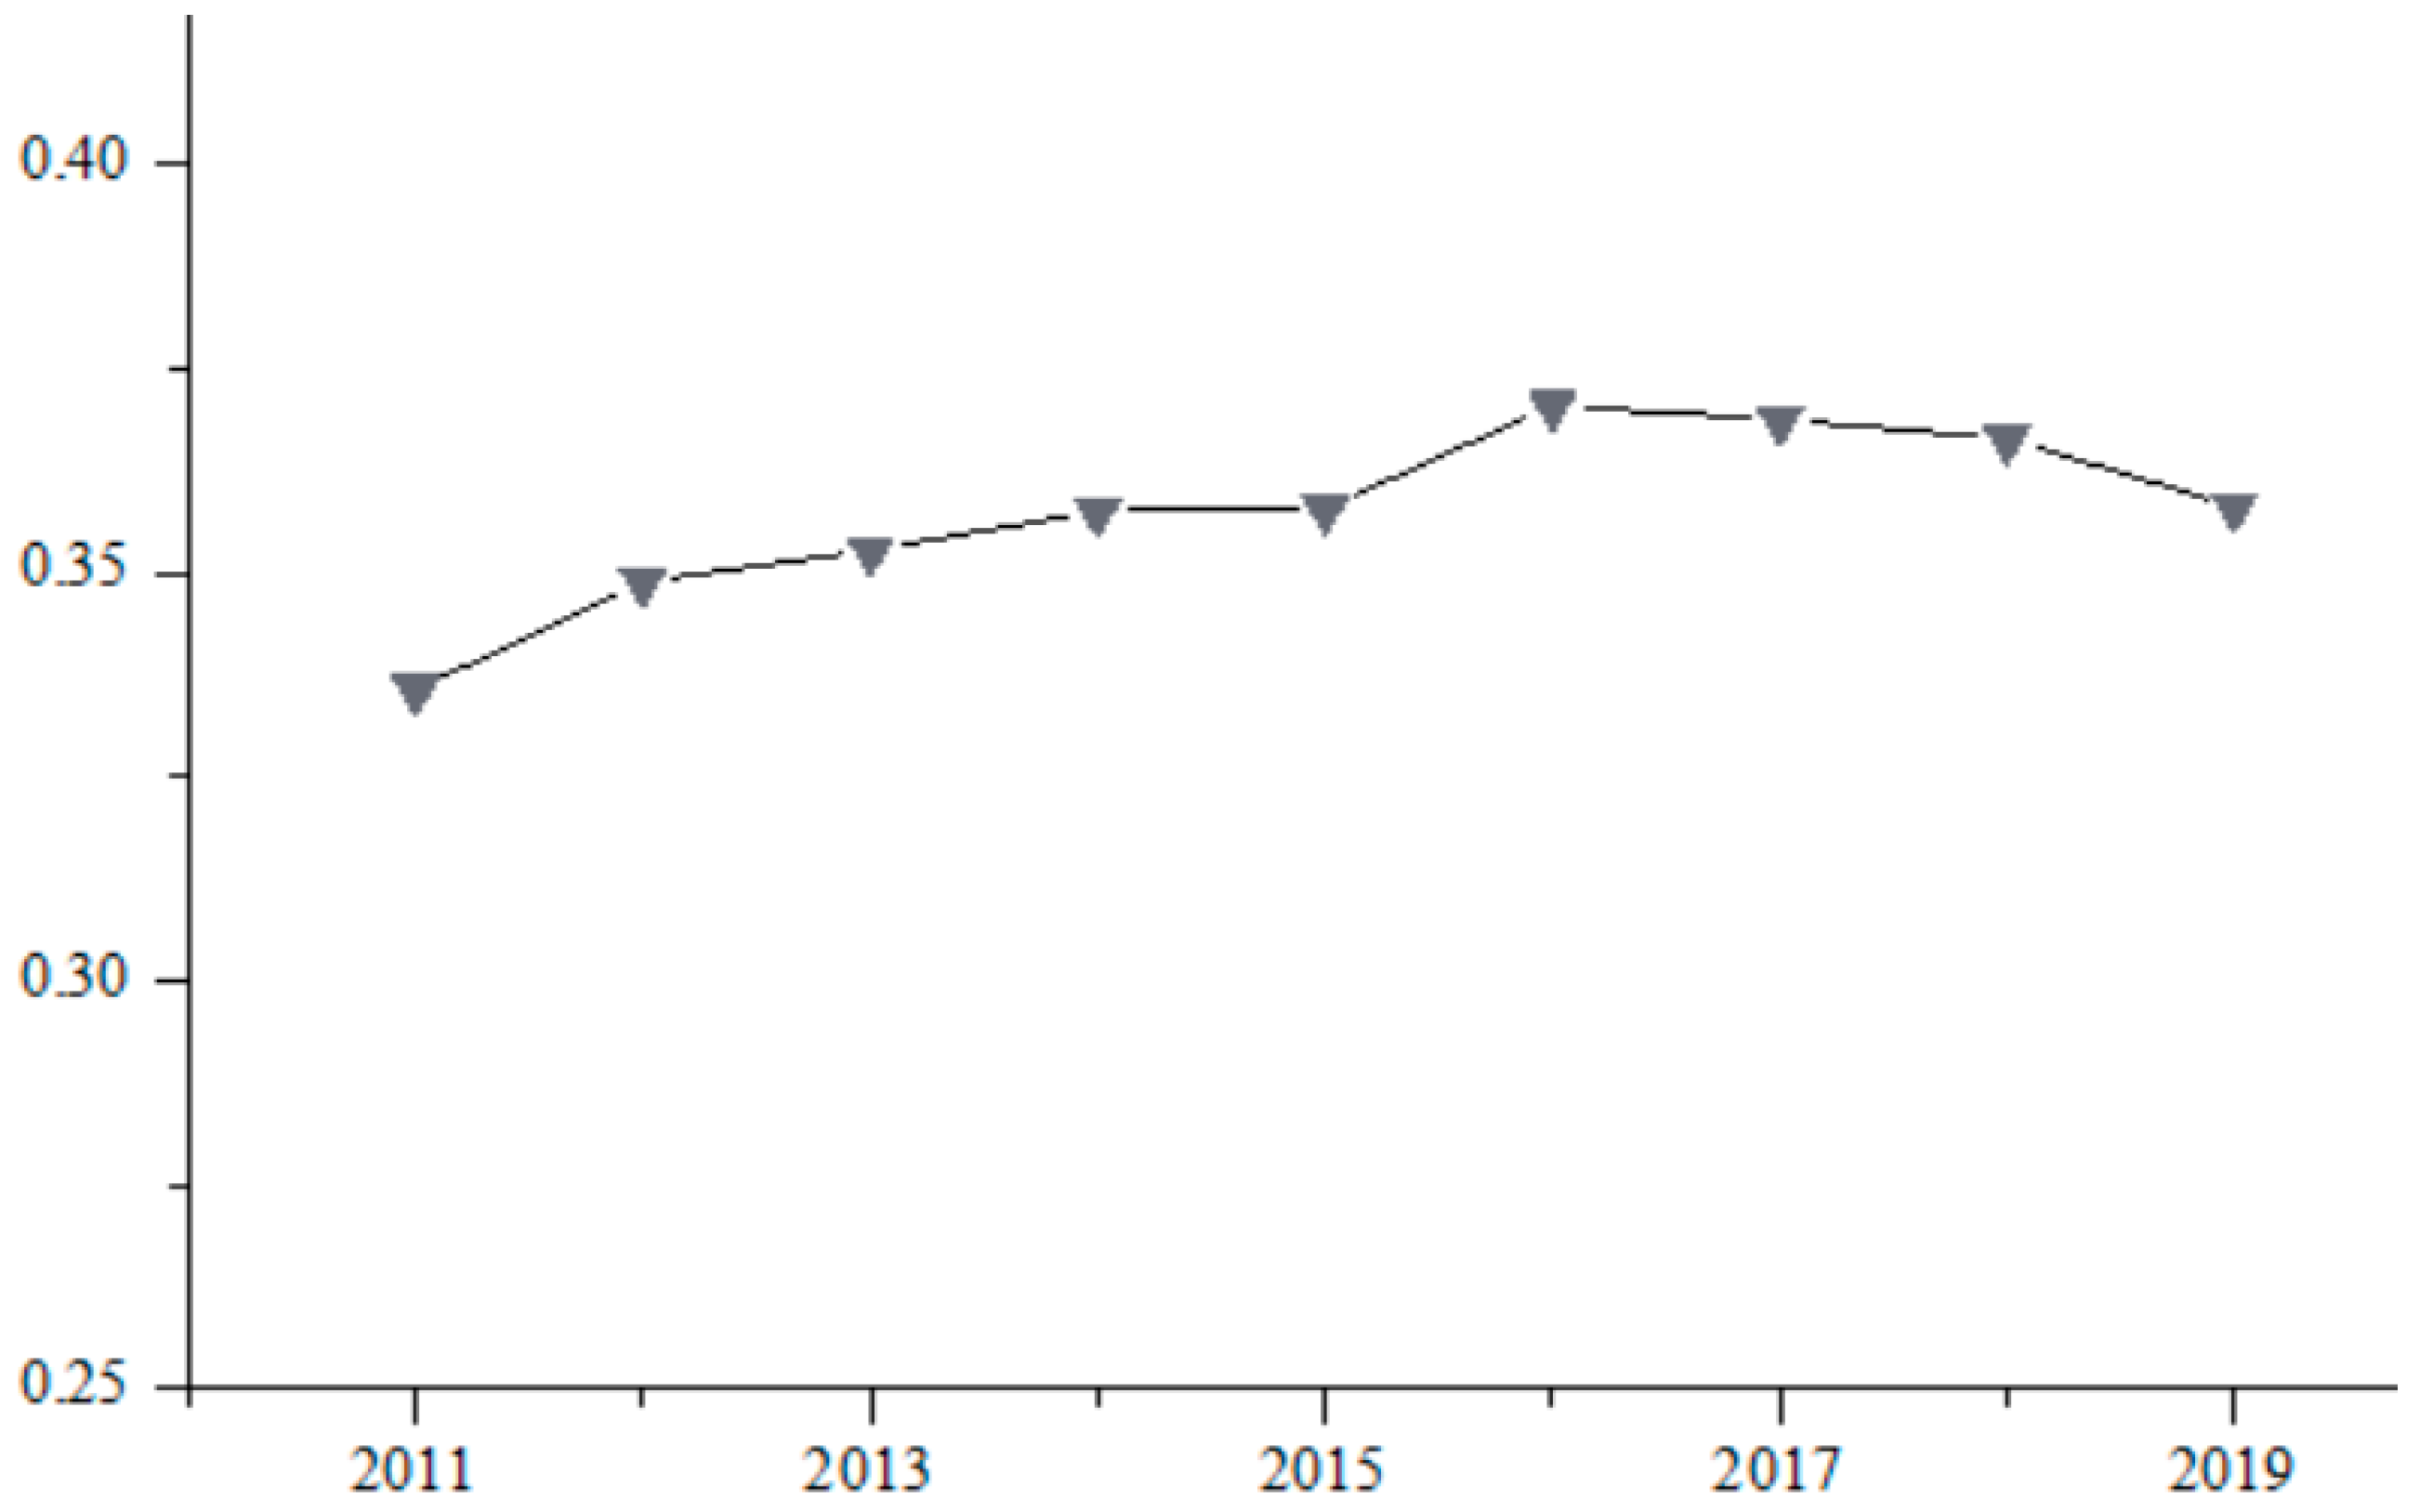
In addition, as can be seen in Figure 2, the level of digital economy development in EU countries shows an overall upward trend, with a slight decline after 2016.

4.2. Measurement of 3E Efficiency

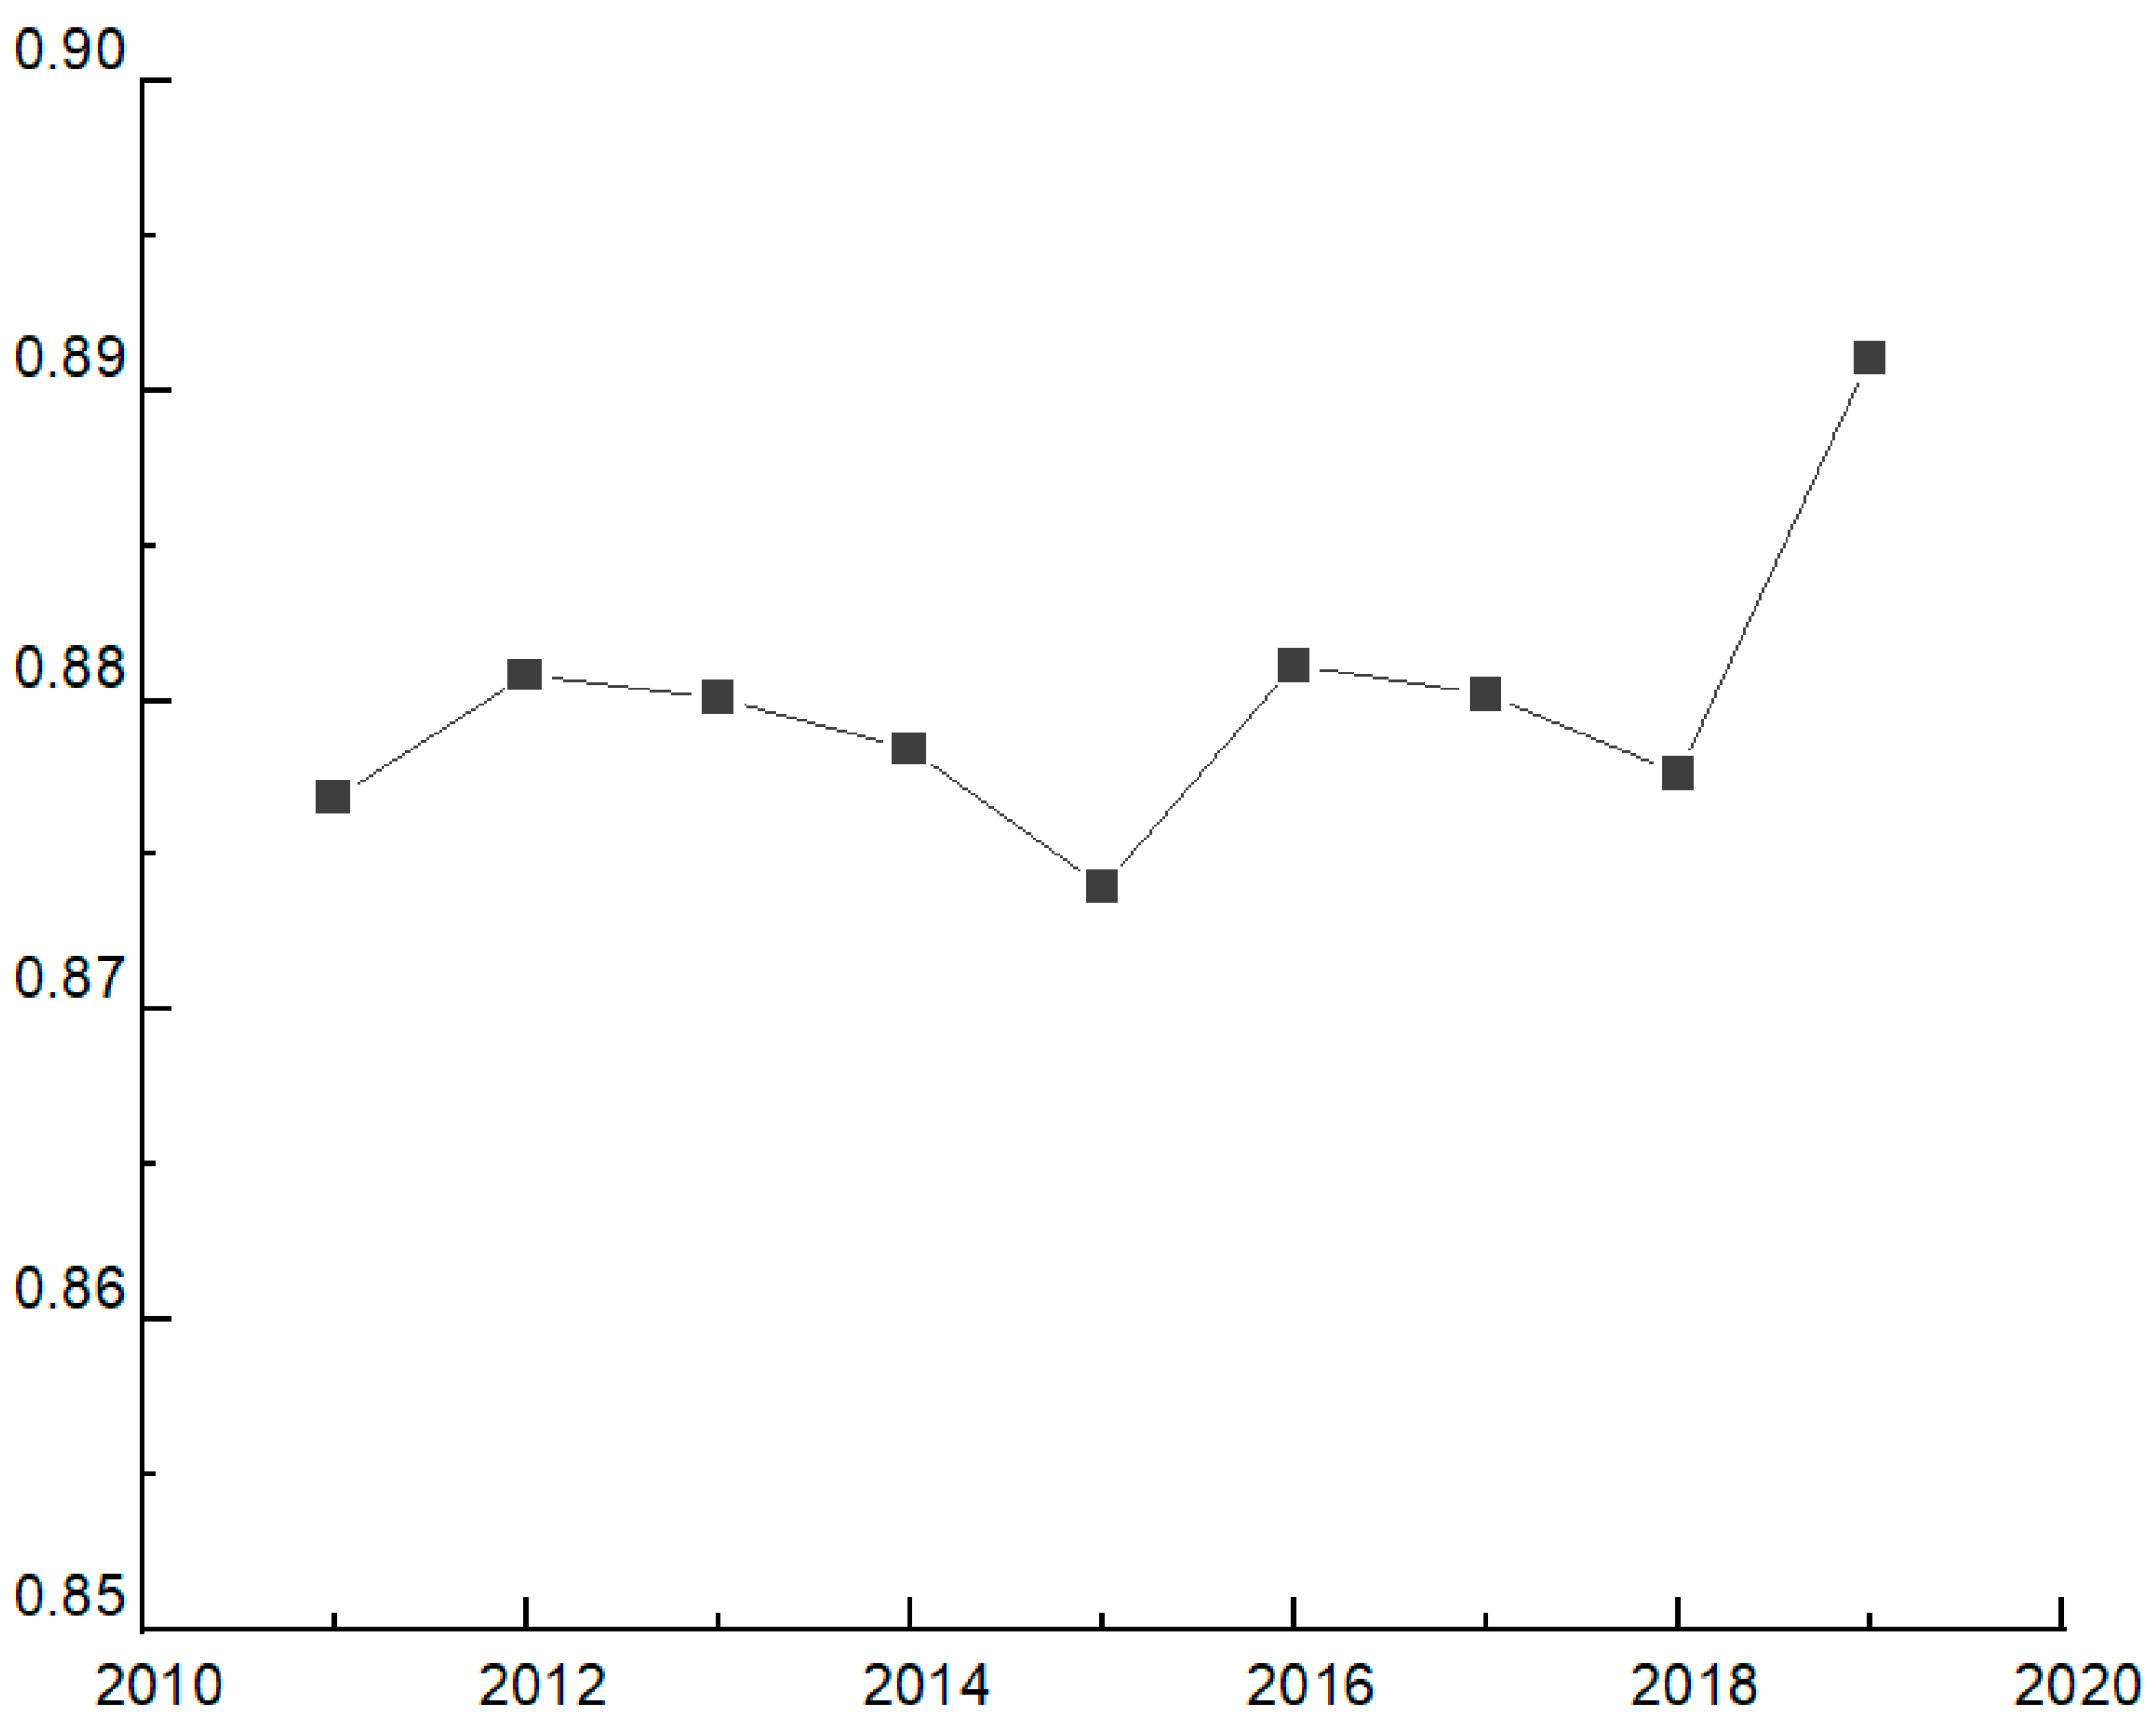
In this section, the 3E efficiency in 24 countries using a SBM model with undesirable output is measured by using MaxDea 9 software. Figure 3 shows the EU’s 3E efficiency scores during the period 2011–2019. This indicates that 3E efficiency in the EU shows an upward trend, with some fluctuation, during the period from 2011 to 2019. In 2015, the increase of energy consumption and greenhouse gas emissions in EU countries, coupled with slow economic growth, led to a significant decline in 3E efficiency.
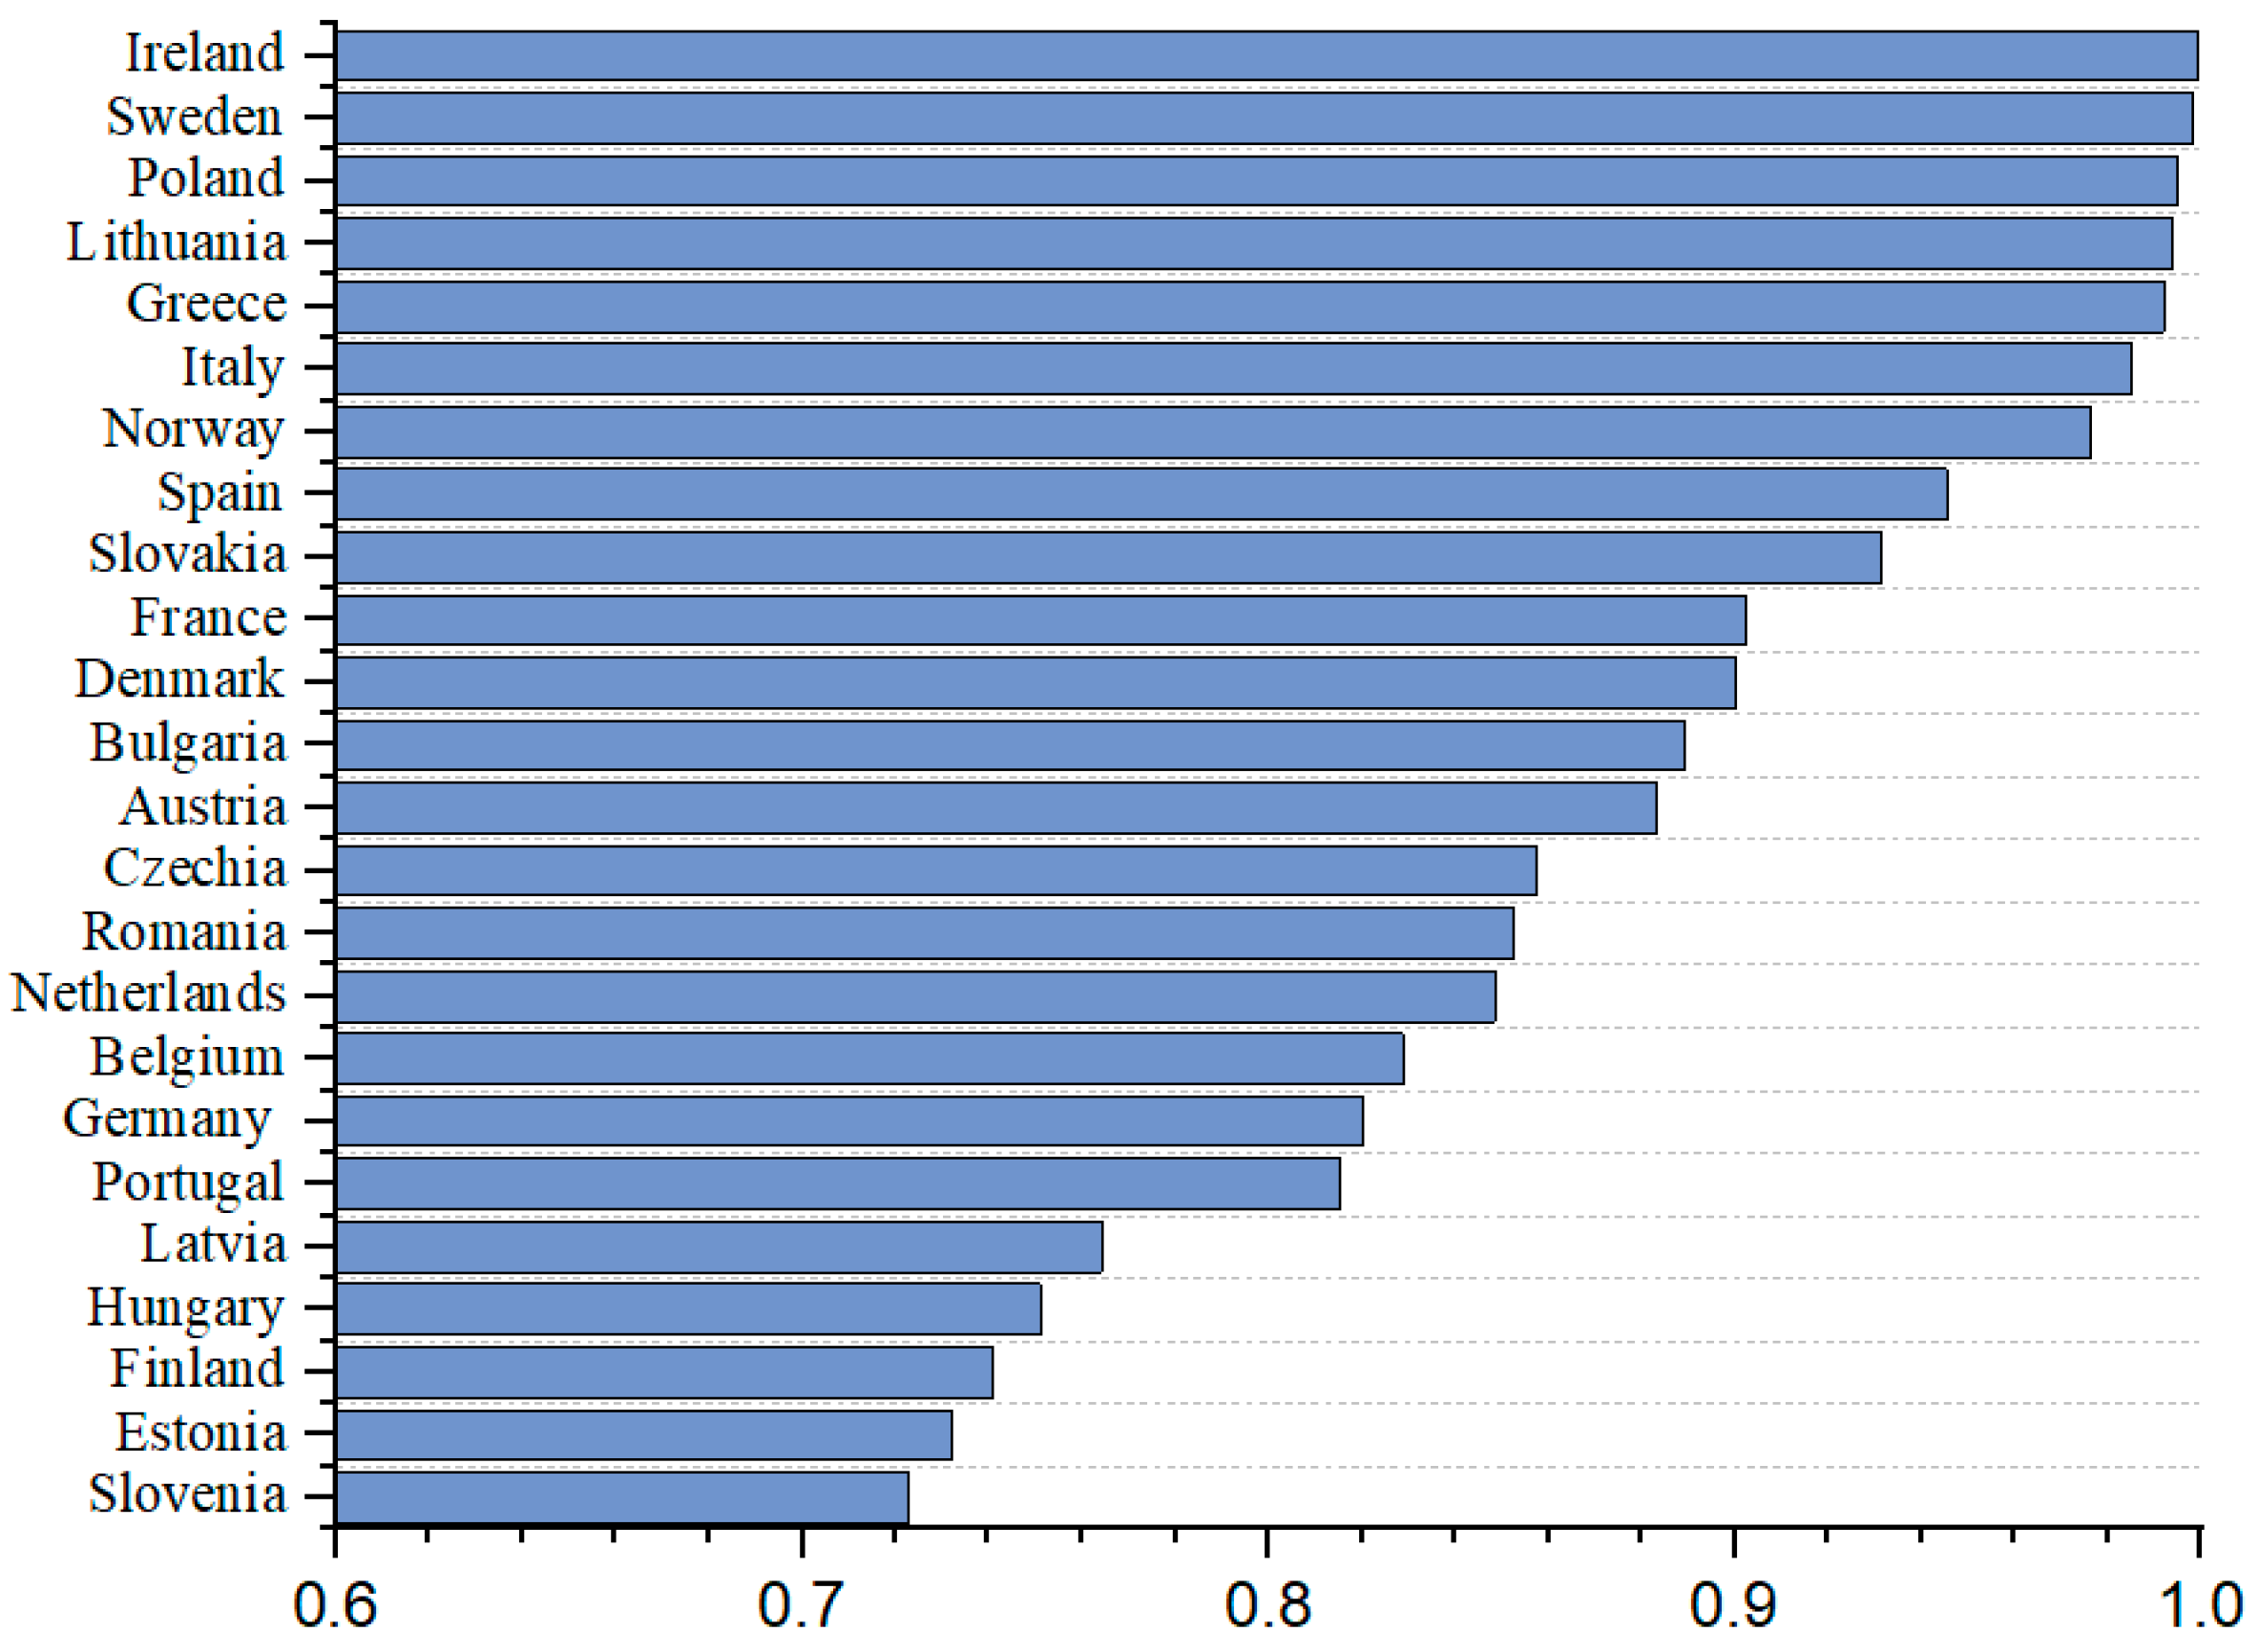
There are significant differences in 3E efficiency among EU countries, as indicted in Figure 4.
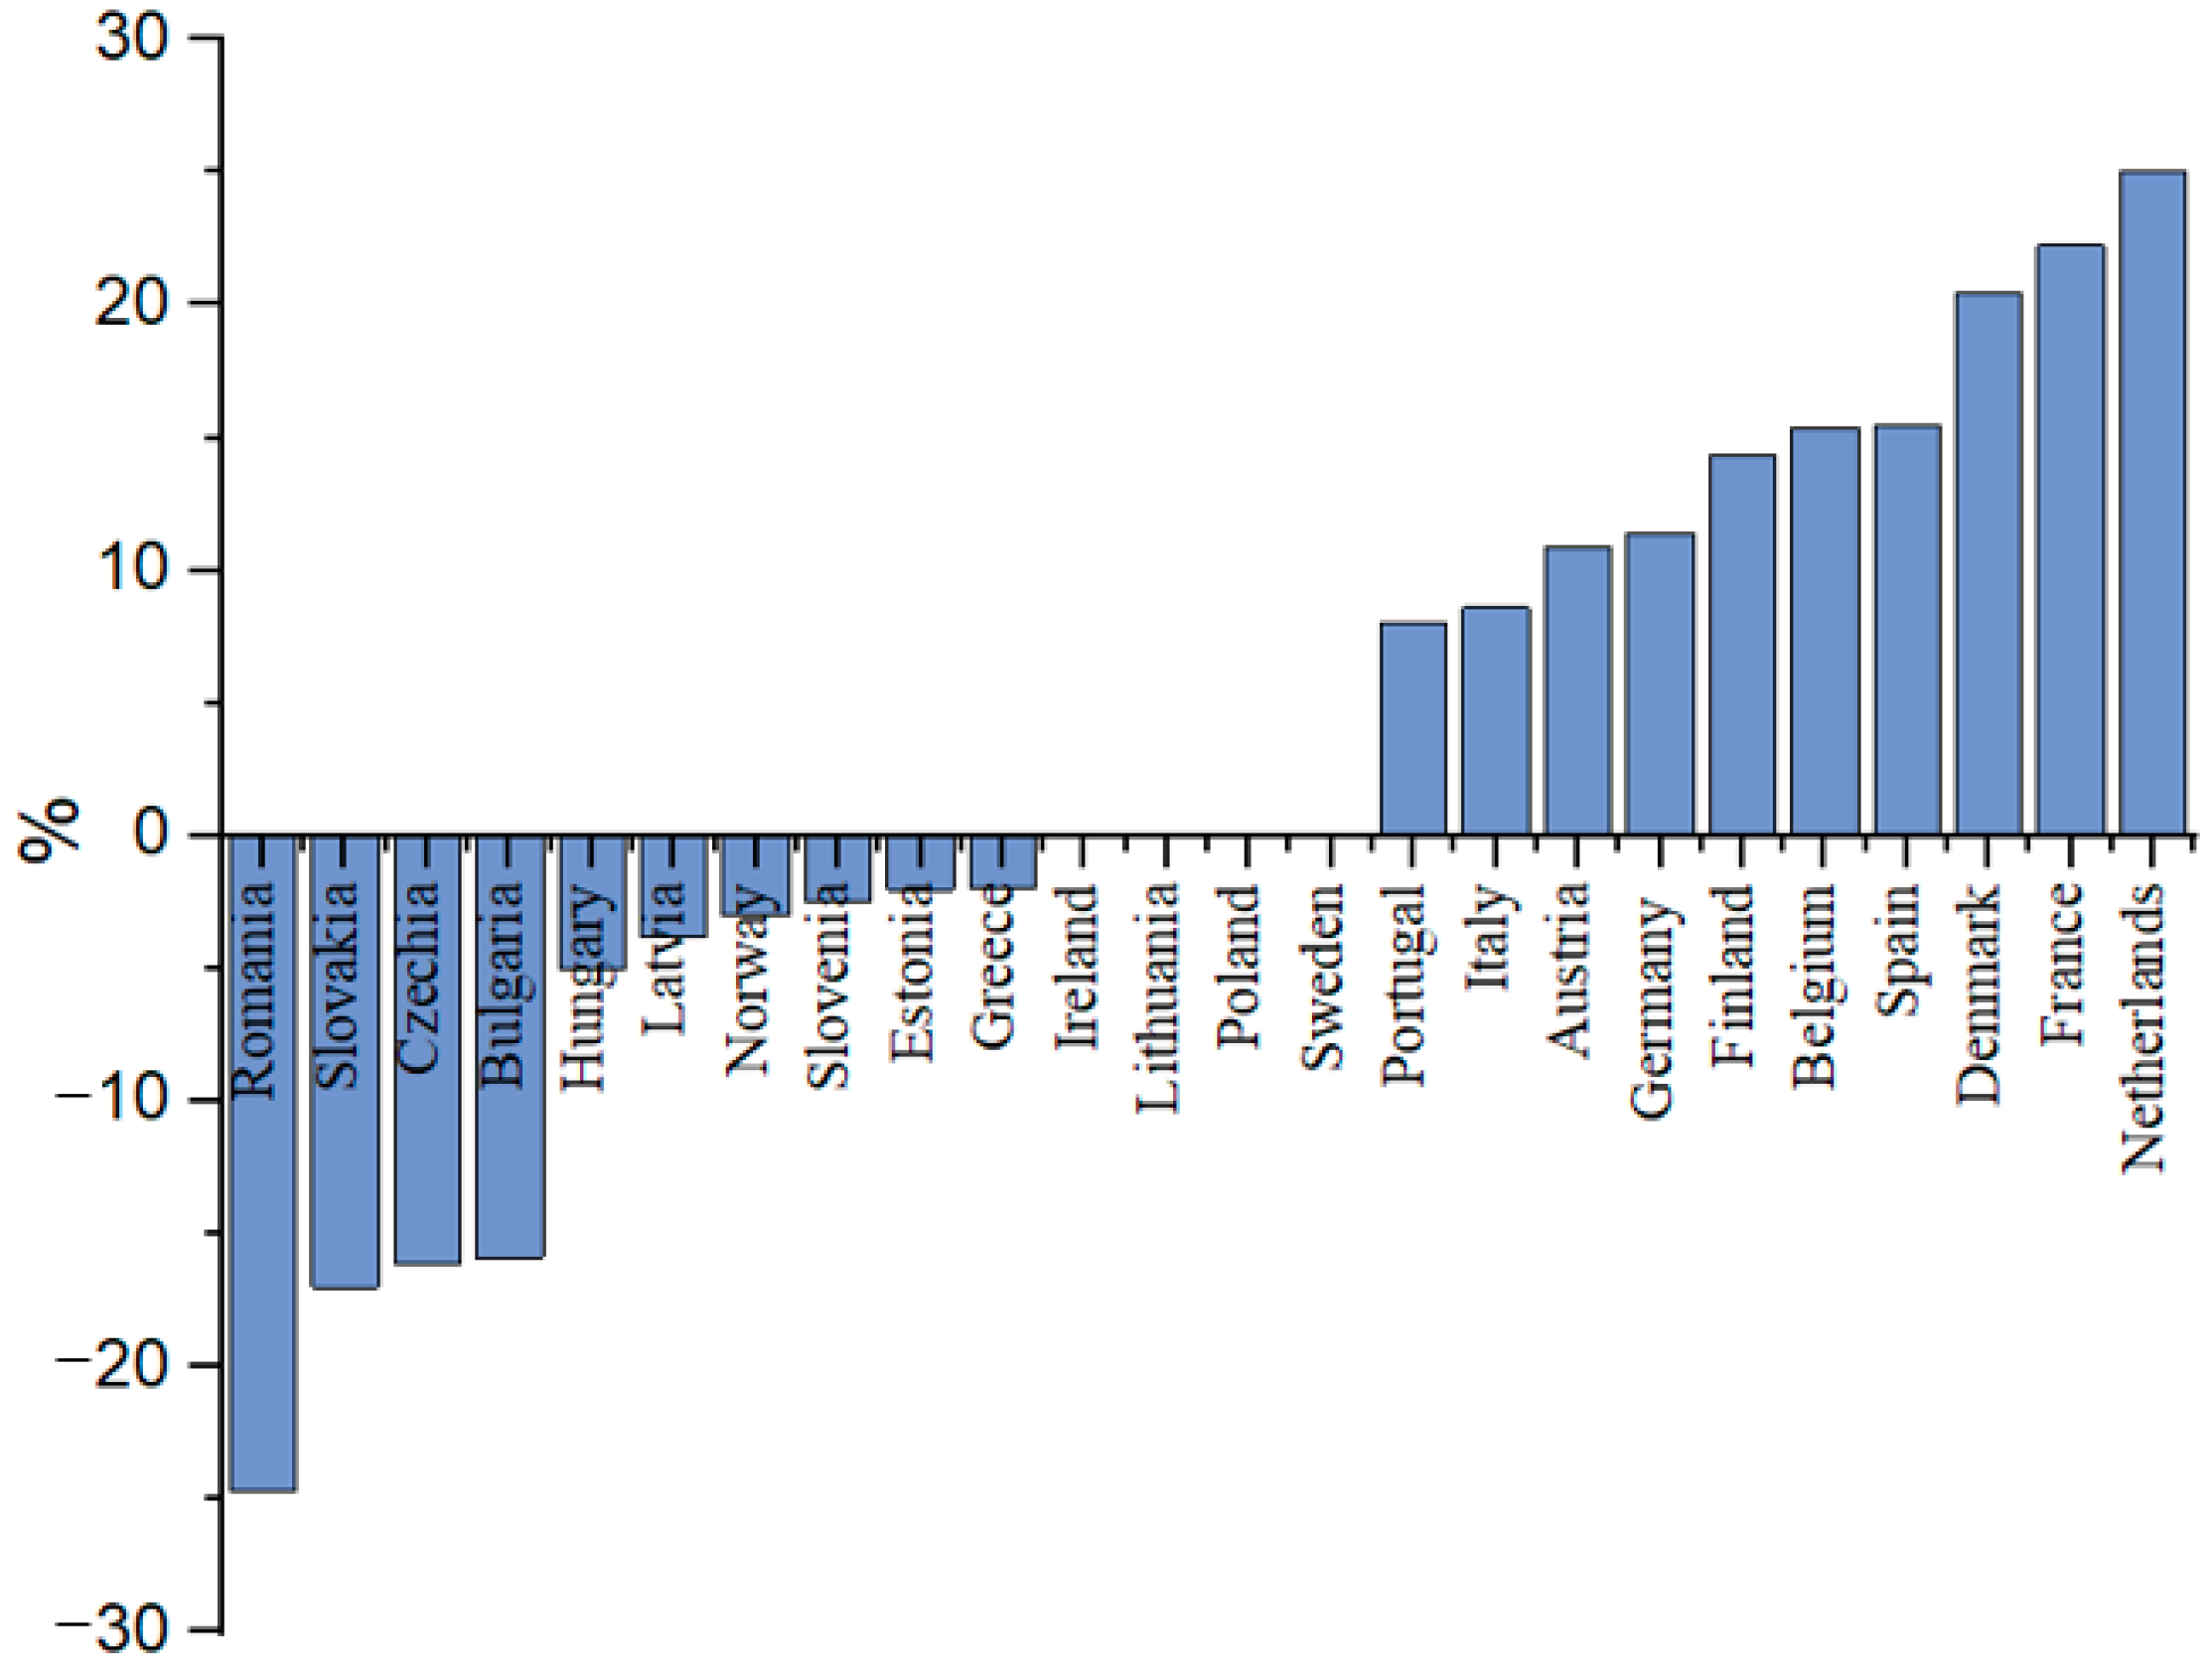
On one hand, among the countries with higher average 3E efficiency, some countries such as Ireland, Sweden, and Italy have higher GDP combined with lower energy consumption and carbon emissions, which lie on the production frontier. On the other hand, some countries such as Germany, France, and the Netherlands have high GDP, combined with serious problems with energy consumption and greenhouse gas emissions. However, with the continuous advancement of sustainable development requirements, their 3E efficiency has improved substantially as demonstrated in Figure 5. France and the Netherlands, in particular, have shown a rapid improvement in performance, from low ranking, in 2011, to a leading position in 2019. This suggests that these countries have successfully implemented energy conservation and emission reduction policies to sustain economic development. Several Eastern European countries with relatively less economic development, such as Romania and Bulgaria, have seen a decline in their 3E efficiency. These countries should take steps to accelerate the improvement of the 3E system to address this critical issue.

4.3. Benchmark Regression Results

4.3.1. Unit Root and Multicollinearity Tests

Firstly, the multicollinearity test was carried out on the original data of each variable in Table 5, and variance inflation factor (VIF) of each variable is <10, showing that there is no multicollinearity.
Due to the limitations of the dependent variable, Tobit regression was selected in the empirical study. Considering the characteristics of panel Tobit model, logarithms of explanatory variables were taken in the empirical estimation process.
To avoid the spurious regression, the panel unit roots for all variables are tested before proceeding with the panel regression model by using the ADF test and the LLC test, with the null hypothesis assuming the existence of unit roots. As shown in Table 6, the null hypothesis of the ADF test and the LLC test rejected all variables, which means that all variables are stable.

4.3.2. Impact of Digital Economy on 3E Efficiency

In this section, the panel regression model is employed to investigate the impact of the digital economy on 3E efficiency. Model (1) in Table 7 shows the result of the baseline regression model without control variables and Model (2) shows the results with control variables.
According to the regression results of the benchmark model, at a 1% significance level, improvement in the level of digital economy development will reduce 3E efficiency. This is in line with the results reported by previous studies that the use of information and communication technology (ICT) increases carbon emissions [29,30]. Therefore, it is reasonable to believe that the level digital economy development increases carbon emissions and thus impedes the improvement of 3E efficiency. The coefficients of energy consumption structure (es) and environmental protection investment (epi) are positive, indicating that improving environmental protection can improve 3E efficiency, and the use of renewable energy is conducive to energy conservation and emission reduction, so the development and utilization of renewable energy is essential.
The improvement of urbanization level will increase the 3E efficiency, although the process of urbanization is accompanied by the discharge of pollutants and the consumption of resources. However, in terms of the 3E system, an increase in the level of urbanization can improve 3E efficiency. Moreover, the negative coefficient of the level of government intervention indicates that government intervention reduces the improvement of 3E efficiency to a certain extent, and suggests that less administrative intervention is better [25].

4.3.3. Robustness Tests

In this section, the robustness test is carried out by changing the variable and shortening the sample range. Firstly, we replaced the variable, using population density (pd) instead of urbanization for panel regression. Then, we shorten the sample range by using the same model. The results are shown in Table 8, the regression results show that the coefficient for digital economy development level with respect to 3E efficiency is still significantly negative.

4.4. Mediating Effects of Economic Growth

Considering the impact of economic growth, we constructed a mediation effect model to examine the potential mechanism of the digital economy’s impact on carbon emissions. First, the bootstrap test of economic development is carried out with the results reported in Table 9. Both the indirect and direct effects of energy consumption structure are significant at the 1% level, with a 95% confidence interval of [0.025, 0.091] for the indirect effect, which does not contain 0, indicating the existence of a mediating effect.
Then, Models (5)–(7) are estimated with the regression results shown in Table 10. It can be seen that after the inclusion of GDP per capita as an intermediary variable, the negative impact of digital economy development level on 3E efficiency is weakened from −0.071% to −0.053%, indicating that the digital economy directly and indirectly (through GDP per capita) affects 3E efficiency.
In addition, the results of the model pass the Sobel test, and the proportion of the mediating effect of economic growth in the total effect of digital economy on 3E efficiency can be calculated as δ = 0.098 × (−0.170)/(−0.071) × 100% = 23.46%.

4.5. Threshold Effect of Economic Growth

4.5.1. Threshold Effect Significance Test

Before analyzing the panel threshold regression model, we first tested the significance of the threshold effect by the bootstrap method. The results in Table 11 show that both the single and double threshold tests pass the significance test. However, the three threshold fails the significance test, indicating that the mediating variable lnpgdp has two thresholds.

4.5.2. Authenticity Test of the Thresholds

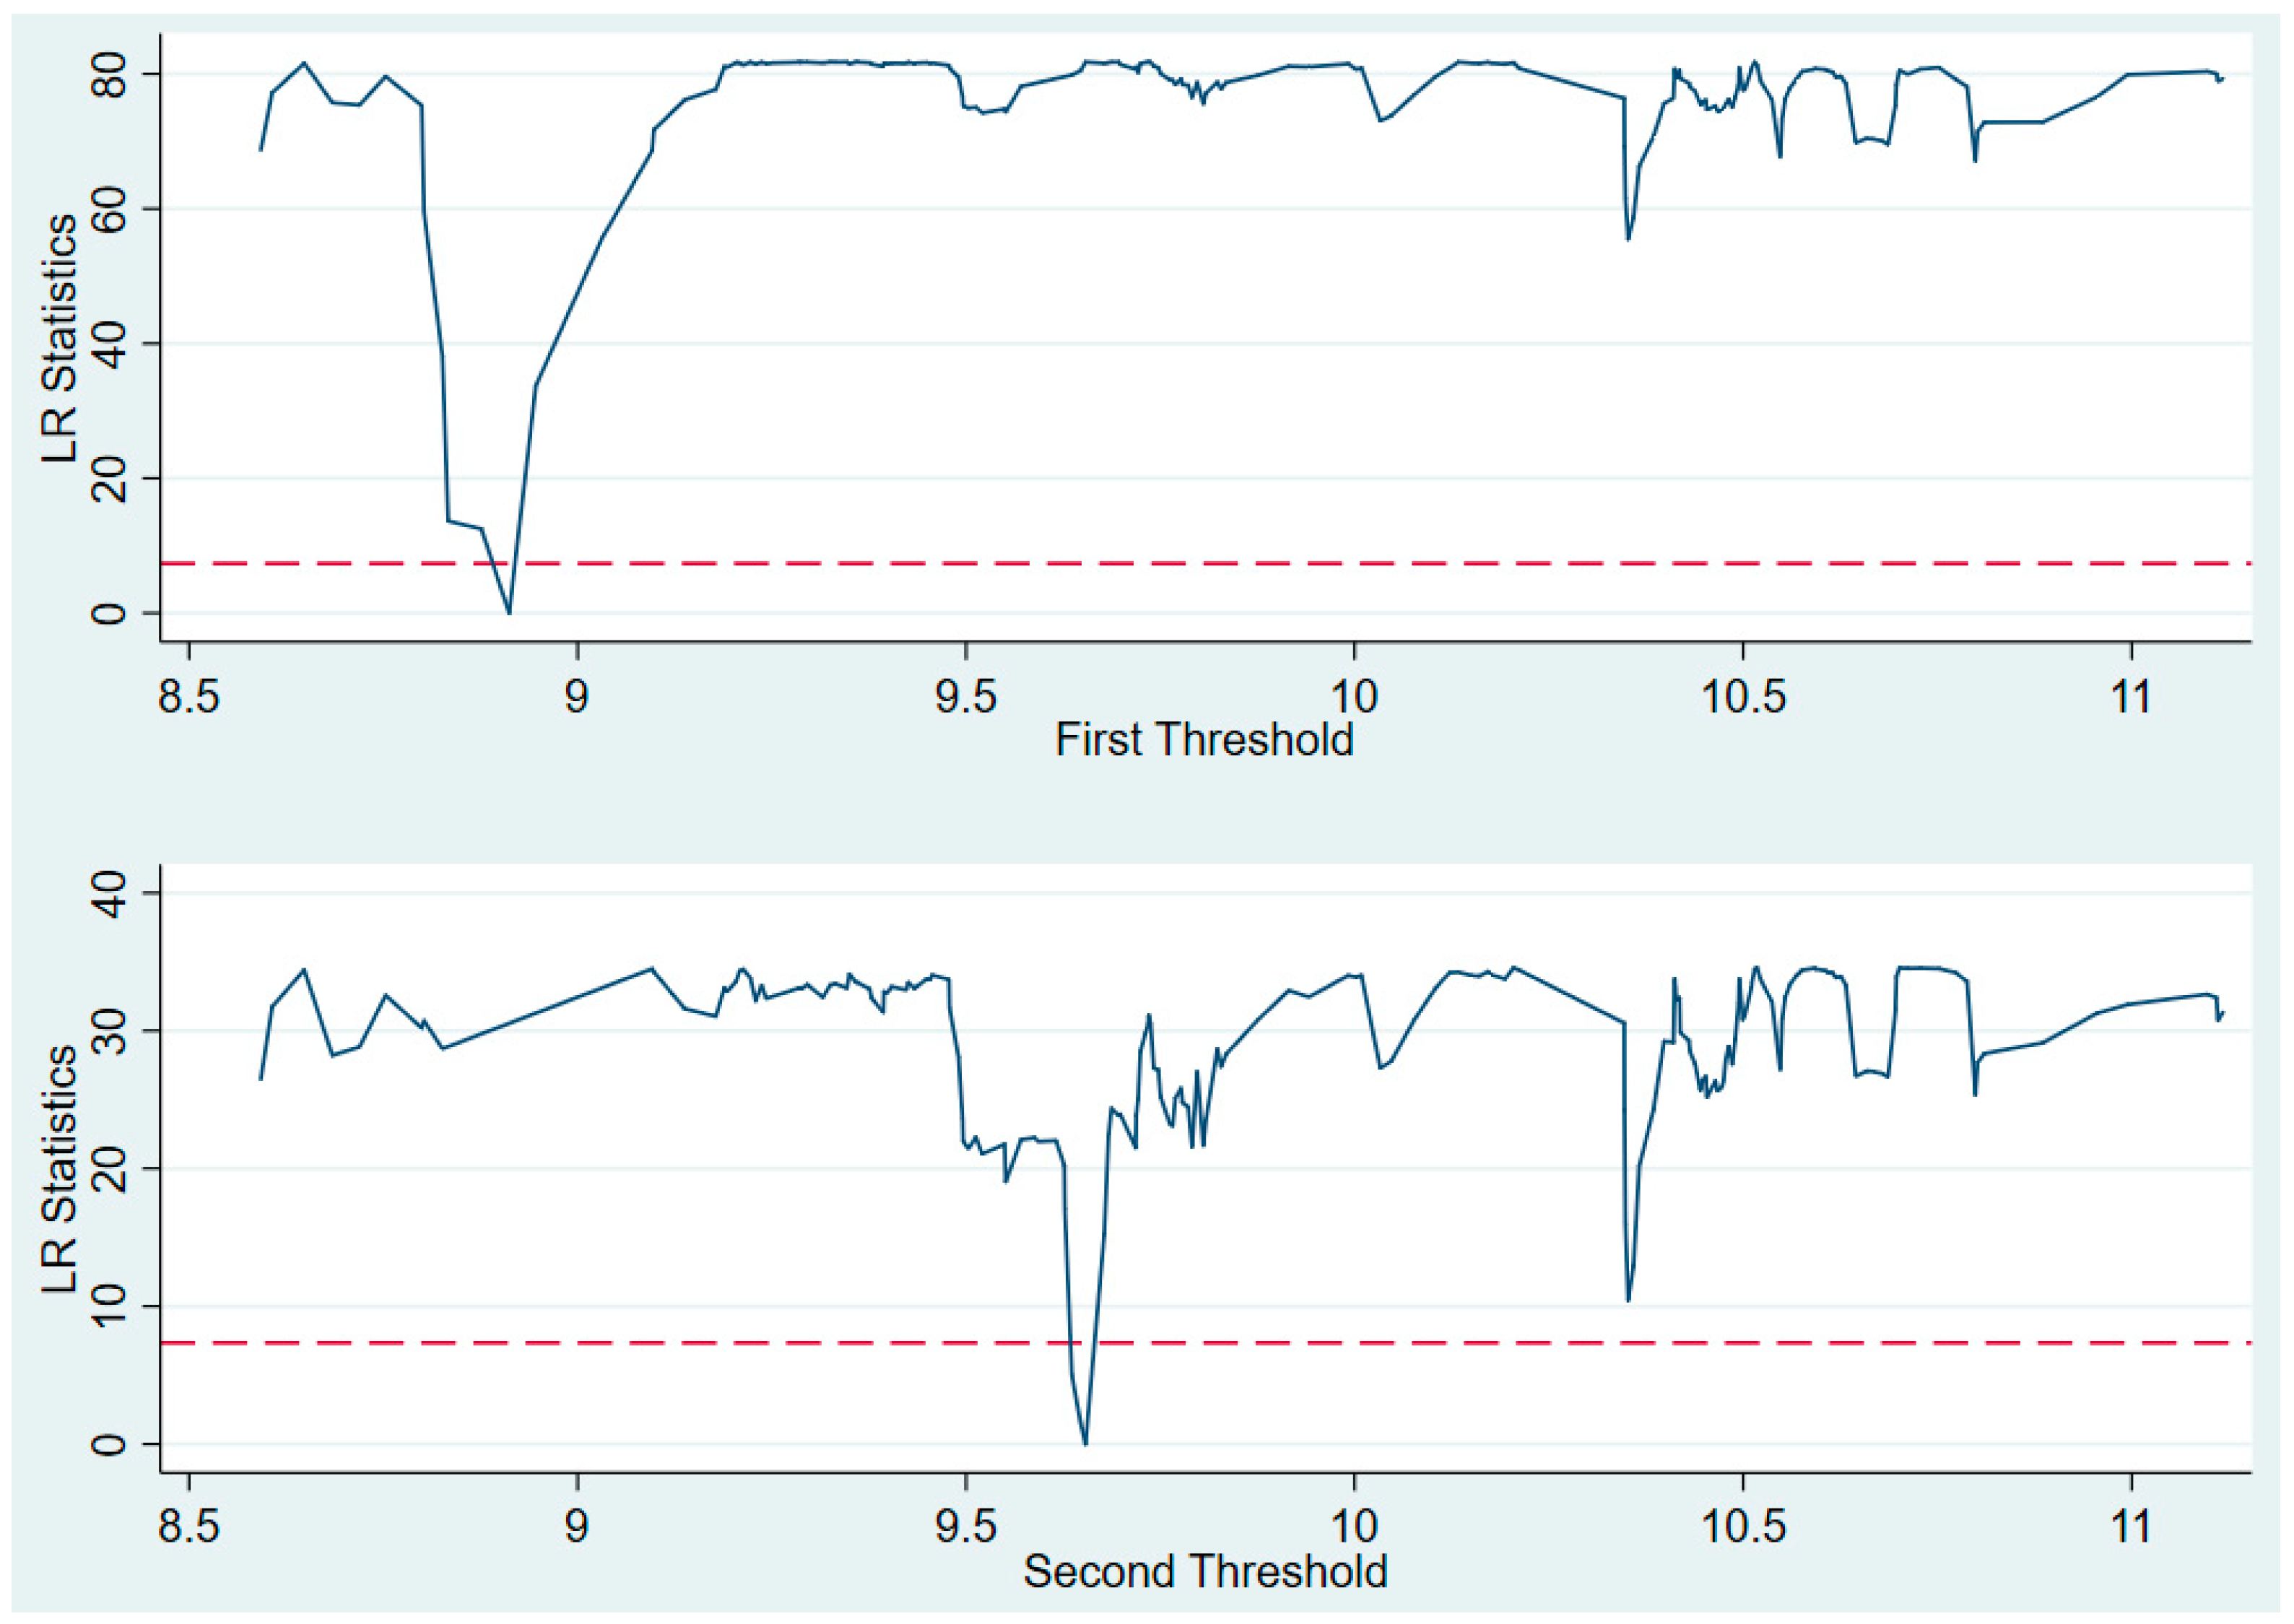
The authenticity test of threshold is mainly used to test whether the estimated value is equal to the true value. The authenticity test is performed by using the likelihood ratio test statistic (LR).
Figure 6 presents two LR maps of the lnpgdp threshold estimates, indicating that lnpgdp threshold estimates have passed the authenticity test within the 95% confidence interval. Therefore, there are two thresholds for lnpgdp, 8.912 and 9.647, respectively.

4.5.3. Results of Panel Threshold Regression

In this study, GDP per capita (lnpgdp) is taken as the threshold variable. The panel double threshold regression model is employed to measure the threshold effect of the digital economy on 3E efficiency. From the analysis above, we can see that there are two thresholds for lnpgdp, 8.912 and 9.647, respectively.
The impact of digital economy on 3E efficiency varies with different stages of economic development, which can be divided into three stages: (1) When lnpgdp < 8.91; that is, pgdp < EUR 7420. In this case, the elasticity of the digital economy development level to 3E efficiency is −0.159, with a significance level of 1%. This indicates that a 1% improvement in the digital economy development level can cause a 0.159% decrease in 3E efficiency. (2) When 8.91 < lnpgdp < 9.65; that is, 7420 < pgdp < 15,580 euro. In this case, the elasticity of the digital economy development level to 3E efficiency is −0.055, with a significance level of 1%. This indicates that a 1% improvement in the digital economy development level can cause a 0.055% decrease in 3E efficiency. (3) When lnpgdp > 9.65; that is, pgdp > 15,580 euro. In this case, the elasticity of the digital economy development level to 3E efficiency is 0.032, with a significance level of 1%. The coefficient at this point changes from negative to positive, indicating that with the development of the economy, when GDP per capita increases, the digital economy development level is not conducive to the improvement of 3E efficiency, but when the GDP per capita exceeds a threshold, the digital economy development level is conducive to the improvement of 3E efficiency.
Economic development will be accompanied by significant energy consumption, as when a country has a low level of economic development, the development of a digital economy requires significant investment in new technologies. This leads to significant energy consumption and carbon emissions, which affect the improvement of 3E efficiency. In addition, when a country has reached a certain level of economic development, the implementation of energy saving and emission reduction policies has matured, and the development of new technologies is relatively easy. At this stage, the development of the digital economy helps to promote green economic development with a positive impact on 3E efficiency. Therefore, different countries should make trade-offs between developing their digital economy and improving 3E efficiency based on their own development contexts.
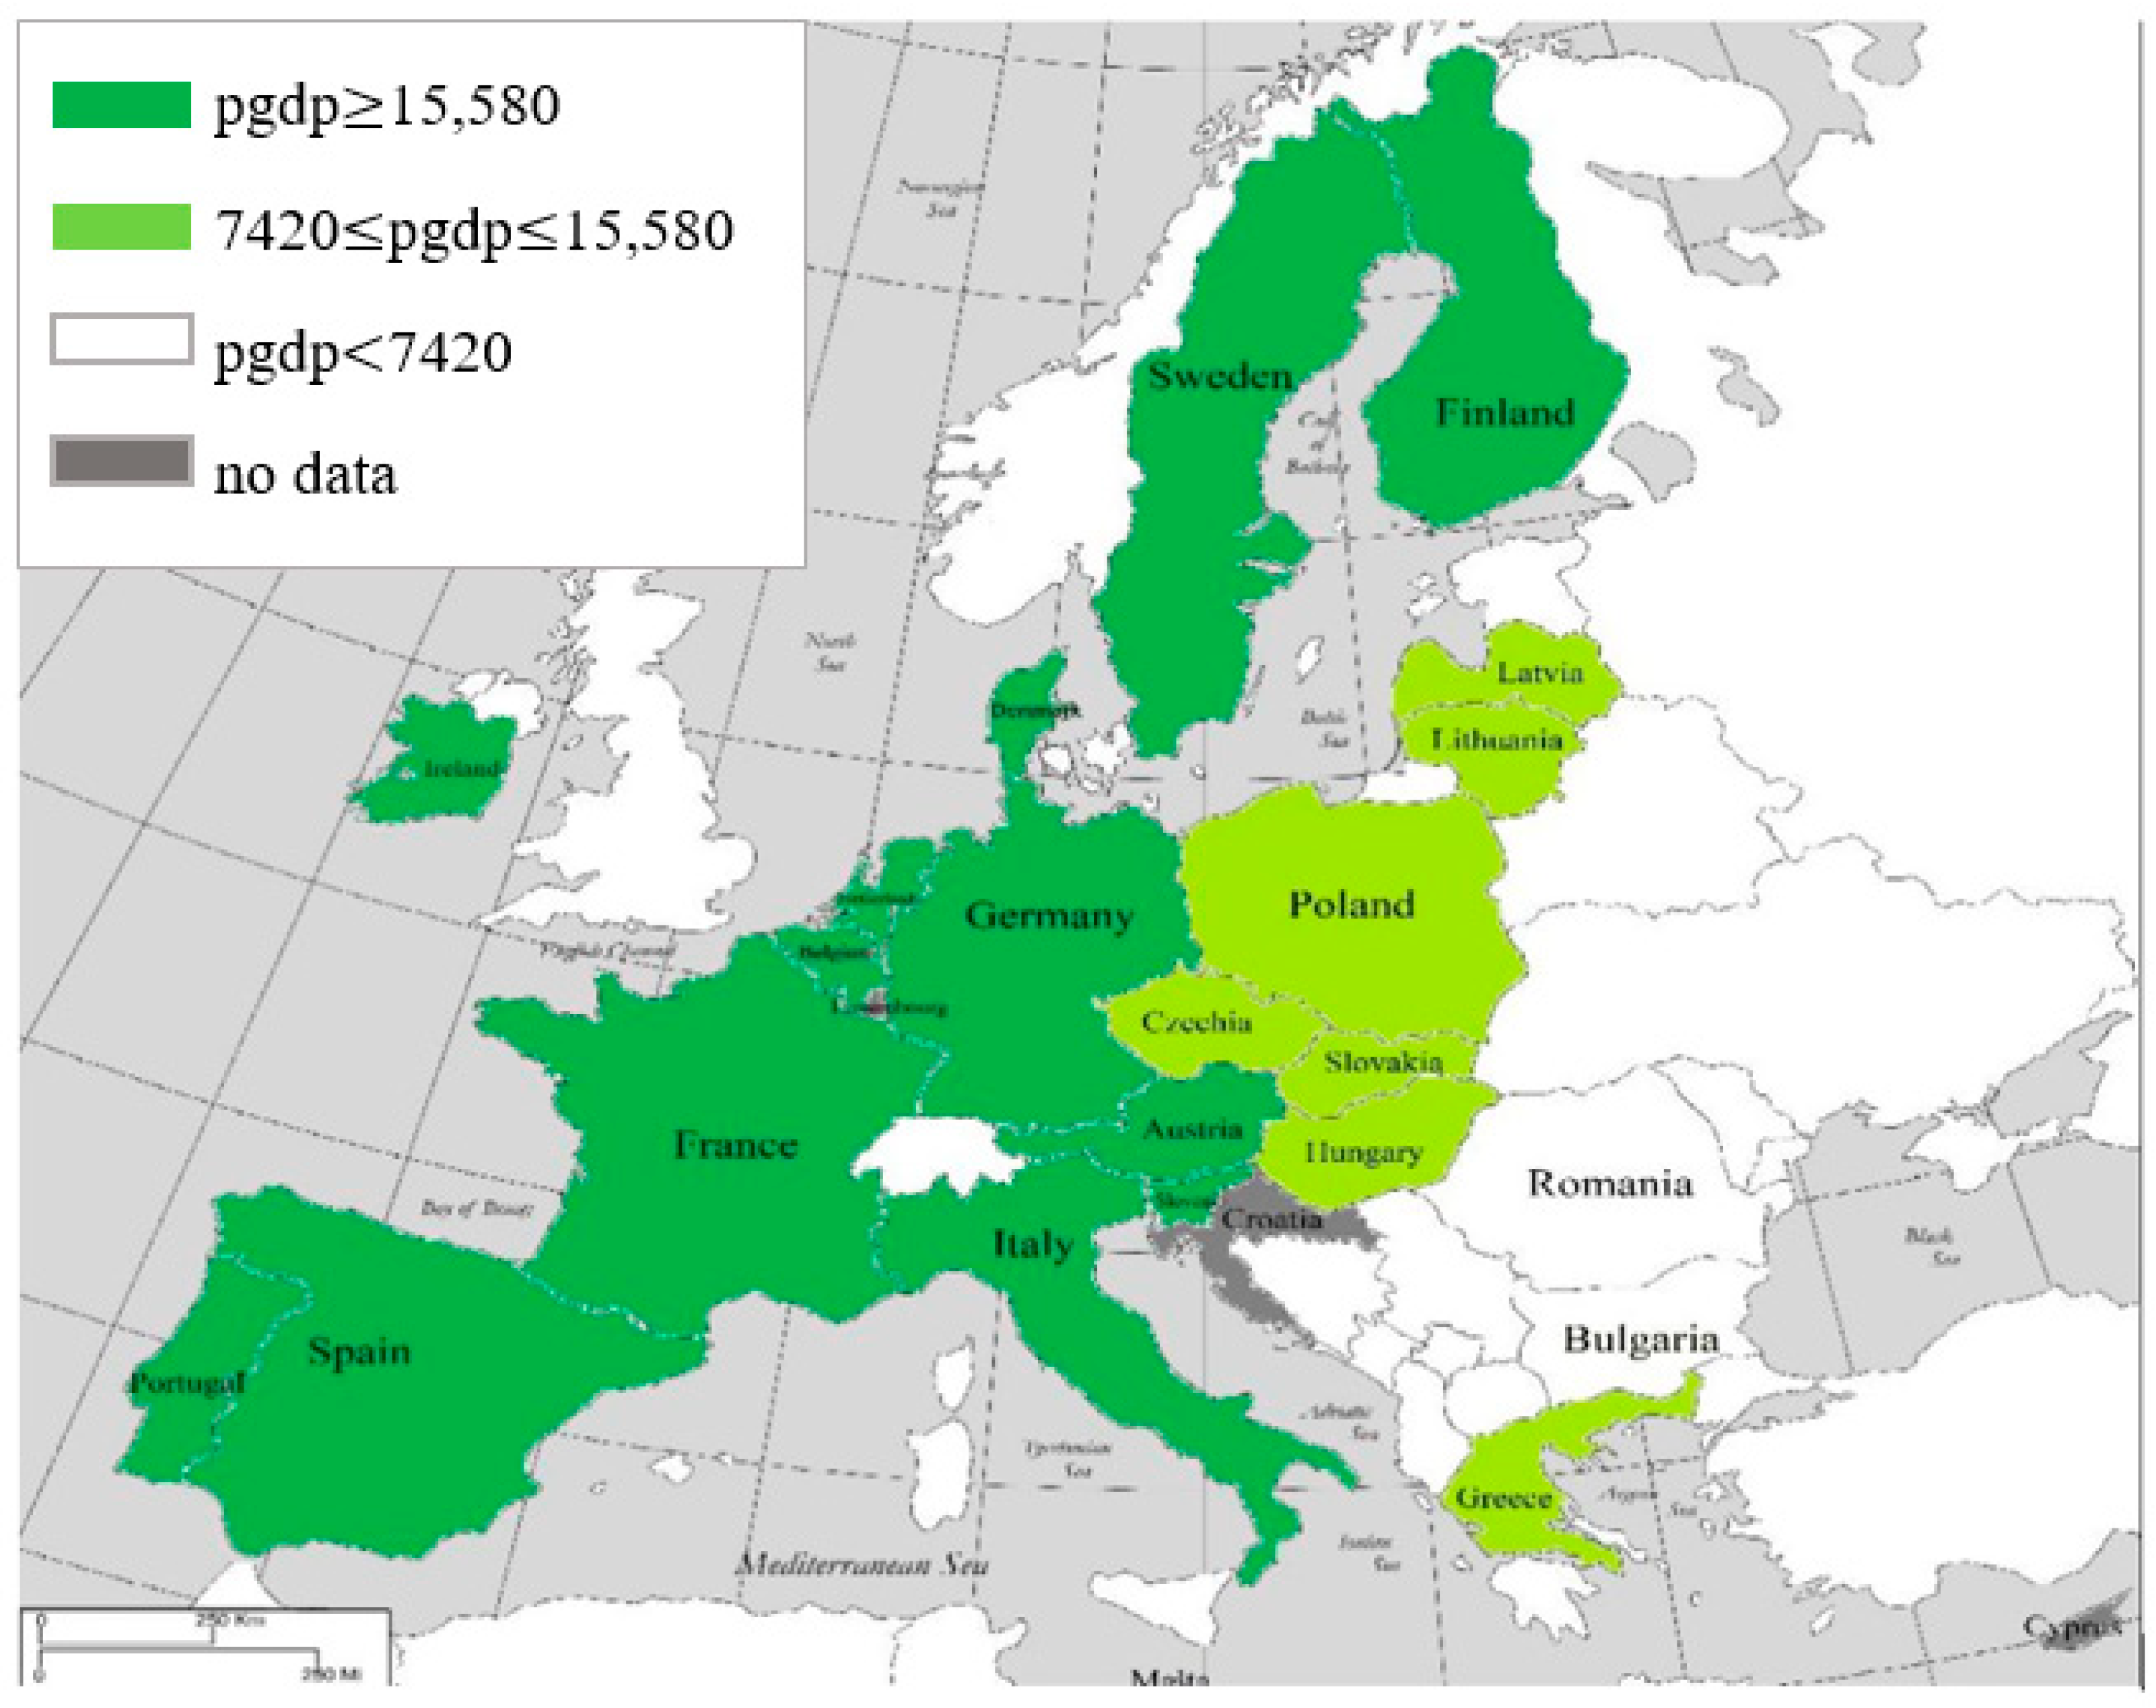
As can be seen from Figure 7, half of the countries in the EU have a GDP per capita of more than EUR 15,580, and most of these are distributed in central and western Europe. In those countries, the development of the digital economy is conducive to the improvement of 3E efficiency, while the digital economy development in other countries has a negative impact on 3E efficiency.
The findings of this study fill the gap in the current research on the relationship between the digital economy and 3E efficiency. The impact of the digital economy on 3E efficiency is inconclusive according to previous studies. The empirical results of this study indicate that the digital economy has a negative impact on 3E efficiency. This is reinforced by some previous studies. It is believed that the development, diffusion, and application of digital technologies and the construction of digital infrastructures have increased the demand for energy [23,24], which, in turn, has resulted in greenhouse gas emissions [29,30,31,32]. Coupled with the fact that the development of digital technologies is still immature, the economic benefits generated are not obvious. However, when GDP per capita increases, the impact of the digital economy on 3E efficiency changes from negative to positive. This is mainly due to the fact that the digital technology level tends to mature with the improvement of the economic development level. Countries with high economic development level are relatively more amenable to the development of new technologies. At this stage, the stable application of various new technologies and monitoring platforms will not only improve the energy efficiency and detect greenhouse gas emissions, but will also become a new way to achieve green growth gradually. In addition, complete digital infrastructure and stable digital technology will gradually increase its economic benefits. Some scholars believed that the magnitude of the impact of digital technologies on EU countries depended on the differences of digital infrastructure [55]; others considered that the positive impact of the digital economy is more pronounced for countries with a high economic development level [56,57].

5. Conclusions

This study examines the relationship between the digital economy and 3E efficiency. It is assumed that the digital economy affects 3E efficiency directly and indirectly (via economic growth). In order to verify this hypothesis, an empirical analysis on the relationship between the digital economy, economic growth, and 3E efficiency is conducted, using panel data for 24 EU countries for the years from 2011 to 2019. Each country’s 3E efficiency and digital economy development level is measured by using a complete 3E efficiency variable system and a digital economy variable system. The main findings are as follows.
Firstly, EU countries have paid more attention to the sustainable development of the “Energy–Environmental–Economic” system. Therefore, we used the SBM model with undesirable output to measure the 3E efficiency of EU countries. The efficiency score for each country has been estimated by taking economy, environment, and energy into account. Overall, the 3E efficiency of the EU showed an upward trend from 2011 to 2019. Among EU countries, Ireland, Sweden, Poland, Greece, and Italy have achieved the highest 3E efficiency.
Secondly, the digital economy development level of EU countries is measured by using an entropy method with a digital economy development variable system. The digital economy level of EU countries is on the rise, and countries with a high level of digital economy are Germany, the Netherlands, Sweden, Finland, France, Denmark, and Ireland.
Finally, the relationships between digital economy, economic growth, and 3E efficiency are examined by using panel regression, the intermediary effect model, and the threshold model. In terms of the influencing factors, energy consumption structure (es), environmental protection investment (epi), and the level of urbanization (ur) can improve 3E efficiency. The level of government intervention impedes the improvement of 3E efficiency to a certain extent. In addition, digital economy has direct and indirect (through economic growth) influences on 3E efficiency. When GDP per capita exceeds EUR 15,580, the coefficient at this point changes from negative to positive, indicating that with the development of economy, the digital economy development level is conducive to the improvement of 3E efficiency after GDP per capita exceeds a threshold.
Based on the findings above, this implies that EU countries should adopt different strategies in order to attain a balance between economic growth and sustainable development. Those in Central and Western Europe are positioned favorably for digital economy development and therefore can take advantage of the improving 3E efficiency that comes with it. On the other hand, some countries in Eastern Europe may find that developing their digital economies will not necessarily yield better 3E efficiency. Consequently, they should focus on maintaining a delicate balance between both digital economy development and 3E efficiency, while striving towards a sustainable development model that works best for them.
In addition, there is still some limitations of this paper. The scope of this study is limited to EU countries due to the availability and consistency of data. Therefore, it is unclear whether the findings of this study would apply to other countries or regions. In future studies, we can further expand the scope of our research, selecting more regions with different performances in energy, economic, and environmental aspects to explore the difference in the impact of the development level of the digital economy on 3E efficiency in different countries and regions.
Author Contributions

Conceptualization, S.L. and L.W.; indicator system, S.L.; methodology, W.W.; software, W.W.; validation, S.L., L.W., G.W. and W.W.; writing—original draft preparation, S.L. and W.W.; writing—review and editing, L.W. and W.W.; supervision, S.L. and L.W. All authors have read and agreed to the published version of the manuscript.

Funding

This research received no external funding.

Institutional Review Board Statement

Not applicable.

Informed Consent Statement

Not applicable.

Data Availability Statement

All the raw data used in this study are obtained from publicly available official data sources, including the EU KLEMS database, World Development Indicators (WDI), International Telecommunication Union (ITU), E-Government Knowledgebase (EGOVKB), and World Intellectual Property Organization (WIPO).

Conflicts of Interest

The authors declare no conflict of interest.

References

  1. D’Adamo, I.; Gastaldi, M.; Morone, P. Economic sustainable development goals: Assessments and perspectives in Europe. J. Clean. Prod. 2022, 354, 131730. [Google Scholar] [CrossRef]
  2. Knäble, D.; Puente, E.D.Q.; Pérez-Cornejo, C.; Baumgärtler, T. The impact of the circular economy on sustainable development: A European panel data approach. Sustain. Prod. Consum. 2022, 34, 233–243. [Google Scholar] [CrossRef]
  3. Henderson, K.; Loreau, M. A model of Sustainable Development Goals: Challenges and opportunities in promoting human well-being and environmental sustainability. Ecol. Model. 2023, 475, 110164. [Google Scholar] [CrossRef]
  4. Nham, N.T.H.; Ha, L.T. Making the circular economy digital or the digital economy circular? Empirical evidence from the European region. Technol. Soc. 2022, 70, 102023. [Google Scholar] [CrossRef]
  5. Brundtland, G.H. Report of the World Commission on Environment and Development: Our Common Future; Oxford University Press: Oxford, UK, 1987. [Google Scholar]
  6. Biermann, F.; Kanie, N.; Kim, R.E. Global governance by goal-setting: The novel approach of the UN Sustainable Development Goals. Curr. Opin. Environ. Sustain. 2017, 26, 26–31. [Google Scholar] [CrossRef]
  7. Bogers, M.; Biermann, F.; Kalfagianni, A.; Kim, R.E.; Treep, J.; de Vos, M.G. The impact of the Sustainable Development Goals on a network of 276 international organizations. Glob. Environ. Chang. 2022, 76, 102567. [Google Scholar] [CrossRef]
  8. Cazcarro, I.; García-Gusano, D.; Iribarren, D.; Linares, P.; Romero, J.C.; Arocena, P.; Arto, I.; Banacloche, S.; Lechón, Y.; Miguel, L.J.; et al. Energy-socio-economic-environmental modelling for the EU energy and post-COVID-19 transitions. Sci. Total. Environ. 2021, 805, 150329. [Google Scholar] [CrossRef] [PubMed]
  9. Zhang, W.; Liu, X.; Wang, D.; Zhou, J. Digital economy and carbon emission performance: Evidence at China’s city level. Energy Policy 2022, 165, 112927. [Google Scholar] [CrossRef]
  10. A Digital Agenda for Europe; European Commission: Brussels, Belgium, 2010.
  11. The Age of Artificial Intelligence Towards a European Strategy for Human-Centric Machines; European Commission: Brussels, Belgium, 2018.
  12. Towards a Thriving Data-Driven Economy; European Commission: Brussels, Belgium, 2014.
  13. Bukht, R.; Heeks, R. Defining, Conceptualising and Measuring the Digital Economy. Int. Organ. Res. J. 2018, 13, 143–172. [Google Scholar] [CrossRef]
  14. Khalatbari-Soltani, S.; Marques-Vidal, P. The economic cost of hospital malnutrition in Europe; a narrative review. Clin. Nutr. ESPEN 2015, 10, e89–e94. [Google Scholar] [CrossRef] [PubMed] [Green Version]
  15. Schöggl, J.-P.; Rusch, M.; Stumpf, L.; Baumgartner, R.J. Implementation of digital technologies for a circular economy and sustainability management in the manufacturing sector. Sustain. Prod. Consum. 2023, 35, 401–420. [Google Scholar] [CrossRef]
  16. Moreno, M.; Charnley, F. Can Re-Distributed Manufacturing and Digital Intelligence Enable a Regenerative Economy? An Integrative Literature Review. In Sustainable Design and Manufacturing 2016; Setchi, R., Howlett, R.J., Liu, Y., Theobald, P., Eds.; Smart Innovation, Systems and Technologies; Springer International Publishing: Cham, Switzerland, 2016; Volume 52, pp. 563–575. ISBN 978-3-319-32096-0. [Google Scholar]
  17. Pagoropoulos, A.; Pigosso, D.C.; McAloone, T.C. The Emergent Role of Digital Technologies in the Circular Economy: A Review. Procedia CIRP 2017, 64, 19–24. [Google Scholar] [CrossRef] [Green Version]
  18. Winskel, M.; Kattirtzi, M. Transitions, disruptions and revolutions: Expert views on prospects for a smart and local energy revolution in the UK. Energy Policy 2020, 147, 111815. [Google Scholar] [CrossRef]
  19. Zhang, S.; Ma, X.; Cui, Q. Assessing the Impact of the Digital Economy on Green Total Factor Energy Efficiency in the Post-COVID-19 Era. Front. Energy Res. 2021, 9, 798922. [Google Scholar] [CrossRef]
  20. Chen, X.; Despeisse, M.; Johansson, B. Environmental Sustainability of Digitalization in Manufacturing: A Review. Sustainability 2020, 12, 10298. [Google Scholar] [CrossRef]
  21. Niu, Y.; Lin, X.; Luo, H.; Zhang, J.; Lian, Y. Effects of Digitalization on Energy Efficiency: Evidence From Zhejiang Province in China. Front. Energy Res. 2022, 10, 847339. [Google Scholar] [CrossRef]
  22. Zhang, L.; Mu, R.; Zhan, Y.; Yu, J.; Liu, L.; Yu, Y.; Zhang, J. Digital economy, energy efficiency, and carbon emissions: Evidence from provincial panel data in China. Sci. Total. Environ. 2022, 852, 158403. [Google Scholar] [CrossRef] [PubMed]
  23. Danish; Khan, N.; Baloch, M.A.; Saud, S.; Fatima, T. The effect of ICT on CO2 emissions in emerging economies: Does the level of income matters? Environ. Sci. Pollut. Res. 2018, 25, 22850–22860. [Google Scholar] [CrossRef] [PubMed]
  24. Coyne, B.; Denny, E. Applying a Model of Technology Diffusion to Quantify the Potential Benefit of Improved Energy Efficiency in Data Centres. Energies 2021, 14, 7699. [Google Scholar] [CrossRef]
  25. Dong, F.; Hu, M.; Gao, Y.; Liu, Y.; Zhu, J.; Pan, Y. How does digital economy affect carbon emissions? Evidence from global 60 countries. Sci. Total. Environ. 2022, 852, 158401. [Google Scholar] [CrossRef] [PubMed]
  26. Yi, M.; Liu, Y.; Sheng, M.S.; Wen, L. Effects of digital economy on carbon emission reduction: New evidence from China. Energy Policy 2022, 171, 113271. [Google Scholar] [CrossRef]
  27. Zhang, J.; Lyu, Y.; Li, Y.; Geng, Y. Digital economy: An innovation driving factor for low-carbon development. Environ. Impact Assess. Rev. 2022, 96, 106821. [Google Scholar] [CrossRef]
  28. Ma, Q.; Tariq, M.; Mahmood, H.; Khan, Z. The nexus between digital economy and carbon dioxide emissions in China: The moderating role of investments in research and development. Technol. Soc. 2022, 68, 101910. [Google Scholar] [CrossRef]
  29. Park, Y.; Meng, F.; Baloch, M.A. The effect of ICT, financial development, growth, and trade openness on CO2 emissions: An empirical analysis. Environ. Sci. Pollut. Res. 2018, 25, 30708–30719. [Google Scholar] [CrossRef] [PubMed]
  30. Raheem, I.D.; Tiwari, A.K.; Balsalobre-Lorente, D. The role of ICT and financial development in CO2 emissions and economic growth. Environ. Sci. Pollut. Res. 2019, 27, 1912–1922. [Google Scholar] [CrossRef] [PubMed] [Green Version]
  31. De Sousa Jabbour, A.B.L.; Jabbour, C.J.C.; Foropon, C.; Godinho Filho, M. When titans meet—Can industry 4.0 revolutionise the environmentally-sustainable manufacturing wave? The role of critical success factors. Technol. Forecast. Soc. Chang. 2018, 132, 18–25. [Google Scholar] [CrossRef]
  32. Su, C.-W.; Xie, Y.; Shahab, S.; Faisal, C.M.N.; Hafeez, M.; Qamri, G.M. Towards Achieving Sustainable Development: Role of Technology Innovation, Technology Adoption and CO2 Emission for BRICS. Int. J. Environ. Res. Public Health 2021, 18, 277. [Google Scholar] [CrossRef]
  33. Nizam, H.A.; Zaman, K.; Khan, K.B.; Batool, R.; Khurshid, M.A.; Shoukry, A.M.; Sharkawy, M.A.; Aldeek, F.; Khader, J.; Gani, S. Achieving environmental sustainability through information technology: “Digital Pakistan” initiative for green development. Environ. Sci. Pollut. Res. 2020, 27, 10011–10026. [Google Scholar] [CrossRef]
  34. Wu, H.; Hao, Y.; Ren, S.; Yang, X.; Xie, G. Does internet development improve green total factor energy efficiency? Evidence from China. Energy Policy 2021, 153, 112247. [Google Scholar] [CrossRef]
  35. Charnes, A.; Cooper, W.W.; Rhodes, E. Measuring the efficiency of decision making units. Eur. J. Oper. Res. 1978, 2, 429–444. [Google Scholar] [CrossRef]
  36. Banker, R.D.; Charnes, A.; Cooper, W.W.; Swarts, J.; Thomas, D.A. An Introduction to Data Envelopment Analysis with Some of Its Models and Their Uses. Res. Govern. Nonprofit Account. 1989, 5, 125–163. [Google Scholar]
  37. Fukuyama, H.; Weber, W.L. A directional slacks-based measure of technical inefficiency. Socio-Econ. Plan. Sci. 2009, 43, 274–287. [Google Scholar] [CrossRef]
  38. Zhou, P.; Ang, B.W.; Wang, H. Energy and CO2 emission performance in electricity generation: A non-radial directional distance function approach. Eur. J. Oper. Res. 2012, 221, 625–635. [Google Scholar] [CrossRef]
  39. Tone, K. A Slacks-Based Measure of Efficiency in Data Envelopment Analysis. Eur. J. Oper. Res. 2001, 130, 498–509. [Google Scholar] [CrossRef] [Green Version]
  40. Tone, K. Dealing with Undesirable Outputs in DEA: A Slacks-Based Measure (SBM) Approach. Nippon. Opereshonzu Risachi Gakkai Shunki Kenkyu Happyokai Abus. 2004, 2004, 44–45. [Google Scholar]
  41. MacKinnon, D.P.; Krull, J.L.; Lockwood, C.M. Equivalence of the Mediation, Confounding and Suppression Effect. Prev. Sci. 2000, 1, 173–181. [Google Scholar] [CrossRef] [PubMed]
  42. Wen, Z.; Chang, L.; Hau, K.-T.; Liu, H. Testing and Application of the Mediating Effects. Acta Psychol. Sin. 2004, 36, 614–620. [Google Scholar]
  43. Preacher, K.J.; Hayes, A.F. SPSS and SAS procedures for estimating indirect effects in simple mediation models. Behav. Res. Methods Instrum. Comput. 2004, 36, 717–731. [Google Scholar] [CrossRef] [PubMed] [Green Version]
  44. Hansen, B.E. Threshold effects in Non-Dynamic Panels: Estimation, Testing, and Inference. J. Econom. 1999, 93, 345–368. [Google Scholar] [CrossRef] [Green Version]
  45. Li, S.; Diao, H.; Wang, L.; Li, C. Energy Efficiency Measurement: A VO TFEE Approach and Its Application. Sustainability 2021, 13, 1605. [Google Scholar] [CrossRef]
  46. Li, S.; Wang, W.; Diao, H.; Wang, L. Measuring the Efficiency of Energy and Carbon Emissions: A Review of Definitions, Models, and Input-Output Variables. Energies 2022, 15, 962. [Google Scholar] [CrossRef]
  47. Goldsmith, R.W. A Perpetual Inventory of National Wealth. Natl. Bureau Econ. Res. 1951, 14, 5–73. [Google Scholar]
  48. Raggad, B. Economic development, energy consumption, financial development, and carbon dioxide emissions in Saudi Arabia: New evidence from a nonlinear and asymmetric analysis. Environ. Sci. Pollut. Res. 2020, 27, 21872–21891. [Google Scholar] [CrossRef] [PubMed]
  49. Pani, R.; Mukhopadhyay, U. Identifying the major players behind increasing global carbon dioxide emissions: A decomposition analysis. Environmentalist 2010, 30, 183–205. [Google Scholar] [CrossRef]
  50. Balsalobre-Lorente, D.; Shahbaz, M.; Roubaud, D.; Farhani, S. How economic growth, renewable electricity and natural resources contribute to CO2 emissions? Energy Policy 2018, 113, 356–367. [Google Scholar] [CrossRef] [Green Version]
  51. Pata, U.K. The influence of coal and noncarbohydrate energy consumption on CO2 emissions: Revisiting the environmental Kuznets curve hypothesis for Turkey. Energy 2018, 160, 1115–1123. [Google Scholar] [CrossRef]
  52. Yu, B.; Fang, D.; Yu, H.; Zhao, C. Temporal-spatial determinants of renewable energy penetration in electricity production: Evidence from EU countries. Renew. Energy 2021, 180, 438–451. [Google Scholar] [CrossRef]
  53. Xu, L.; Fan, M.; Yang, L.; Shao, S. Heterogeneous green innovations and carbon emission performance: Evidence at China’s city level. Energy Econ. 2021, 99, 105269. [Google Scholar] [CrossRef]
  54. Yao, X.; Zhang, X.; Guo, Z. The tug of war between local government and enterprises in reducing China’s carbon dioxide emissions intensity. Sci. Total. Environ. 2019, 710, 136140. [Google Scholar] [CrossRef]
  55. Toader, E.; Firtescu, B.N.; Roman, A.; Anton, S.G. Impact of Information and Communication Technology Infrastructure on Economic Growth: An Empirical Assessment for the EU Countries. Sustainability 2018, 10, 3750. [Google Scholar] [CrossRef] [Green Version]
  56. Niebel, T. ICT and economic growth—Comparing developing, emerging and developed countries. World Dev. 2018, 104, 197–211. [Google Scholar] [CrossRef] [Green Version]
  57. Myovella, G.; Karacuka, M.; Haucap, J. Digitalization and economic growth: A comparative analysis of Sub-Saharan Africa and OECD economies. Telecommun. Policy 2019, 44, 101856. [Google Scholar] [CrossRef]
Figure 1. Average digital economy development in 24 countries, 2011–2019.
Sustainability 15 05661 g001
Figure 2. Average development level of digital economy, 2011–2019.
Sustainability 15 05661 g002
Figure 3. Overall 3E efficiency scores from 2011–2019.
Sustainability 15 05661 g003
Figure 4. Average 3E efficiency scores from 2013–2019.
Sustainability 15 05661 g004
Figure 5. Average change of 3E efficiency in EU countries.
Sustainability 15 05661 g005
Figure 6. Authenticity test of the thresholds. Source: Own compilation.
Sustainability 15 05661 g006
Figure 7. The regional impact of digital economy on 3E efficiency through economic growth. Source: Own compilation.
Sustainability 15 05661 g007
Table 1. Variable system of 3E efficiency.
VariableUnit of Measure
InputCapital stockMillion euro in 2011 constant price
Labornumber
Energy consumptionGigawatt/hour
Intermediate materials and services except energyMillion euro in 2011 constant price
Desirable outputValue of outputMillion euro in 2011 constant price
Undesirable outputGreenhouse gasesTonnes in CO2 equivalent
Source: EU KLEMS database.
Table 2. Variable system of digital economy development level.
DimensionsVariablesData Source
Digital economy infrastructureIndividuals using the internet (% of population)ITU
Fixed-telephone subscriptions (per 100 inhabitants)ITU
Fixed broadband subscriptions (per 100 inhabitants)ITU
Mobile cellular subscriptions (per 100 people)ITU
Active mobile-broadband subscriptions (per 100 inhabitants)ITU
Digital economy innovation environmentResearch and development expenditure (% of GDP)WDI
Scientific and technical journal articlesWDI
School enrollment, tertiary (% gross)WDI
Global Innovation IndexWIPO
National digital competitivenessICT goods exports (% of total goods exports)WDI
Government E-participation indexEGOVKB
Government online Service indexEGOVKB
ICT service exports (% of service exports)WDI
Source: ITU, WDI, WIPO, EGOVKB database.
Table 3. Variable selection and definition.
VariablesSymbolNameIndictor
Dependent variableeee3E efficiencyCalculated according to the variable system of 3E efficiency
Independent variabledigDigital economy development levelCalculated according to the variable system of the digital economy
Mediating variablepgdpEconomic growthGDP per capita
Control
variables
esEnergy consumption structureThe ratio of renewable energy consumption relative to total primary energy consumption
epiEnvironment protectionThe ratio of environment protection investment relative to GDP
urThe level of urbanizationThe ratio of urban population relative to total population
govThe level of government interventionThe ratio of government consumption expenditure relative to GDP
Source: Own compilation.
Table 4. Statistical description of variables.
VariableObsMeanMinMaxStd.
eee2160.8760.6941.0000.105
dig2160.3570.1190.6260.126
pgdp21625,833.056532069,49015,520.250
es21623.104.762.413.8
epi2160.5220.1002.1000.321
ur21672.552.998.012.0
gov21645.524.362.87.2
Source: Own compilation.
Table 5. The multicollinearity test results of variables.
VariablesSymbolVIF
3E efficiencyeee-
Digital economy development leveldig1.95
Energy consumption structurees1.25
Economic growthepi1.21
Environment protectionur1.68
The level of urbanizationgov1.32
The level of government interventionpgdp2.47
Source: Own compilation.
Table 6. The unit root and multicollinearity test results of variables.
ADFLLC (Trend and Demean)
eee−11.780 ***−8.0252 ***
[0.000][0.000]
lndig−16.155 ***−14.964 ***
[0.000][0.000]
lnes−6.477 ***−11.335 ***
[0.004][0.000]
lnpgdp−15.082 ***−8.332 ***
[0.000][0.000]
lnepi−7.357 ***−9.765 ***
[0.076][0.076]
lnur−5.709 ***−4.4603 ***
[0.076][0.076]
lngov−9.769 ***−9.215 ***
[0.076][0.076]
*** denotes significance at the 1% level. The figures in [] are the p-values of the corresponding test statistics.
Table 7. Benchmark regression results.
Model (1)Model (2)
lndig−0.048 * (−1.78)−0.071 ** (−2.47)
[0.076][0.014]
lnes 0.040 * (1.64)
[0.100]
lnepi 0.027 *** (2.78)
[0.005]
lnur 0.246 ** (1.91)
[0.050]
lngov −0.101 ** (−2.26)
[0.024]
Constant0.828 *** (23.14)0.892 *** (11.82)
[0.000][0.000]
***, **, and * denote significance at the 1%, 5%, and 10% levels, respectively. The figures in () indicate the t-value; the figures in [] are the p-values of the corresponding test statistics.
Table 8. Robustness test results.
Model (3) with Substitute Variable Model (4) with Shorten Time
lndig−0.065 ** (−2.23)lndig−0.053 * (−1.62)
[0.026][0.096]
lnepi0.025 ** (2.53)lnepi0.027 *** (2.83)
[0.011][0.005]
lnpd0.058 * (1.84)lnur0.023 * (1.70)
[0.066][0.088]
lnes0.061 ** (2.19)lnes0.039 (1.48)
[0.026][0.139]
lngov−0.083 * (−1.79)lngov−0.109 ** (−2.32)
[0.074][0.020]
Constant0.597 *** (4.15)Constant0.896 *** (11.16)
[0.000][0.000]
***, **, and * denote significance at the 1%, 5%, and 10% levels, respectively. The figures in () indicate the t-value; the figures in [] are the p-values of the corresponding test statistics.
Table 9. Bootstrap test of economic development.
Observed
Coef.
p Bootstrap
Std. Err.
Z 95% Confidence Interval
Indirect Effect 0.058 *** 0.000 0.017 3.45 0.025 0.091
Direct Effect −0.079 *** 0.004 0.029 −2.76 −0.136 −0.023
*** denotes significance at the 1% level.
Table 10. Regression on the mediating effect of economic development.
DEPVAR = eeeDEPVAR = lnpgdpDEPVAR = eee
Model (5)Model (6)Model (7)
Lndig−0.071 ** (−2.47)0.098 *** (2.64)−0.053 * (−1.84)
[0.014][0.009][0.066]
Lnes0.040 * (1.64)0.144 *** (3.79)0.077 *** (2.64)
[0.100][0.000][0.008]
Lnpgdp −0.170 ** (−2.40)
[0.016]
Lnepi0.027 *** (2.78)−0.059 *** (−5.08)0.019 ** (2.02)
[0.005][0.000][0.043]
Lnur0.246 ** (1.91)1.020 ** (2.31)0.636 *** (2.62)
[0.050][0.022][0.009]
Lngov−0.101 ** (−2.26)−0.420 *** (−7.06)−0.149 *** (−2.97)
[0.024][0.000][0.003]
Constant0.892 *** (11.82)10.272 *** (60.76)4.403 *** (6.47)
[0.000][0.000][0.000]
Sobel test 0.058 *** (z = 3.056)
[0.002]
Aroian test 0.058 *** (z = 3.047)
[0.002]
Goodman test 0.058 ***(z = 33.065)
[0.002]
***, **, and * denote significance at the 1%, 5%, and 10% levels, respectively. The figures in () indicate the t-value; the figures in [] are the p-values of the corresponding test statistics.
Table 11. Results of the threshold effect significance test.
ModelsThreshold EstimatesF Valuep Value
Single threshold8.91267.49 ***0.003
Double threshold9.64734.25 *0.093
Triple threshold10.35930.120.457
*** and * denote significance at the 1% and 10% levels, respectively.
Disclaimer/Publisher’s Note: The statements, opinions and data contained in all publications are solely those of the individual author(s) and contributor(s) and not of MDPI and/or the editor(s). MDPI and/or the editor(s) disclaim responsibility for any injury to people or property resulting from any ideas, methods, instructions or products referred to in the content.