Article

Experimental and Numerical Investigation of the Flexural Behavior of Mortar Beams Strengthened with Recycled Plastic Mesh

1
Faculty of Engineering, Beirut Arab University, Beirut P.O. Box 11-5020, Lebanon
2
Faculty of Science and Engineering, University of Wolverhampton, Wolverhampton WV1 1LY, UK
3
Department of Civil and Environmental Engineering, Faculty of Engineering, Alexandria University, Alexandria 11 21511, Egypt
*
Authors to whom correspondence should be addressed.
Sustainability 2023, 15(7), 5640; https://doi.org/10.3390/su15075640
Submission received: 20 February 2023 / Revised: 16 March 2023 / Accepted: 21 March 2023 / Published: 23 March 2023

Abstract

:
The generation of plastic waste is increasing all over the world at an alarming rate, therefore raising concerns related to its disposal. As space for landfilling is becoming scarce and as incinerating the plastic waste leads to the release of toxic elements into the environment, recycling becomes a viable and an attractive option in pursuit of sustainable development. This paper investigates the flexural behavior of mortar beams reinforced with recycled plastic mesh. To achieve this objective, 27 mortar beams were prepared, with 24 of them containing waste plastic mesh with different void ratios and effective widths. All beams were cured for 28 days and then tested using a three-point bending test. Mid-span deflection was measured for each increment of load to obtain the load deflection curve. Moreover, a numerical simulation was performed on all mortar specimens using finite element software ABAQUS and a comparison was made with the experimental analysis. Test results showed that the addition of plastic mesh increased the flexural toughness and ductility of mortar beams. Furthermore, it was noticed that as the effective width ratio increased from 0 to 0.58, the ultimate capacity and flexural toughness increased. Beyond this level, a decrease was observed. On the other hand, the ductility index was proportional to the flexural toughness for all mesh effective width ratios. Comparing the ultimate capacity, flexural toughness and ductility index between the experimental and numerical data, there was a difference of up to 7%. This indicates that the numerical output can be a good predictor of the performance of plastic inside the mortar. Hence, using recycled plastic mesh could be recommended for improving the flexural performance of mortar beams, creating a sustainable composite.

1. Introduction

Mortar has always been a popular construction material because it can be used in several applications in construction projects (ceilings, interior walls, etc.) [1,2]. Its importance comes from the fact that it possesses good fire resistance and high compressive strength, which makes it suitable as a binding material in applications such as brick to brick in masonry walls, masonry footings, etc. [3]. Nevertheless, mortar shows major weakness in tension and flexure, and displays brittle behavior [4]. Therefore, mortar cracks under such loading conditions, thus limiting its continuous applications. Despite these shortcomings, construction demand is increasing, leading to the continuous development of cement mortar technology [5,6,7,8]. To improve the cracking resistance and the mechanical properties (tensile and flexural strength) of hardened mortar, fibers are added. The most common type of fibers added to reinforce the mortar matrix are steel, glass, carbon and waste plastic fibers [9,10,11,12,13,14,15]. These were found to reduce crack width and the number of cracks in mortar matrices because of their bridging effect, and because they increase the flexural toughness and ductility at failure [16,17].
Plastic material has become an integral part of daily modern lives as it is extensively used in industry and possesses numerous favorable attributes, such as user-friendly design and a long lifetime, as well as being lightweight and low density, etc. [18]. Nowadays, the world’s plastic production is about 400 million tons [19]. This number is increasing day by day and is expected to almost triple by 2060 [20]. Out of these, approximately 50% are thrown away after a single use (soft drink bottles, beverage bottles, packaging, etc.) This will ultimately generate a vast amount of plastic waste, which represents 12% of total solid waste [21]. Disposal of post-consumed waste plastic has always raised concerns among environmental agencies [22,23]. The three well-known procedures for handling this waste are: landfilling, incineration and recycling. Landfilling was and still is used in many countries. However, as waste plastic is bulky in nature and as space becomes scarce, landfilling has fallen out of favor [24]. During incineration many toxic elements are released into the air, creating serious environmental problems [25]. Therefore, recycling is considered the best choice to reduce environmental impact in terms of waste disposal, energy consumption and global warming [23]. By following this procedure, recycled waste plastics are transformed into useful products.
A vast amount of work has been conducted on the use of recycled waste plastic (particularly polyethylene terephthalate (PET)) in mortar and concrete [26,27,28,29,30,31,32,33,34,35,36,37]. In this work, plastic wastes were used either as a substitution or a partial replacement for coarse and fine aggregate, or as a plastic fiber (PF). The use of PF in concrete and mortar mixtures has numerous advantages. First of all, it suppresses the propagation of cracks, particularly in the post-cracking phase [38]. Secondly, it improves concrete’s mechanical properties (tensile and flexural strength) and, lastly, it ameliorates the impact resistance and increases the flexural toughness of concrete beams and slabs [39]. However, some works showed that PF negatively impacts the concrete’s compressive strength and its workability [40,41,42].
The flexural behavior of PET fiber on concrete and mortar beams was extensively studied by many researchers [43,44,45,46]. Ali et al. [39] studied the effect of PET concrete layered fiber (0.5% and 1% by volume) on the performance of concrete beams. They found a significant improvement in the ultimate capacity, flexural toughness and ductility of concrete beams using the layer distribution procedure. However, a decrease was noticed in the compressive strength and modulus of elasticity when the percentage of PET fibers increased above 0.5%. Alsaif et al. [47] examined, in their study, the flexural performance of mortar reinforced with a blend of waste fibers. They observed an enhancement of post-cracking strength and flexural toughness when 0.5% plastic fibers and 0.5% tire steel fibers (by volume) were added to the mixtures. Another study, conducted by Shaikh [48], focused on the flexural behavior of PET fibers on geopolymer composites. It found that 1.5% PET fiber displayed deflection hardening behavior in flexure, and an increase from 1 to 1.5% showed a decrease in the compressive strength of geopolymer composites. Irmawaty et al. [49] investigated the flexural performance of concrete beams by replacing coarse aggregates with PET fibers and comparing them with conventional concrete beams. Results indicated that the addition of PET waste to the mixture reduced the tensile strength by 42.5% and the compressive strength by 38.8%, compared to control specimen. Another study showed that the inclusion of PET waste (up to 15%) as a partial replacement for fine aggregate in concrete beams and slabs should be considered for structural applications [50]. A summary of a study conducted on PET-FRP strengthened concrete beams indicated that two laminates of PET-FRP showed a 47% flexural strength enhancement compared to non-strengthened beams and a 24–47% increase in load carrying capacity [51].
After many decades of research and development, 3D printing technology of cementitious materials is gaining attention in the field of construction [52]. This automated procedure consists, typically, of a layer by layer deposition of construction materials [53]. However, most 3D prints of cementitious materials have low tensile strength and are weak in their interlayer bond strength [54,55]. Therefore, their mechanical properties (post-peak load capacity and ductility) are significantly reduced [56]. Skoratko et al. [57] developed a gyroid 3D-printed plastic spatial element with the ultimate objective of replacing steel rebars with waste plastic for elements subjected to a low level of loadings such as lintels and transoms over doors and windows. Test results indicated that the flexural characteristics of mortar specimens were quasi-plastic and comparable to those of steel fiber reinforced concrete. Another study conducted by Lin [58] focused on the mechanical performance of 3D-printed mortar when acrylonitrile butadiene styrene (ABS) is used as interlayer reinforcements. It was found that adding ABS increased the ductility of all mortar matrices, even though a decrease in the peak compressive stresses was noticed on most specimens. Peng et al. [59] investigated the flexural behavior of 3D-printed elements strengthened with FRP materials. They noticed that the strengthening methods increased both the load between 179.5 and 604.5%, and the mid-span deflection by 40.8–225.8%. Furthermore, it was observed that the failure modes depend on the type and number of reinforcement layers. Another work by Junaid [60] focused on the flexural behavior and ductility of mortar beams reinforced with 3D-printed polymers. Experimental results showed that although 3D-printed thermoplastics improved mortar beams in terms of flexure and ductility, the surface morphology of the reinforcements is the most influential factor controlling these improvements.
The ultimate load, flexural strength, toughness and ductility of mortar composite are very important for its applications in the construction industry (buildings, infrastructures). In a previous investigation by the authors [43], the flexural behavior of concrete beams containing plastic mesh was investigated. To the authors’ best knowledge, the inclusion of plastic mesh in mortar is not well documented. Therefore, the objective of this study was to assess the flexural performance of mortar beams reinforced with recycled plastic mesh. Nine mortar beams were cast and tested under a three-point bending test: one plain mortar beam representing the control sample, and eight mortar beams incorporating recycled plastic mesh with different effective widths and void ratios. To validate the experimental results, a numerical analysis was conducted using ABAQUS. Based on the test results of all mortar specimens, the best mortar composite that possessed high flexural toughness and ductility for post-cracking strength was decided. The findings of this research are expected to pave the road for the production of mortar composites that will be useful for various engineering applications.

2. Materials and Methods

2.1. Materials

2.1.1. Plastic Wire

The material used in this research was obtained by cutting discarded gallon-sized plastic water containers. The plastic is made of polyethylene terephthalate (PET) which is composed of (C10H8O4)n. As seen in Figure 1a, a linear plastic wire with 1 mm width × 1 mm depth × 150 mm length, obtained using a shredder machine, was inserted into the tensile testing machine to measure the mechanical properties of the fiber used. The test was performed as per ASTM D638 [61]. The results show that the yield and ultimate strength of the plastic fiber were 25.3 and 55.1 MPa, respectively. Other properties of plastics and other polymer materials (ABS, PP, Nylon 6.6) are presented in Table 1.

2.1.2. Mortar

Ordinary Portland cement type I, complying with ASTM C150 standards, was used in the mortar mix [64]. The chemical composition of cement used is illustrated in Table 2.
Figure 2 shows the gradation curve of sand in the mix, which fell within the limits stated in ASTM C33 specifications, with maximum size of 2 mm [65]. Mixing proportions were 1:3 (cement:sand) and the water used was tap water. A water–cement ratio of 0.5 was selected as no water-reducing admixtures were added.

2.2. Experimental Program

2.2.1. Background

Using plastic sheets in mortar is expected to increase the ductility of cementitious composites, and the use of perforated plastic mesh may increase the bond between the plastic sheet and the interlayer mortar matrices. Currently there are no guidelines for mortar containing perforated plastic mesh. Similarly, there are no guidelines on the shape of the voids of the perforated plastic mesh. In this preliminary investigation, only square voids were considered. Other void shapes (i.e., circular, ellipse) will be the subject of future investigations.

2.2.2. Plastic Mesh Preparation

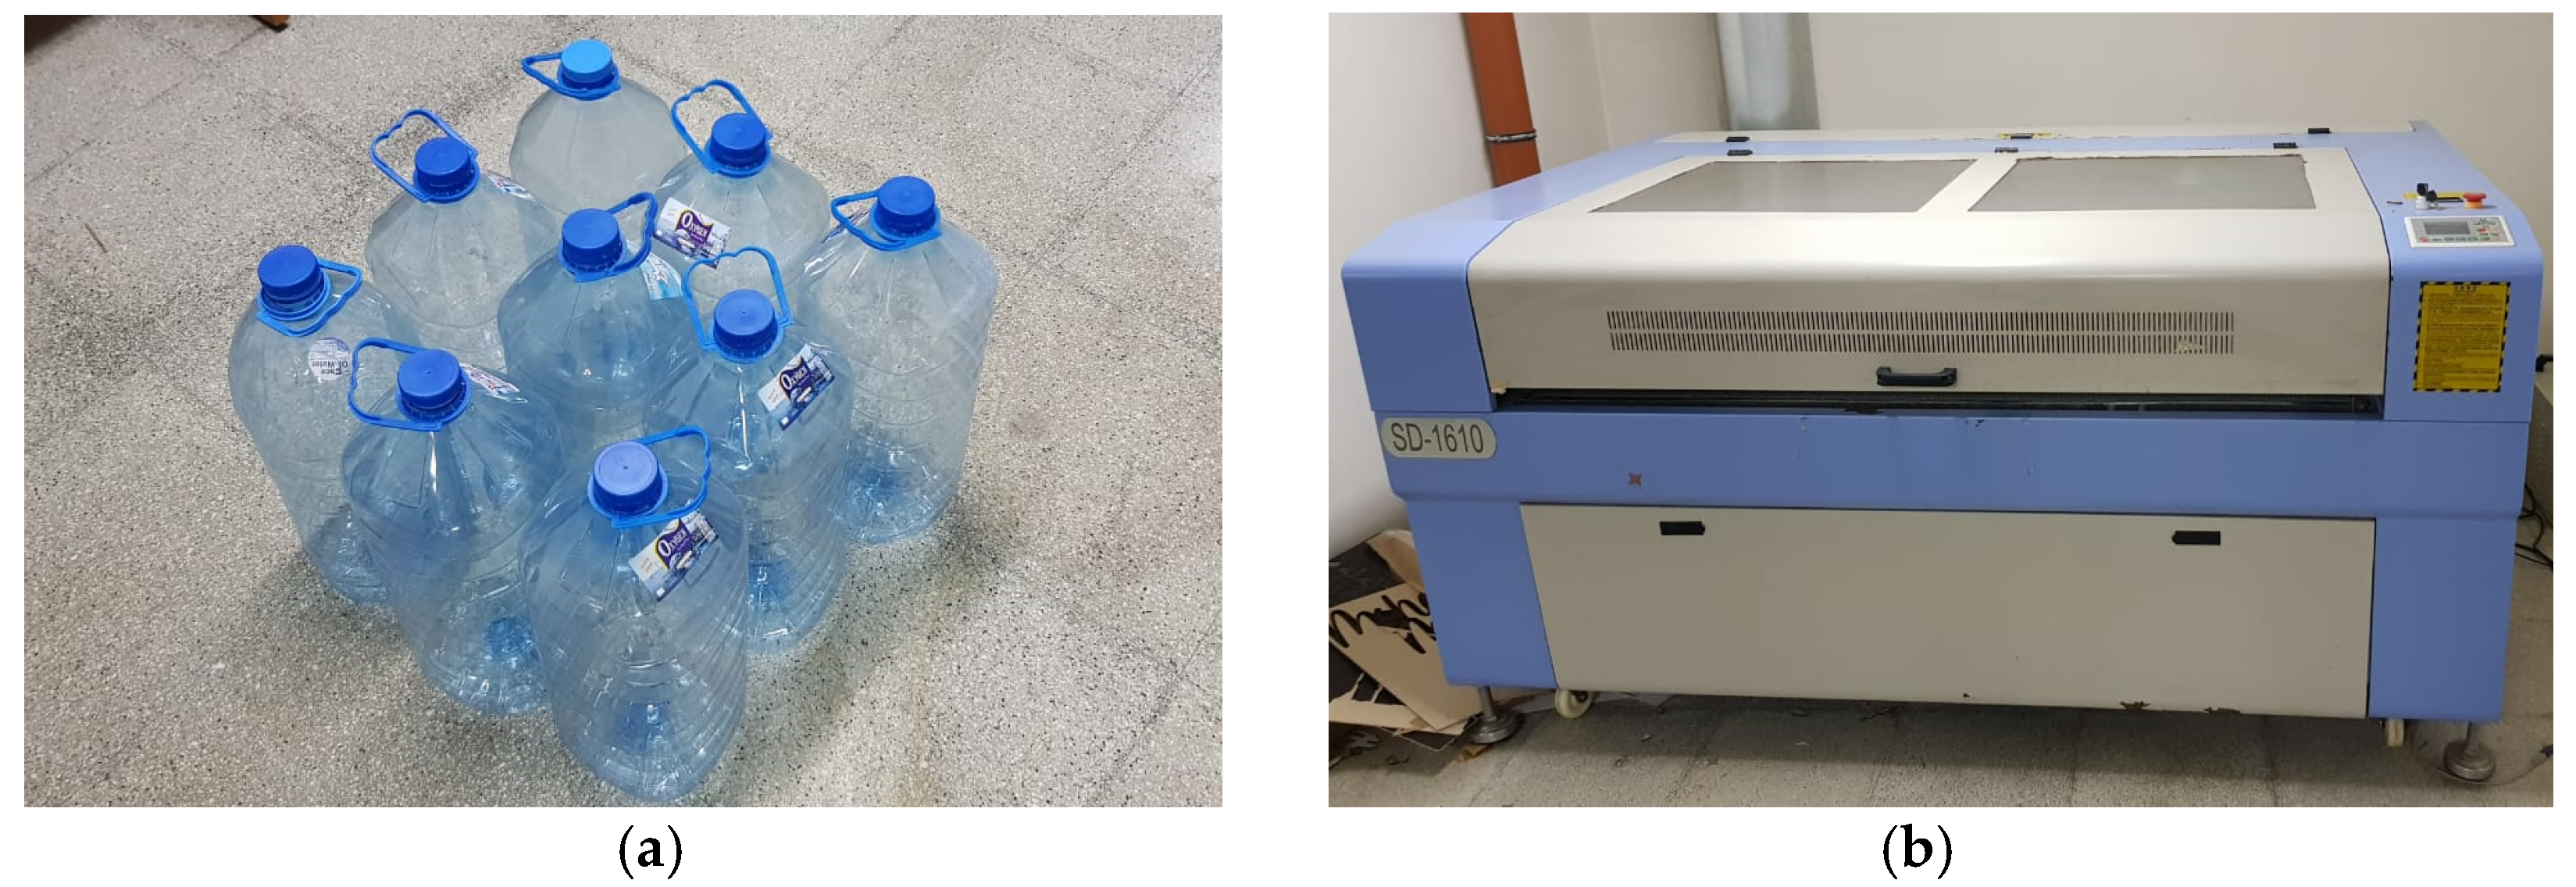
The plastic meshes used in this study were extracted from cleaned, gallon-sized plastic water containers. These containers are of 15 cm squarish dimensions with a 9.8 liter capacity, with total height of 40 cm and 30 cm width. Using a sharp cutter, the containers were etched into flat sheets of 145 mm length and 30 mm width. Thereafter, a computer-controlled laser cutting machine was used to develop the required mesh patterns as detailed in Figure 3.

2.2.3. Characteristics of Specimens

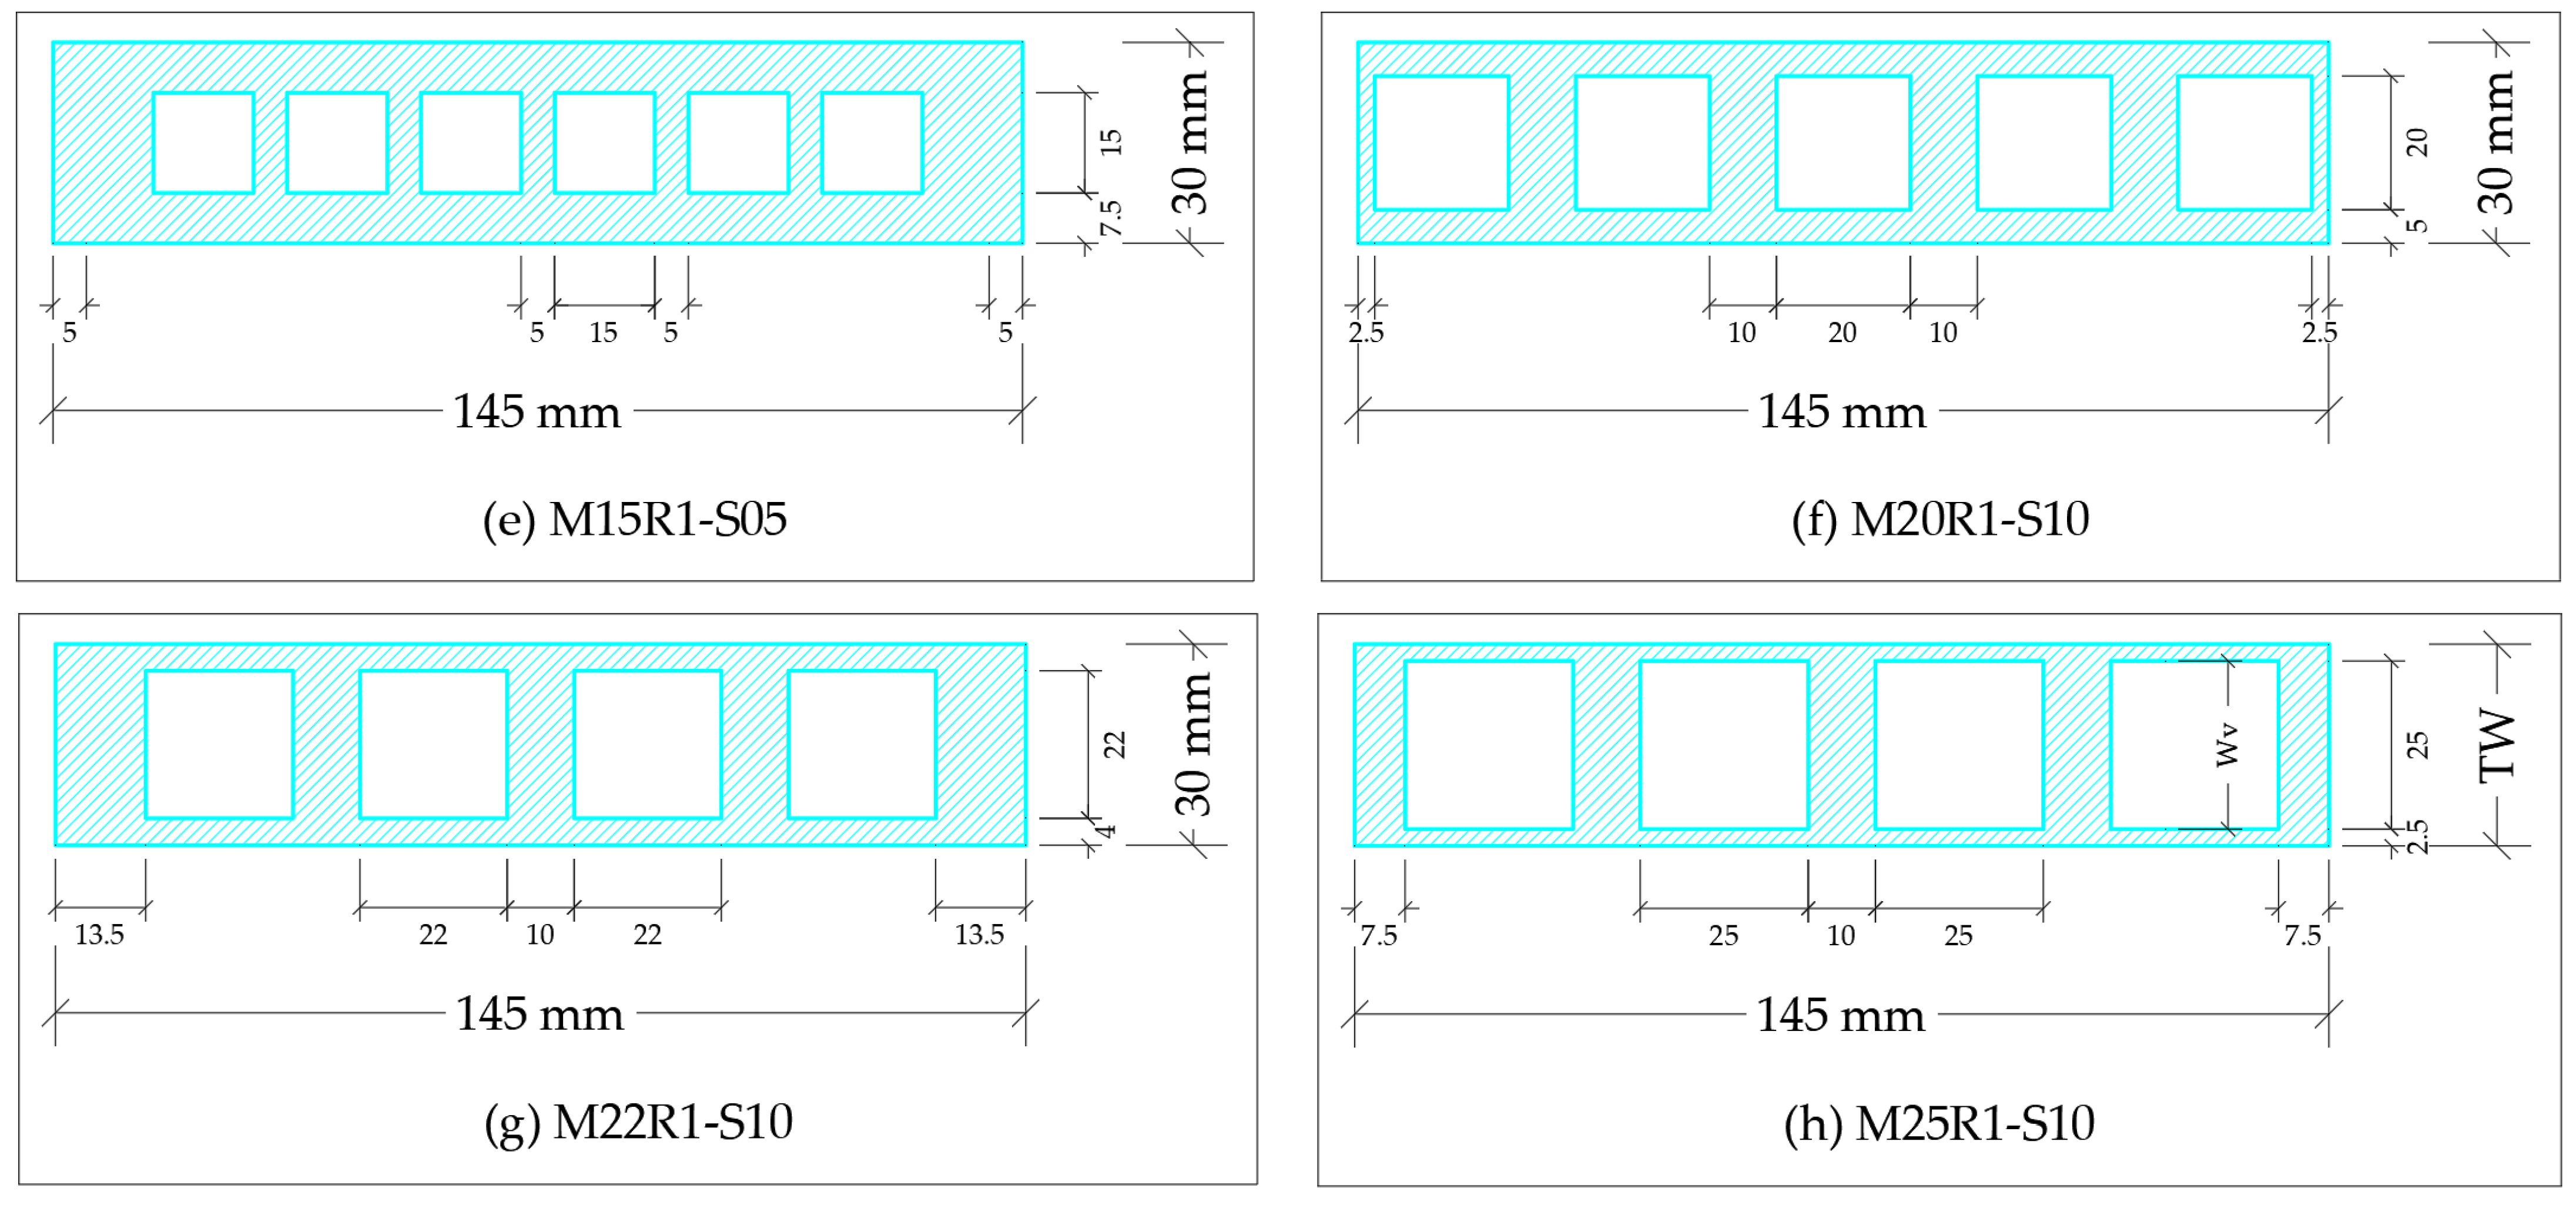
The experimental program consisted of nine rectangular mortar beams with three replicates (total of 27 mortar beams) with dimensions of 40 mm × 40 mm × 160 mm. The first beam is a plain mortar beam representing the control sample. The remaining eight specimens were reinforced with perforated recycled plastic meshes. The perforation consists of square voids of dimensions ranging from 0 to 25 mm. Further details of void size and spacing between voids are shown in Figure 4. The specimens’ dimensions were selected according to ASTM C348/2 standards [66]. As shown in Figure 4, the beam (M00R0) was longitudinally reinforced with two layers of plastic sheets. The remaining seven beams, “M05R1-S10” to “M25R1-S10”, were composed of two layers of plastic mesh each with 30 mm width and 145 mm length. In this nomenclature, “M” refers to mesh, “05” to “25” stands for the void width in mm, “R1” and “R2” symbolize the number of rows per mesh, “S” denotes the strip and “05” to “10” indicates the strip width in mm surrounding the void area. The specimens were subjected to flexural loading in order to evaluate their behaviors.

2.2.4. Effective Width Ratio (EWR) and Void Ratio (VR)

The effective width is defined as the width of plastic mesh that resists the tensile force induced by the flexural load. The EWR is calculated using Equation (1) as follows:
E W R = T W W v   T W
where: TW is the total width of the plastic mesh and Wv is the width of the void as shown in Figure 4h.
The void ratio (VR) is a parameter that affects the bond between the plastic mesh and the mortar matrix. The VR is calculated using Equation (2) as follows:
V R = A v A T
where: Av is the area of the voids and AT is the total area of the plastic mesh including the voids.

2.2.5. Specimen Casting and Curing

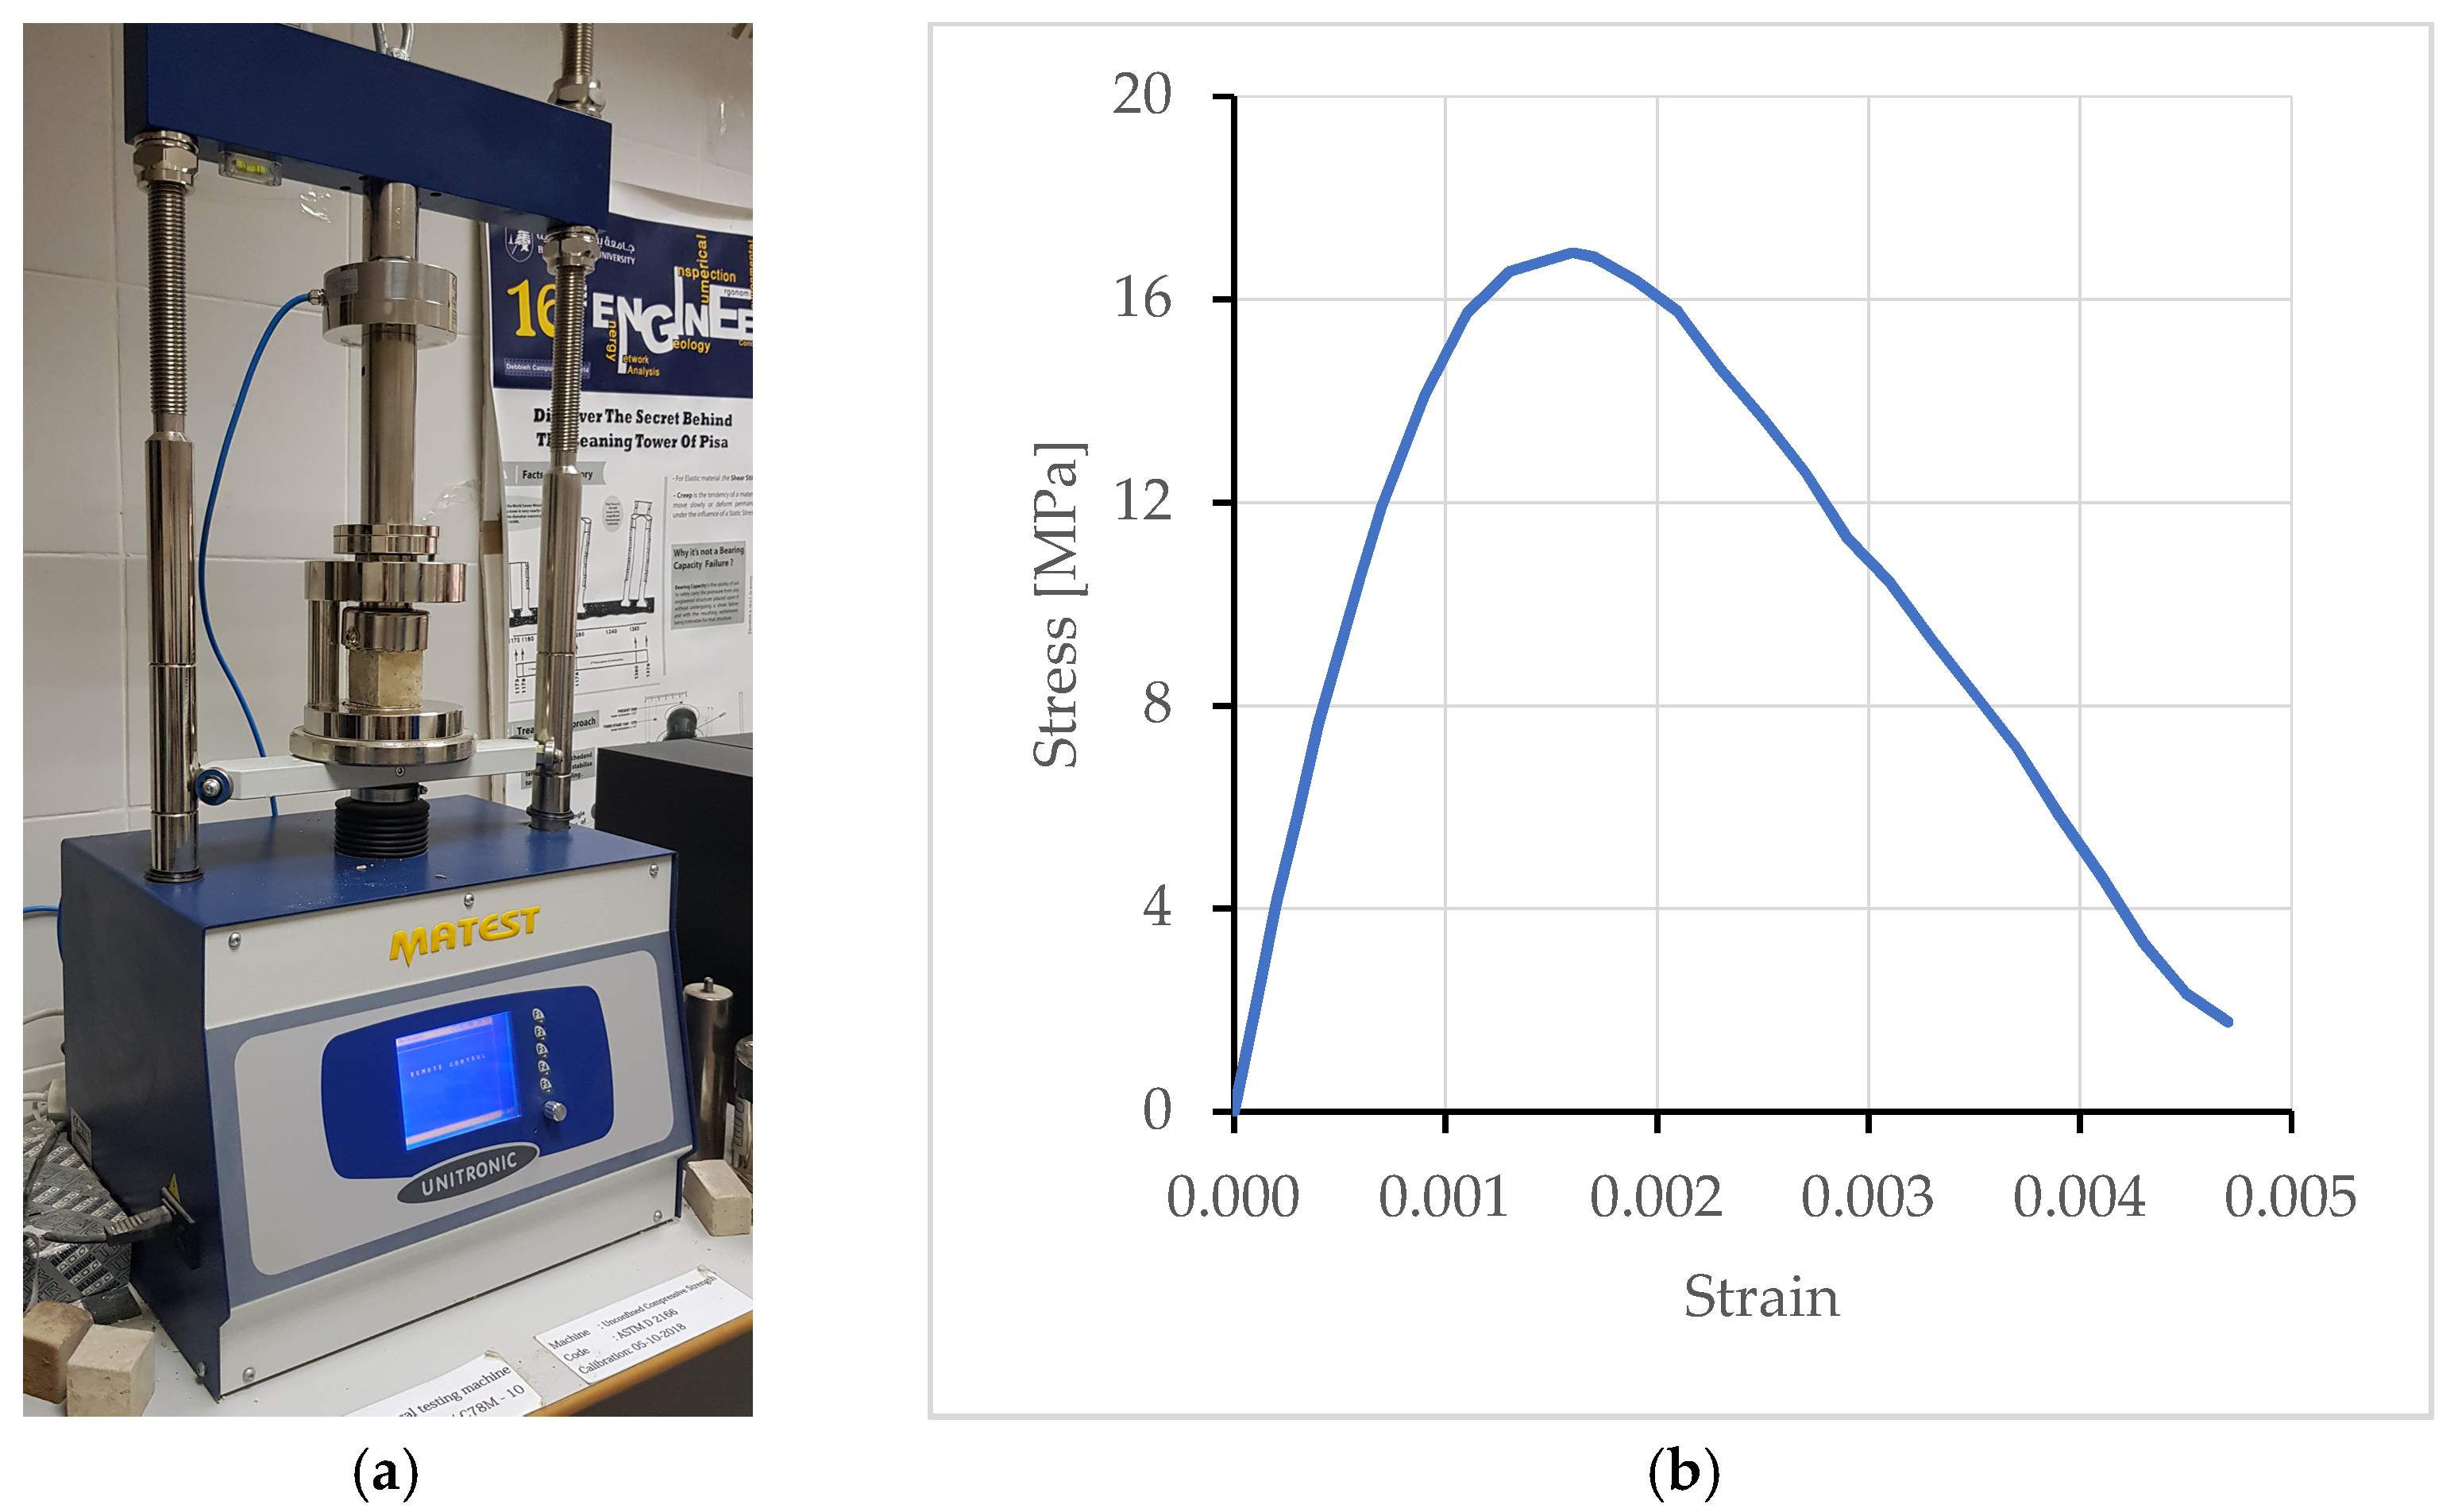
After the ingredients were weighted based on their proportions, they were poured into the mixer in the following steps as indicated in ASTM C305 [67]. First, water was emptied into the bowl. Second, cement was added to the water and mixed together for about 30 s. After that, the sand was added gradually while the mixer continued at a slow rate. This process was followed by 30 s mixing followed by a 1½ min resting period. At the end, the mixer was turned on for 1 min at a medium speed. Following mixing, a small amount of mortar was placed on the flow table in order to check the mix’s workability. This test was conducted complying with ASTM C1437 standards [68]. It was found that the mortar flow was about 95%, indicating good workability. Immediately after, the mortar was cast into the mold. In accordance with ASTM C109 [69], mortar cube molds of 5 cm in size were used to determine the compressive strength (CS) of the mix. The stress–strain curve presented in Figure 5 indicates that the CS of mortar at 28 days is 17 MPa.
Simultaneously, as shown in Figure 6, the specimens were cast into rectangular steel molds. A first mortar layer of ½ cm was poured inside the bottom of the mold with a scoop. This was followed by laying down the first plastic mesh. Then, a second mortar layer of ½ cm was placed. A second layer of plastic mesh was then pushed down on top of the second mortar layer. Finally, the last mortar layer was poured in, filling the mold smoothly up to the top. A tamping rod was used to force the trapped air out of the specimens. The samples were demolded after 24 h and directly immersed in a curing tank.

2.2.6. Flexural Testing

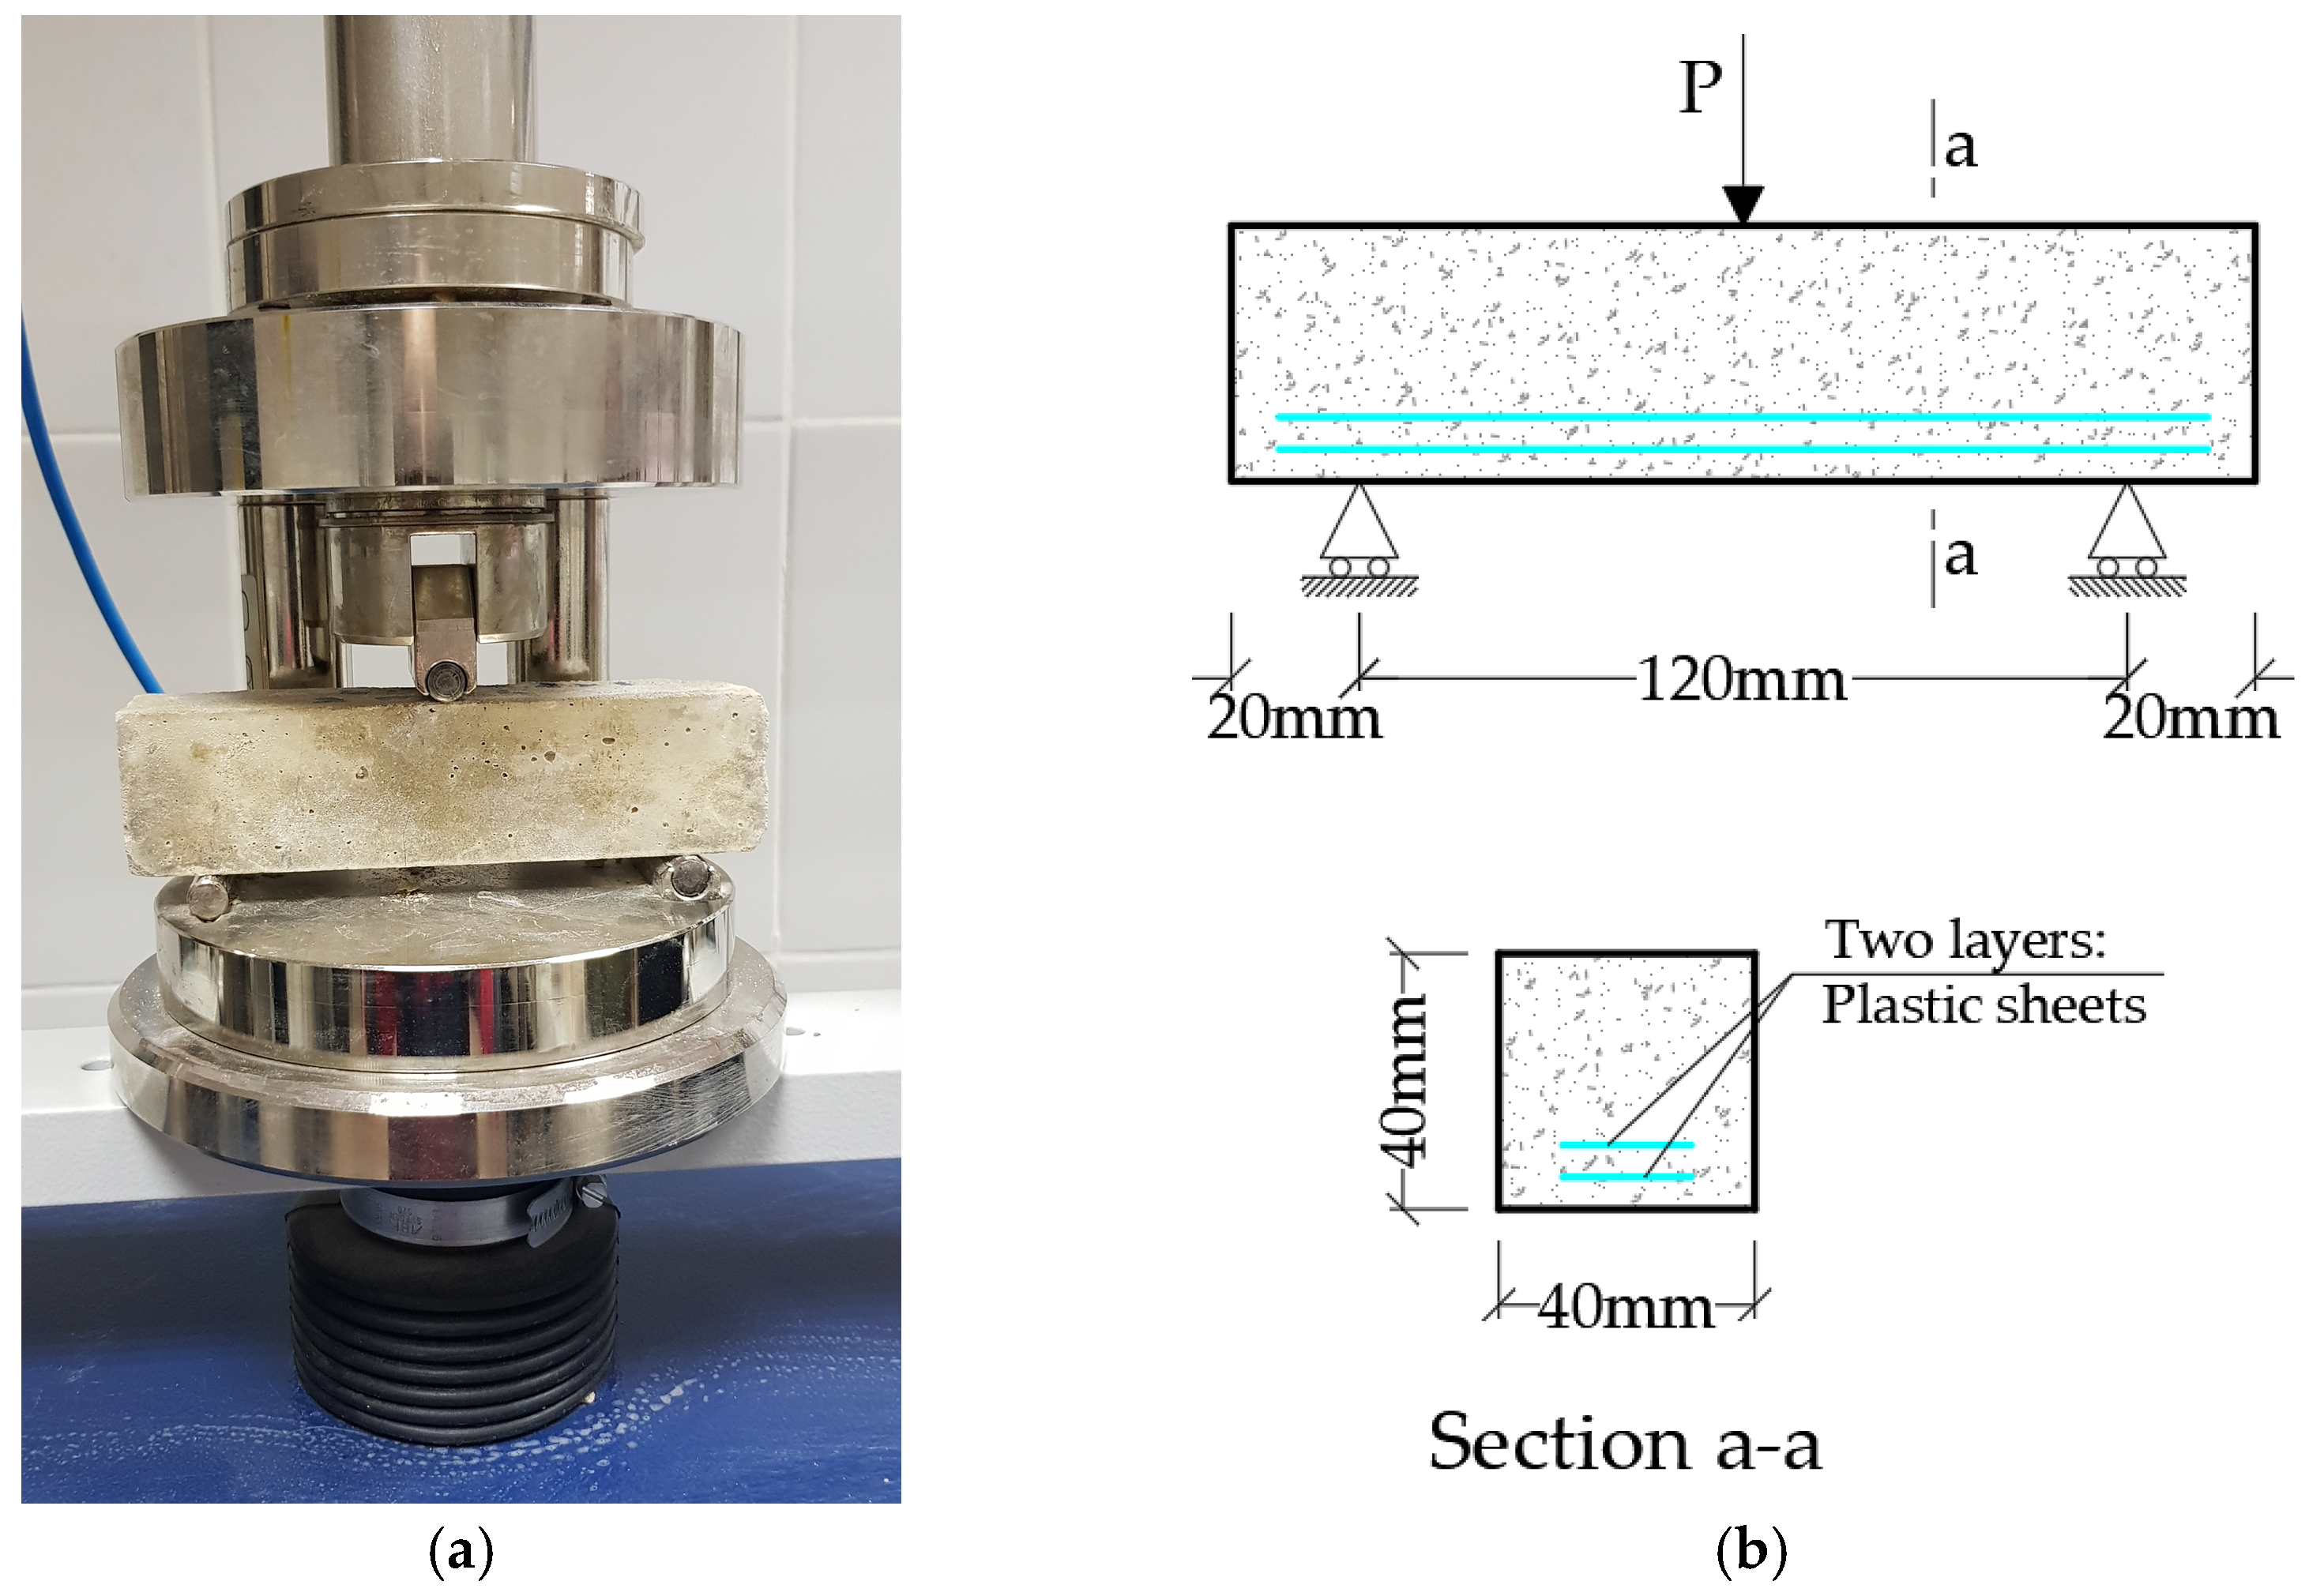
In this research, the experimental study was conducted under three-point loading in flexure. A steel roller was placed at the top center of the beam in order to ensure the direct transfer of the load. Moreover, two steel rods of 50 mm each, spaced by 120 mm, played the role of roller supports as depicted in Figure 7. The flexural test was performed using a compression machine with a maximum cell load capacity of 10 kN. The load was monotonically applied at the specimen mid-span with a constant rate of 0.1 kN/s. Furthermore, one LVDT located at the backside of the specimen was used to measure the mid-span deformation. The load–displacement curve was then plotted through a data acquisition system. It should be noted that the test was stopped when the deformation reached 7 mm.

3. Results and Discussion

3.1. Experimental Study

The subsequent sections discuss the effect of plastic mesh on the flexural behavior, flexural toughness and ductility index of the mortar beams.

3.1.1. Flexural Behavior

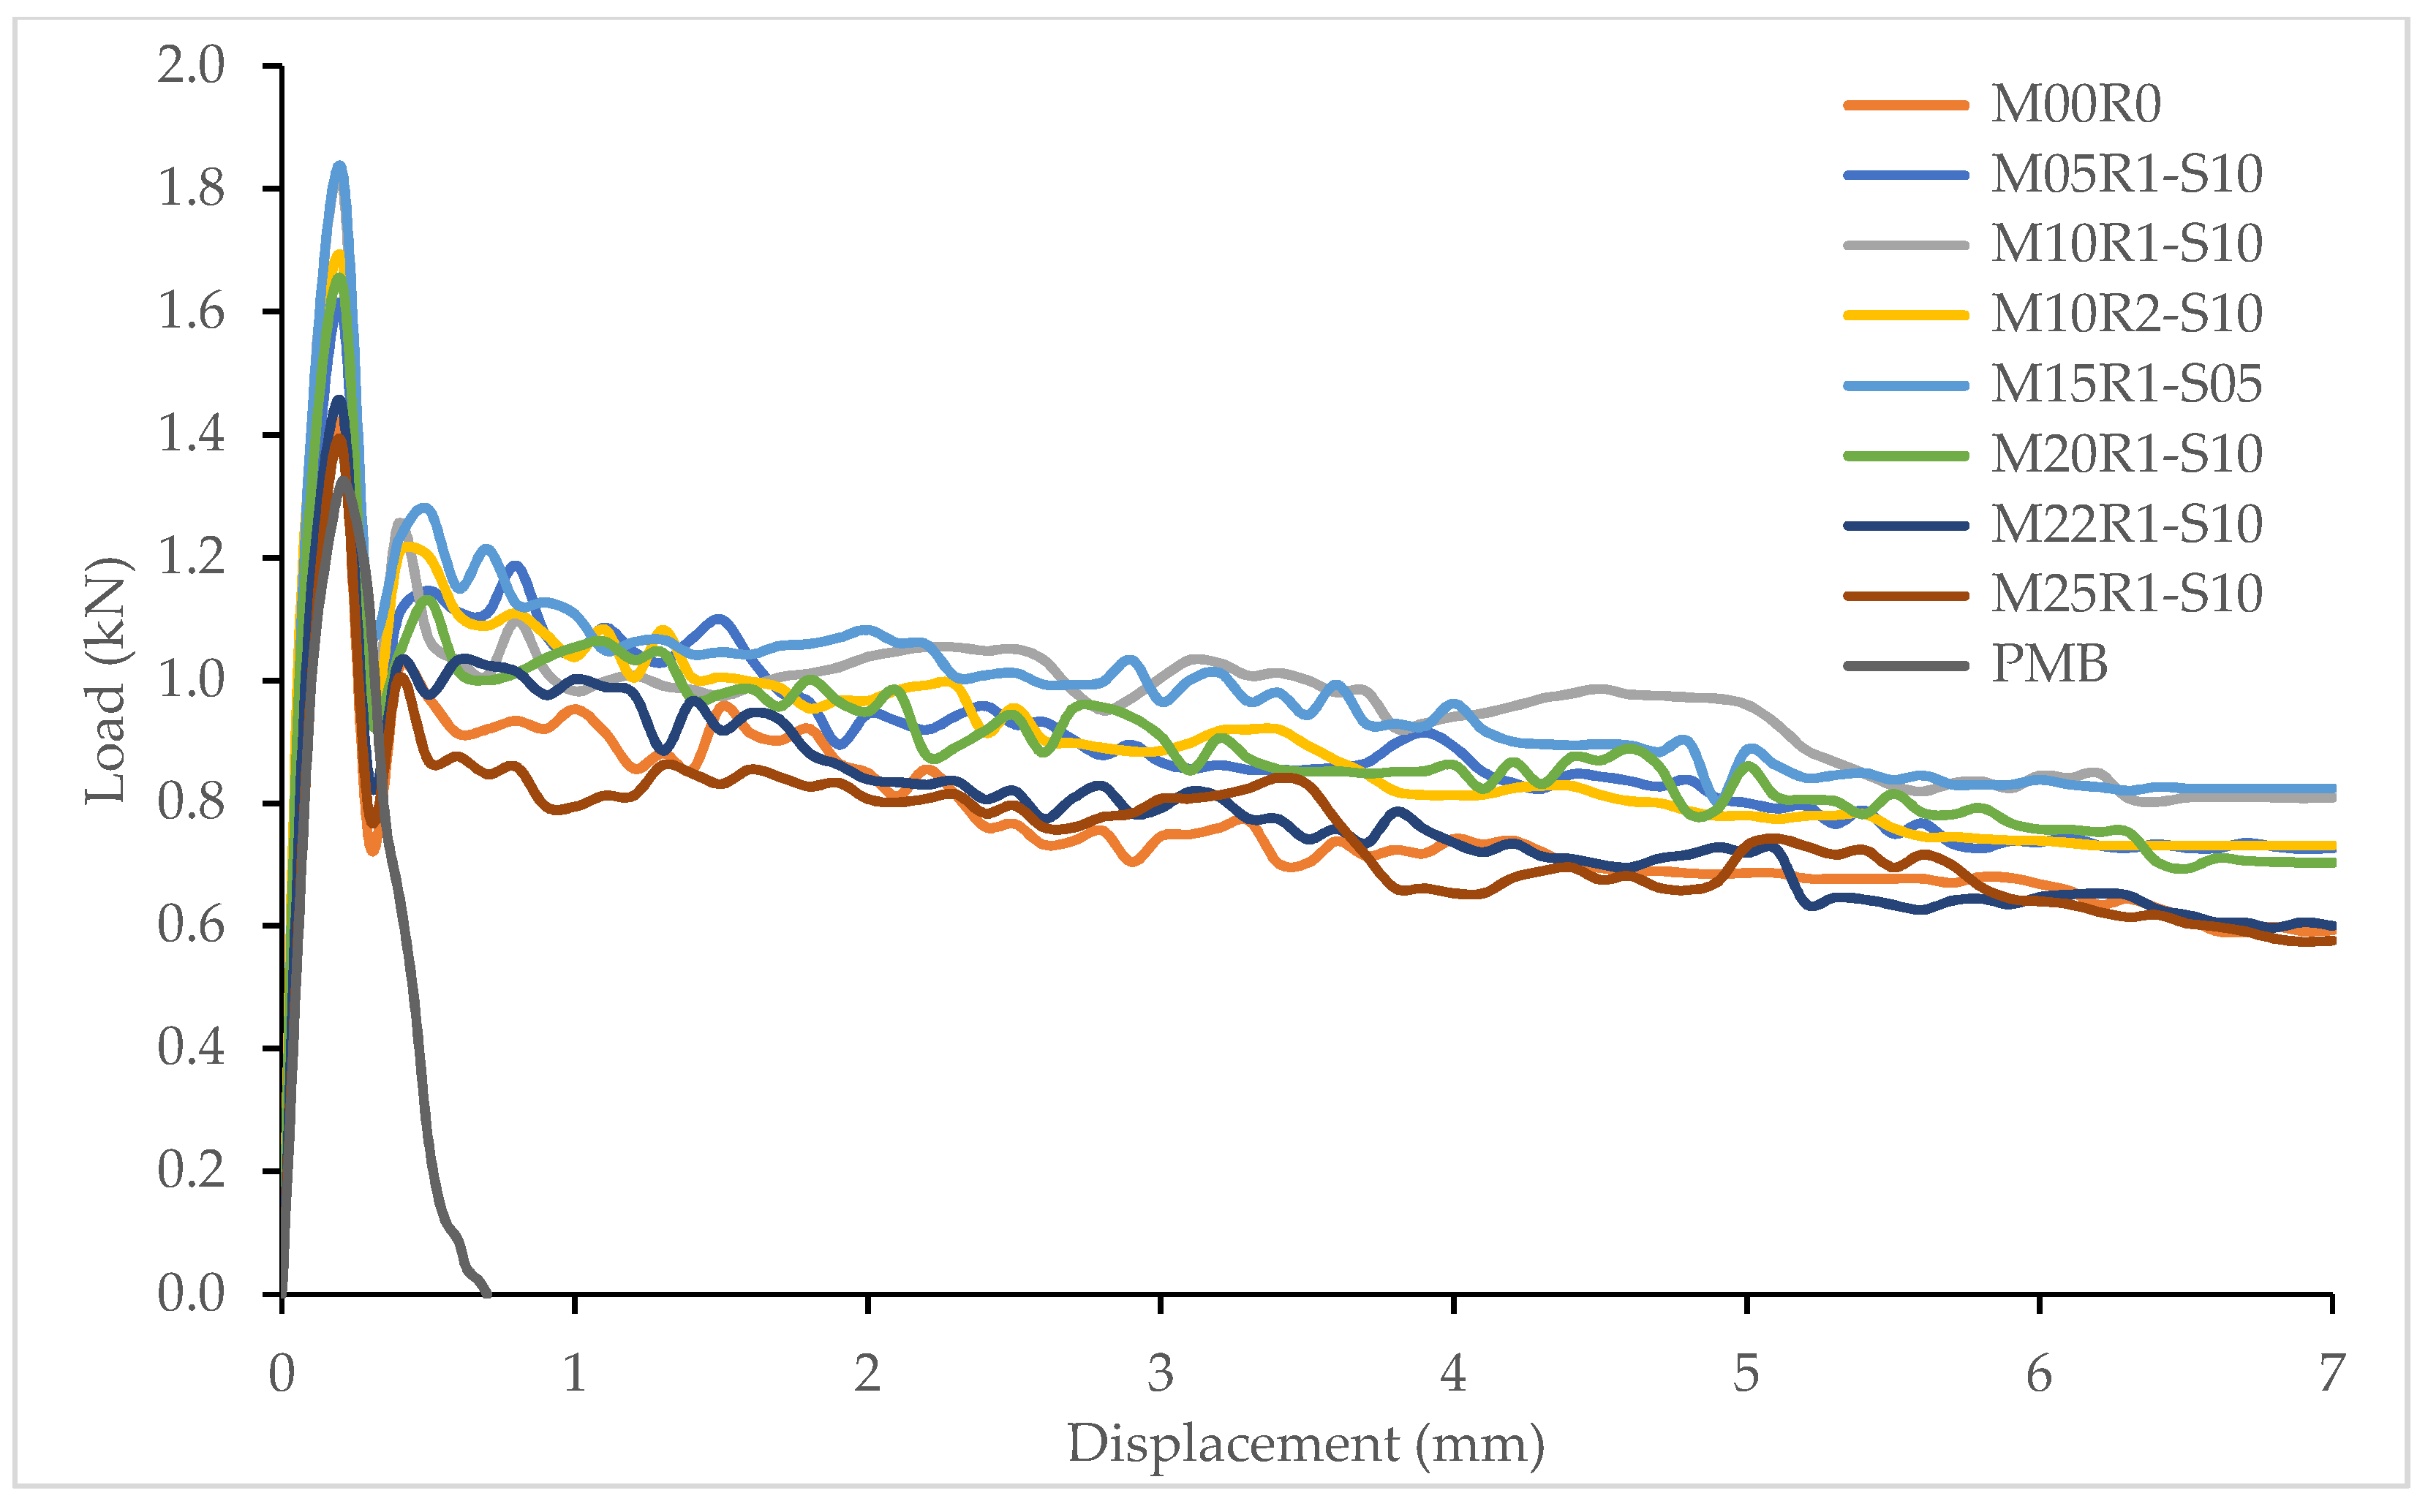
As mentioned above, nine mortar beams, one plain and eight reinforced with recycled plastic meshes, were subjected to a flexural load test. The load–displacement curves are presented in Figure 8. It should be noted that each plot is the average of three replicate tests. The plots reveal that the specimens with plastic mesh reinforcement exhibit similar behaviors. These beams fail in ductile flexural modes, showing large deformation prior to failure. This is ultimately due to the presence of the plastic mesh, which delays the crack propagation. However, the plain mortar beam (PMB) displays a brittle failure behavior with small energy absorption. The flexural behavior of specimens containing plastic mesh passes through four main zones. A typical behavior is clarified in Figure 9 for beam M10R1-S10 and described as follows:
  • Stage 1: The ascending part of the curve represents the elastic zone. The deformation increases linearly as the load moves up. This zone ends with the appearance of the first crack (Py = 1.38 kN, Δy = 0.12 mm).
  • Stage 2: This zone describes the last part of the ascending curve. At this stage, many cracks propagate and the load increases slightly with the displacement. This phase ends once the beam reaches the ultimate capacity, through which cracks remain more developed (Pu = 1.82 kN, Δu = 0.21 mm).
  • Stage 3: Beyond the maximum load point the post-cracking phase starts, announcing the beginning of the stiffness degradation. The load drops suddenly by about 41% followed by a second increase in load nearly equal to 70% of the ultimate capacity. This is mainly due to the presence of the second layer of the plastic mesh, which further contributes to withstanding higher loads.
  • Stage 4: After the second peak, the load continues to decrease throughout the long softening line. In the meantime, plastic meshes are no longer able to control the crack propagation. Consequently, the stiffness degradation of the beams becomes quite substantial.
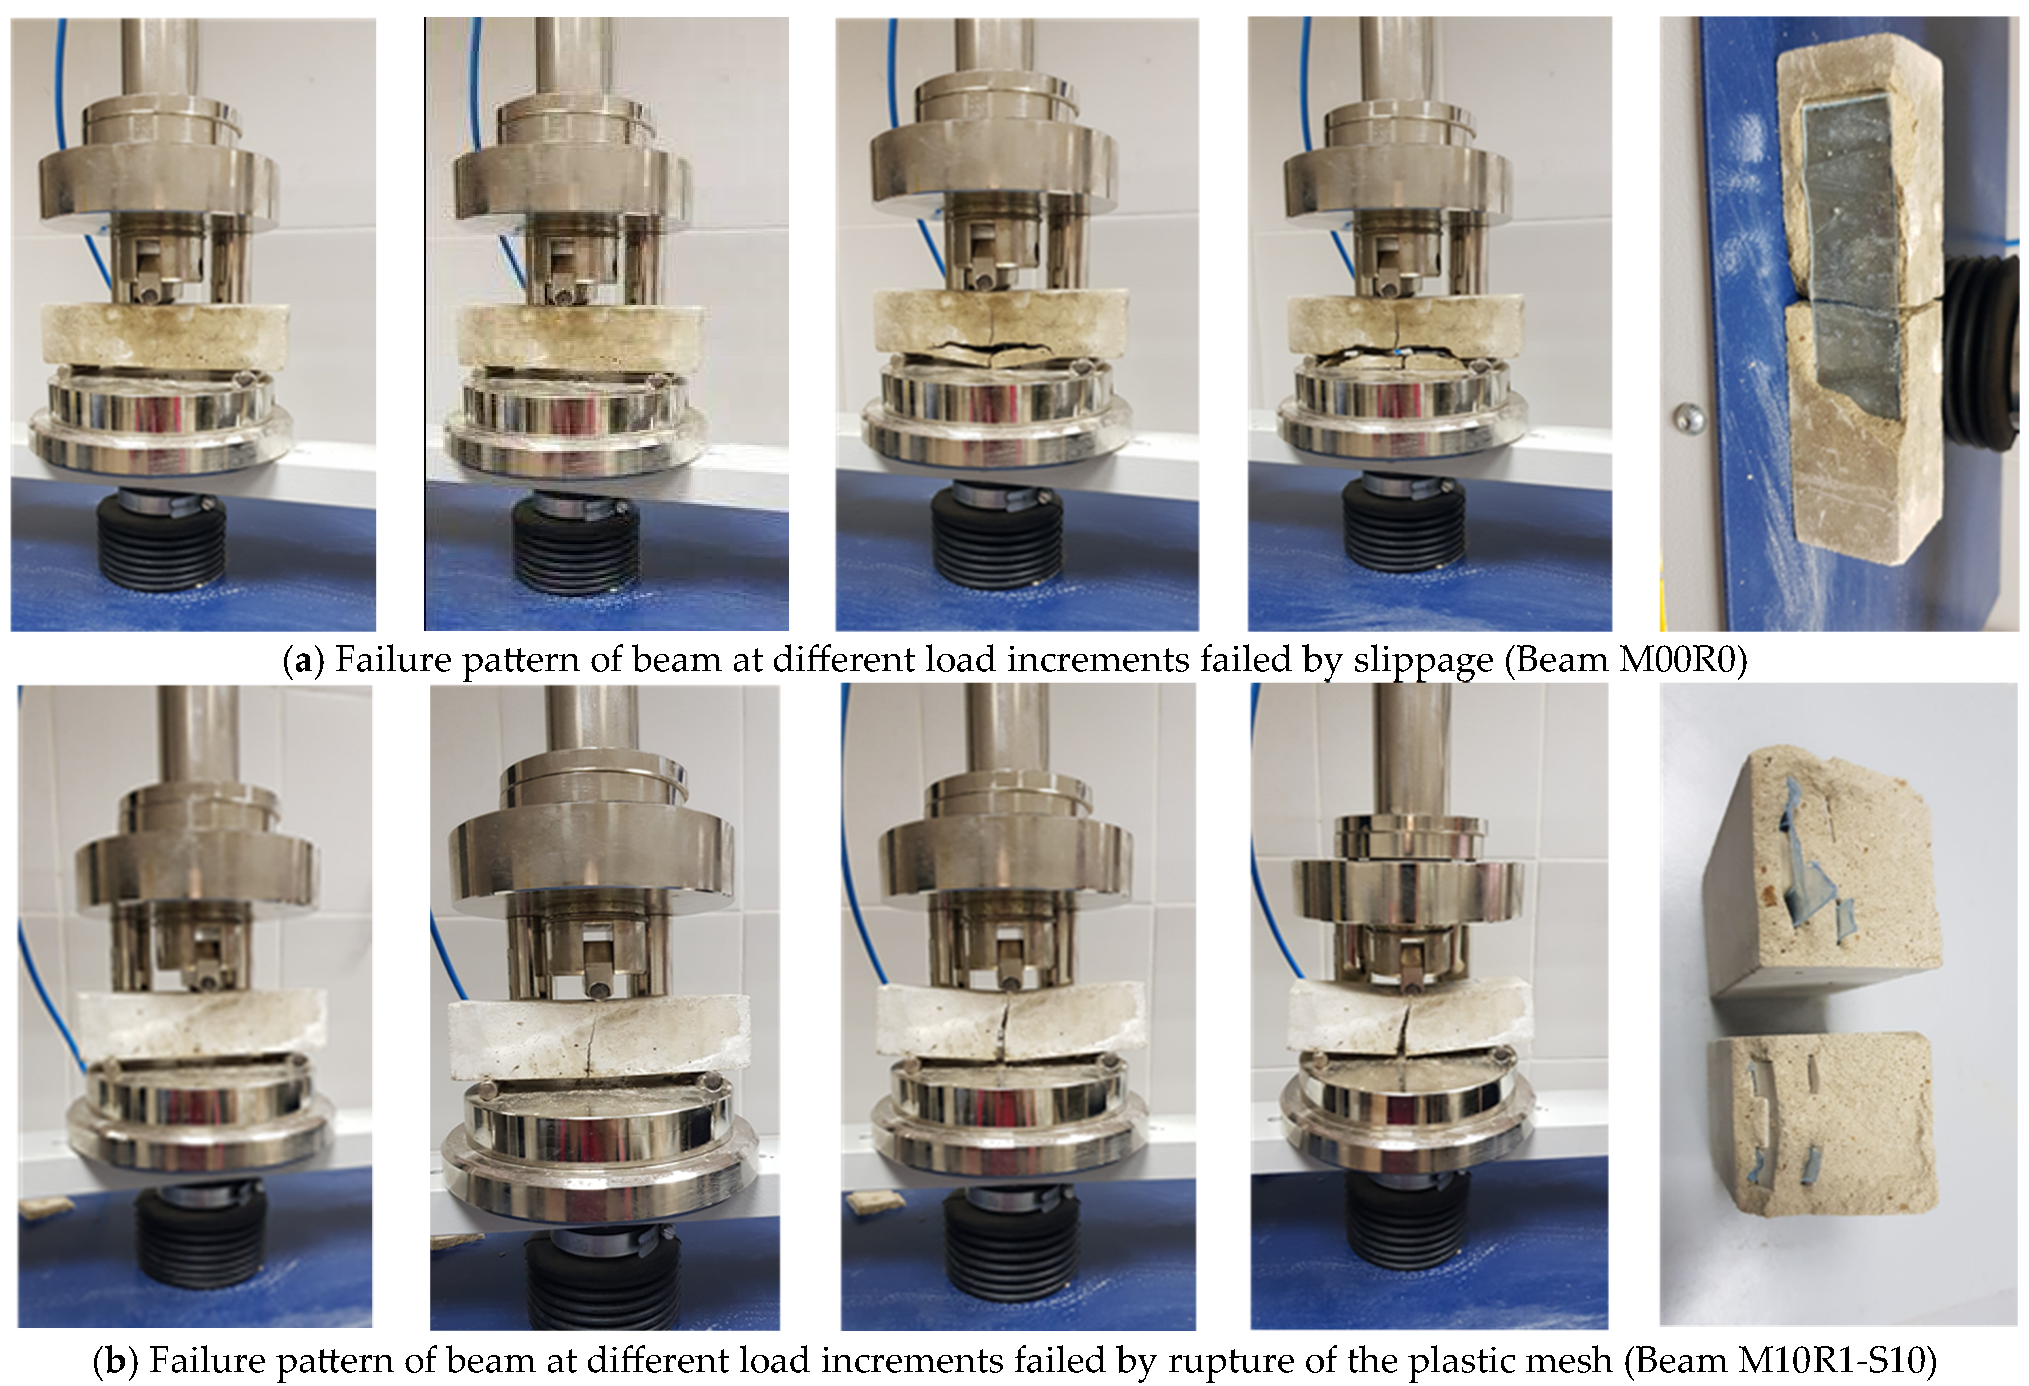
As observed, there are two modes of failure. The first mode is slippage and delamination of the plastic mesh, which might be due to the weaker bond between the mortar matrix and the interlayered plastic meshes. This occurred in beams with solid plastic sheets [beam M00R0] and beams with a void ratio of 0.05 [beam M05R1-S10]. The second mode is the rupture of the actual plastic mesh. This was noticed in beams with void ratios above 0.05. This may probably be due to the stronger bond between the plastic mesh and the mortar. The fracture and slippage patterns at different load increments for beam M00R0 and beam M10R1S-10 are presented in Figure 10a,b, respectively.
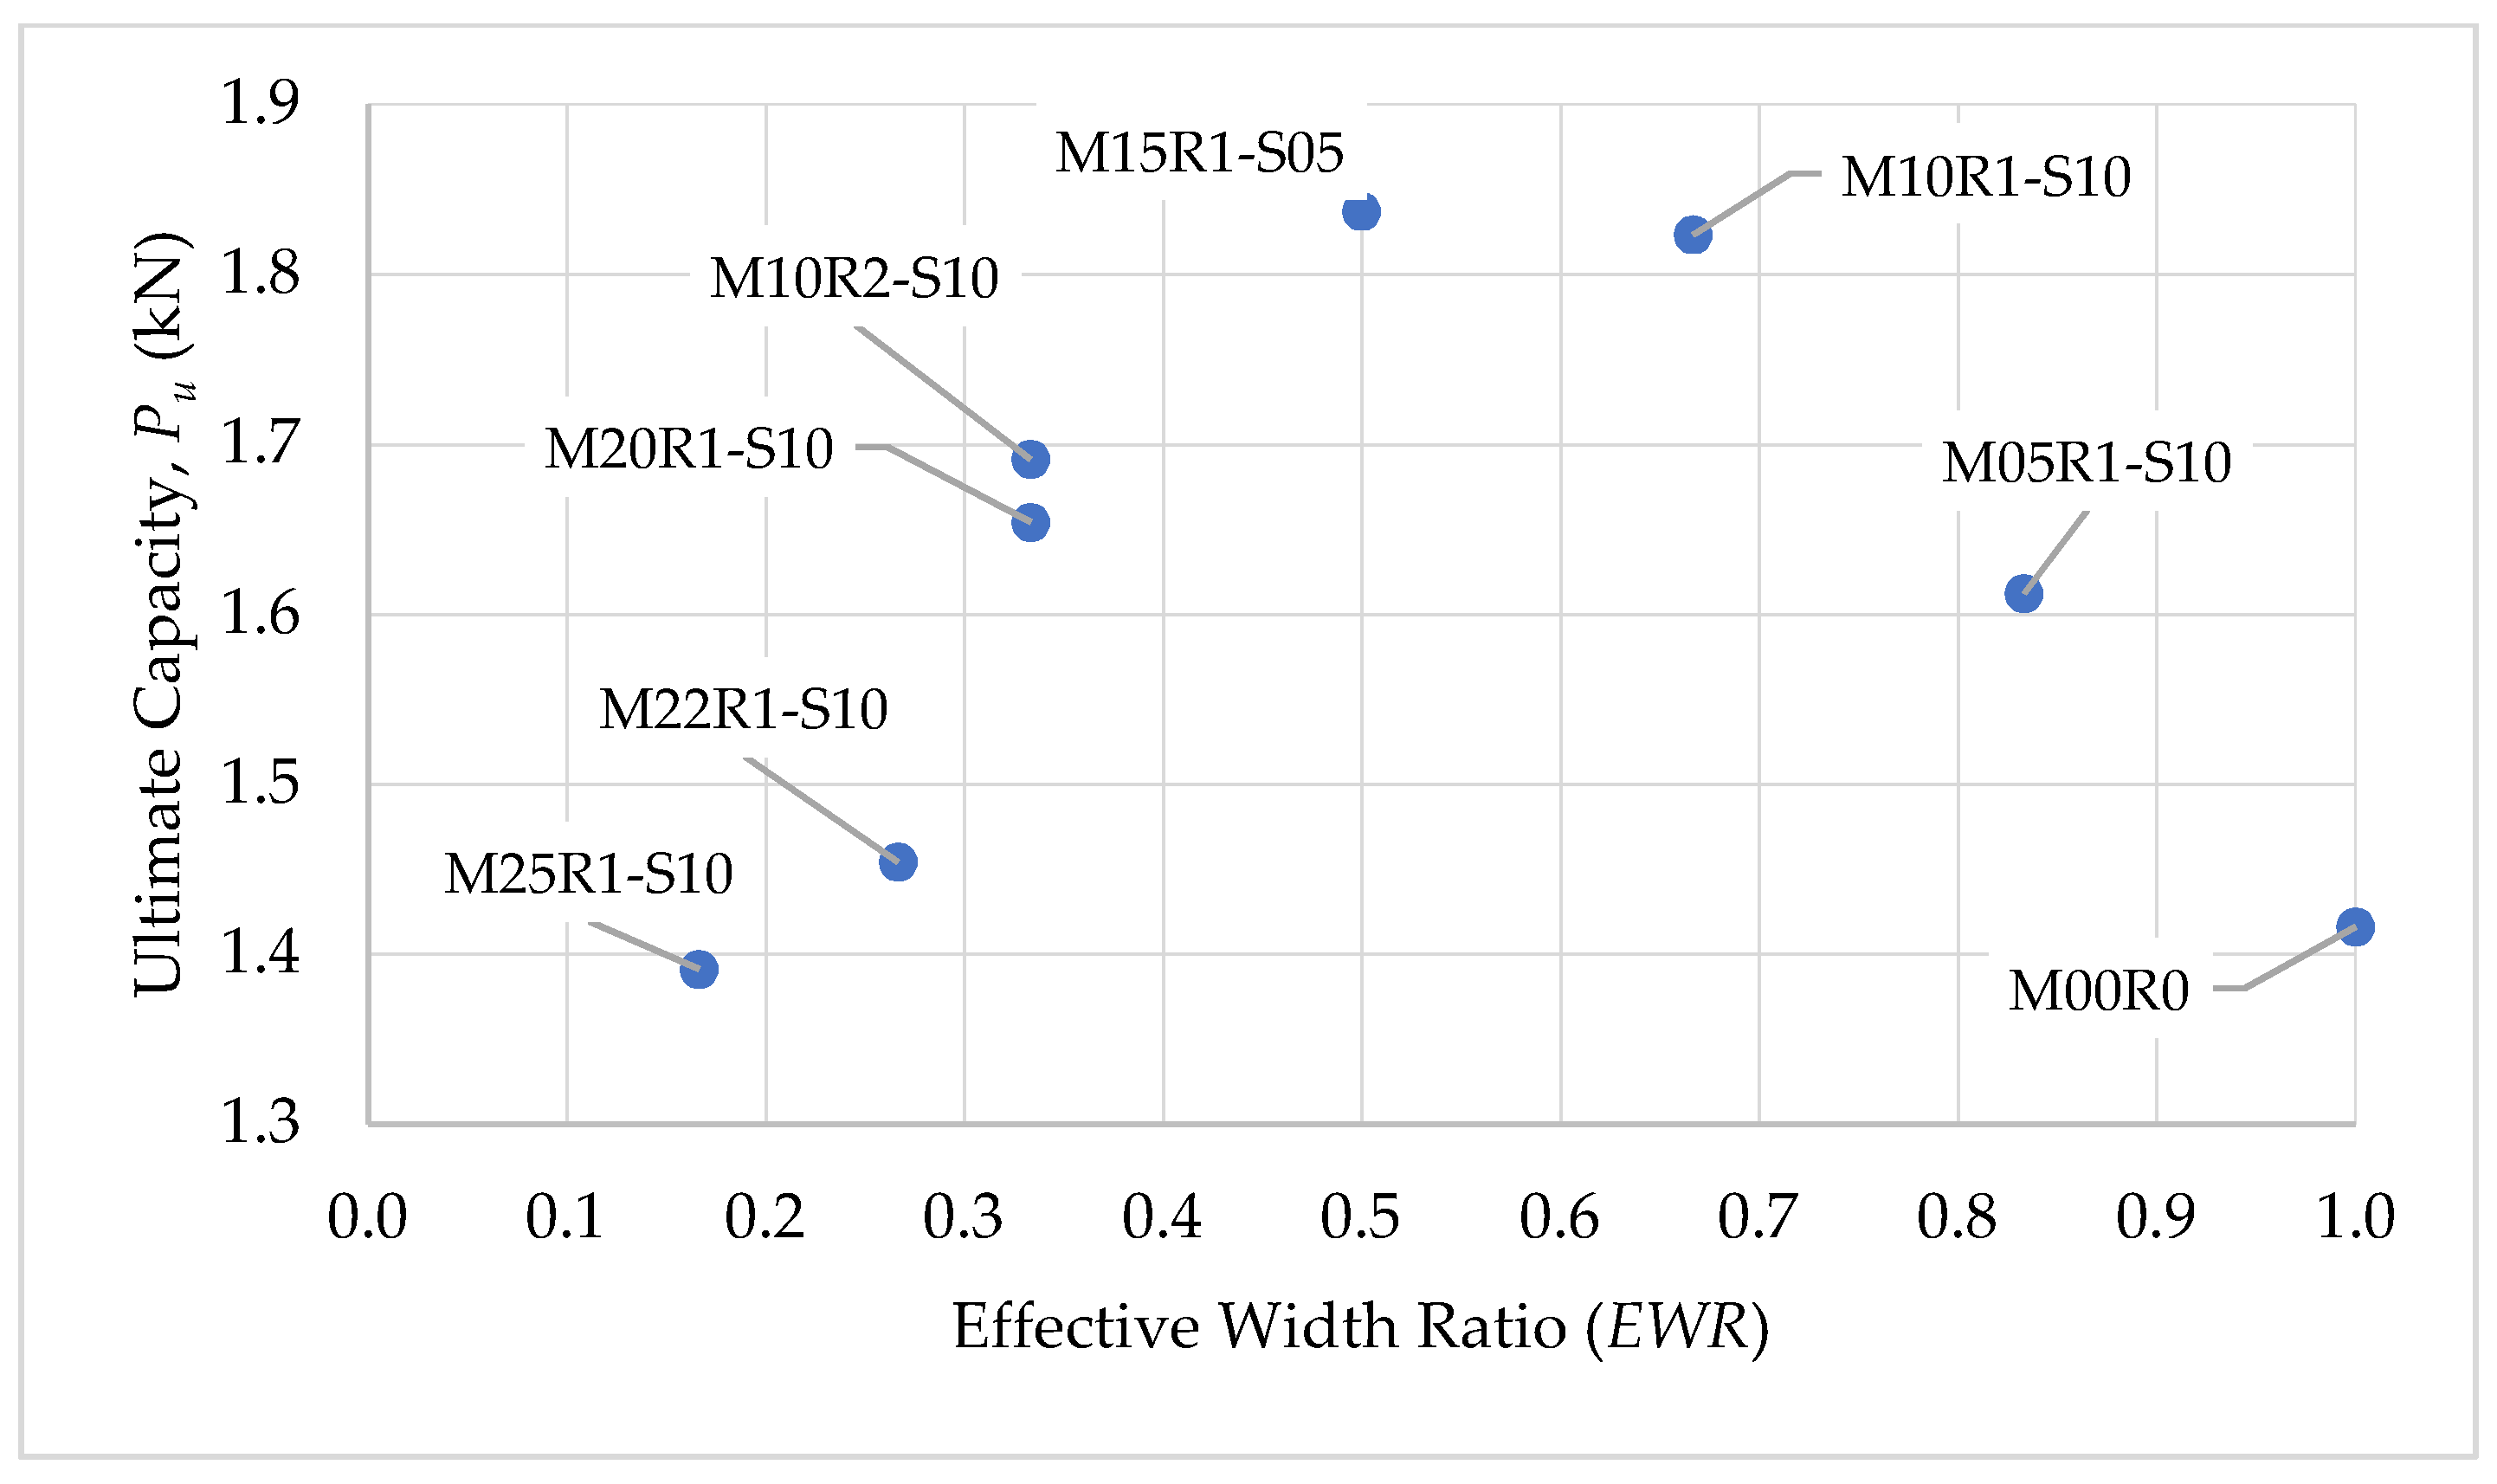
The EWR is one of the main parameters that affects the flexural behavior of the specimens strengthened with different plastic mesh patterns. As displayed in Table 3, the specimen M25R1-S10, with the smallest EWR value (0.17), has the lowest ultimate capacity of 1.391 kN. Moreover, it should be noted that the ultimate capacity of specimens M22R1-S10, M20R1-S10, M10R2-S10 and M15R1-S05, which are 1.454, 1.654, 1.691 and 1.837 kN, respectively, goes up as EWR increases (EWR = 0.27, 0.33, 0.33 and 0.50, respectively). Although specimens M20R1-S10 and M10R2-S10 both have the same EWR value, the ultimate load of the latter is increased by nearly 2%, compared with that of the former. This result will be discussed in the following section. Therefore, the plastic mesh with large effective width plays the role of crack arrestor while delaying crack propagation. On the other hand, the capacity of specimens M10R1-S10 and M05R1-S10, 1.823 and 1.612 kN, respectively, decreases as the EWR increases (EWR = 0.67 and 0.83, respectively). Likewise, specimen M00R0 with the highest EWR value (EWR = 1) has the lowest flexural capacity (1.416 kN). This may be due to the low bonding effect between mortar and plastic mesh. This weakness results in a gradual pullout of the plastic mesh from the mortar matrix, which leads to a loss in the flexural resistance. Thus, in order to obtain a high ultimate capacity value, the mesh’s effective width ratio should float within acceptable ranges, i.e., a threshold limit should be respected.
In light of the above, the mesh’s EWR is very important in determining the beams’ ultimate capacity. Figure 11 shows the relationship between EWR and the ultimate capacity of the beams. As shown, the EWR and the ultimate capacity are positively correlated up to an EWR of about 0.58. Beyond this value, the ultimate capacity decreases up to EWR equal to 1.

3.1.2. Flexural Toughness (FT)

This section focuses on the effect of the mesh’s EWR on the flexural toughness (FT), which is a measure of energy absorption capacity and was obtained by measuring the integral area of the load–displacement curve [70]. It was calculated using Equation (3) as follows:
F T = 0 L max P ( L ) d L
where: P(L) is the force at each displacement and Lmax is the maximum displacement.
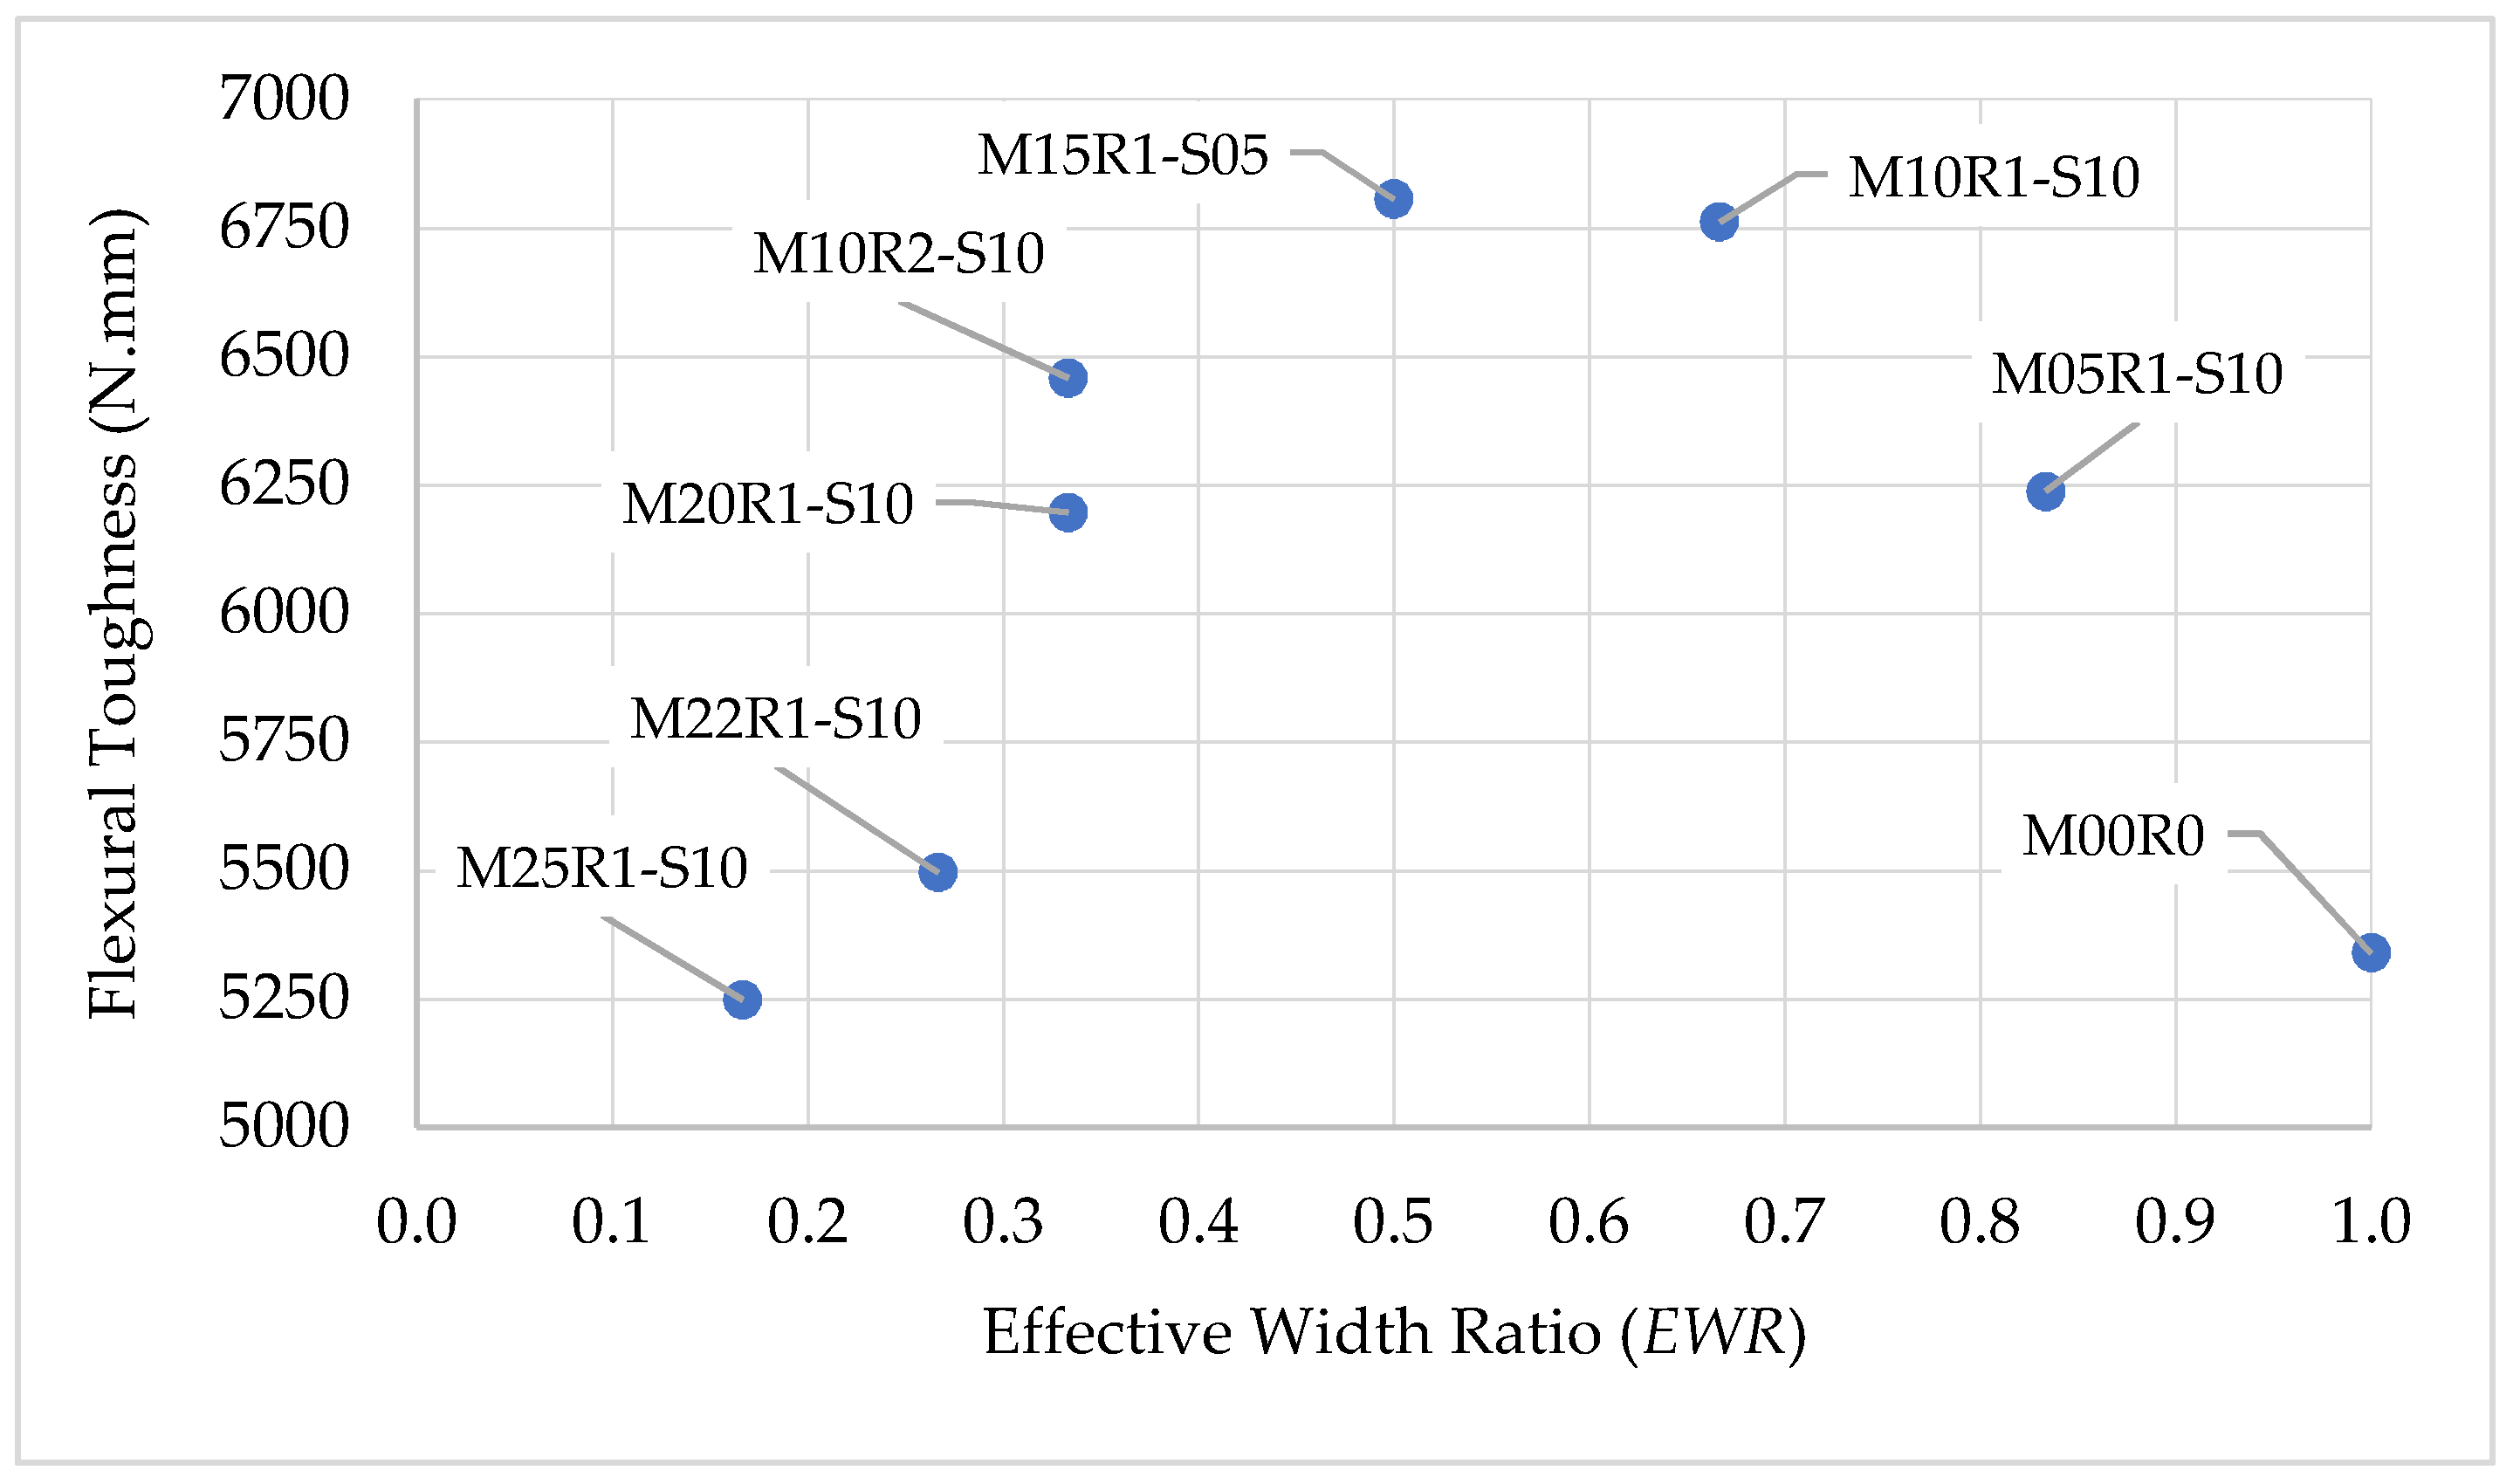
The toughness is computed as the area under the load–displacement curve. The bar chart shown in Figure 12 indicates the significant effect of the plastic mesh’s EWR on the flexural toughness. Below a certain value of EWR, the flexural toughness goes up as the mesh’s effective mesh width increases. Beyond that, the toughness becomes negatively proportional with the mesh’s EWR. For illustration, the flexural toughness of specimen M25R1-S10, with the smallest EWR (0.17), showed the lowest toughness value (5248 N.mm). Compared with the latter specimen, the increase in toughness for specimens M22R1-S10 (EWR = 0.27), M20R1-S10 (0.33), M10R2-S10 (0.33) and M15R1-S05 (0.50) is observed to be 5%, 18%, 23% and 30%, respectively. It is interesting to point out that specimen M15R1-S05 displays the highest toughness value (6805 N.mm). Other than that, the flexural toughness capacity of specimens M10R1-S10 (EWR = 0.67), M05R1-S10 (0.83) and M00R0 (1.00) go down by 1%, 8% and 22%, respectively, compared to specimen M15R1-S05.
Figure 13 plots the relationship between the mesh’s EWR and the flexural toughness. It can be noticed that as EWR increases up to about 0.5, the flexural toughness increases. Beyond an EWR of 0.5, the flexural toughness declines up to an EWR of 1. This observation suggests that the bond between mortar and plastic mesh provides considerable energy absorption prior to failure.
Another factor of importance that affects the flexural toughness is the mesh void ratio (VR). It is obtained by calculating the area of openings in the plastic mesh to the total area. The purpose of studying this variable is to highlight the effect of voids on the bonding between plastic mesh and mortar. Referring to Table 3, the flexural toughness increases as the mesh void ratio decreases. Up to a particular point of VR, the flexural toughness deviates downward showing weak interfacial bonding between plastic mesh and mortar paste. This weakness results in a reduction of the energy absorption of the specimen, and in decreasing the toughness capacity. For example, specimen M00R0 with a zero void ratio exhibits the second lowest flexural toughness capacity after specimen M25R1-S10 (VR = 0.57). The flexural toughness of specimens M10R2-S10 (VR = 0.32), M22R1-S10 (0.45) and M20R1-S10 (0.46) decreases by 5%, 19% and 9%, respectively, in comparison with specimen M15R1-S05 (VR = 0.31), which achieved the highest toughness capacity. On the other hand, the flexural toughness of specimens M10R1-S10 (VR = 0.16) and M05R1-S10 (0.05) goes down by 1% and 8%, respectively, compared to specimen M15R1-S05. This drop can be attributed to the plastic mesh as it is not able to hold overstress, leading to deformations.
The relationship between the VR and the flexural toughness is shown in Figure 14. It can be shown that the flexural toughness goes up with an increase in VR up to 0.31. Beyond this value, the flexural toughness decreases up to a VR of 0.57.

3.1.3. Ductility Index

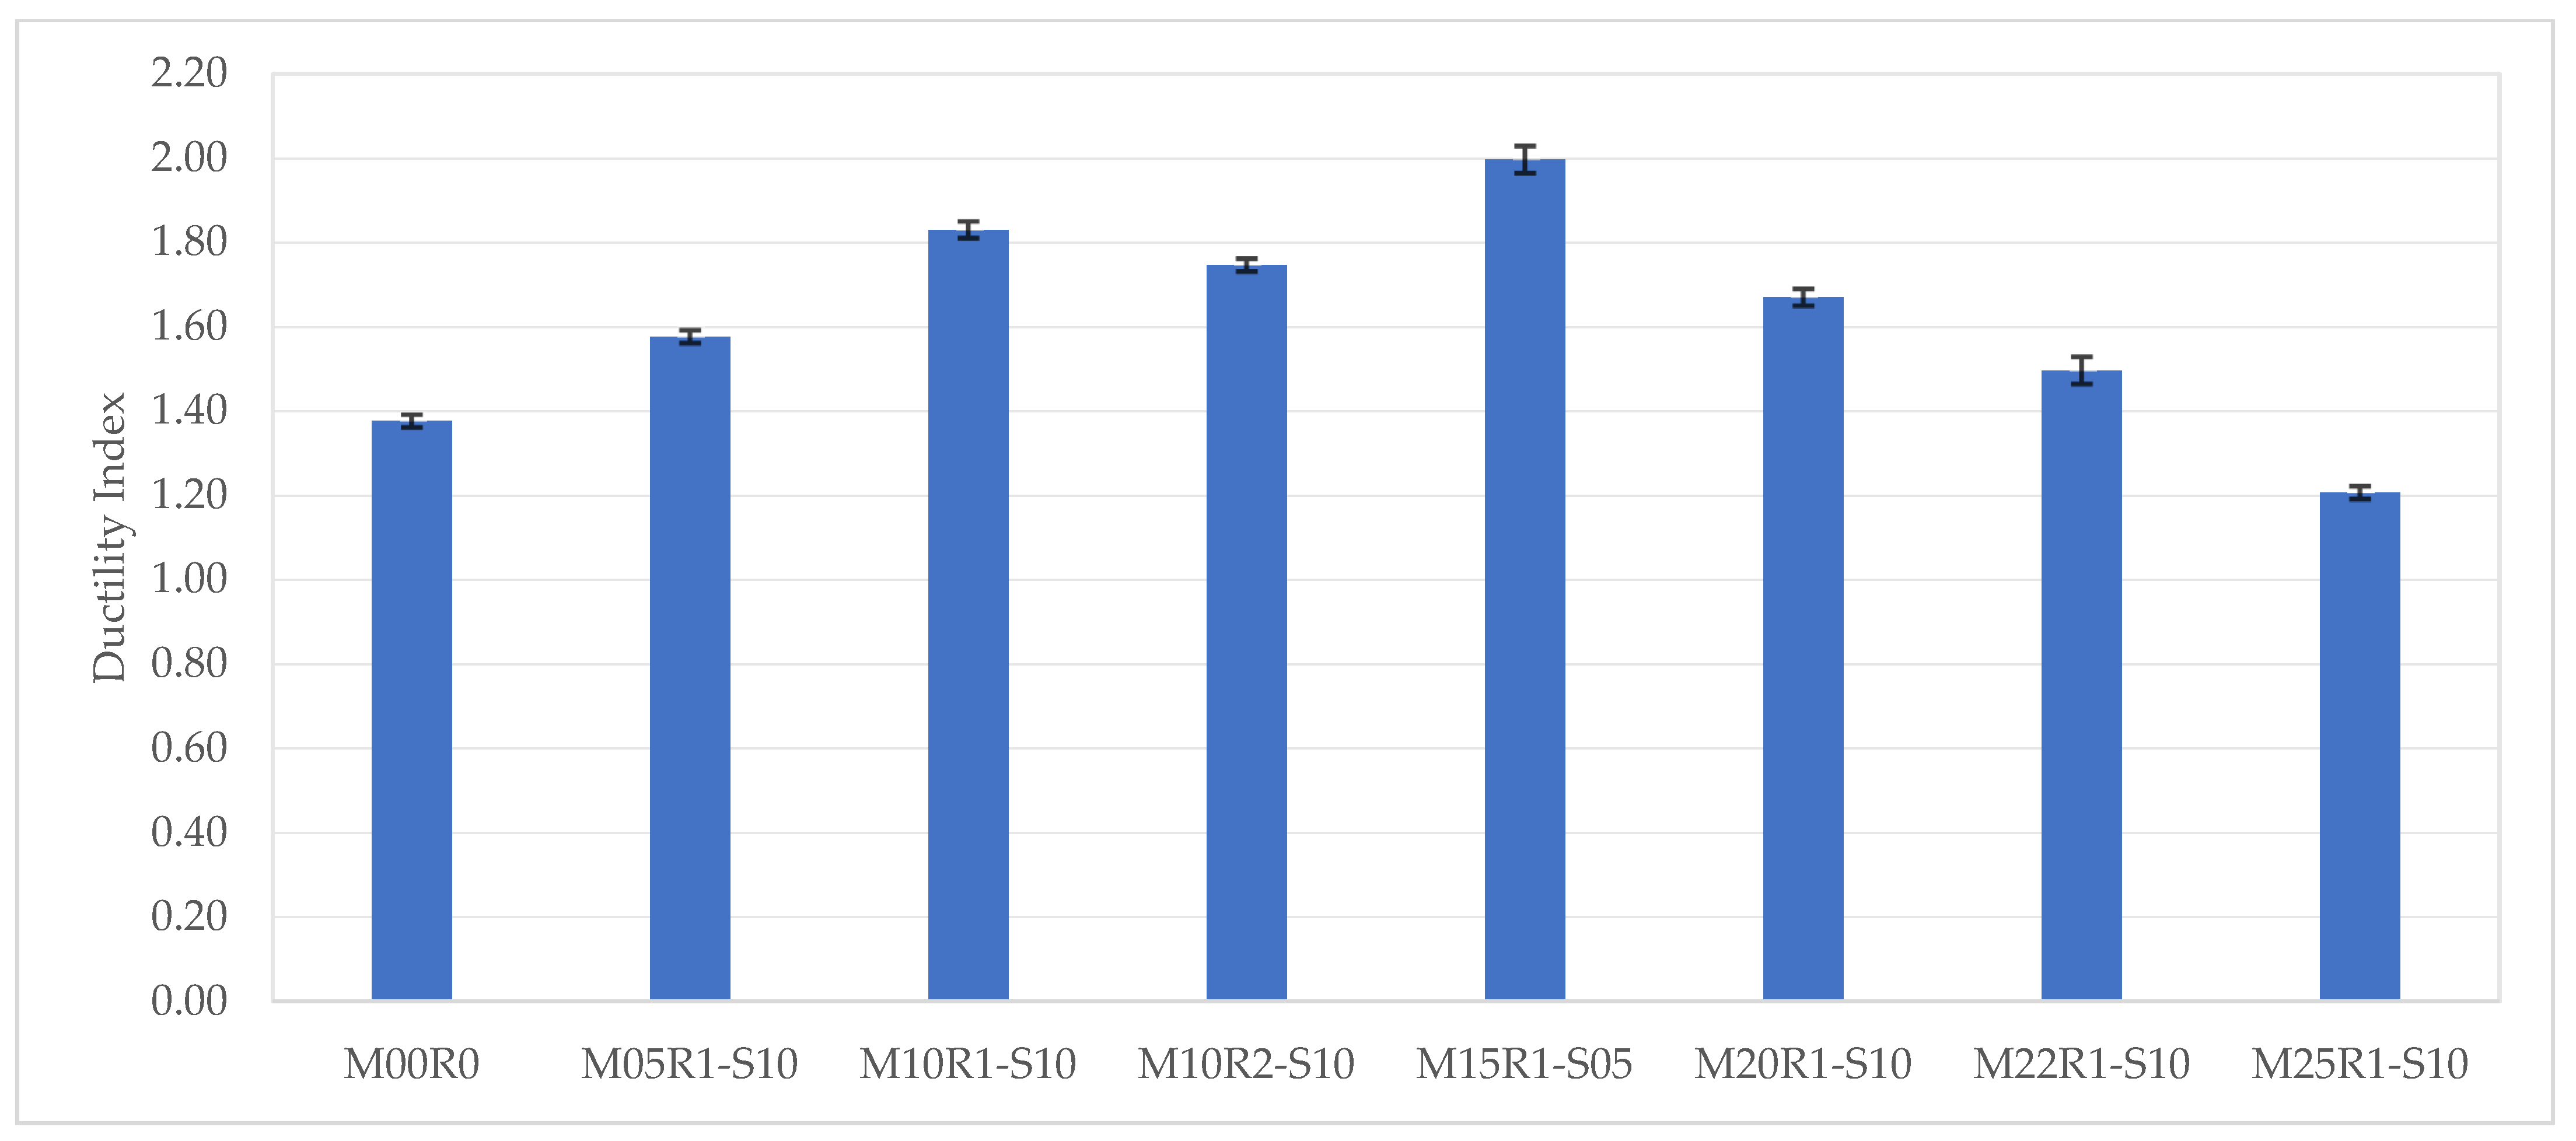
Ductility is the ability of a material to be plastically deformed without fracture [71]. The ductility index “DI” is defined in terms of the ratio of the ultimate deflection “Δu” to the yield deflection “Δi”. Figure 15 represents the values of ductility indices for the different specimens studied. It can be seen that specimen M15RI-S05, with the highest flexural toughness, displays the largest ductility index (DI = 2.00). It should be emphasized that the ductility index was positively proportional to the flexural toughness. Compared with specimen M15R1-S05, the ductility indices of specimens M10R1-S10, M10R2-S10, M20R1-S10, M05R1-S10, M22R1-S10, M00R0 and M25R1-S10 decrease by 8%, 13%, 17%, 21%, 25%, 31% and 39%, respectively. This is likely attributed to the ductility property of plastic mesh as it could sustain large deformation prior to yielding. Figure 16 displays the relationship between ductility index and flexural toughness. There exists a positive relationship between the two parameters for the values obtained from the experimental data.

3.1.4. Normalization of Experimental Data

Table 4 presents the ratios of flexural parameters (i.e., ultimate capacity, flexural toughness, ductility) with reference to the plain mortar and to the mortar containing plastic mesh without voids. With reference to the plain mortar beam (PMB), the ultimate capacity of beam is generally higher from nearly 5%, for the plastic sheet that does not contain any voids, to about 39%. Furthermore, the ratio of the ultimate capacity of beams in relation to the beam containing plastic mesh without voids (M00R0) ranges from 0.98 to 1.29. With regard to the flexural toughness (FT), there is a large difference between beams containing plastic sheets (with and without voids) compared to that of the PMB. However, comparing the FT of beams with reference to M00R0, the ratios of (FT/FT-R0) range from 0.98 to 1.27. The ductility index of beams containing plastic sheets can be up to 82% higher compared to the PMB. This value is reduced to 45% when compared to the reference beam containing plastic sheets without voids (M00R0). This indicates that the presence of plastic mesh improves the flexural performance of mortar beams. It is worth noting that beam M15R1-S05 exhibits the optimum behavior, which is probably due to combined effects of effective width ratio (EWR) and void ratio (VR).

3.2. Numerical Modeling

It is important to note that the input details of the experimental program were used in the numerical modeling, conducted using a three-dimensional finite element software, ABAQUS.

3.2.1. Methodology

The eight-node linear brick element, C3D8R, was used to model the mortar matrix. However, the plastic material was meshed using the linear four-sided shell element, S4R, with uniformly reduced integration to avoid shear and membrane locking. Furthermore, in order to identify the finest mesh size that provides the optimum solution with a high degree of accuracy and to avoid divergence problems, three mesh sizes of 5 mm, 10 mm and 15 mm were tried. Based on the analysis criteria, the size of 10 mm for both mortar and plastic materials was adopted with a maximum deviation factor of 0.1.
In order to stay within the convergence margin limits, the boundary conditions of the numerical model were set conforming to the experimental work. A rigid body constraint was assigned between the top centerline of the model and a reference point. This constraint was created to avoid any singularity or stress concentration during the loading process. Additionally, the plastic mesh region was embedded within the mortar body through an embedment constraint type. This is to constrain the translation DOF of plastic mesh to the interpolated values of the correspondent values of mortar [72]. In order to avoid any instability, both opposite ends of the model were restrained against the out-of-plan translation direction. Likewise, the models were subjected to three-point loading, and the beam supports were pinned. Accordingly, the load was imposed using a uniform axial-displacement-controlled method of 7 mm. Furthermore, to investigate the non-linear failure of a structure, the models were simulated using the Static Riks method [73]. The mesh configurations and boundary conditions are illustrated in Figure 17.
The non-linear behavior of mortar specimens was performed using Concrete Damage Plasticity (CDP), which is a known constitutive method based on the plastic flow theory and used to analyze the concrete behavior [74]. Many studies proved that the CDP method successfully simulated the mortar matrix as its behavior is similar to that of concrete in both compression and tension [75,76,77]. CDP was proposed by Lubliner et al. [78] and further modified according to the suggestions of Lee and Fenves [79]. These modifications were reported to highlight the mortar stiffness development under compression and tension. In this work, many output parameters were evaluated, i.e., failure mode, inelastic strain and cracks, stiffness degradation, deflection and ultimate capacity. The CDP method follows the classical theory of plasticity. The inelastic strain in compression ε i n and the cracking strain in tension ε c k are calculated using Equations (4) and (5):
ε i n = ε c σ c E 0
ε c k = ε t σ t E 0
where “σc” and “σt” represent the compressive and tensile stresses in mortar, respectively, and “E0” is the young modulus of mortar.
Figure 18 shows the degradation phenomena of mortar subjected to compression and tension loading. It was depicted that the compressive crushing and tensile cracking of mortar were mainly affected by two isotropic damage variables, “dc” (compression) and “dt” (tension). These parameters vary from 0 (undamaged) to 1 (fully damaged), and could be determined by Equations (6) and (7):
d c = 1 σ c E 0 ε c ε c p l
d t = 1 σ t E 0 ε t ε t p l
Accordingly, two isotropic hardening parameters denoted as plastic strains in compression “ ε c p l ” and tension “ ε t p l ” are computed as per Equations (8) and (9). It is good to know that these parameters were proposed to quantify the stiffness degradation and surface failure of mortar through the un-axial compression and tension loading process [80]. Table 5 displays the parameters and properties of mortar used in the CDP method.
ε c p l = ε i n d c 1 d c σ c E 0
ε t p l = ε c k d t 1 d t σ t E 0
The plastic material used in this paper was simulated according to the Hashin Failure criterion. This criterion is repeatedly implemented in ABAQUS by many researchers as it successfully provides excellent results in modeling the damages of composite structures [81,82]. Hashin criteria are distinguished through the different failure types by the definition of four failure modes of unidirectional lamina as follows:
Tensile fiber failure:
F f t = σ 11 X T 2 + τ 12 S L 2
Compressive fiber failure:
F f c = σ 11 X C 2
Tensile matrix failure:
F m t = σ 22 Y T 2 + τ 12 S L 2
Compressive matrix failure:
F m c = σ 22 2 S T 2 + Y C 2 S T 2 1 σ 22 Y C + τ 12 S L 2
In these equations, σ11 and σ22 denote the stress through directions one and two, respectively. XT and XC represent the tensile and compressive strength in the fiber direction, YT and YC indicate the tensile and compressive strength in the matrix direction and SL and ST are the shear strength of fiber in longitudinal and transversal directions.

3.2.2. Numerical Results

Compared to the experimental outcomes, the numerical results reveal a good convergence. The average discrepancy is not more than 7%, as noted in Table 6. Therefore, the concrete damage plasticity method accurately calibrates the experimental work. In other words, the CDP method demonstrates the precision of simulating mortar beams layered with plastic meshes under the effect of flexural loading.
The experimental and numerical load–displacement plots of all specimens are compared in Figure 19. Analogous to the experimental findings, it can be seen that the ultimate capacity is proportional to EWR up to a threshold value. Afterwards, the relation becomes inversely proportional. The enlargement in the effective mesh increases the bond between mortar and plastic mesh, which in turn leads to an increase in the flexural toughness. Afterwards, this relationship would no longer stay positive as the toughness decreases with higher EWR. A similar trend is shown for the flexural toughness.
It is important to mention that axis one, two and three in ABAQUS are symbolized by x, y and z, respectively. In addition, the tensile stresses and forces are preceded by a positive sign while compression ones are negatives. Moreover, blue volumes of mortar body in the ABAQUS visualization indicate no damage, while red ones signify full damage. Examine now the behavior of the models simulated in ABAQUS. It is interesting to note that all models demonstrated an identical behavior. Therefore, let us emphasize the behavior of model M15R1-S05 displayed in Figure 20a. This model exhibited the highest ultimate capacity and flexural toughness. The flexural behavior of M15R1-S05 passes through three principal phases: the first is the elastic zone, which corresponds to the linear upward part of the curve. This phase ends concurrently with the appearance of the first red volume. At this limit, the second phase starts and continues up to the ultimate capacity. This phase is accompanied by the development of more red volumes in the mortar body, i.e., newest crack development. Beyond the peak load limit, the last zone begins reporting the start of the stiffness degradation. The load falls immediately by about 43%, succeeded by a slight increase of 10%. As stated earlier, this small improvement in flexural capacity is likely attributed to the tensile resistance provided by the second plastic mesh layer (Figure 20b). Afterwards, the load diminishes steadily as the energy absorbed by plastic layers dissipates, and the simulation is terminated at a controlled vertical deformation of 7 mm. Consequently, the numerical analysis simulates accurately the tensile stress in plastic layers and the mortar crushing failure as exhibited in the experimental program.

4. Conclusions and Recommendations

This paper investigates the flexural performance of mortar beams reinforced with recycled plastic mesh. To achieve this objective, mortar specimens containing plastic mesh with different effective widths and void ratios were tested under flexural loading. To compare with the experimental results, a numerical simulation was performed on all tested beams. It must be borne in mind that this investigation is limited to one geometrical shape of voids and did not consider other shapes. Furthermore, one specimen size was considered. Within these limitations, the following conclusions can be made:
  • All mortar specimens reinforced with plastic mesh exhibit ductile failure behavior. This ductility is likely to be due to the improved bond effect between plastic mesh and mortar, which limits the propagation of cracks while sustaining large deformations.
  • Beams reinforced with plastic mesh without any voids fail by the crushing of mortar volumes with a gradual pullout of the plastic sheet from the mortar matrix. This is mostly due to the bond weakness of the plastic sheet with mortar paste in the absence of voids, which cause delamination. In addition, the beam containing a void ratio of 0.05 exhibits a similar behavior pattern. However, the remaining specimens containing perforated plastic mesh fail with the rupture of the plastic meshes.
  • The mesh’s effective width ratio (EWR) has a significant importance for the ultimate capacity of mortar samples. The maximum load increases as EWR increases up to a threshold value of about 0.5. It can be deduced that the plastic mesh performs the role of crack arrestor by delaying the cracks’ propagation. Beyond this threshold value, there is a decline in the ultimate capacity to an EWR of 1. A similar trend is observed between the flexural toughness and EWR.
  • There exists a relationship between the VR and the flexural toughness. As the VR increases from 0 to 0.31, the flexural toughness goes up. Beyond a VR value of 0.31 and up to 0.57, the flexural toughness begins to decrease.
  • From the experimental data, between a ductility index of 1.21 and 2, there is a positive relationship between the ductility index and the flexural toughness.
  • Compared with the experimental outcomes, the numerical results show a good convergence. The average discrepancy is not more than 7%. Therefore, the concrete damage plasticity (CDP) method accurately calibrates the experimental work. In other words, the CDP method demonstrates the precision of simulating mortar beams layered with plastic meshes under the effect of flexural loading.
  • Using waste plastic in cementitious applications will contribute towards sustainable development in that waste materials are re-used, which has a positive environmental impact. Moreover, some properties (e.g., ductility, flexural strength) of the cementitious materials are improved by using the waste materials at a reduced cost.
  • The work in this investigation was conducted on specimens which are of a small size. Future work may include larger and prototype specimen. In addition, different void geometrical shapes should be examined. The effect of varying the friction coefficient between the polymer and the matrix, the effect of the number of plastic mesh layers on energy absorption characteristics and stress analysis in the plastic mesh with different patterns can form the subject of future investigations.

Author Contributions

Conceptualization, H.G. and S.C.; methodology, H.G. and J.K.; formal analysis, H.G. and S.C.; writing—original draft preparation, H.G. and S.C.; writing—review and editing, J.K., A.E. and H.G.; supervision, J.K. and A.E.; project administration, H.G. and S.C. All authors have read and agreed to the published version of the manuscript.

Funding

This research received no external funding.

Institutional Review Board Statement

Not applicable.

Informed Consent Statement

Not applicable.

Data Availability Statement

Data sharing is not applicable to this article.

Acknowledgments

The authors gratefully acknowledge the support of technical staff at BAU.

Conflicts of Interest

The authors declare no conflict of interest.

References

  1. Safiuddin; Abdel-Sayed, G.; Hearn, N. Flexural and Impact Behaviors of Mortar Composite Including Carbon Fibers. Materials 2022, 15, 1657. [Google Scholar] [CrossRef] [PubMed]
  2. Park, J.; You, J.; Park, S.K.; Hong, S. Flexural Behavior of Textile Reinforced Mortar-Strengthened Reinforced Concrete Beams Subjected to Cyclic Loading. Buildings 2022, 12, 1738. [Google Scholar] [CrossRef]
  3. Wydra, M.; Dolny, P.; Sadowski, G.; Fangrat, J. Flexural Behaviour of Cementitious Mortars with the Addition of Basalt Fibres. Materials 2021, 14, 1334. [Google Scholar] [CrossRef] [PubMed]
  4. Kubica, J.; Galman, I. Investigations on Flexural and Compressive Strengths of Mortar Dedicated to Clinker Units—Influence of Mixing Water Content and Curing Time. Materials 2022, 15, 347. [Google Scholar] [CrossRef]
  5. Almeida, J.; Faria, P.; Ribeiro, A.B.; Silva, A.S. Effect of mining residues treated with an electrodialytic technology on cement-based mortars. Clean. Eng. Technol. 2020, 1, 100001. [Google Scholar] [CrossRef]
  6. Almeida, J.; Faria, P.; Ribeiro, A.B.; Silva, A.S. Cement-based mortars production applying mining residues treated with an electro-based technology and a thermal treatment: Technical and economic effects. Constr. Build. Mater. 2021, 280, 122483. [Google Scholar] [CrossRef]
  7. Li, L.; Wang, Y.; Tan, Y.; Kwan, A. Filler technology of adding granite dust to reduce cement content and increase strength of mortar. Powder Technol. 2019, 342, 388–396. [Google Scholar] [CrossRef]
  8. Liang, S.; Du, H.; Liu, Y.; Chen, Y.; Liu, J.; Wei, Y. Experimental study and mesoscale finite element modeling of elastic modulus and flexural creep of steel fiber-reinforced mortar. Constr. Build. Mater. 2023, 363, 129875. [Google Scholar] [CrossRef]
  9. Kheddache, L.; Aribi, C.; Chahour, K.; Safi, B. Highlighting of the distribution effect of steel hook fibers at low and high dosage on the flexural strength of self-compacting mortars. Mater. Today Proc. 2022, 52, 1384–1390. [Google Scholar] [CrossRef]
  10. Chen, H.; Wang, P.; Pan, J.; Lawi, A.; Zhu, Y. Effect of alkali-resistant glass fiber and silica fume on mechanical and shrinkage properties of cement-based mortars. Constr. Build. Mater. 2021, 307, 125054. [Google Scholar] [CrossRef]
  11. Farinha, C.B.; de Brito, J.; Veiga, R. Incorporation of high contents of textile, acrylic and glass waste fibres in cement-based mortars. Influence on mortars’ fresh, mechanical and deformability behaviour. Constr. Build. Mater. 2021, 303, 124424. [Google Scholar] [CrossRef]
  12. Van Thillo, L.; Blom, J.; Moreels, A.; Craeye, B. Influence of aggregates, glass fibre reinforcement and recycled aggregates on polyester mortar. Constr. Build. Mater. 2021, 293, 123534. [Google Scholar] [CrossRef]
  13. María, R.-M.; Paula, V.-L.; Jaime, F.-G.; Jorge, L. Improvement of tensile properties of carbon fibre-reinforced cementitious matrix composites with coated textile and enhanced mortars. Constr. Build. Mater. 2023, 369, 130552. [Google Scholar] [CrossRef]
  14. Pham, L.T.D.; Woo, U.; Choi, K.-K.; Choi, H. Tensile characteristics of carbon textile-reinforced mortar incorporating short amorphous metallic and nylon fibers under designed environmental conditions. Constr. Build. Mater. 2022, 352, 129059. [Google Scholar] [CrossRef]
  15. Al-Tulaian, B.; Al-Shannag, M.; Al-Hozaimy, A. Recycled plastic waste fibers for reinforcing Portland cement mortar. Constr. Build. Mater. 2016, 127, 102–110. [Google Scholar] [CrossRef]
  16. Orouji, M.; Zahrai, S.M.; Najaf, E. Effect of glass powder & polypropylene fibers on compressive and flexural strengths, toughness and ductility of concrete: An environmental approach. Structures 2021, 33, 4616–4628. [Google Scholar] [CrossRef]
  17. Ghanem, H.; Obeid, Y.; Trad, A.; Dandachy, M. The impact of steel fibers on the properties of self compacting concrete. In Advances and Challenges in Structural Engineering. GeoMEast 2018. Sustainable Civil Infrastructures; Springer International Publishing: Cham, Switzerland, 2019; pp. 138–150. [Google Scholar]
  18. Siddique, R.; Khatib, J.; Kaur, I. Use of recycled plastic in concrete: A review. Waste Manag. 2008, 28, 1835–1852. [Google Scholar] [CrossRef]
  19. UN Environment Programme. UNEP. 2022. Available online: https://www.unep.org/interactives/beat-plastic-pollution/ (accessed on 24 December 2022).
  20. Organisation for Economic Co-Operation and Development (OECD). 2022. Available online: https://www.oecd.org/environment/ (accessed on 20 December 2022).
  21. Rathore, R.S.; Chouhan, H.S.; Prakash, D. Influence of plastic waste on the performance of mortar and concrete: A review. Mater. Today Proc. 2021, 47, 4708–4711. [Google Scholar] [CrossRef]
  22. Goumans, J.; van der Sloot, H.; Aalbers, T. Waste materials in construction. In Studies in Environmental Science; Elsevier Science Publishing Company Inc.: New York, NY, USA, 1991; Volume 48. [Google Scholar]
  23. Alhazmi, H.; Almansour, F.H.; Aldhafeeri, Z. Plastic waste management: A review of existing life cycle assessment studies. Sustainability 2021, 13, 5340. [Google Scholar] [CrossRef]
  24. Ismail, Z.Z.; Al-Hashmi, E.A. Use of waste plastic in concrete mixture as aggregate replacement. Waste Manag. 2008, 28, 2041–2047. [Google Scholar] [CrossRef]
  25. Cudjoe, D.; Wang, H. Plasma gasification versus incineration of plastic waste: Energy, economic and environmental analysis. Fuel Process. Technol. 2022, 237, 107470. [Google Scholar] [CrossRef]
  26. Safi, B.; Saidi, M.; Aboutaleb, D.; Maallem, M. The use of plastic waste as fine aggregate in the self-compacting mortars: Effect on physical and mechanical properties. Constr. Build. Mater. 2013, 43, 436–442. [Google Scholar] [CrossRef]
  27. Adnan, H.M.; Dawood, A.O. Recycling of plastic box waste in the concrete mixture as a percentage of fine aggregate. Constr. Build. Mater. 2021, 284, 122666. [Google Scholar] [CrossRef]
  28. Islam, M.J.; Shahjalal, M.; Haque, N.M. Mechanical and durability properties of concrete with recycled polypropylene waste plastic as a partial replacement of coarse aggregate. J. Build. Eng. 2022, 54, 104597. [Google Scholar] [CrossRef]
  29. Ibrahim, A.A.; Najla’a, H.; Jaber, M.H.; Hassan, R.F.; Hussein, H.H.; Al-Salim, N.H. Experimental investigation of flexural and shear behaviors of reinforced concrete beam containing fine plastic waste aggregates. Structures 2022, 43, 834–846. [Google Scholar] [CrossRef]
  30. Ozbakkaloglu, T.; Gu, L.; Gholampour, A. Short-term mechanical properties of concrete containing recycled polypropylene coarse aggregates under ambient and elevated temperature. J. Mater. Civ. Eng. 2017, 29, 04017191. [Google Scholar] [CrossRef]
  31. Islam, M.J.; Meherier, M.S.; Islam, A.R. Effects of waste PET as coarse aggregate on the fresh and harden properties of concrete. Constr. Build. Mater. 2016, 125, 946–951. [Google Scholar]
  32. Kore, S.D. Feasibility Study on Use of Plastic Waste as Fine Aggregate in Concrete Mixes. J. Build. Mater. Sci. 2019, 2019, 1204. [Google Scholar] [CrossRef]
  33. Hama, S.M. Behavior of concrete incorporating waste plastic as fine aggregate subjected to compression, impact load and bond resistance. Eur. J. Environ. Civ. Eng. 2022, 26, 3372–3386. [Google Scholar] [CrossRef]
  34. Bag, R.; Agarwal, A.; Praneeth, R. Recycling of domestic plastic waste bags as fine aggregate in concrete. IOP Conf. Ser. Mater. Sci. Eng. 2020, 936, 012009. [Google Scholar] [CrossRef]
  35. Juki, M.I.; Awang, M.; Annas, M.M.; Boon, K.H.; Othman, N.; Roslan, M.A.; Khalid, F.S. Relationship between compressive, splitting tensile and flexural strength of concrete containing granulated waste polyethylene terephthalate (PET) bottles as fine aggregate. Adv. Mater. Res. 2013, 795, 356–359. [Google Scholar] [CrossRef] [Green Version]
  36. Bamigboye, G.; Tarverdi, K.; Adigun, D.; Daniel, B.; Okorie, U.; Adediran, J. An appraisal of the mechanical, microstructural, and thermal characteristics of concrete containing waste PET as coarse aggregate. Clean. Waste Syst. 2022, 1, 100001. [Google Scholar] [CrossRef]
  37. Khatib, J.M.; Herki, B.A.; Elkordi, A. Characteristics of concrete containing EPS. In Use of Recycled Plastics in Eco-Efficient Concrete; Elsevier: Amsterdam, The Netherlands, 2019; pp. 137–165. [Google Scholar]
  38. Bahij, S.; Omary, S.; Feugeas, F.; Faqiri, A. Fresh and hardened properties of concrete containing different forms of plastic waste–A review. Waste Manag. 2020, 113, 157–175. [Google Scholar] [CrossRef]
  39. Ali, O.K.; Al-Hadithi, A.I.; Noaman, A.T. Flexural performance of layered PET fiber reinforced concrete beams. Structures 2022, 35, 55–67. [Google Scholar]
  40. Saikia, N.; De Brito, J. Mechanical properties and abrasion behaviour of concrete containing shredded PET bottle waste as a partial substitution of natural aggregate. Constr. Build. Mater. 2014, 52, 236–244. [Google Scholar] [CrossRef]
  41. Juki, M.I.; Muhamad, K.; Annas, M.M.; Boon, K.H.; Othman, N.; Asyraf, R.M.; Khalid, F.S. Development of concrete mix design nomograph containing polyethylene terephtalate (PET) as fine aggregate. Adv. Mater. Res. 2013, 701, 12–16. [Google Scholar] [CrossRef] [Green Version]
  42. Frigione, M. Recycling of PET bottles as fine aggregate in concrete. Waste Manag. 2010, 30, 1101–1106. [Google Scholar] [CrossRef]
  43. Ghanem, H.; Chahal, S.; Khatib, J.; Elkordi, A. Flexural Behavior of Concrete Beams Reinforced with Recycled Plastic Mesh. Buildings 2022, 12, 2085. [Google Scholar] [CrossRef]
  44. Khatib, J.M.; Jahami, A.; Elkordi, A.; Abdelgader, H.; Sonebi, M. Structural assessment of reinforced concrete beams incorporating waste plastic straws. Environments 2020, 7, 96. [Google Scholar] [CrossRef]
  45. Khatib, J.; Jahami, A.; Elkordi, A.; Baalbaki, O. Structural performance of reinforced concrete beams containing plastic waste caps. Mag. Civ. Eng. 2019, 7, 73–79. [Google Scholar]
  46. Alani, A.H.; Johari, M.A.; Noaman, A.T.; Bunnori, N.M.; Majid, T.A. Effect of the incorporation of PET fiber and ternary blended binder on the flexural and tensile behaviour of ultra-high performance green concrete. Constr. Build. Mater. 2022, 331, 127306. [Google Scholar] [CrossRef]
  47. Alsaif, A.; Alshannag, M. Flexural Behavior of Portland Cement Mortars Reinforced with Hybrid Blends of Recycled Waste Fibers. Sustainability 2022, 14, 13494. [Google Scholar] [CrossRef]
  48. Shaikh, F.U. Tensile and flexural behaviour of recycled polyethylene terephthalate (PET) fibre reinforced geopolymer composites. Constr. Build. Mater. 2020, 245, 118438. [Google Scholar] [CrossRef]
  49. Irmawaty, R.; Djamaluddin, R. Flexural behavior of monolith and hybrid concrete beams produced through the partial replacement of coarse aggregate with PET waste. Structures 2022, 43, 1134–1144. [Google Scholar]
  50. Mohammed, A.A. Flexural behavior and analysis of reinforced concrete beams made of recycled PET waste concrete. Constr. Build. Mater. 2017, 155, 593–604. [Google Scholar] [CrossRef]
  51. Hawileh, R.A.; Mhanna, H.H.; Al Rashed, A.; Abdalla, J.A.; Naser, M.Z. Flexural behavior of RC beams externally bonded with polyethylene terephthalate (PET) fiber reinforced polymer (FRP) laminates. Eng. Struct. 2022, 256, 114036. [Google Scholar] [CrossRef]
  52. Tang, C.; Liu, J.; Hao, W.; Wei, Y. Flexural properties of 3D printed graded lattice reinforced cementitious composites using digital image correlation. Mater. Design 2023, 13, 111734. [Google Scholar] [CrossRef]
  53. Liu, J.; Kanwal, H.; Tang, C.; Hao, W. Study on flexural properties of 3D printed lattice-reinforced concrete structures using acoustic emission and digital image correlation. Constr. Build. Mater. 2022, 333, 127418. [Google Scholar]
  54. Cao, X.; Yu, S.; Wu, S.; Cui, H. Experimental study of hybrid manufacture of printing and cast-in-process to reinforce 3D-printed concrete. Constr. Build. Mater. 2023, 362, 129639. [Google Scholar] [CrossRef]
  55. Marchment, T.; Sanjayan, J. Bond properties of reinforcing bar penetrations in 3D concrete printing. Autom. Constr. 2020, 120, 103394. [Google Scholar]
  56. Marchment, T.; Sanjayan, J. Mesh reinforcing method for 3D Concrete Printing. Autom. Constr. 2020, 109, 102992. [Google Scholar] [CrossRef]
  57. Skoratko, A.; Szatkiewicz, T.; Katzer, J.; Jagoda, M. Mechanical properties of mortar beams reinforced by gyroid 3D printed plastic spatial elements. Cem. Concr. Composites 2022, 134, 104809. [Google Scholar] [CrossRef]
  58. Lin, A.; Tan, Y.K.; Wang, C.H.; Kua, H.W.; Taylor, H. Utilization of waste materials in a novel mortar–polymer laminar composite to be applied in construction 3D-printing. Compos. Struct. 2020, 253, 112764. [Google Scholar] [CrossRef]
  59. Feng, P.; Meng, X.; Zhang, H. Mechanical behavior of FRP sheets reinforced 3D elements printed with cementitious materials. Compos. Struct. 2015, 134, 331–342. [Google Scholar] [CrossRef]
  60. Junaid, M.T.; Shweiki, A.; Barakat, S.; Alhalabi, M.; Mostafa, O. Flexural characterization and ductility assessment of small-scale mortar beams reinforced with 3D-printed polymers. Structures 2022, 45, 1751–1761. [Google Scholar] [CrossRef]
  61. ASTM D638; Standard Test Method for Tensile Properties of Plastics. ASTM International: West Conshohocken, PA, USA, 2014.
  62. Callister, W.D.; Rethwisch, D.G. Materials Science and Engineering: An Introduction; Wiley & Sons: New York, NY, USA, 2020. [Google Scholar]
  63. Khaleed, H.M.; Badruddin, I.A.; Saquib, A.N.; Addas, M.F.; Kamangar, S.; Yunus Khan, T.M. Novel approach to manufacture an AUV propeller by additive manufacturing and error analysis. Appl. Sci. 2019, 9, 4413. [Google Scholar] [CrossRef] [Green Version]
  64. ASTM C150; Standard Specification for Portland Cement. In Annual Book of ASTM Standards. American Society for Testing and Materials: West Conshohocken, PA, USA, 2001.
  65. ASTM C33; Standard Specification for Concrete Aggregates. ASTM International: West Conshohocken, PA, USA, 2018.
  66. ASTM C348/2; Standard Test Method for Flexural Strength of Hydraulic-Cement Mortars. American Society for Testing and Materials: West Conshohocken, PA, USA, 2021.
  67. ASTM C305; Standard Practice for Mechanical Mixing of Hydraulic Cement Pastes and Mortars of Plastic Consistency. Annual Book of ASTM Standards. American Society for Testing and Materials: West Conshohocken, PA, USA, 2006.
  68. ASTM C1437-20; Standard Test Method for Flow of Hydraulic Cement Mortar. ASTM International: West Conshohocken, PA, USA, 2020. Available online: https://www.astm.org/c1437-15.html (accessed on 13 October 2022).
  69. ASTM C109/C109M-20; Standard Test Method for Compressive Strength of Hydraulic Cement Mortars (Using 2-in. or [50-mm] Cube Specimens). ASTM International: West Conshohocken, PA, USA, 2020. [CrossRef]
  70. Wu, Z.; Shen, Y.; Pan, Z.; Hu, X. Three-point Bending Behavior and Energy Absorption Capacity of Composite Tube Reinforced by Gradient Braided Structure in Radial Direction. Fibers Polym. 2019, 20, 1455–1466. [Google Scholar] [CrossRef]
  71. Hughes, S.E. (Ed.) A Quick Guide to Welding and Weld Inspection; Elsevier: Amsterdam, The Netherlands, 2009. [Google Scholar]
  72. Dere, Y.; Koroglu, M.A. Nonlinear FE modeling of reinforced concrete. Int. J. Struct. Civ. Eng. Res. 2017, 6, 71–74. [Google Scholar] [CrossRef]
  73. Chahal, S.; Baalbaki, O.; Temsah, Y.; Ghanem, H.; Abu, S.Z. Performance of two-way hinges in reinforced concrete structures. Mag. Civ. Eng. 2021, 2, 10204. [Google Scholar]
  74. Tysmans, T.; Wozniak, M.; Remy, O.; Vantomme, J. Finite element modelling of the biaxial behaviour of high-performance fibre-reinforced cement composites (HPFRCC) using Concrete Damaged Plasticity. Finite Elem. Anal. Des. 2015, 100, 47–53. [Google Scholar] [CrossRef]
  75. Du, X.; Jin, L.; Ma, G. Numerical simulation of dynamic tensile-failure of concrete at meso-scale. Int. J. Impact Eng. 2014, 66, 5–17. [Google Scholar] [CrossRef]
  76. Grote, D.L.; Park, S.W.; Zhou, M. Dynamic behavior of concrete at high strain rates and pressures: I. experimental characterization. Int. J. Impact Eng. 2001, 25, 869–886. [Google Scholar] [CrossRef]
  77. Wang, J.; Jivkov, A.P.; Engelberg, D.L.; Li, Q. Meso-scale modelling of mechanical behaviour and damage evolution in normal strength concrete. Procedia Struct. Integr. 2018, 13, 560–565. [Google Scholar] [CrossRef]
  78. Lubliner, J.; Oliver, J.; Oller, S.; Oñate, E. A plastic-damage model for concrete. Int. J. Solids Struct. 1989, 25, 299–326. [Google Scholar] [CrossRef]
  79. Lee, J.; Fenves, G.L. Plastic-damage model for cyclic loading of concrete structures. J. Eng. Mech. 1998, 124, 892–900. [Google Scholar] [CrossRef]
  80. Hafezolghorani, M.; Hejazi, F.; Vaghei, R.; Jaafar, M.S.; Karimzade, K. Simplified damage plasticity model for concrete. Struct. Eng. Int. 2017, 27, 68–78. [Google Scholar] [CrossRef]
  81. Maziz, A.; Tarfaoui, M.; Rechak, S.; Nachtane, M.; Gemi, L. Finite Element Analysis of Impact-Induced Damage in Pressurized Hybrid Composites Pipes. Int. J. Appl. Mech. 2021, 13, 2150074. [Google Scholar] [CrossRef]
  82. Camanho, P.P.; Arteiro, A.; Melro, A.R.; Catalanotti, G.; Vogler, M. Three-dimensional invariant-based failure criteria for fibre-reinforced composites. Int. J. Solids Struct. 2015, 55, 92–107. [Google Scholar]
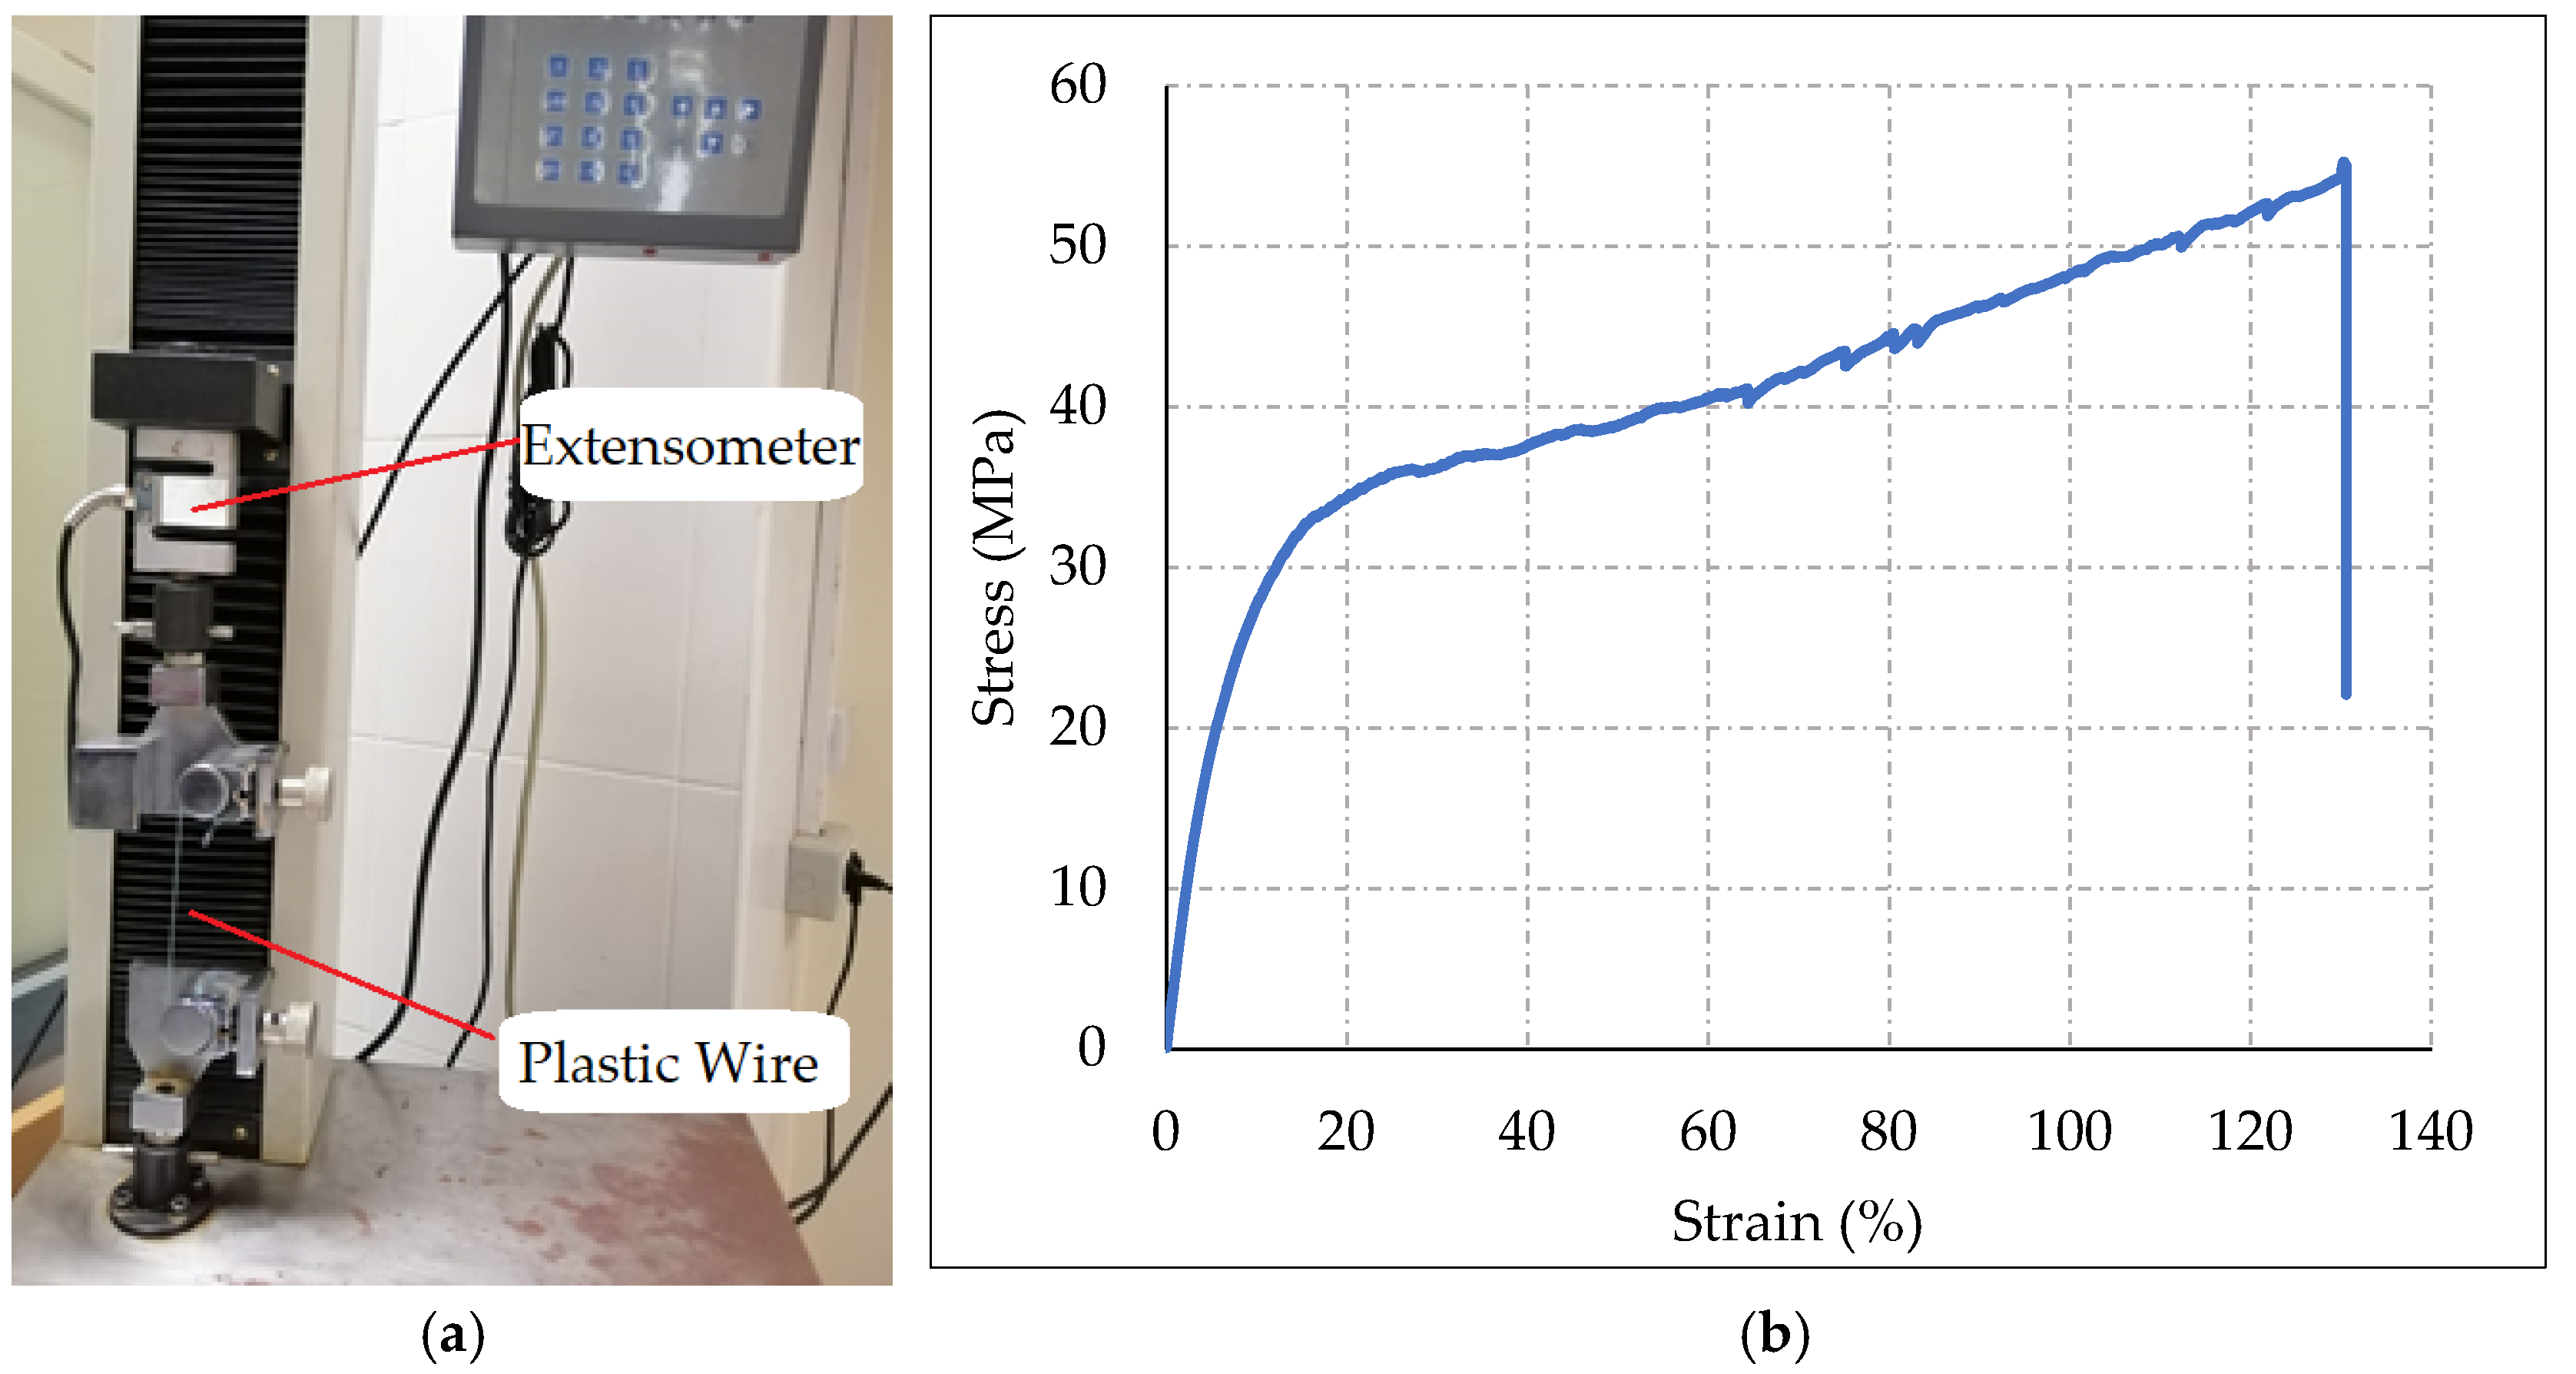
Figure 1. Plastic wire: (a) tensile strength test and (b) stress–strain curve.
Sustainability 15 05640 g001
Figure 2. Sand particle size distribution.
Sustainability 15 05640 g002
Figure 3. Preparation of plastic mesh: (a) empty water containers; (b) laser cutting machine; (c) laser motion control and (d) final pattern cutting.
Sustainability 15 05640 g003aSustainability 15 05640 g003b
Figure 4. Patterns of plastic mesh.
Sustainability 15 05640 g004aSustainability 15 05640 g004b
Figure 5. Mortar strength: (a) mortar cube compressive test and (b) stress–strain curve.
Sustainability 15 05640 g005
Figure 6. Casting of mortar specimens: (a) 1st/2nd mesh insertion and (b) fully cast specimens.
Sustainability 15 05640 g006
Figure 7. Test setup: (a) testing machine and (b) specimen dimensions.
Sustainability 15 05640 g007
Figure 8. Experimental test; load–displacement curves.
Sustainability 15 05640 g008
Figure 9. Load–displacement curve of beam M10R1-S10.
Sustainability 15 05640 g009
Figure 10. Failure pattern of beam failed by (a) slippage of the plastic sheet, and (b) rupture of the plastic mesh.
Sustainability 15 05640 g010
Figure 11. Relationship between EWR and ultimate capacity.
Sustainability 15 05640 g011
Figure 12. Flexural toughness of mortar specimens.
Sustainability 15 05640 g012
Figure 13. Relationship between EWR and flexural toughness.
Sustainability 15 05640 g013
Figure 14. Relationship between VR and flexural toughness.
Sustainability 15 05640 g014
Figure 15. Ductility index for mortar beams.
Sustainability 15 05640 g015
Figure 16. Relationship between ductility index and flexural toughness.
Sustainability 15 05640 g016
Figure 17. Numerical Simulation.
Sustainability 15 05640 g017
Figure 18. Behavior of mortar subjected to uniaxial loading: (a) compression and (b) tension [72].
Sustainability 15 05640 g018
Figure 19. Comparison between numerical and experimental results of load–displacement curves.
Sustainability 15 05640 g019aSustainability 15 05640 g019b
Figure 20. Numerical output for beam M15R1-S05.
Sustainability 15 05640 g020aSustainability 15 05640 g020b
Table 1. Mechanical properties of plastic wire and other polymer materials [62,63].
ParameterUnitSymbolPlastic FibersABSPPNylon 6.6
Modulus of ElasticityGPaE10.3132.241.14–1.551.58–3.80
Yield StrengthMPafy25.32031.0–37.244.8–82.8
Ultimate StrengthMPafu55.129.631.0–41.475.9–94.5
Poisson’s Ratio ν0.330.380.4–0.450.39
DensityKN/m3ρ9.3810.390.911.13–1.15
Elongation at Break (%) 1201.4–110100–60015–300
Thermal ConductivityW/m-Kk’0.150.180.120.24
Specific HeatJ/kg-Kcp11701600–213019251670
Table 2. Chemical composition of cement.
OxideSiO2AL2O3Fe2O3CaOMgOSO3Na2OK2OL.O.I
%18.533.933.0661.781.742.920.180.476.3
Table 3. Experimental test results.
ModelEffective Width Ratio (EWR)Mesh Void Ratio
(VR)
Ultimate Capacity, Pu (kN)Flexural Toughness, (N.mm)Yield Deflection, Δy (mm)Ultimate Deflection, Δu (mm)Ductility Index
PMB--1.3254390.190.211.10
M00R01.000.001.41653390.130.181.38
M05R1-S100.830.051.61262380.120.191.58
M10R1-S100.670.161.82367620.120.221.83
M10R2-S100.330.321.69164580.120.211.75
M15R1-S050.500.311.83768050.110.222.00
M20R1-S100.330.461.65461970.120.201.67
M22R1-S100.270.451.45454960.120.181.50
M25R1-S100.170.571.39152480.140.171.21
Table 4. Normalization of flexural parameters.
Reference (PMB)Reference (M00R0)
Model* Pu/Pu-PMB** FT/FT-PMB*** DI/DI-PMB* Pu/Pu-R0** FT/FT-R0*** DI/DI-R0
PMB1.001.001.00---
M00R01.06912.1621.2551.0001.0001.000
M05R1-S101.21714.2101.4361.1381.1681.145
M10R1-S101.37615.4031.6641.2871.2671.326
M10R2-S101.27614.7111.5911.1941.2101.268
M15R1-S051.38615.5011.8181.2971.2751.449
M20R1-S101.24814.1161.5181.1681.1611.210
M22R1-S101.09712.5191.3641.0271.0291.087
M25R1-S101.05011.9541.1000.9820.9830.877
* Pu is the ultimate capacity of beam, Pu-PMB is the ultimate capacity of plain mortar, Pu-R0 is the ultimate capacity of beam containing plastic mesh without voids. ** FT is the flexural toughness of beam, FT-PMB is the flexural toughness of plain mortar, FT-R0 is the flexural toughness of beam containing plastic mesh without voids. *** DI is the ductility of beam, DI-PMB is the ductility of plain mortar, DI-R0 is the ductility of beam containing plastic mesh without voids.
Table 5. Parameters of mortar used in CDP.
ParameterUnitSymbolValue
Compressive StrengthMPaf’c17
Tensile StrengthMPaft2.65
Young’s ModulusMPaE018,853
Poisson’s Ratio ν0.2
DensityKN/m3ρ22
Dilation Angle°ψ28
Eccentricity ɛ0.1
Bi-axial to Uni-axial Strength Ratio fb0/ft01.16
Second Stress Invariant Ratio K0.667
Viscosity parameter μ0.0001
Table 6. Comparison between numerical results and experimental results.
ModelUltimate Capacity, Pu (KN)Flexural Toughness, FT (N.mm)Ductility Index, (DI)
Exp.
Test
Num.
Model
% of
Error
Exp.
Test
Num.
Model
% of
Error
Exp.
Test
Num.
Model
% of
Error
M00R01.4161.4966%533957688%1.381.466%
M05R1-S101.6121.7177%623866026%1.581.697%
M10R1-S101.8231.9145%676271466%1.831.925%
M10R2-S101.6911.8037%645868897%1.751.835%
M15R1-S051.8371.9758%680572386%2.002.105%
M20R1-S101.6541.7395%619766407%1.671.808%
M22R1-S101.4541.5577%549658667%1.501.649%
M25R1-S101.3911.5038%524855997%1.211.253%
Disclaimer/Publisher’s Note: The statements, opinions and data contained in all publications are solely those of the individual author(s) and contributor(s) and not of MDPI and/or the editor(s). MDPI and/or the editor(s) disclaim responsibility for any injury to people or property resulting from any ideas, methods, instructions or products referred to in the content.