The Power Transition under the Interaction of Different Systems—A Case Study of the Guangdong–Hong Kong–Macao Greater Bay Area
Abstract
1. Introduction
2. Materials and Methods
2.1. Types of Local Power Generation and Their Potentials and Trends
2.2. Scenarios and Parameter Setting
2.3. Models and Methods
2.4. Data Sources
3. Results and Discussion
3.1. Analysis of Scenario Results
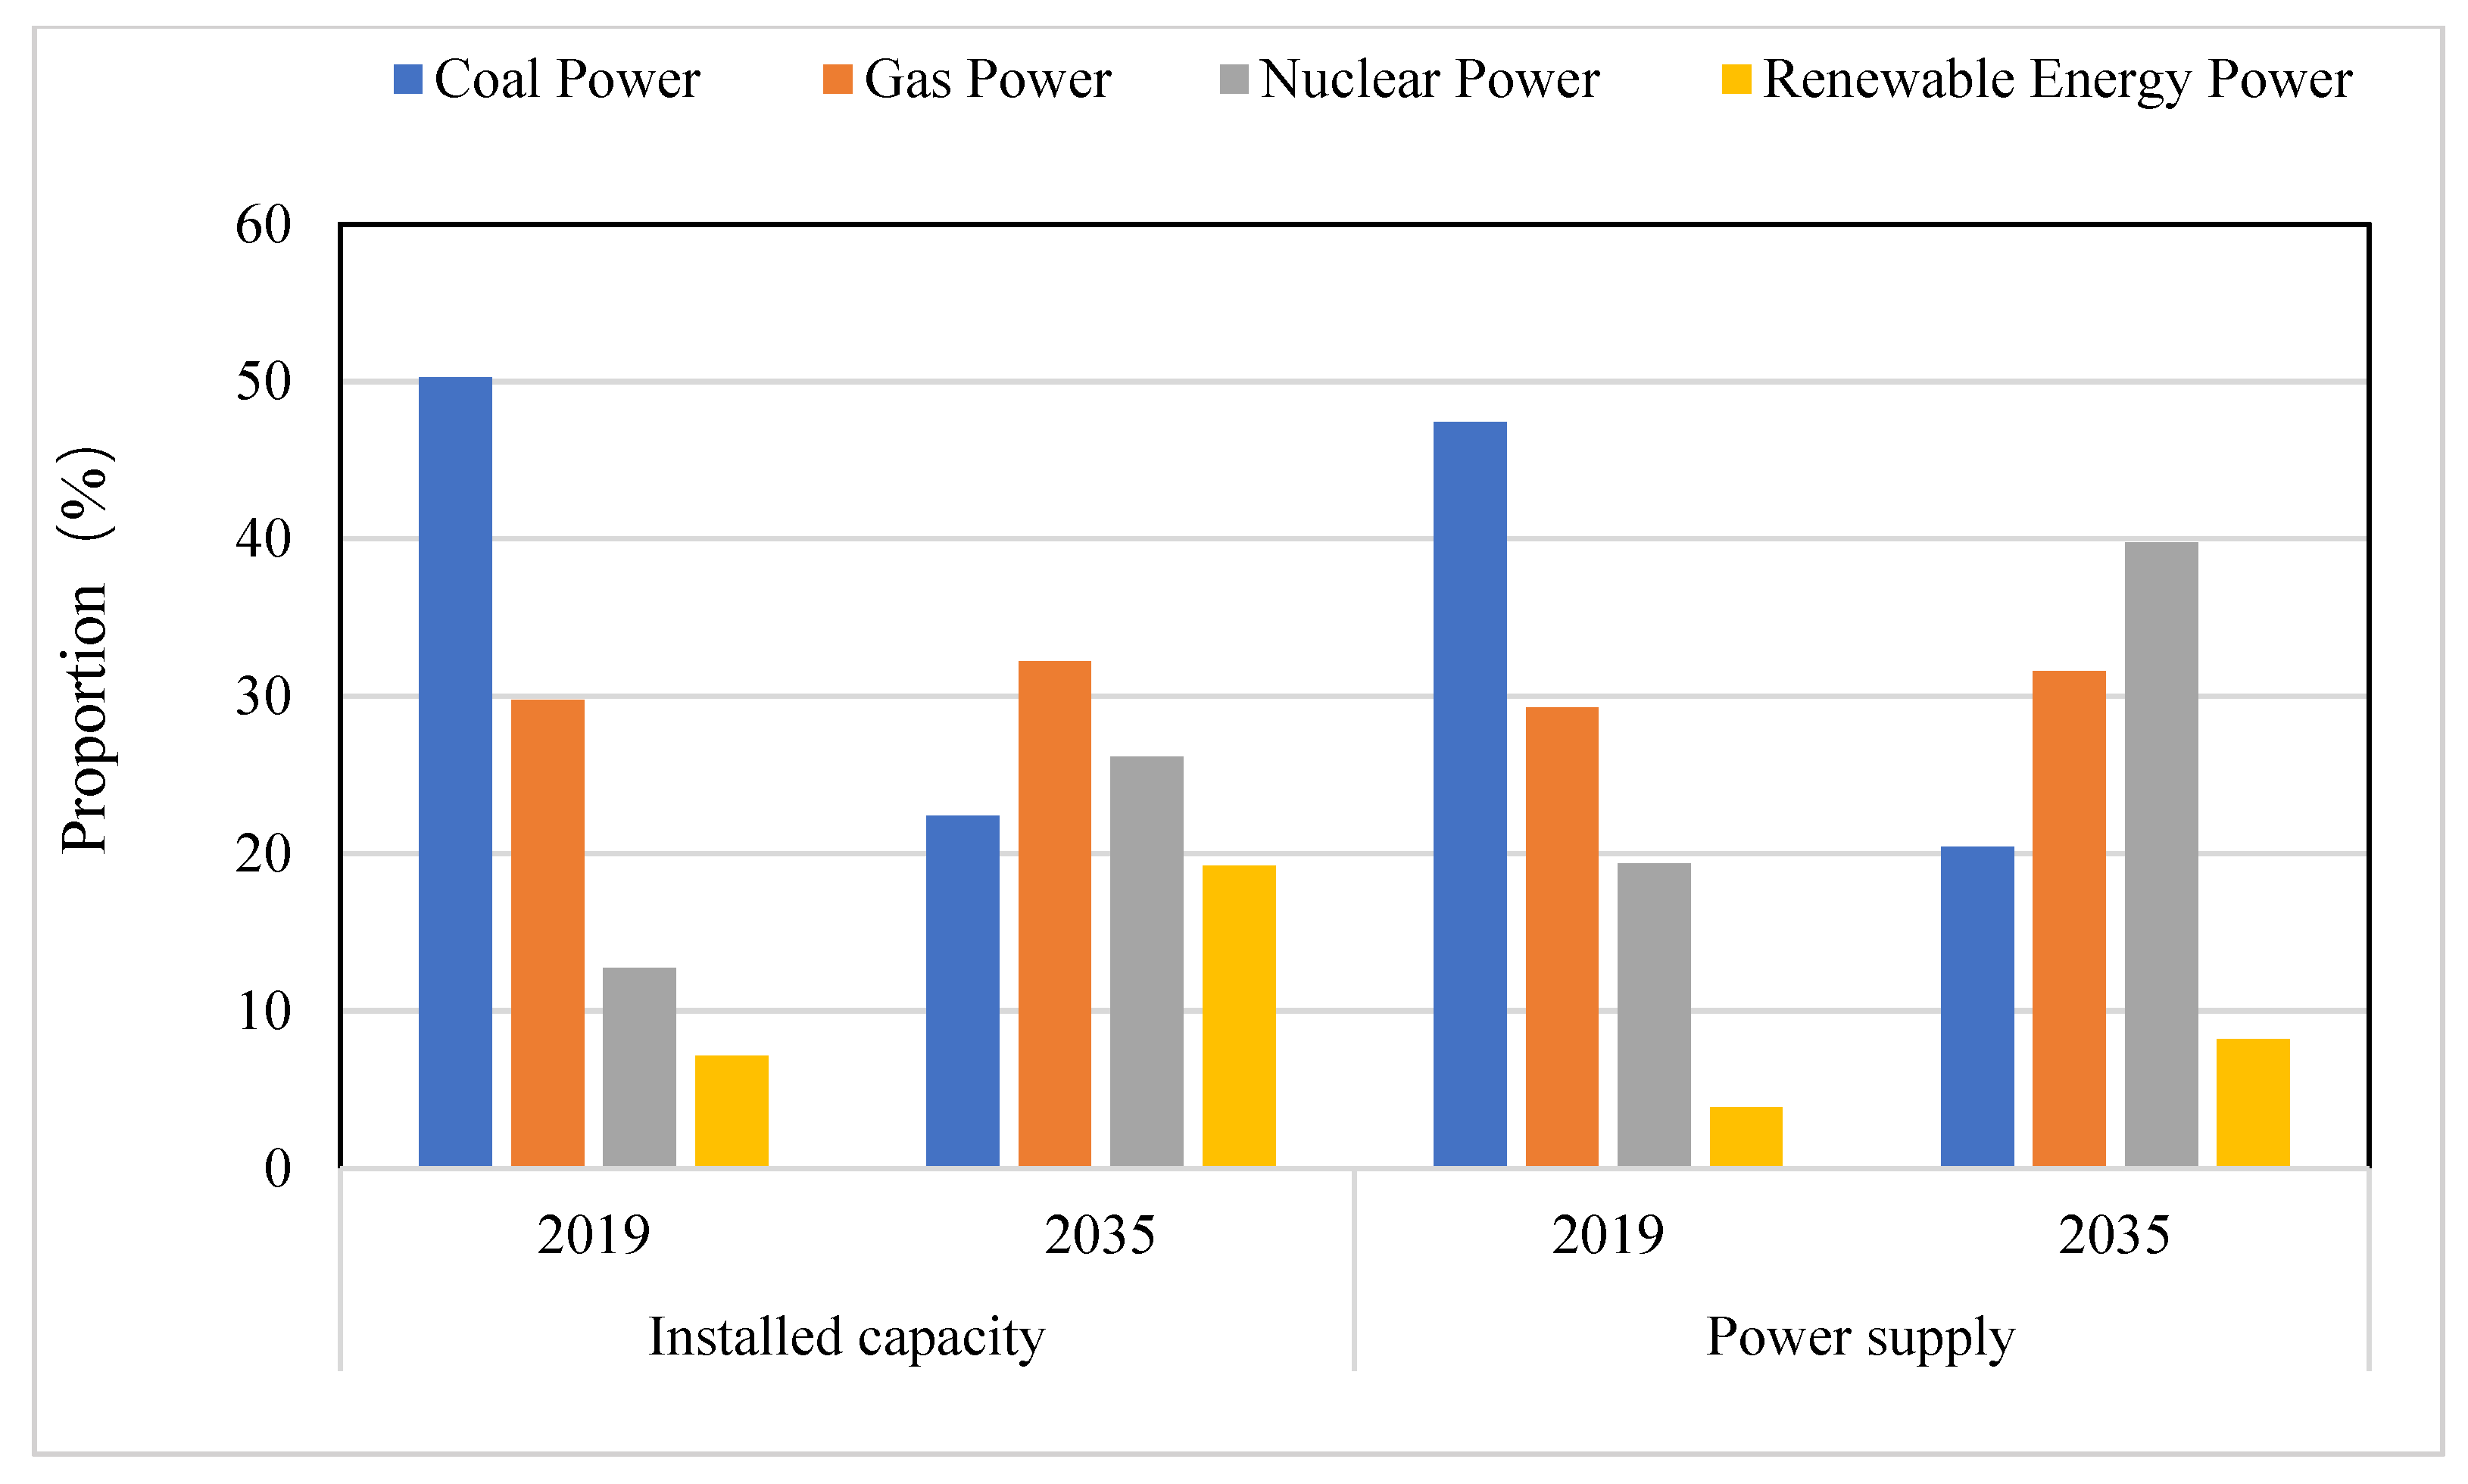
3.1.1. Installed Power Capacity and Structure
3.1.2. Power Supply and Structure
3.1.3. Energy Conservation and Emission Reduction in the Power Transition
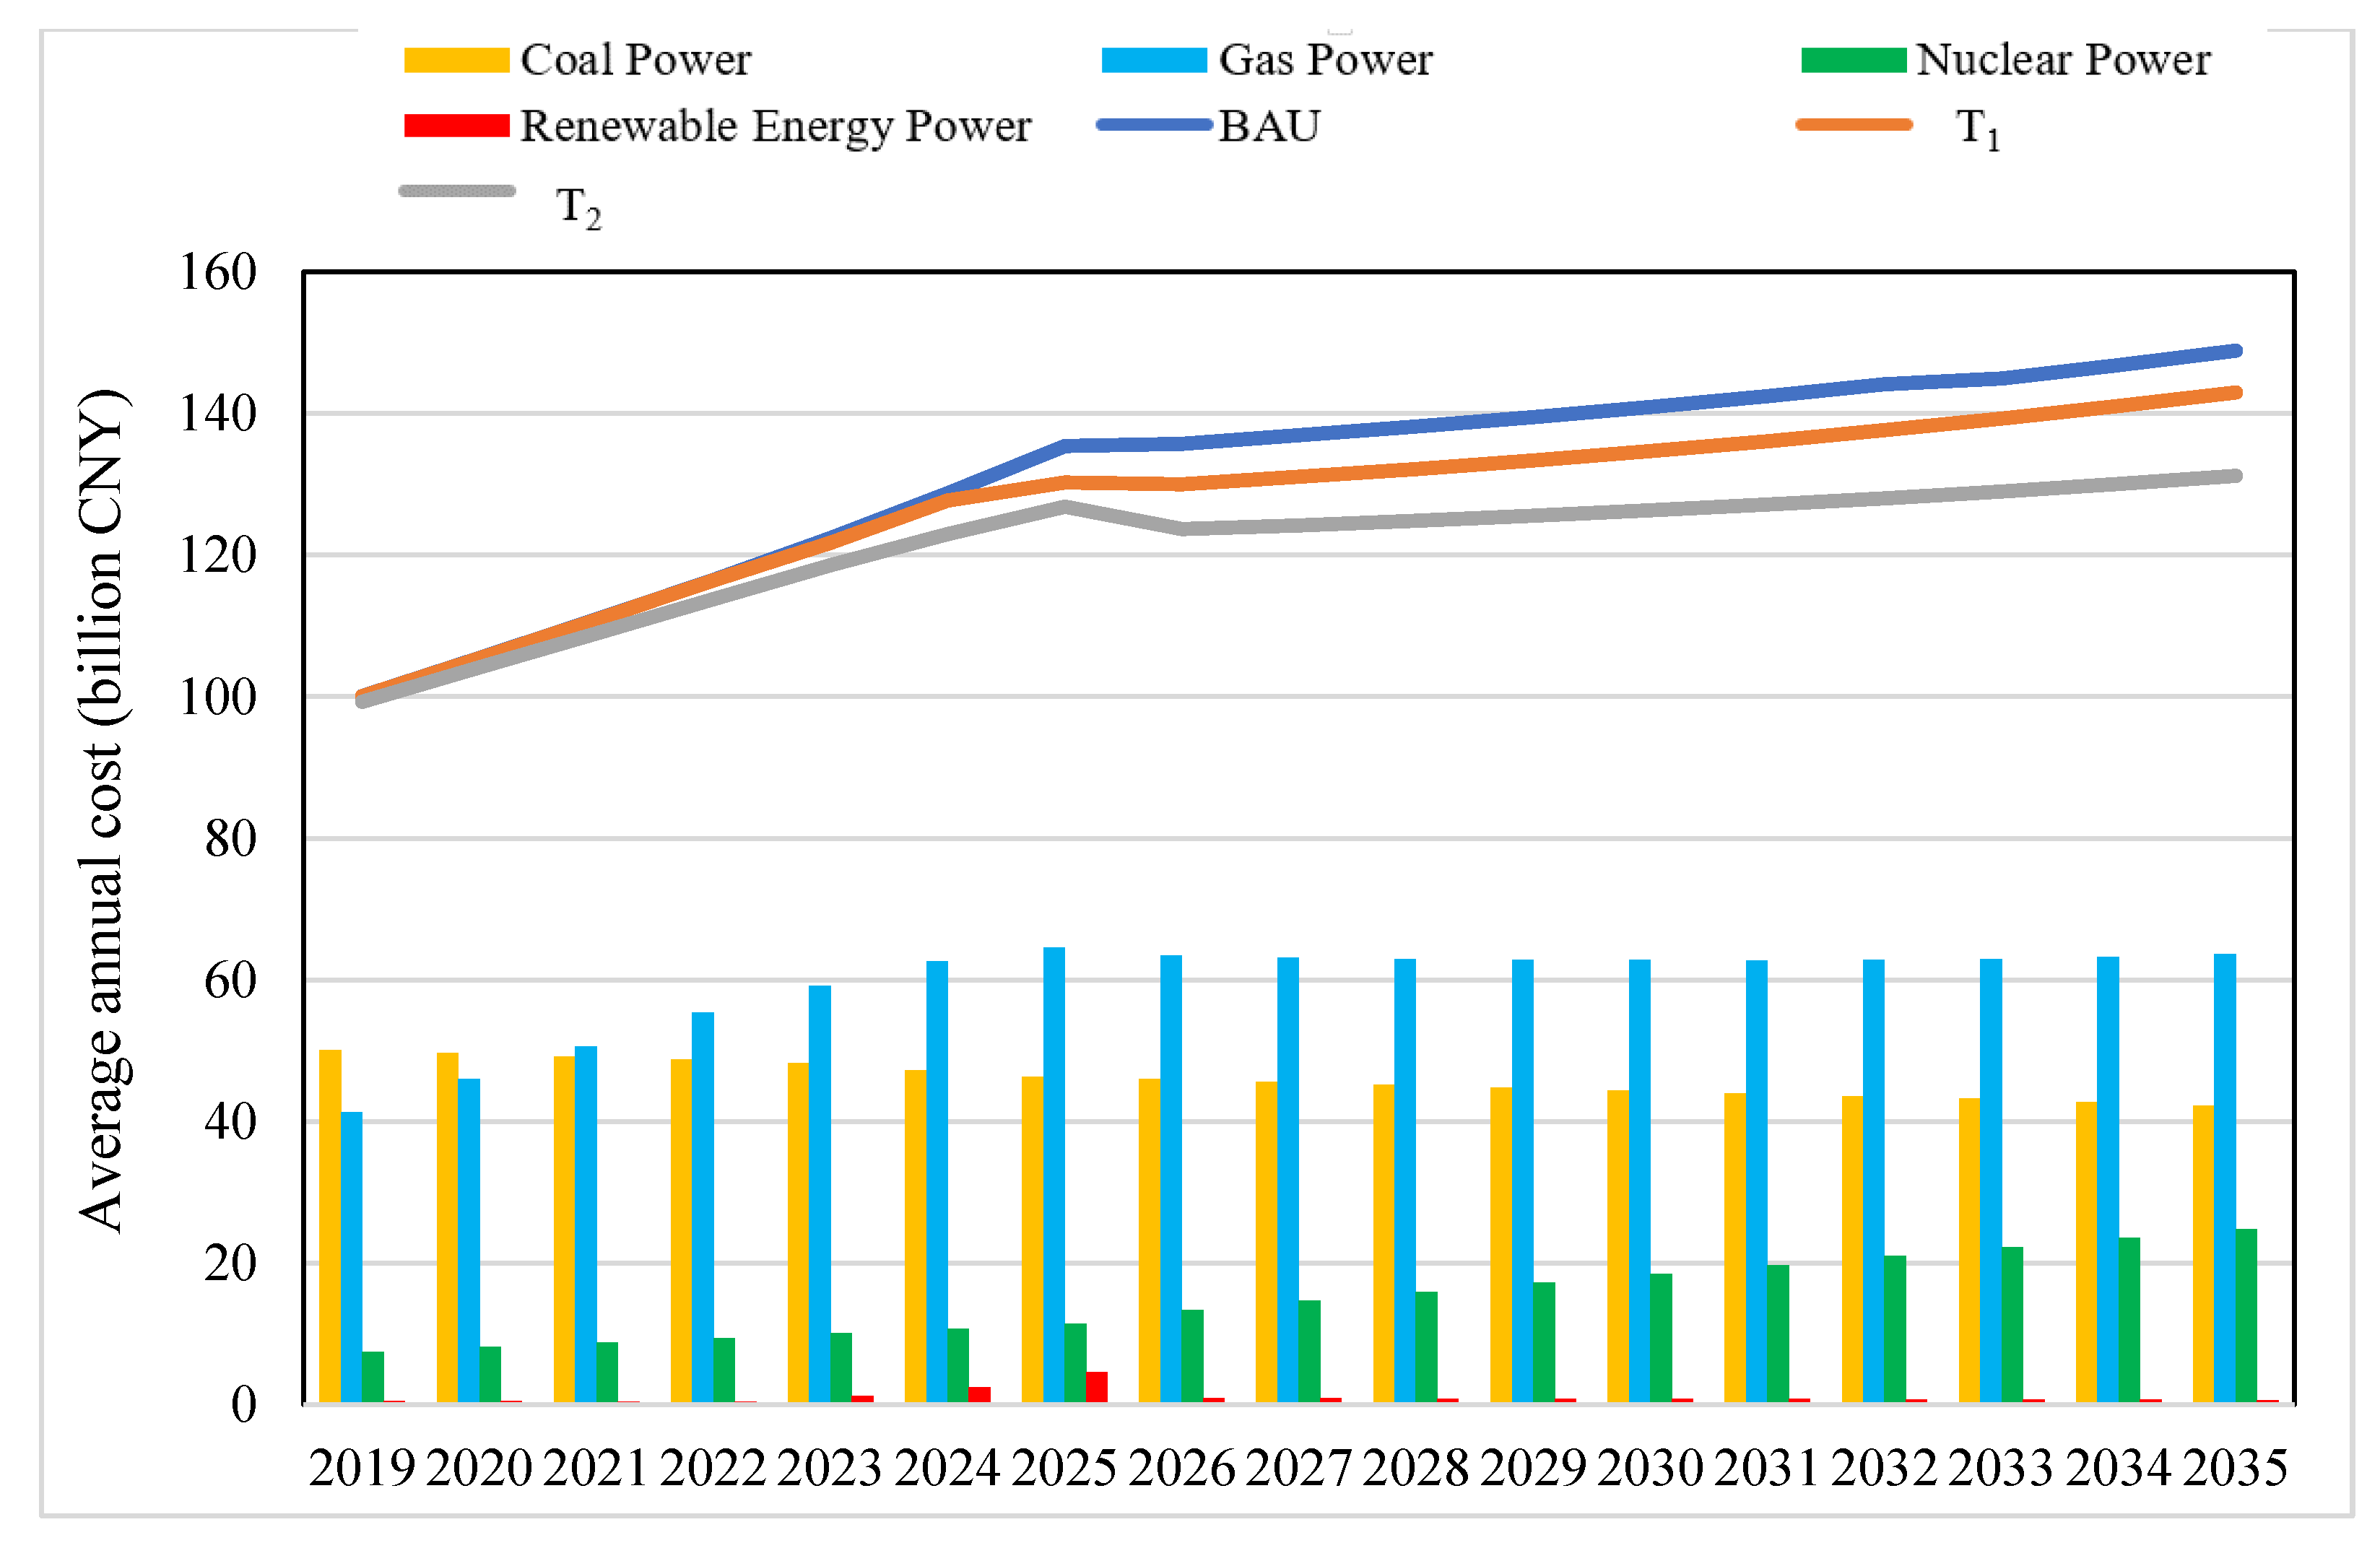
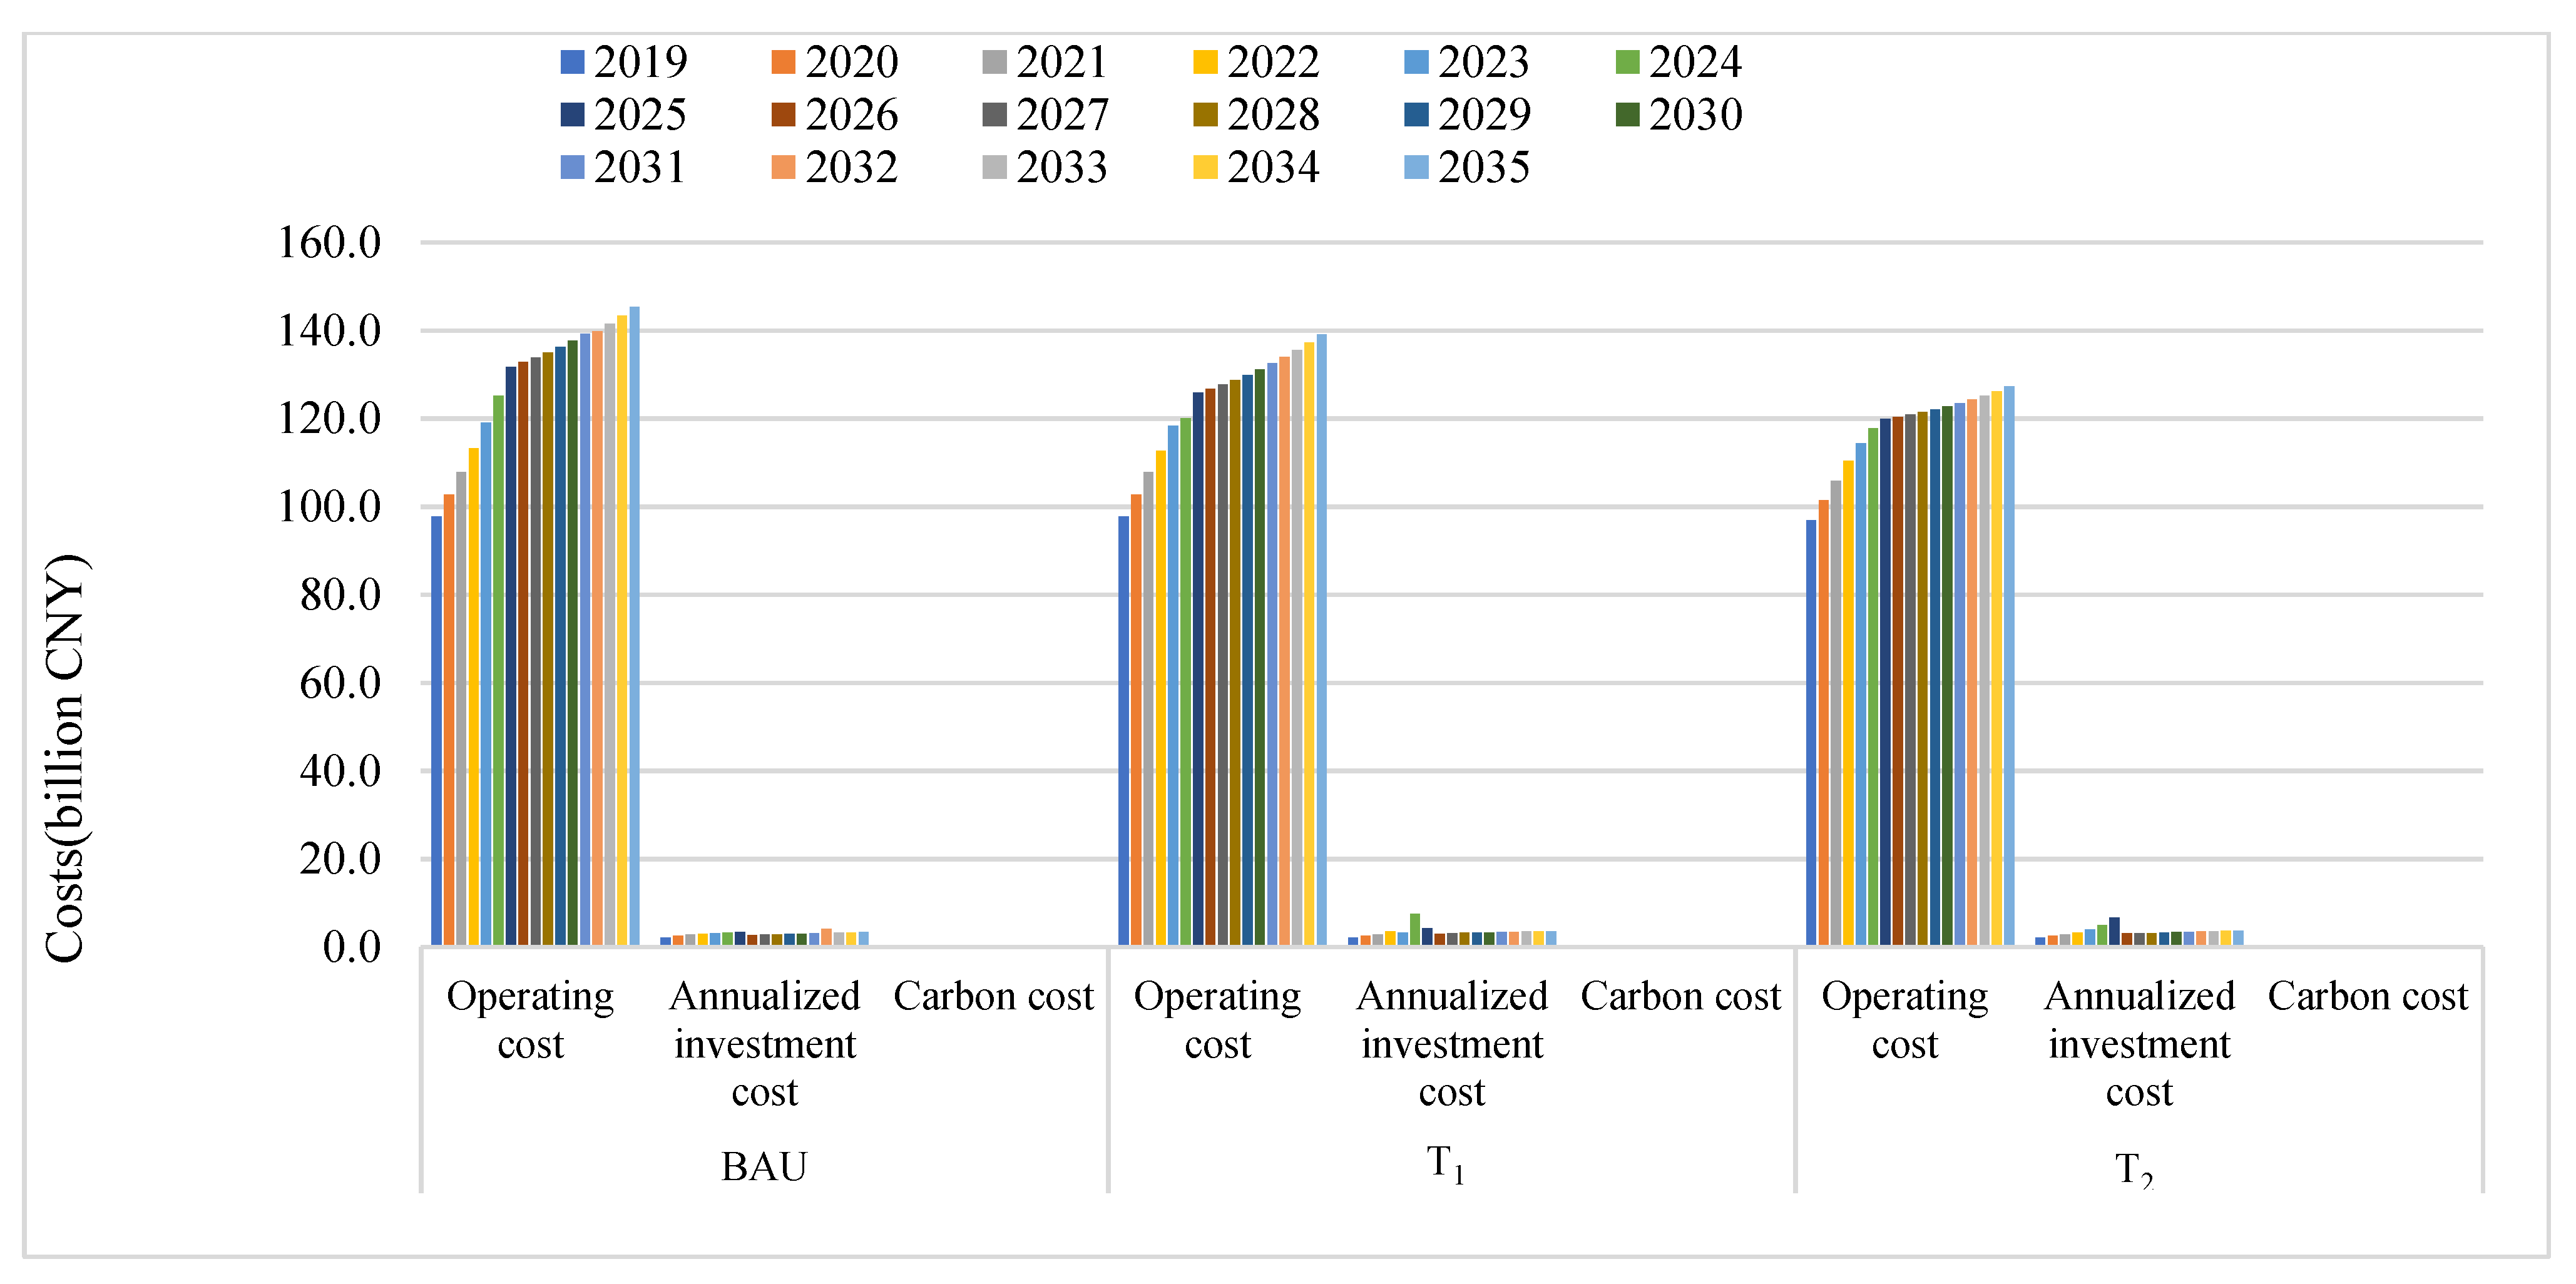
3.1.4. Power Transition Costs
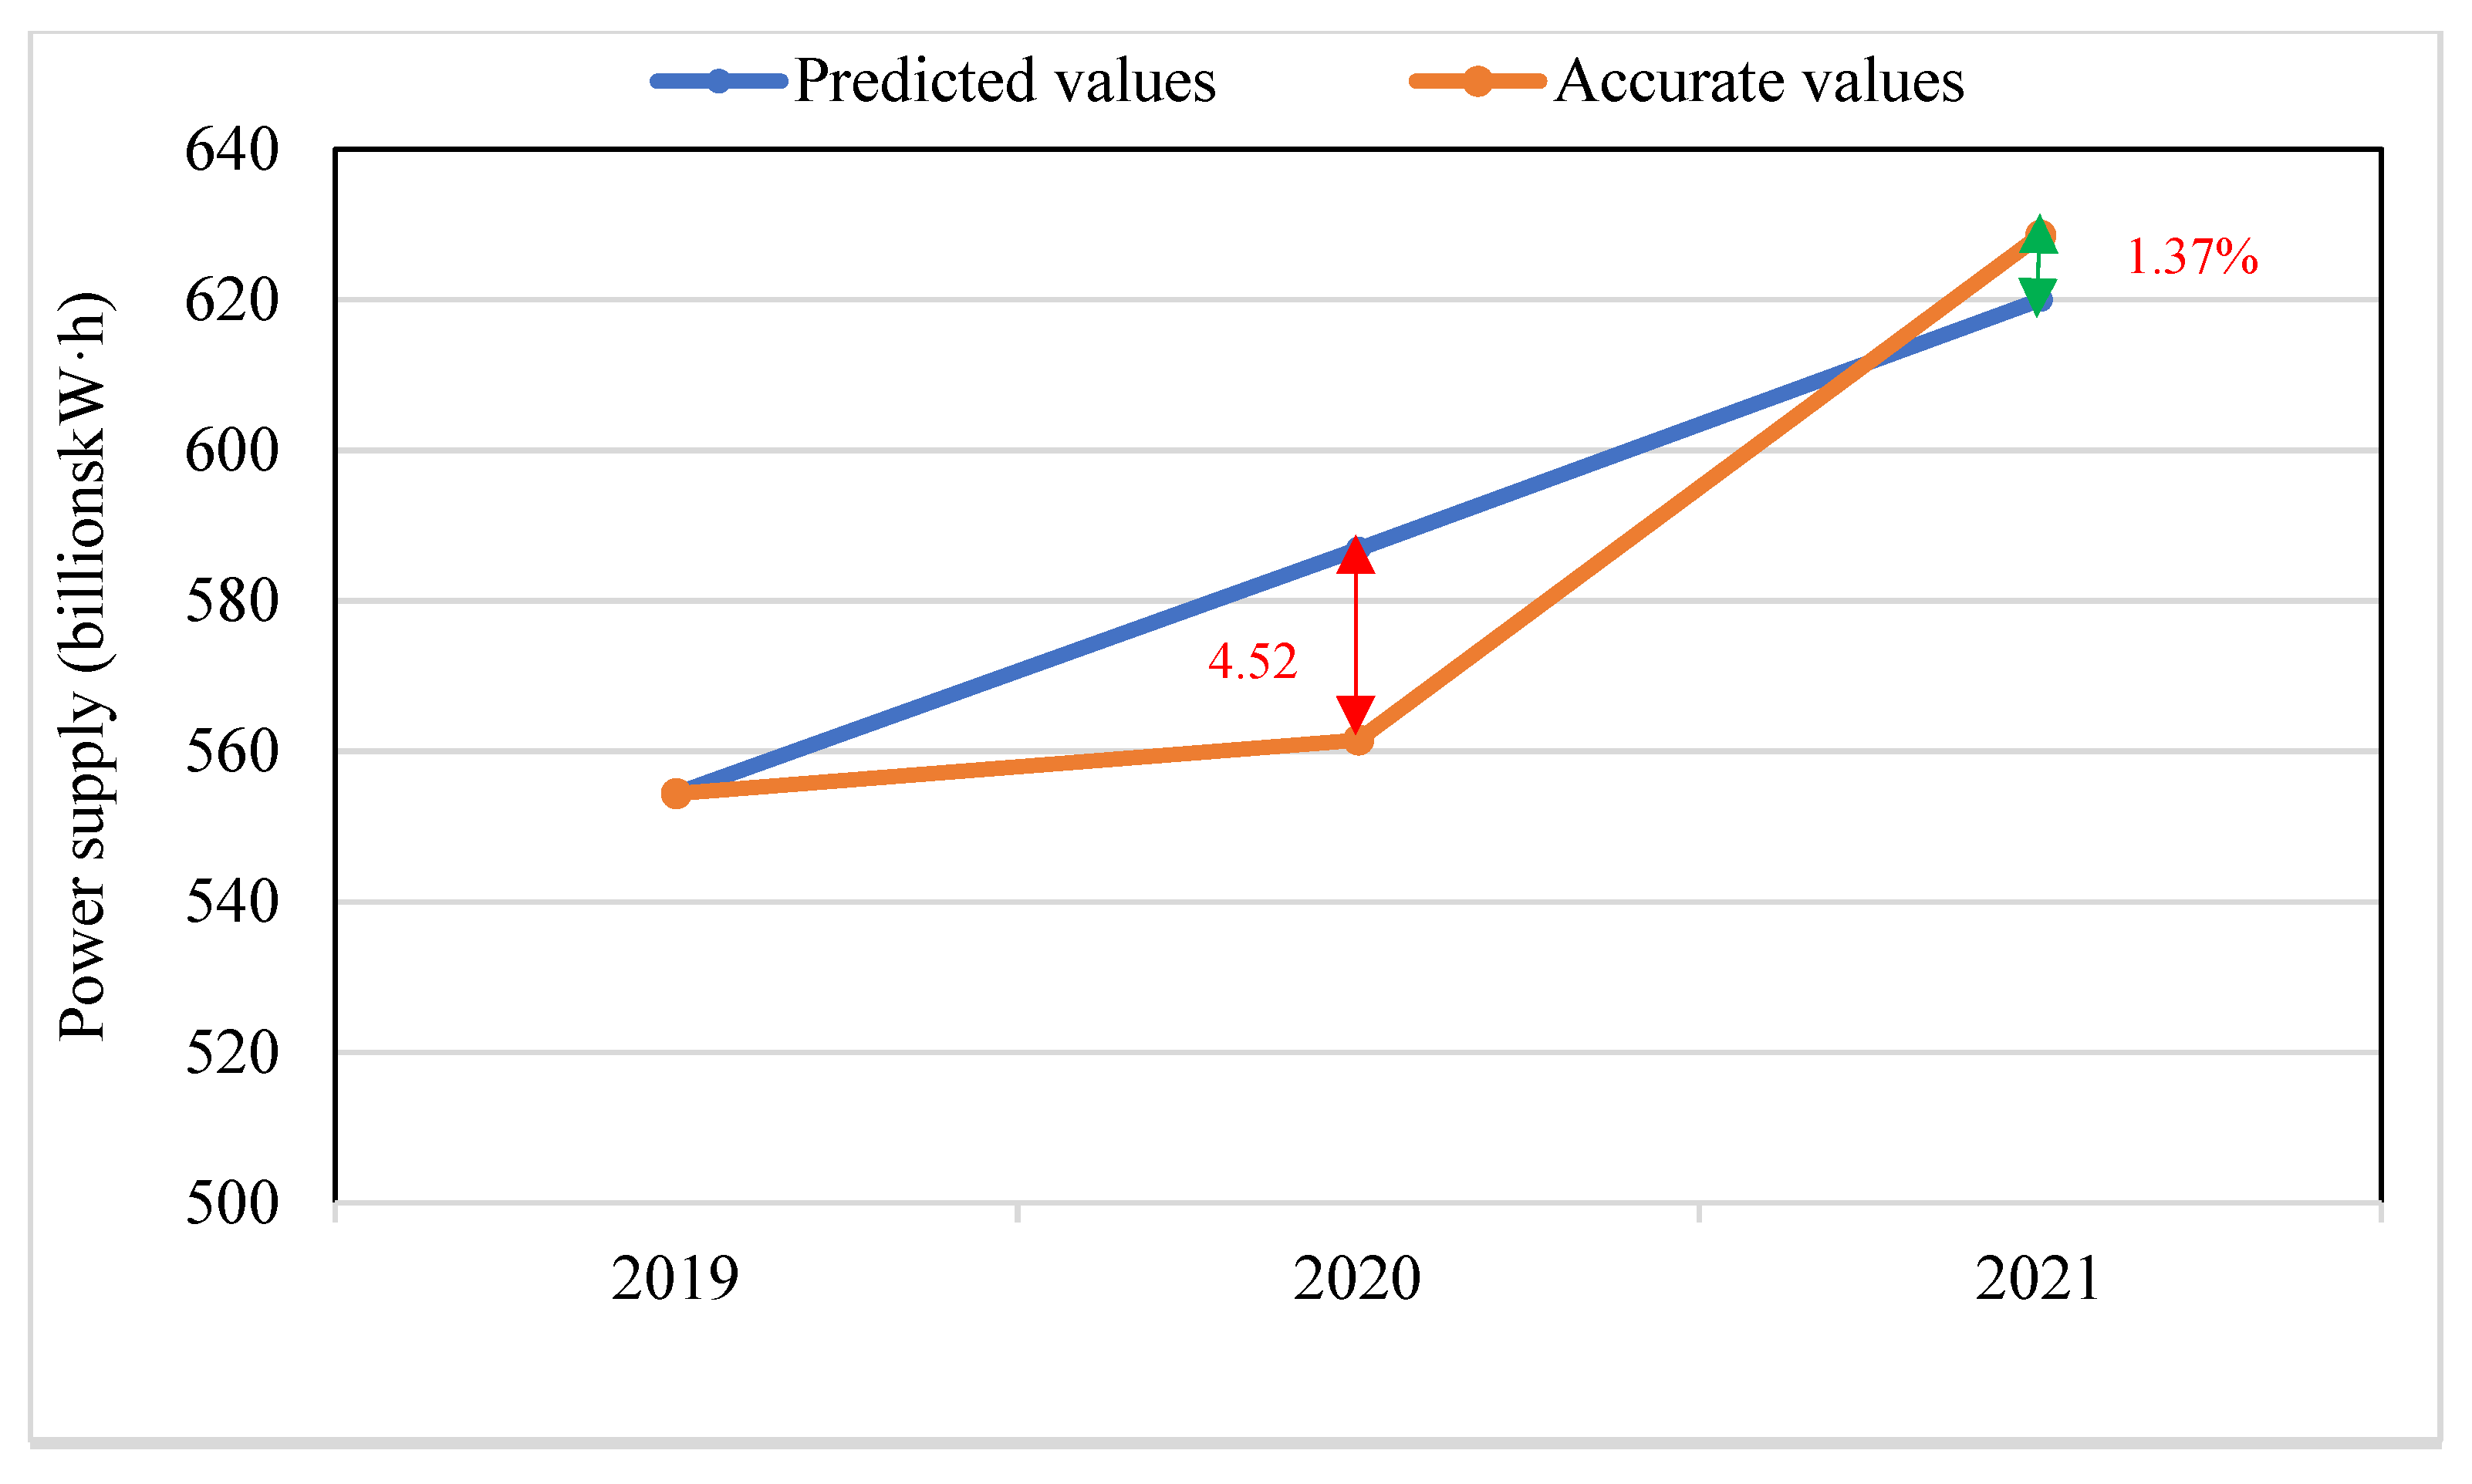
3.1.5. Credibility Test
3.2. Detailed Description of the Best Power Transition Path
3.3. Discussion on the Cooperation Mode of Power Transition among the Three Regions
3.3.1. Characteristics and Interrelationships of the Power Transition Paths of the Three Regions
3.3.2. Cooperation Mode of Power Transition Based on Technical Innovation
4. Conclusions
4.1. Main Findings
- (1)
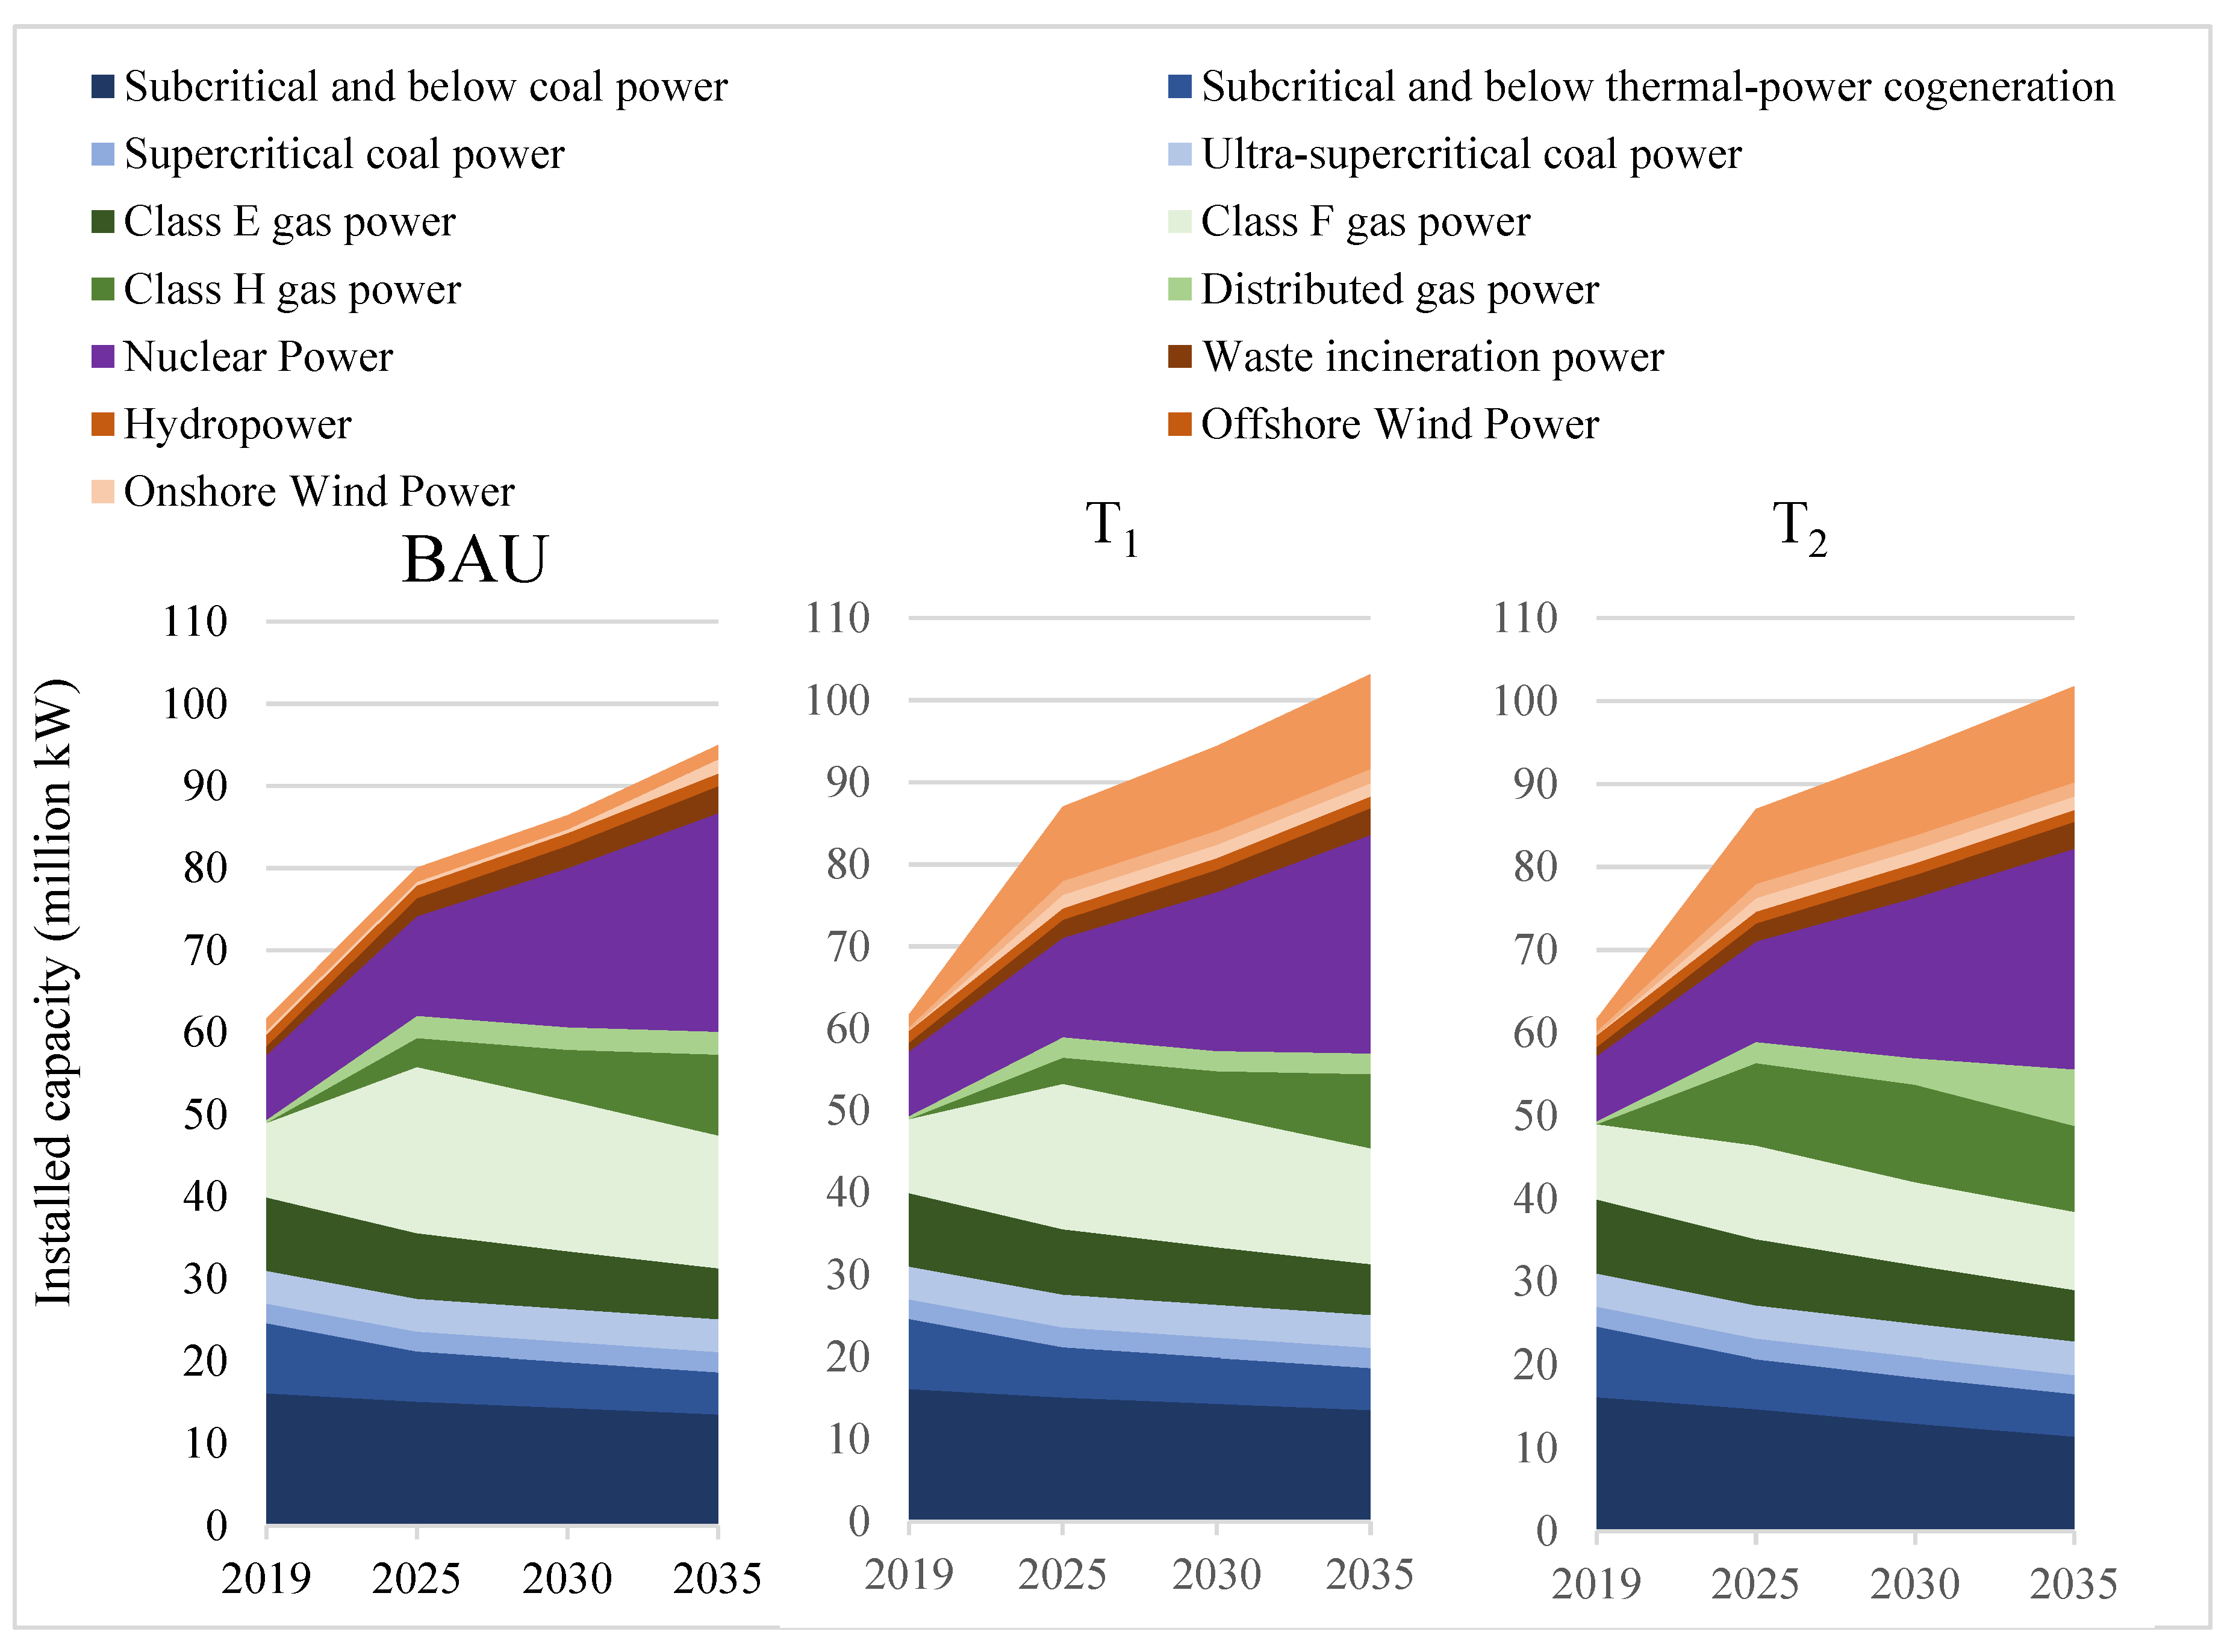
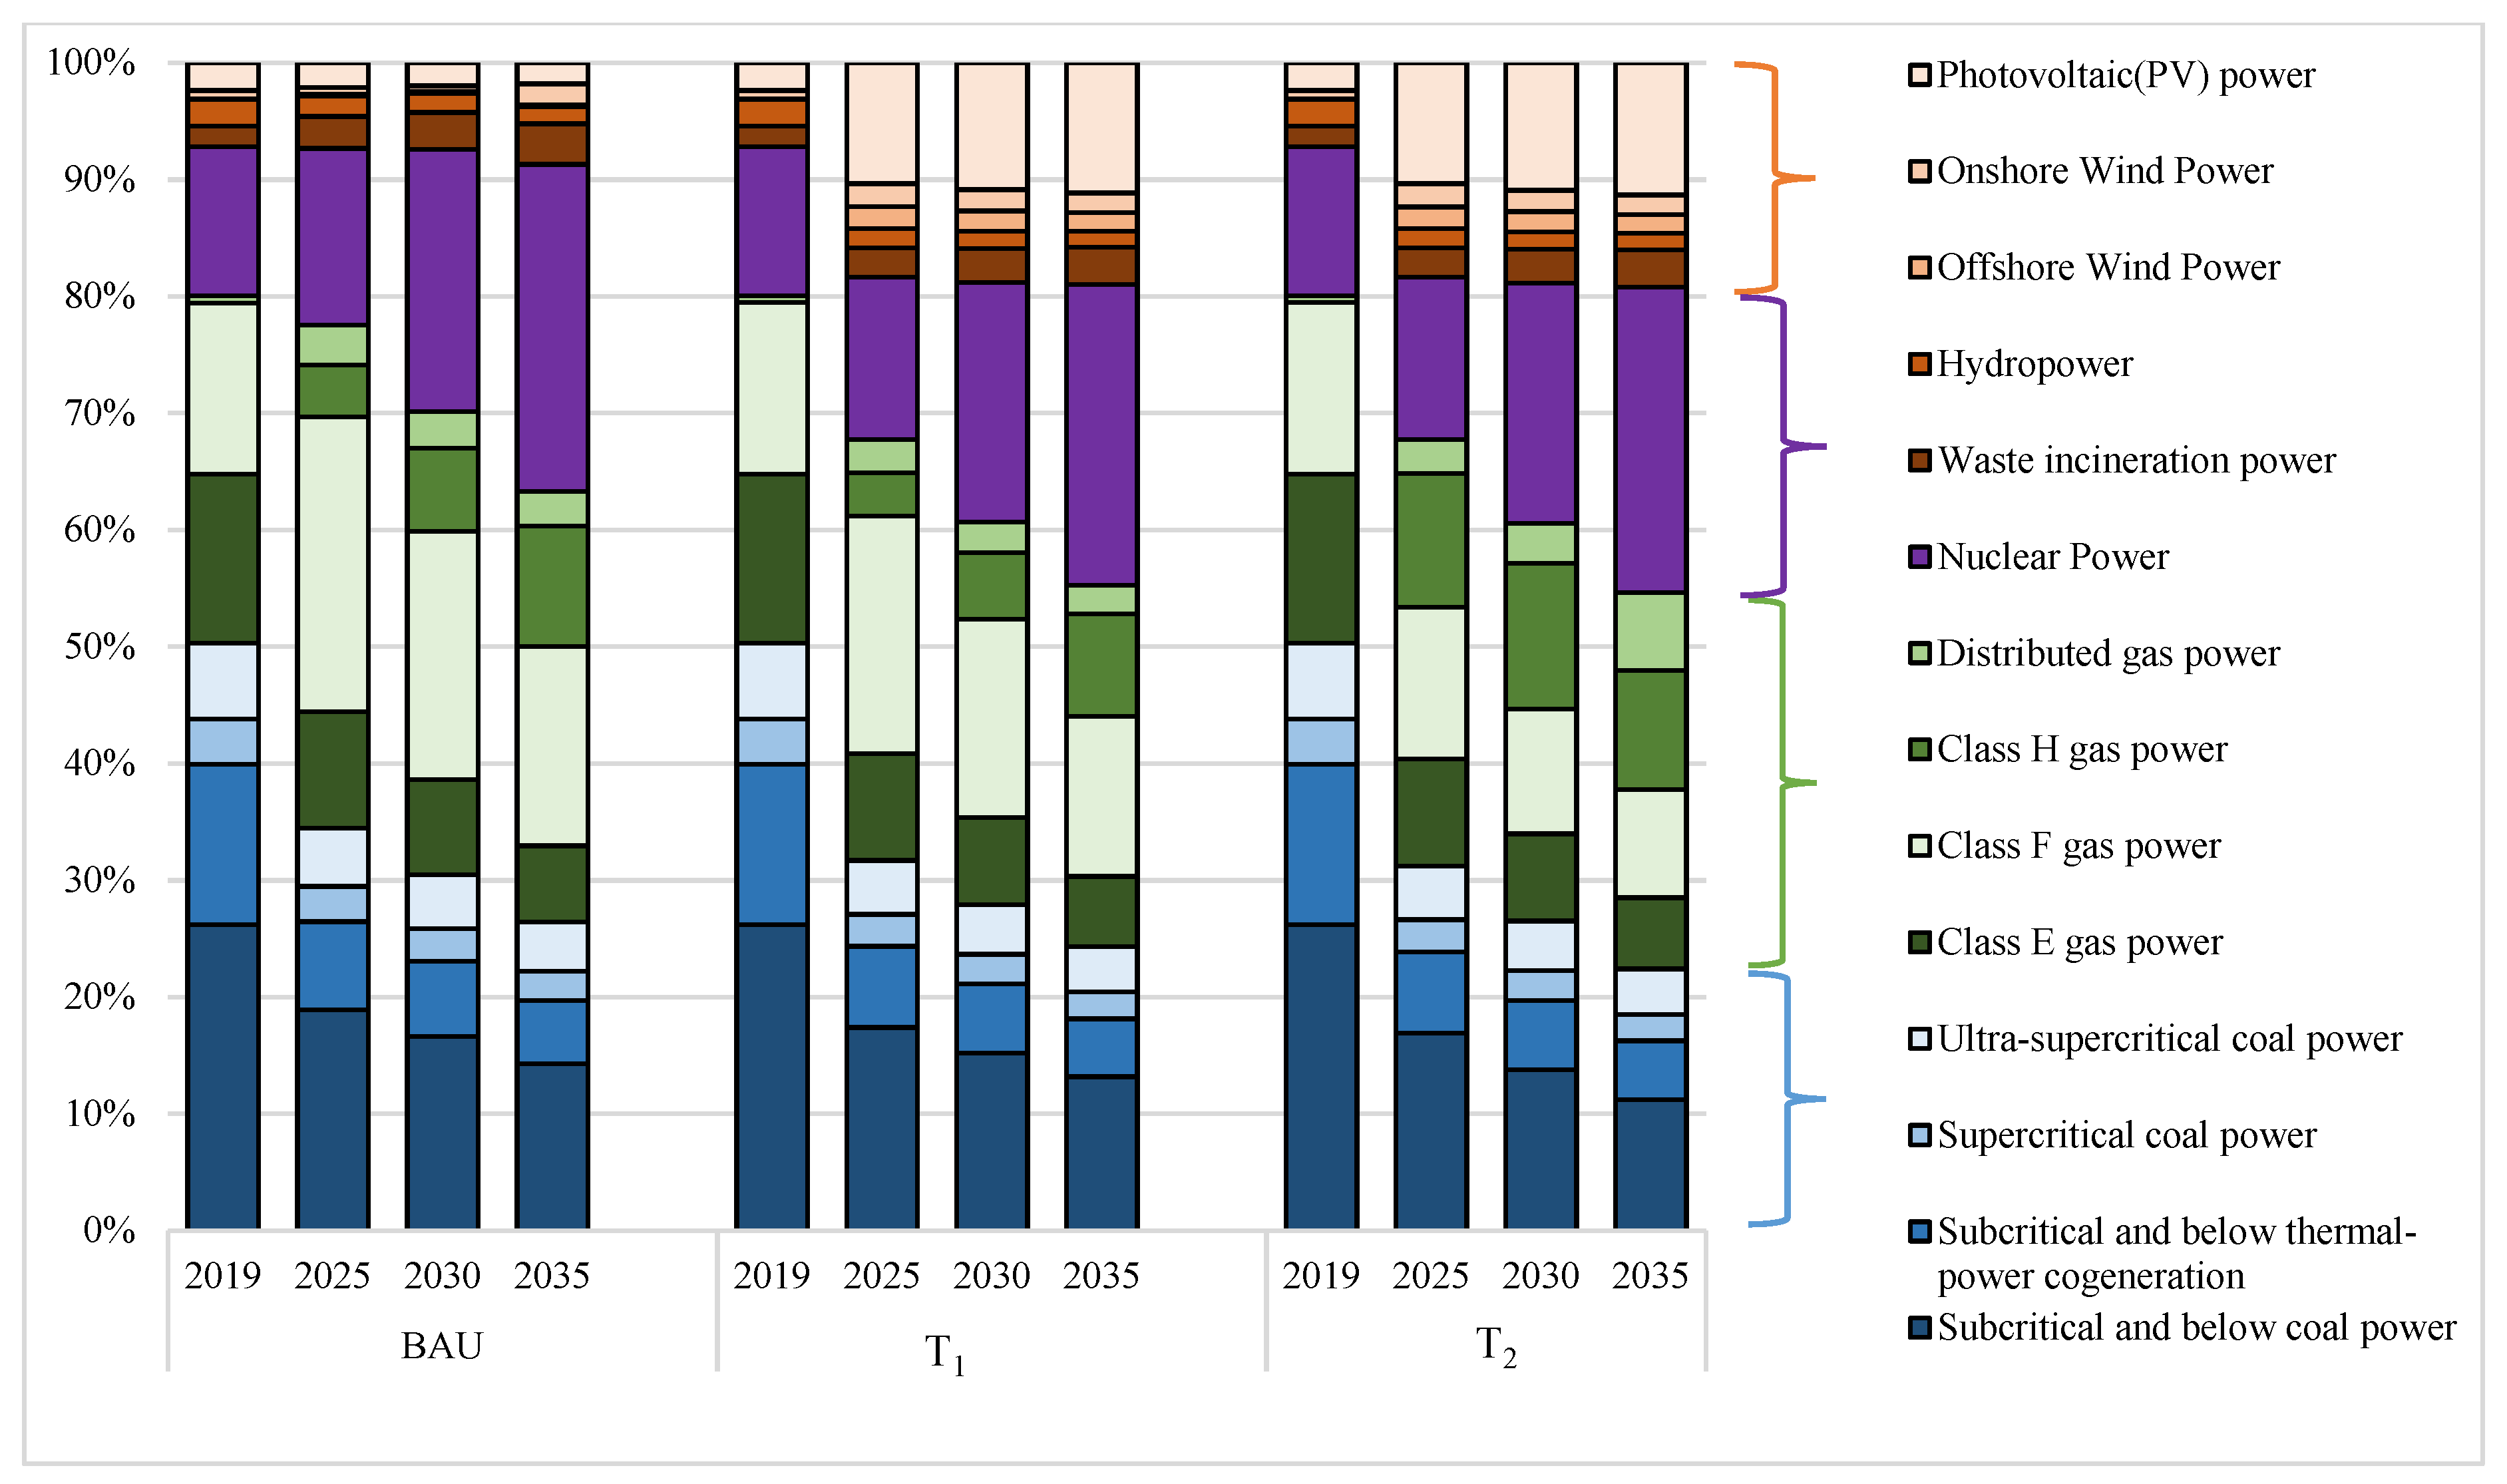
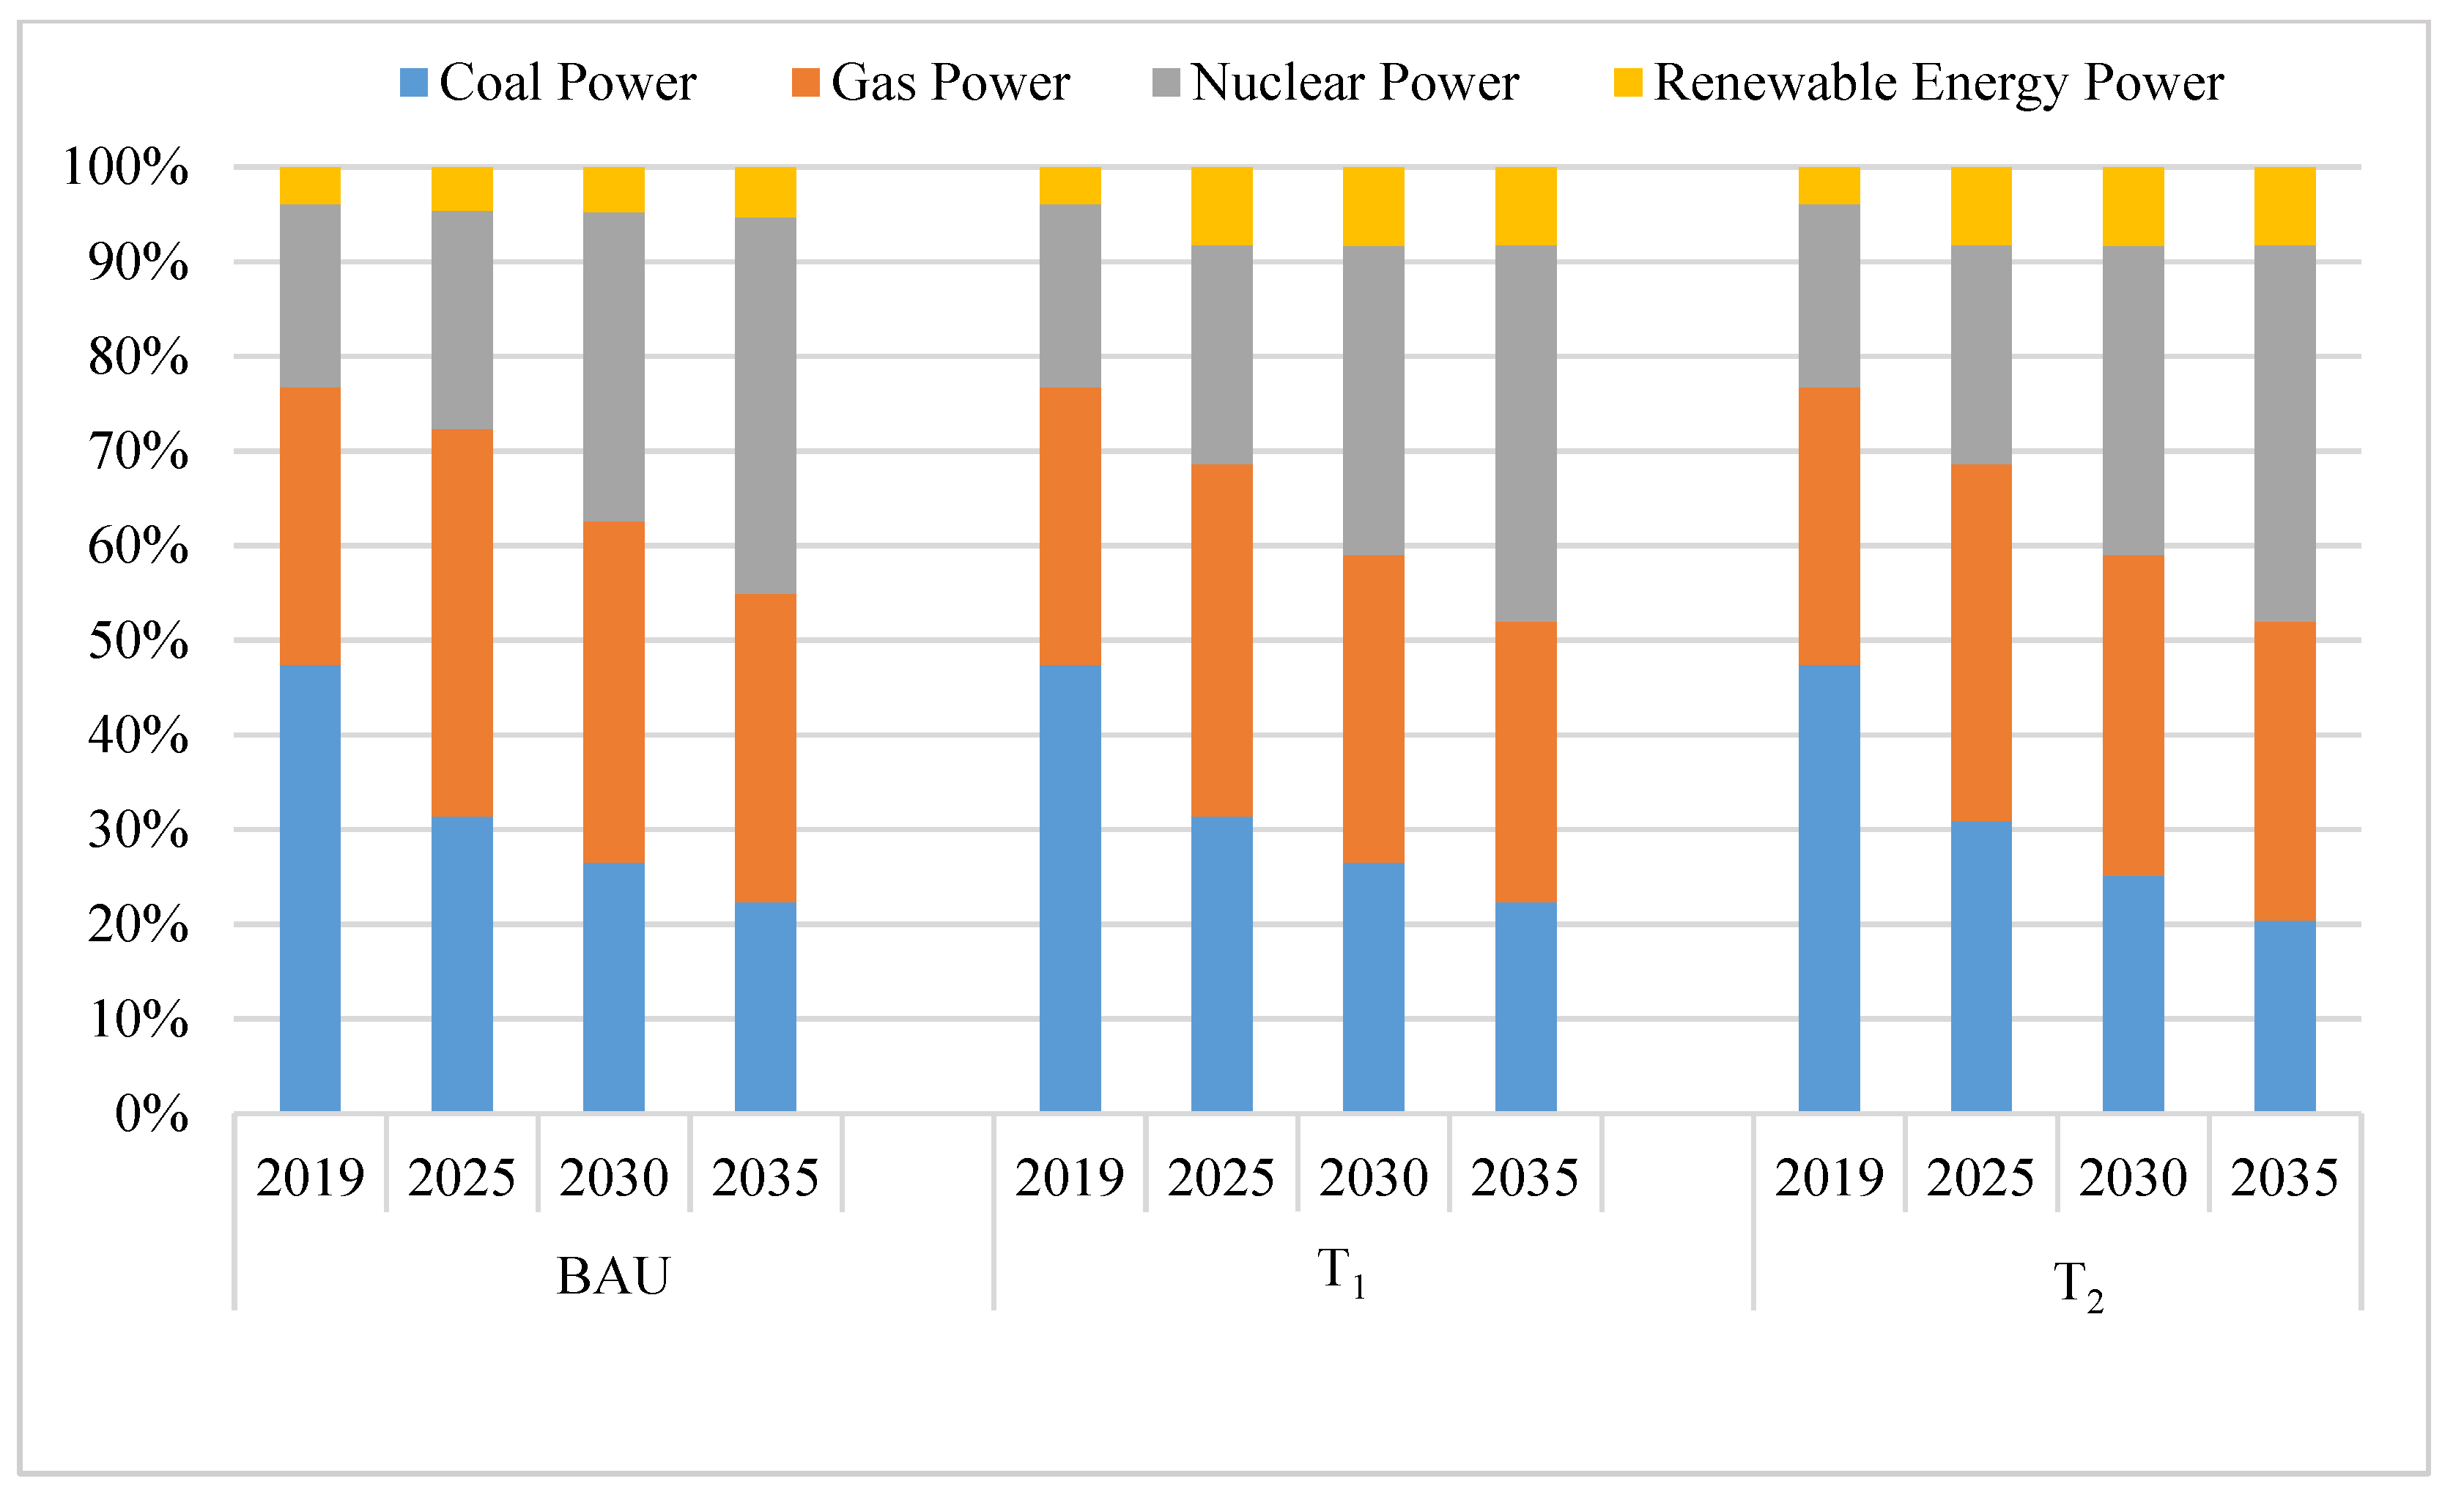
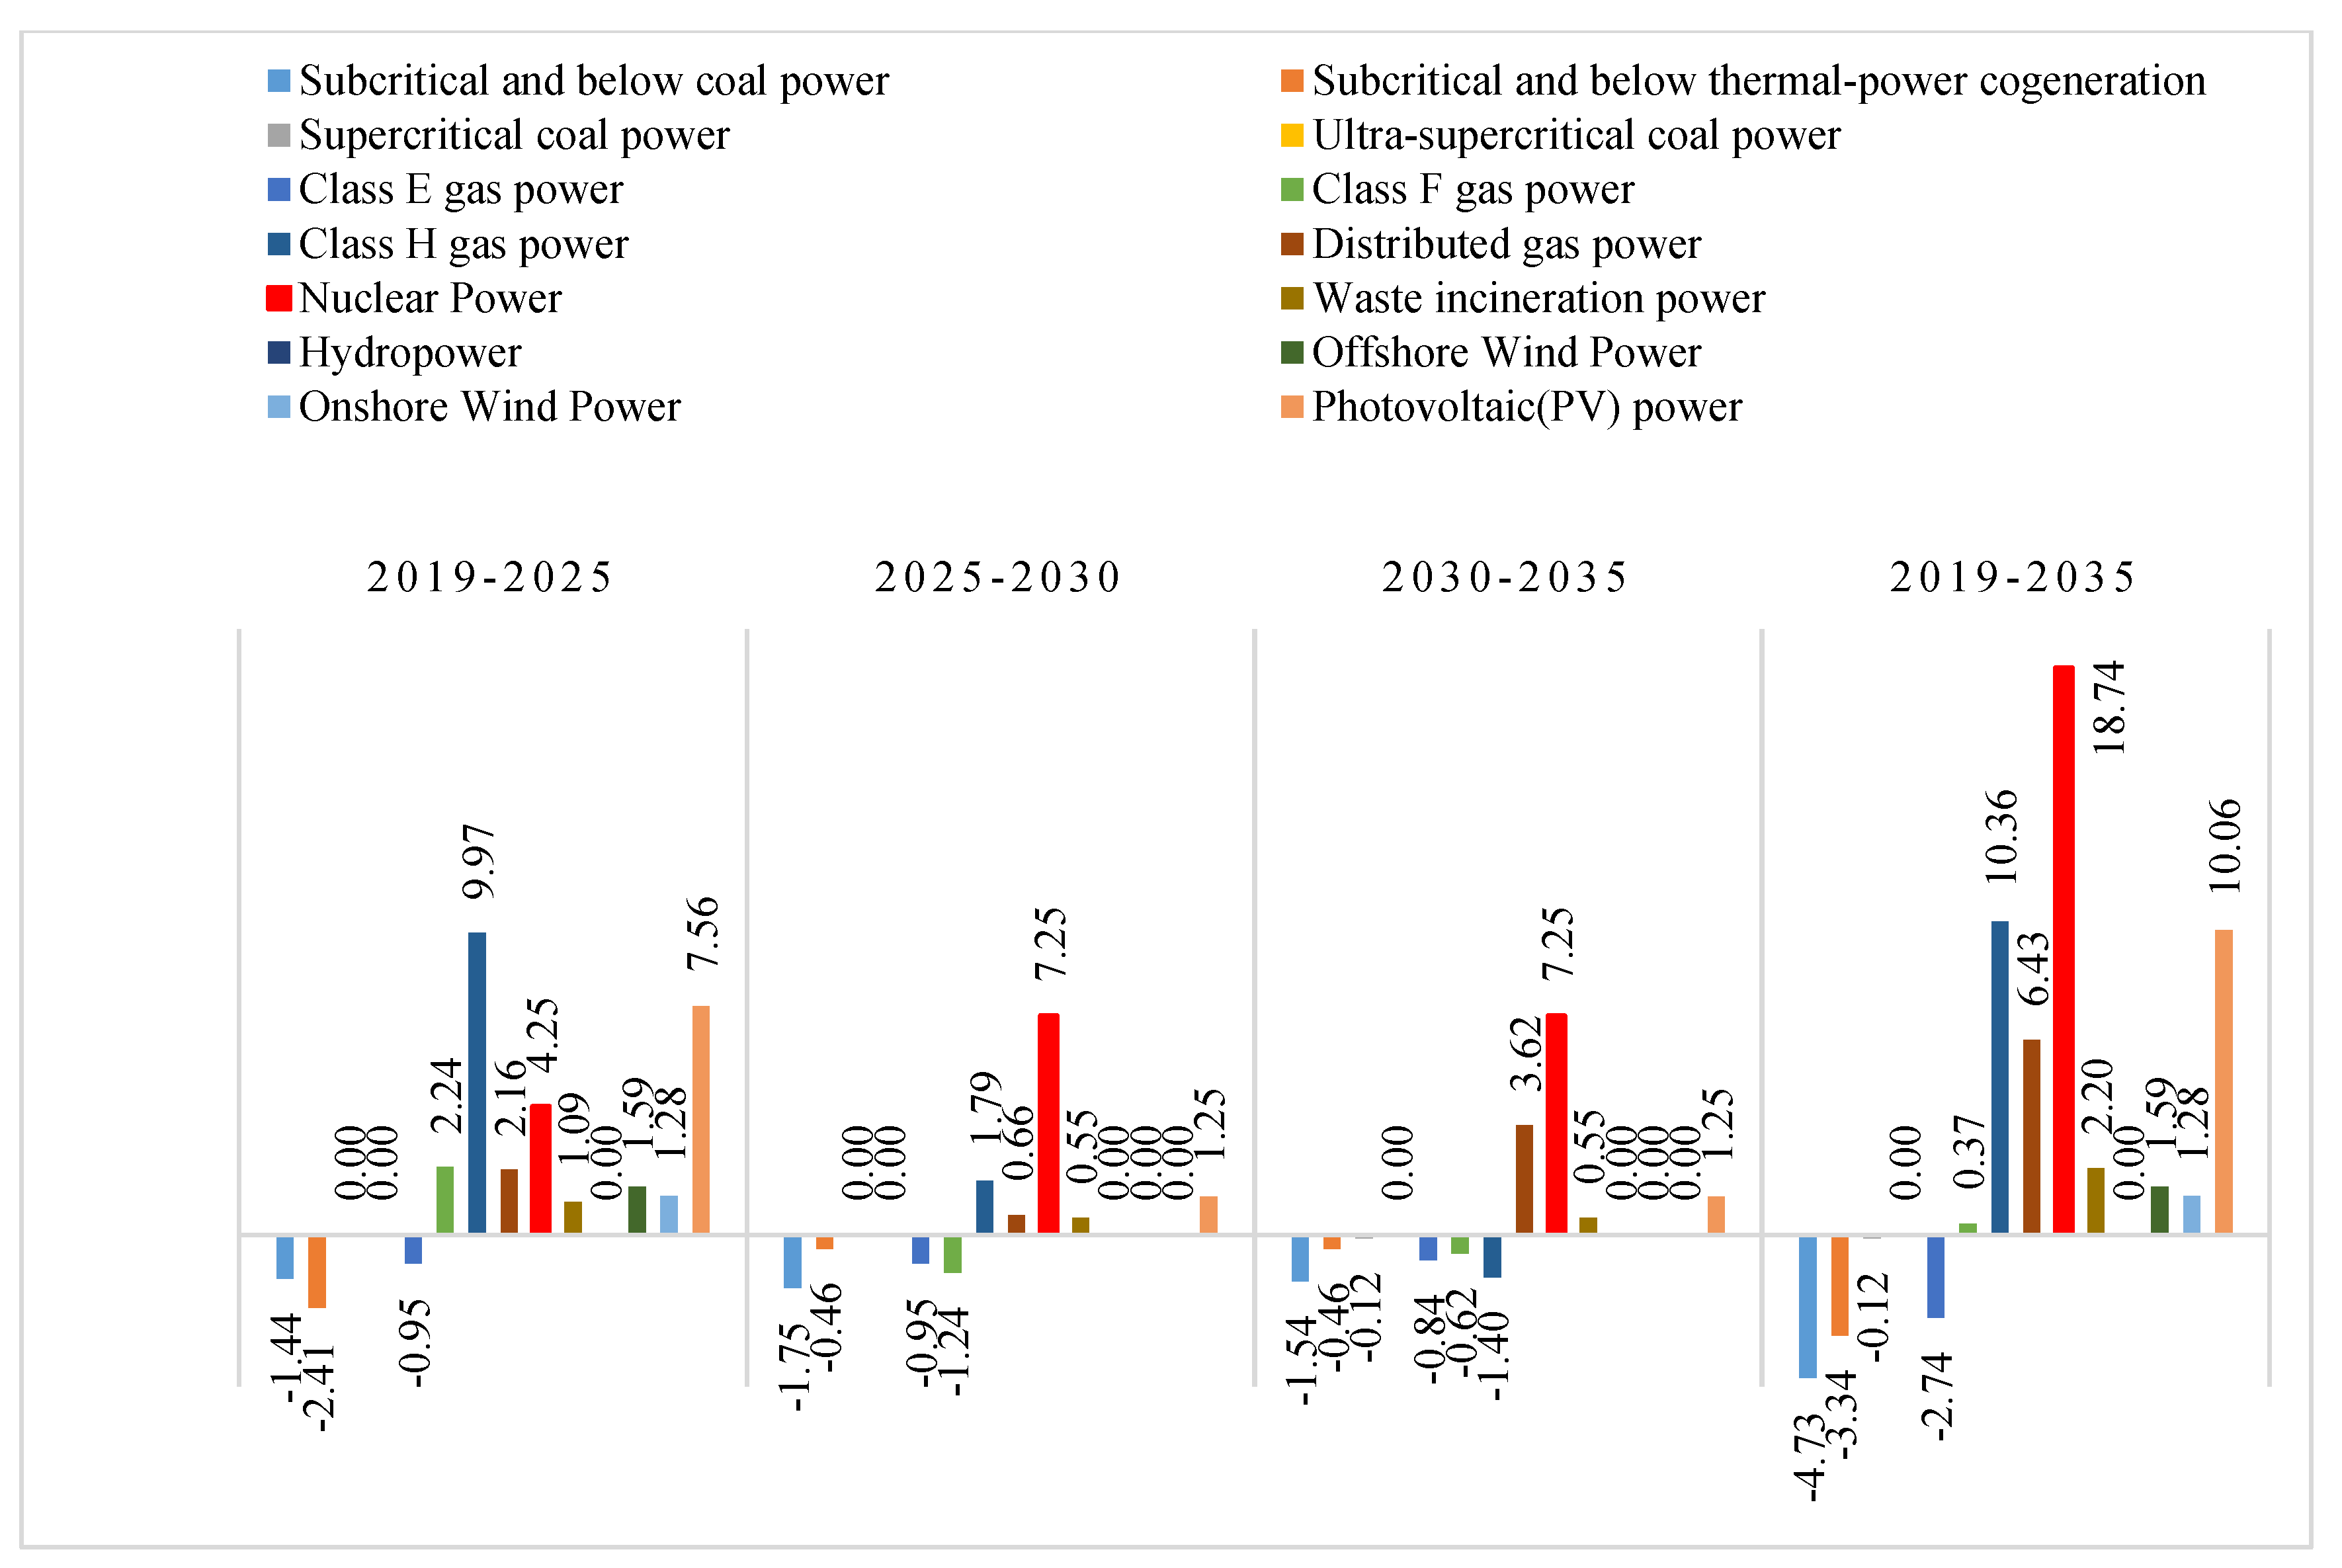
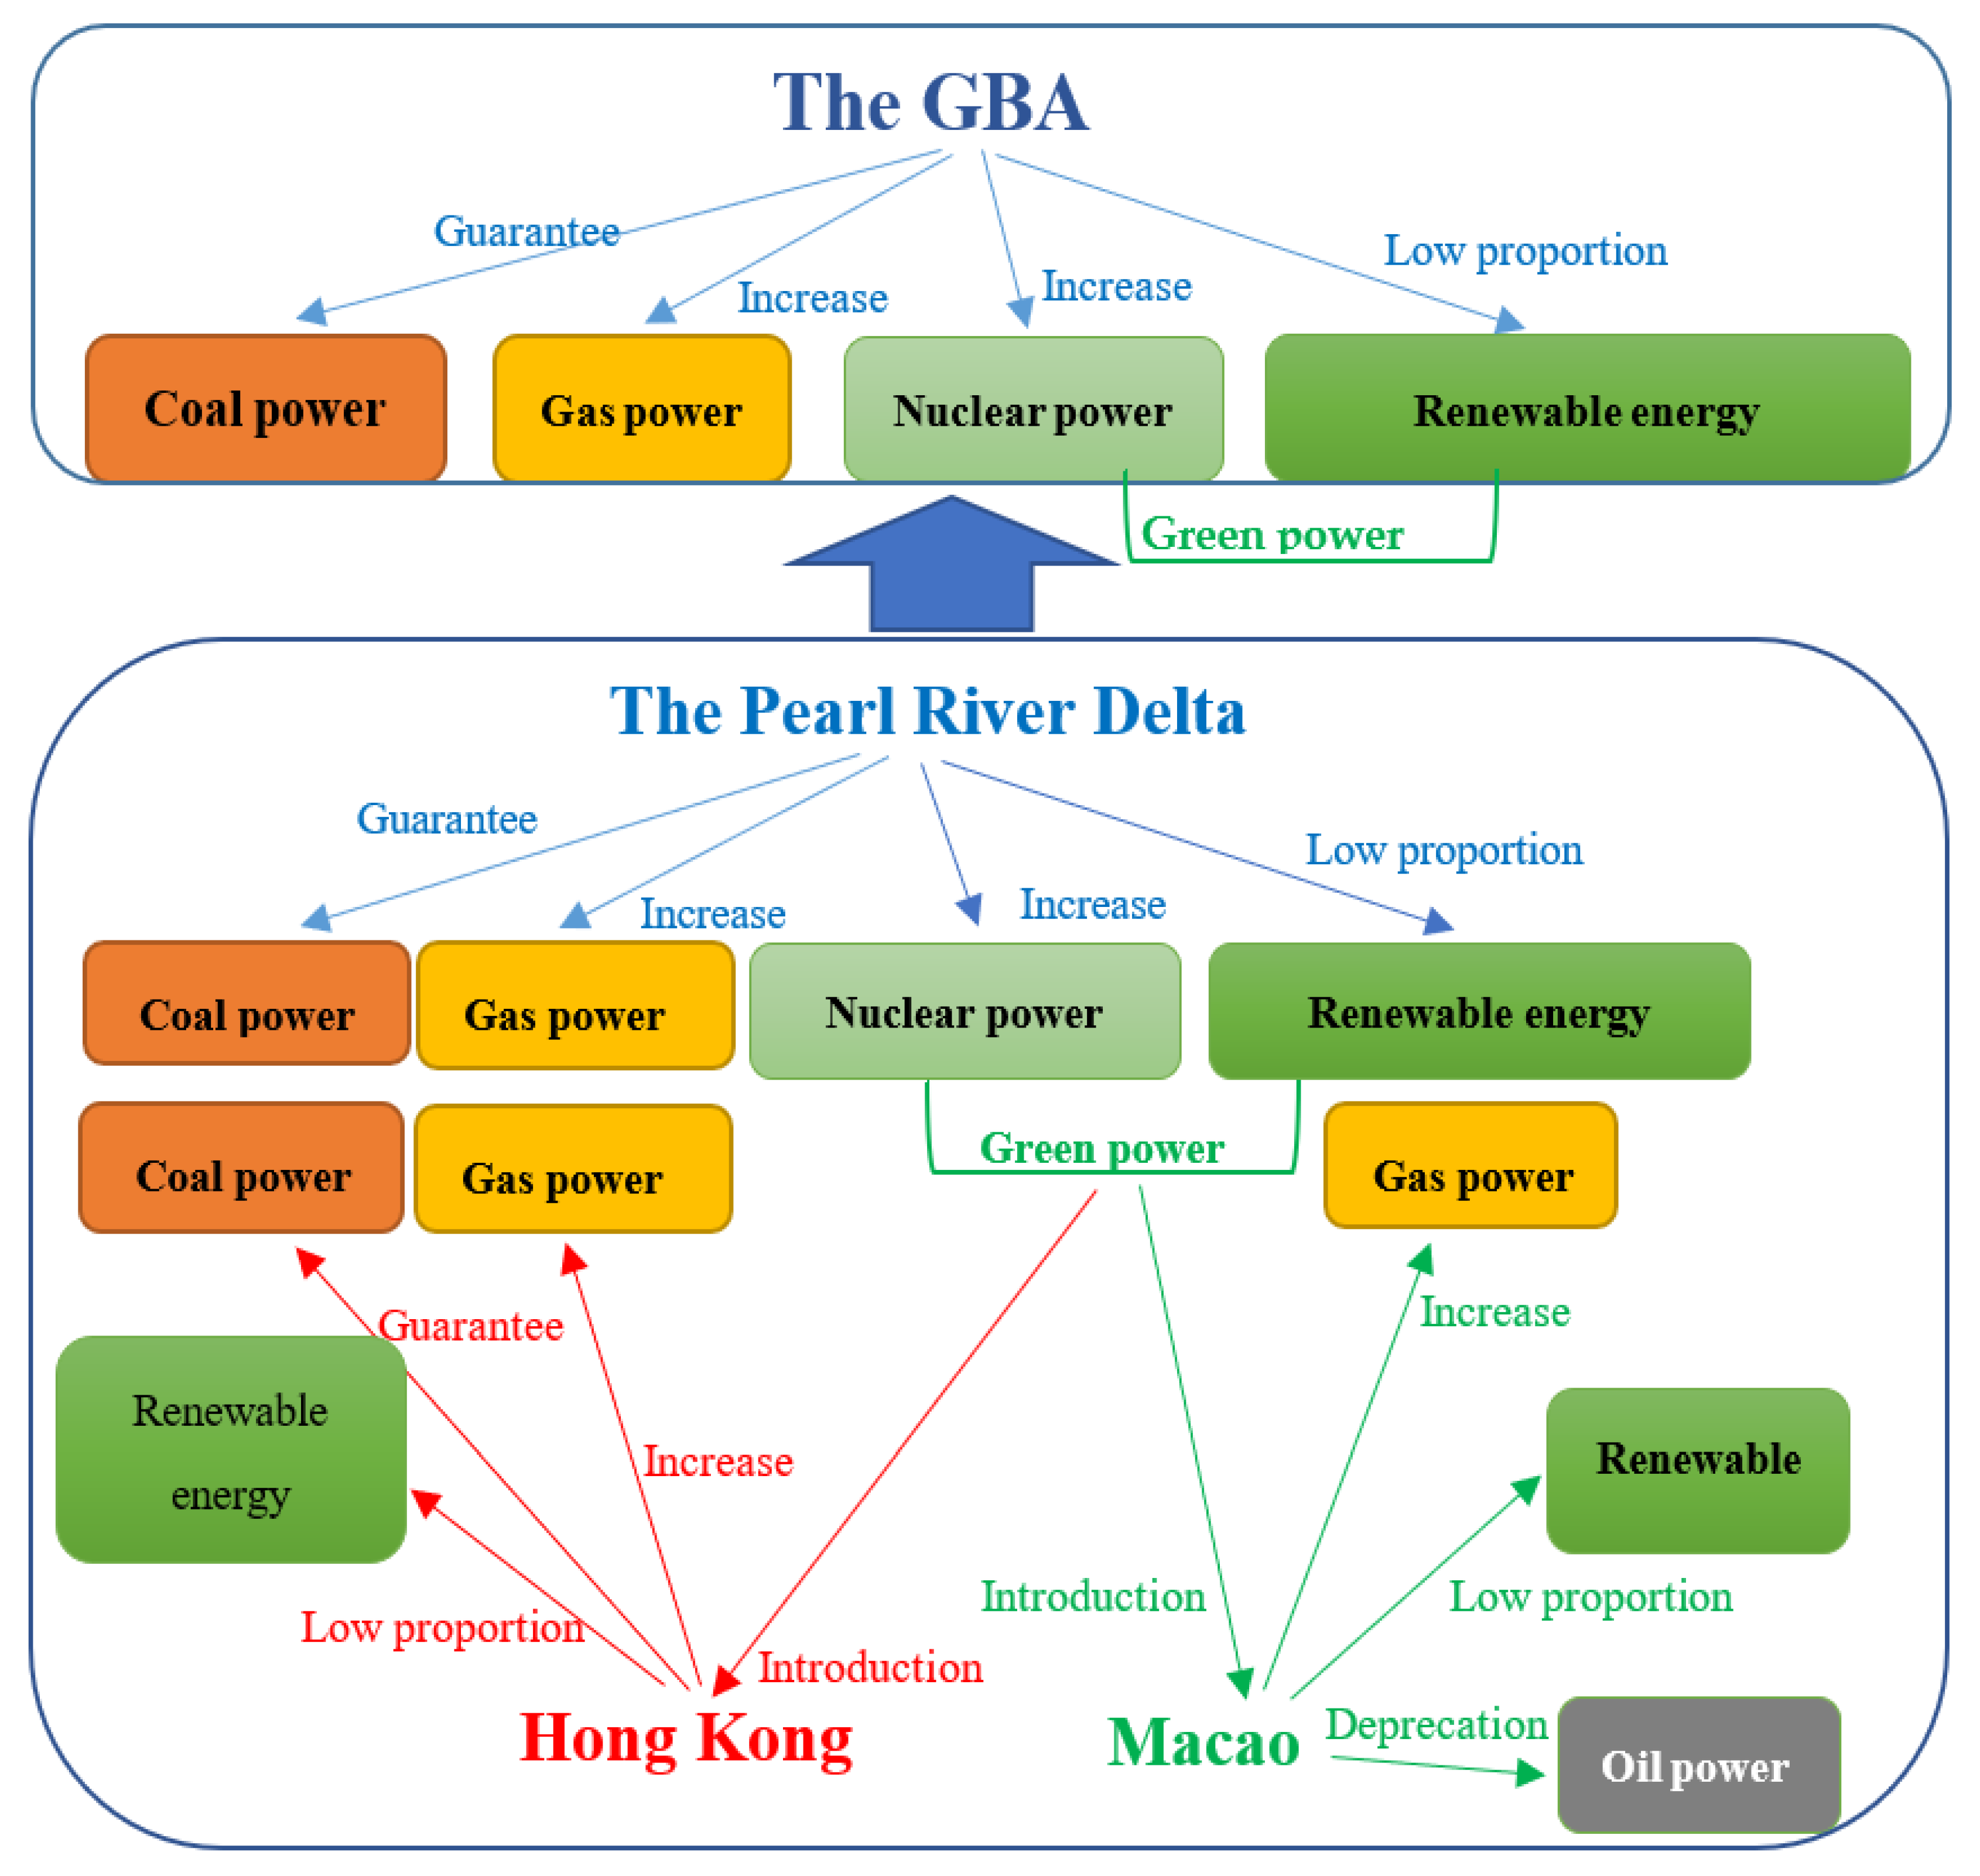
- A combination of the four low-carbon technologies, i.e., efficient coal power, gas power, nuclear power and renewable energy, is the best option for the GBA’s deep power transition, and the overall characteristics of its transition path are “gas increase, nuclear increase, coal guarantee, and low proportion of renewable energy”. The findings support the academic view of the deep transition path represented in category 2.
- (2)
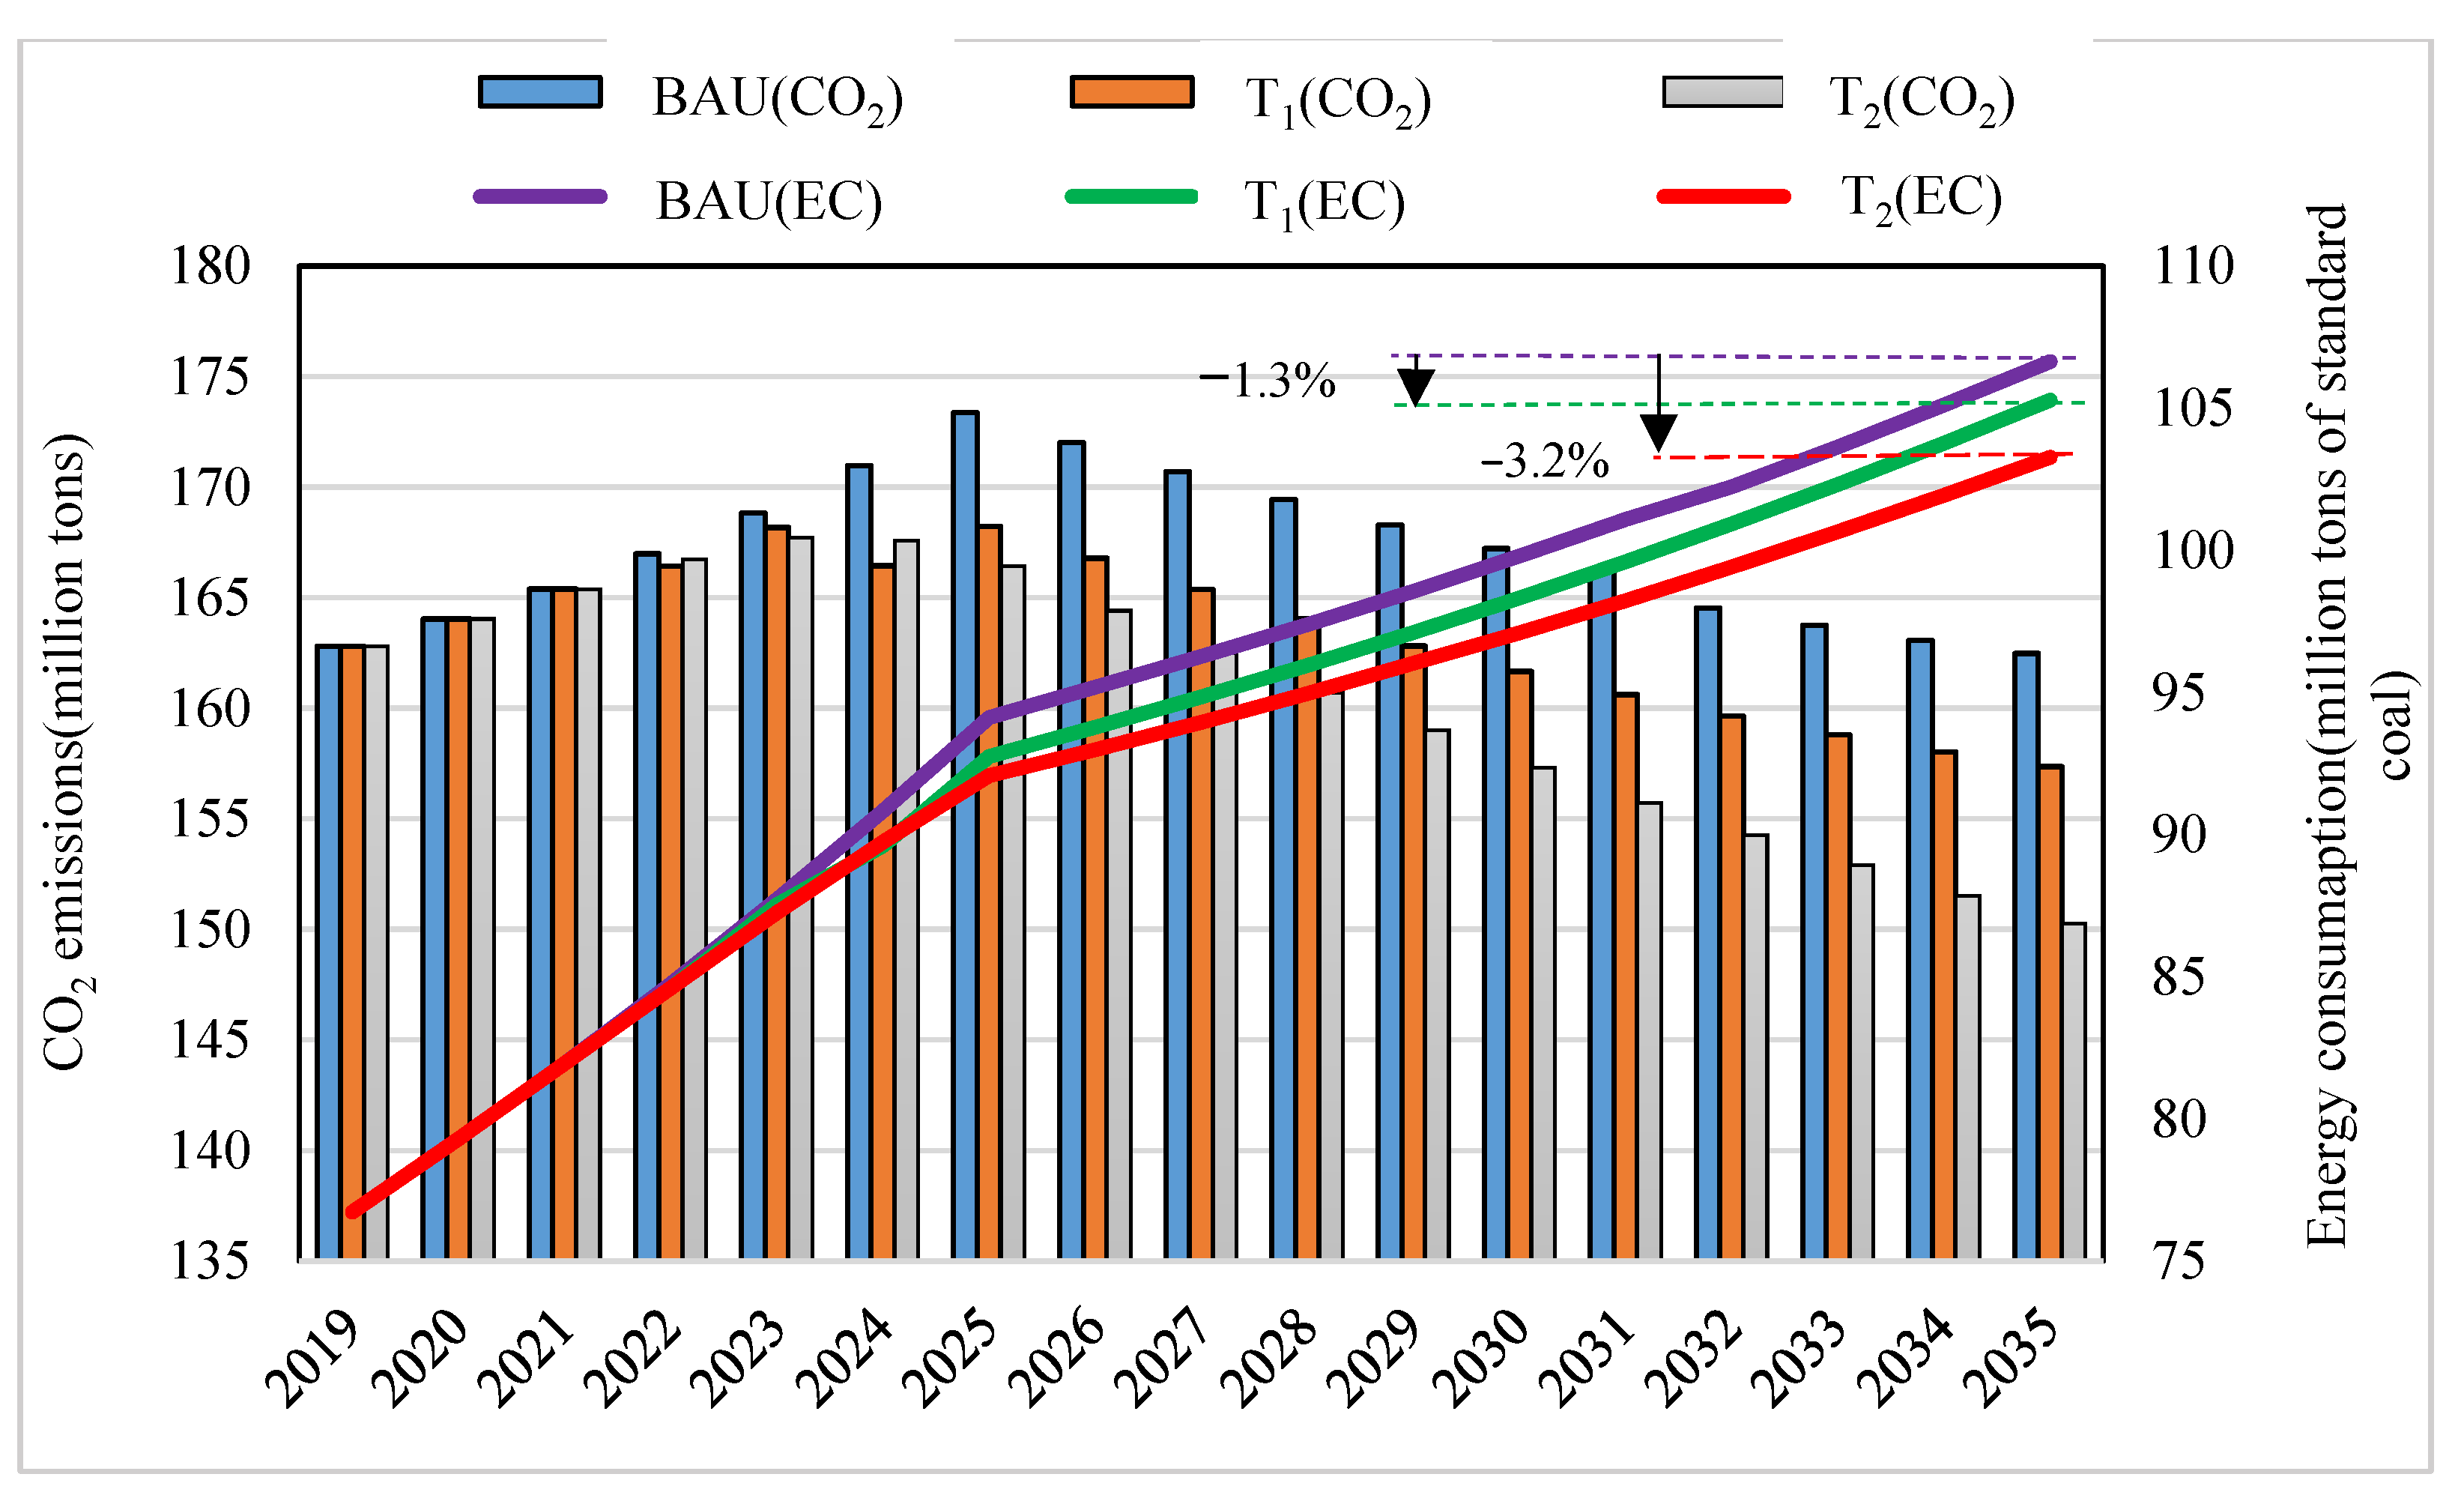
- With the deep transition, the GBA can achieve a carbon peak of 167 million tons of CO2 in 2023. Before 2030, the GBA needs to first develop class H gas power, photovoltaic power generation and nuclear power while phasing out subcritical and below thermal power cogeneration, and subcritical and below coal power. After 2030, a significant increase will be needed in the installed capacity of distributed gas power to replace some class E and F gas power units. Distributed rooftop PV power generation will be the mainstream method of renewable energy generation. Power generation through waste incineration can be one of the most prominent features of urban biomass power generation.
- (3)
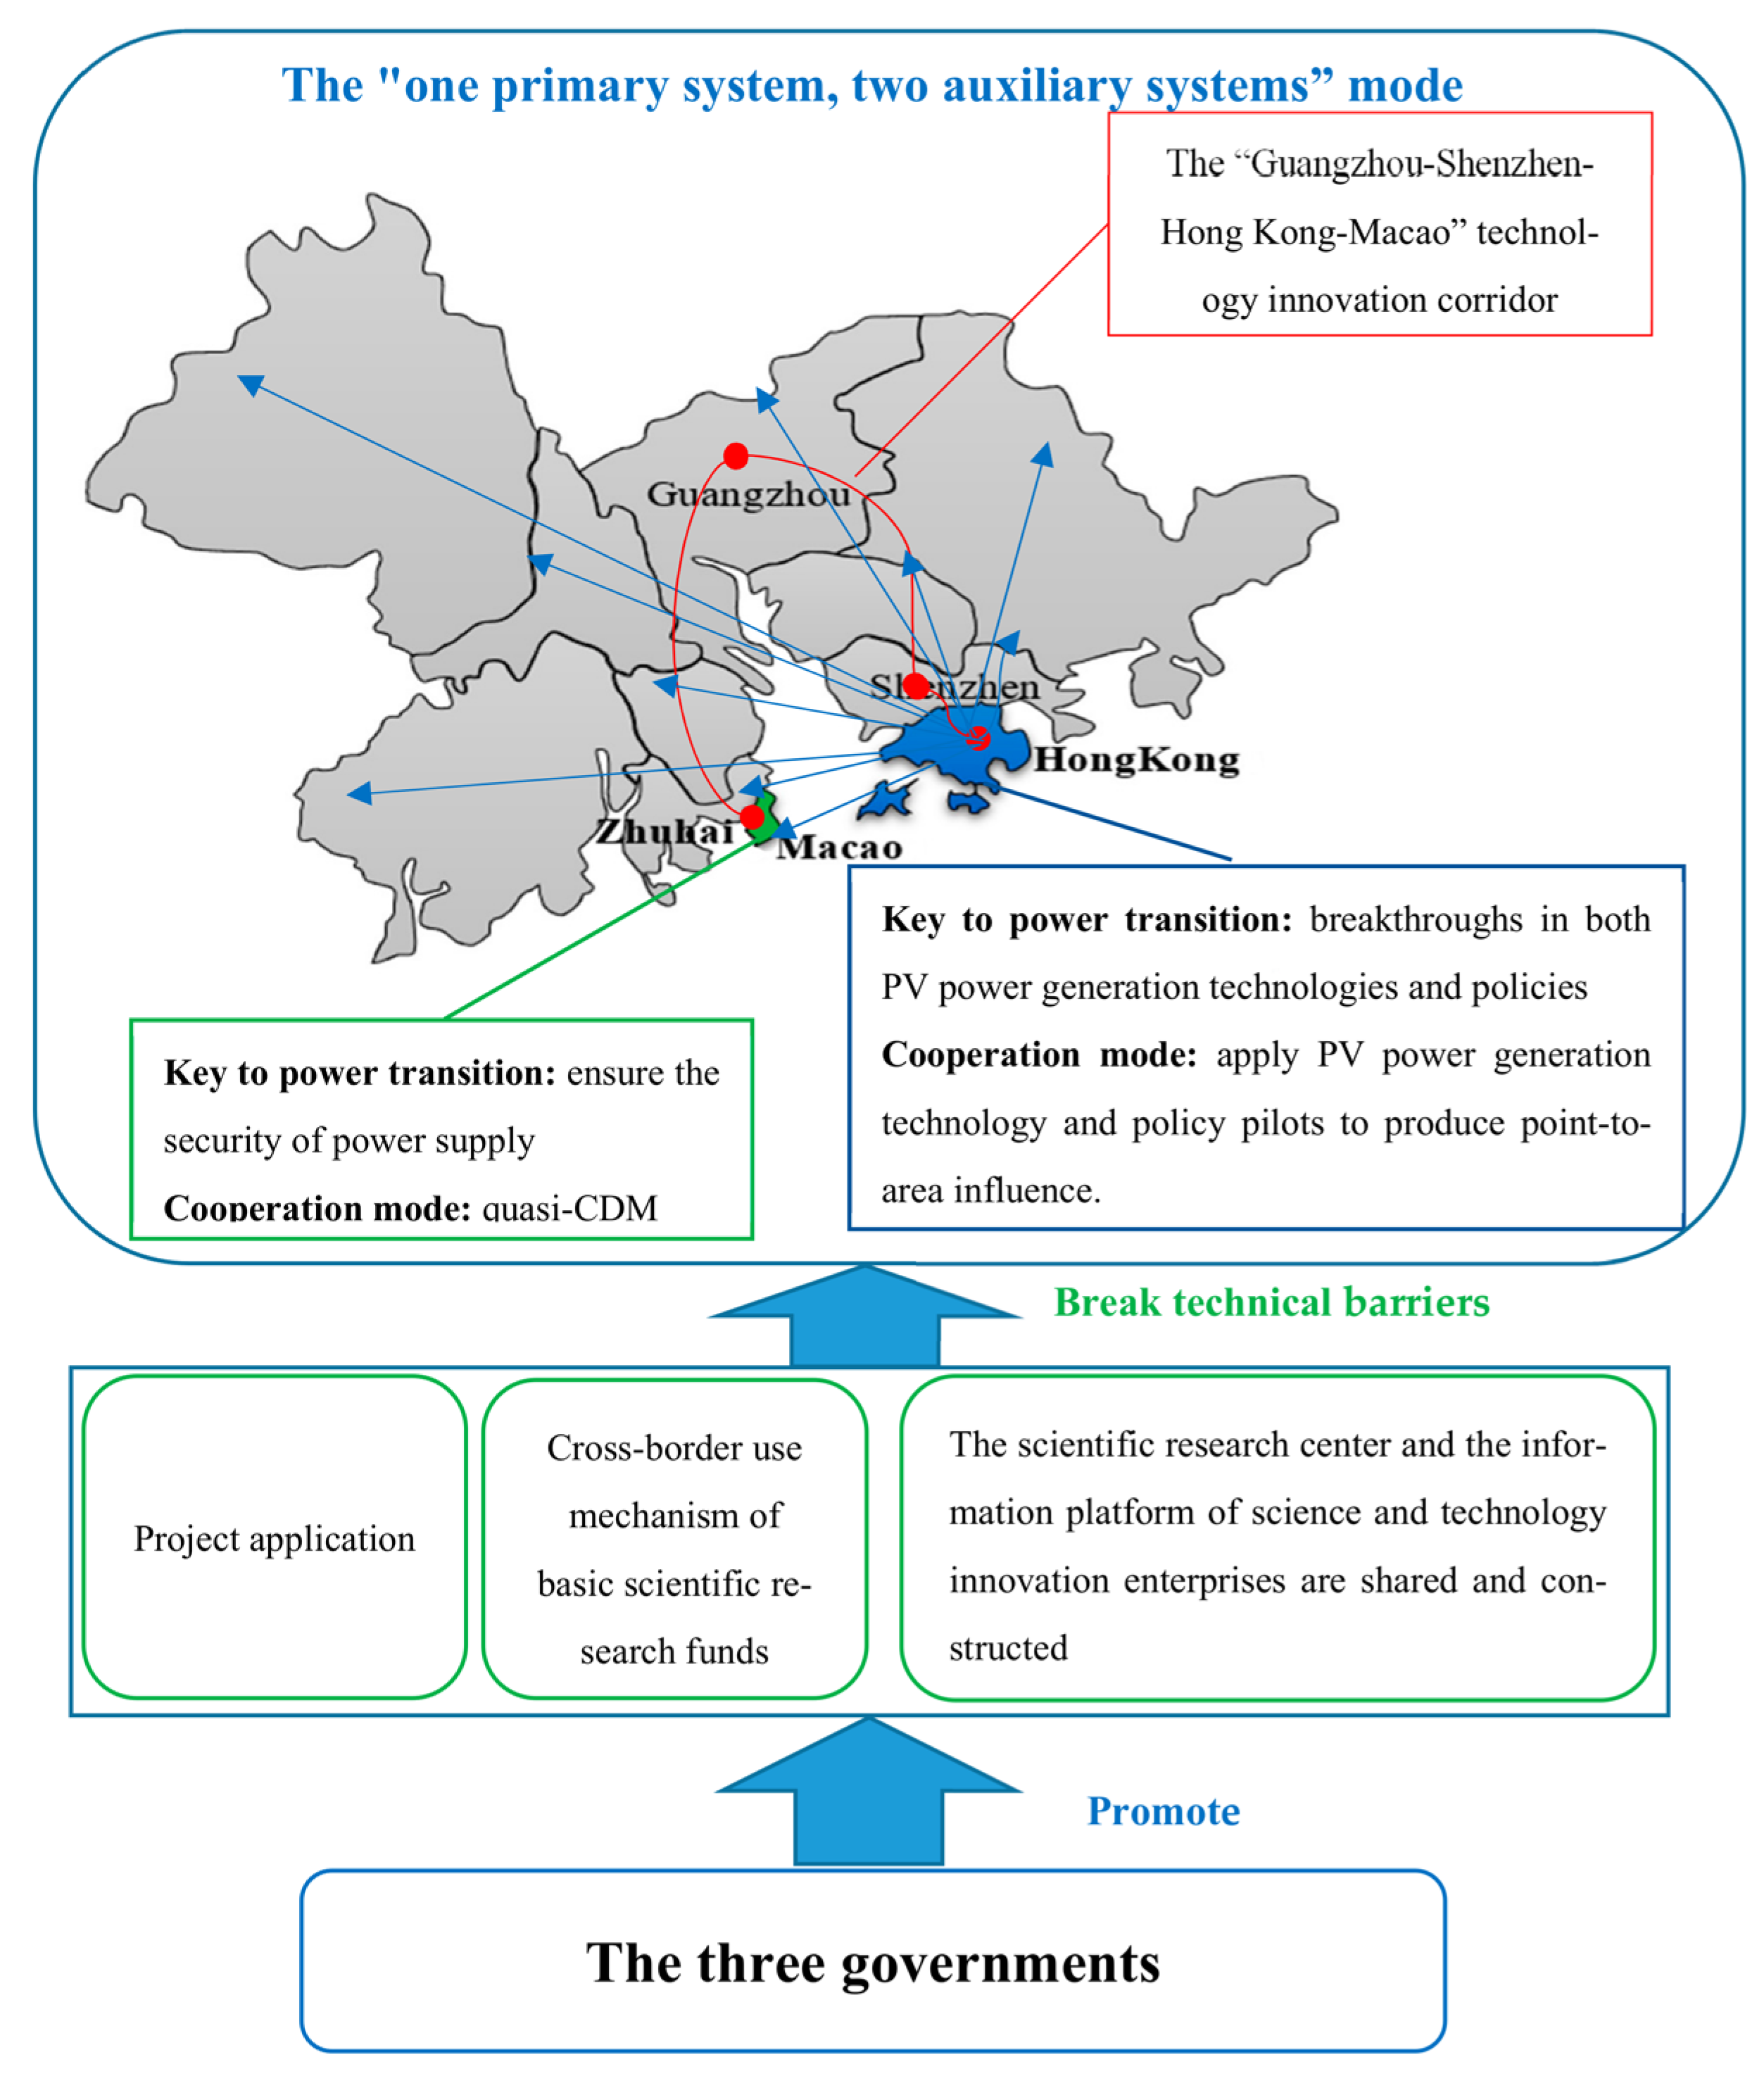
- Under the interaction of different systems, breaking the technical barriers among the three regions is a necessary driving force for establishing the cooperative mode in the energy transition. This paper describes an innovative cooperation mode driven by government efforts and technical innovation, with the Pearl River Delta as the main system and Hong Kong and Macao as the auxiliary systems.
- (4)
- The “one primary system, two auxiliary systems” mode can be expanded into “one primary system, multiple auxiliary systems”. This framework is particularly applicable to countries (or regions) with substantial differences in power supply. Our study provides a theoretical framework for cooperation and a win–win innovation mode of energy transition among countries.
4.2. Existing Shortcomings and Research Prospects
Author Contributions
Funding
Institutional Review Board Statement
Informed Consent Statement
Data Availability Statement
Conflicts of Interest
Appendix A
| Power Generation Technology | Investment Cost (CNY/kW) | Operating Cost (CNY/kW) | Carbon Cost (CNY) | Service Life (Years) | Annual Power Generation Hours (h) | Power Consumption Efficiency (gce/kW·h) | Price of Fuel (CNY/Ton Standard Coal) | ||||
|---|---|---|---|---|---|---|---|---|---|---|---|
| 2019 | 2025 | 2035 | 2019 | 2025 | 2035 | ||||||
| Scenarios BAU | |||||||||||
| Ultra-supercritical coal power | 3300 (1) | 150 (1) | According to the auction ratio and auction price of 5% and 20 CNY/ton CO2, respectively | 40 (1) | 4580 (4) | 308 (4) | 1000 (7) | 1100 (7) | 1200 (7) | ||
| Supercritical coal power | 3300 (1) | 175 (1) | 4200 (4) | 316 (4) | |||||||
| Subcritical and below thermal-power cogeneration | 4400 (1) | 225 (1) | 4960 (4) | 328 (4) | |||||||
| Subcritical and below coal power | 4400 (1) | 225 (1) | 4200 (4) | 336 (4) | |||||||
| Class E gas power | 2900 (1) | 200 (1) | 4500 (4) | 249 (4) | 1880 (8) | 1955 (8) | 2030 (8) | ||||
| Class F gas power | 2900 (1) | 200 (1) | 4500 (4) | 225 (4) | |||||||
| Class H gas power | 4300 (1) | 180 (1) | 4500 (4) | 210 (4) | |||||||
| Distributed gas power | 8000 (1) | 180 (1) | 5800 (4) | 190 (4) | |||||||
| Waste incineration power | 25,000 (2) | 22,000 (2) | 20,000 (2) | 315 (2) | 30 (2) | 5500 (5) | 487 (5) | −194 (5) | |||
| Photovoltaic (PV) power | 6000 (2) | 5500 (2) | 5000 (2) | 200 (2) | 20 (2) | 1000 (6) | 122.9 | - | |||
| Nuclear power | 10,000 (3) | 600 (3) | 60 (3) | 7400 (3) | 380 (3) | ||||||
| Hydropower | 8800 (2) | 300 (2) | 40 (2) | 2100 (6) | - | ||||||
| Onshore wind power | 9000 (2) | 8500 (2) | 8000 (2) | 300 (2) | 20 (2) | 1900 (6) | - | ||||
| Offshore wind power | 19,000 (2) | 16,000 (2) | 13,000 (2) | 500 (2) | 20 (2) | 3000 (6) | - | ||||
| Scenarios T1 | |||||||||||
| Ultra-supercritical coal power | 3300 (1) | 150 (1) | According to the auction ratio and auction price of 5% and 20 CNY/ton CO2, respectively | 40 (1) | 4580 (4) | 308 (4) | 1000 (7) | 1100 (7) | 1200 (7) | ||
| Supercritical coal power | 3300 (1) | 175 (1) | 4200 (4) | 316 (4) | |||||||
| Subcritical and below thermal-power cogeneration | 4400 (1) | 225 (1) | 4960 (4) | 328 (4) | |||||||
| Subcritical and below coal power | 4400 (1) | 225 (1) | 4200 (4) | 336 (4) | |||||||
| Class E gas power | 2900 (1) | 200 (1) | 4500 (4) | 249 (4) | 1880 (8) | 1955 (8) | 2030 (8) | ||||
| Class F gas power | 2900 (1) | 200 (1) | 4500 (4) | 225 (4) | |||||||
| Class H gas power | 4300 (1) | 180 (1) | 4500 (4) | 210 (4) | |||||||
| Distributed gas power | 8000 (1) | 180 (1) | 5800 (4) | 190 (4) | |||||||
| Waste incineration power | 25,000 (2) | 20,000 (2) | 18,000 (2) | 315 (2) | 30 (2) | 5500 (5) | 487 (5) | −194 (5) | |||
| Photovoltaic (PV) power | 6000 (2) | 4000 (2) | 3800 (2) | 200 (2) | 20 (2) | 1000 (6) | 122.9 | - | |||
| Nuclear power | 10,000 (3) | 600 (3) | 60 (3) | 7400 (3) | 380 (3) | ||||||
| Hydropower | 8800 (2) | 300 (2) | 40 (2) | 2100 (6) | - | ||||||
| Onshore wind power | 9000 (2) | 7000 (2) | 6000 (2) | 300 (2) | 20 (2) | 1900 (6) | - | ||||
| Offshore wind power | 19,000 (2) | 10,000 (2) | 8000 (2) | 500 (2) | 20 (2) | 3000 (6) | - | ||||
| Scenarios T2 | |||||||||||
| Ultra-supercritical coal power | 3300 (1) | 150 (1) | According to the auction ratio and auction price of 5% and 20 CNY/ton CO2, respectively | 40 (1) | 4580 (4) | 308 (4) | 1000 (7) | 1100 (7) | 1200 (7) | ||
| Supercritical coal power | 3300 (1) | 175 (1) | 4200 (4) | 316 (4) | |||||||
| Subcritical and below thermal-power cogeneration | 4400 (1) | 225 (1) | 4960 (4) | 328 (4) | |||||||
| Subcritical and below coal power | 4400 (1) | 225 (1) | 4200 (4) | 336 (4) | |||||||
| Class E gas power | 2900 (1) | 200 (1) | 4500 (4) | 249 (4) | 1880 (8) | 1805 (8) | 1729 (8) | ||||
| Class F gas power | 2900 (1) | 200 (1) | 4500 (4) | 225 (4) | |||||||
| Class H gas power | 4300 (1) | 4150 (1) | 180 (1) | 4500 (4) | 210 (4) | ||||||
| Distributed gas power | 8000 (1) | 7500 (1) | 180 (1) | 5800 (4) | 190 (4) | ||||||
| Waste incineration power | 25,000 (2) | 20,000 (2) | 18,000 (2) | 315 (2) | 30 (2) | 5500 (5) | 487 (5) | −194 (5) | |||
| Photovoltaic (PV) power | 6000 (2) | 4000 (2) | 3800 (2) | 200 (2) | 20 (2) | 1000 (6) | 122.9 | - | |||
| Nuclear power | 10,000 (3) | 600 (3) | 60 (3) | 7400 (3) | 380 (3) | ||||||
| Hydropower | 8800 (2) | 300 (2) | 40 (2) | 2100 (6) | - | ||||||
| Onshore wind power | 9000 (2) | 7000 (2) | 6000 (2) | 300 (2) | 20 (2) | 1900 (6) | - | ||||
| Offshore wind power | 19,000 (2) | 10,000 (2) | 8000 (2) | 500 (2) | 20 (2) | 3000 (6) | - | ||||
Appendix B
| Government Departments | Research Institutes and Associations | Energy Enterprises |
|---|---|---|
| (1) Guangzhou Municipal Development and Reform Commission (2) Shenzhen Municipal Development and Reform Commission (3) Zhuhai Municipal Development and Reform Commission (4) Foshan Municipal Development and Reform Commission (5) Huizhou Municipal Development and Reform Commission (6) Dongguan Municipal Development and Reform Commission (7) Zhongshan Municipal Development and Reform Commission (8) Jiangmen Municipal Development and Reform Commission (9) Zhaoqing Municipal Development and Reform Commission (10) Hongkong Electrical and Mechanical Services Department(EMSD) (11) Office for the Development of the Energy Sector of the Macao Special Administrative Region (12) Environmental Protection Bureau of Macao Special Administrative Region | (1) China Energy Engineering Group Guangdong Electric Power Design Institute Co., Ltd. (2) Guangdong Energy Transportation and sale Association (3) Guangdong Oil & Gas Association (4) Guang Dong Petroleum and Chemical Industry Association (5) China Development Institute (6) City University of Hong Kong (7) Hong Kong Baptist University (8) Macao University of Science and Technology | (1) China General Nuclear Power Group and its subordinate power plants Guangdong Energy Group Co., Ltd. and its subordinate power plants (2) Guangzhou Electric Power Development Co., Ltd. and its subordinate power plants (3) Shenzhen Energy Group Co., Ltd. and its subordinate power plants (4) China Light and Power Co., Ltd. and its subordinate power plants (5) Guangdong Dapeng LNG Co., Ltd. (6) Hong Kong & China Gas Co., Ltd. (7) The HongKong Electric Co., Ltd. (8) Macao Waste Incineration Power Plant (9) Macao Electric Power Co., Ltd. (10) 67 thermal power generation enterprises were included in the control and discharge enterprises in Guangdong |
References
- International Energy Agency (IEA). World Energy Outlook. 2020. Available online: https://www.iea.org/reports/world-energy-outlook-2020 (accessed on 8 May 2022).
- Gabriel, L.; Arman, A.; Michael, C.; Siavash, K.; Mahdi, F.; Dmitrii, B.C. Impacts of model structure, framework, and flexibility on perspectives of 100% renewable energy transition decision-making. Renew. Sustain. Energy Rev. 2022, 164, 1–24. [Google Scholar]
- Mark, Z.; Jacobson, M.A.; Delucchi Zack, A.F.; Bauer, S.C.; Goodman, W.E.; Chapman, W.E.; Cameron, M.A.; Bozonnat, C.; Chobadi, L.; Clonts, H.A.; et al. 100% clean and renewable wind, water, and sunlight all-sector energy roadmaps for 139 countries of the world. Joule 2017, 1, 108–121. [Google Scholar]
- Jacobson, M.Z.; Delucchi, M.A.; Cameron, M.A.; Frew, B.A. Low-cost solution to the grid reliability problem with 100% penetration of intermittent wind, water, and solar for all purposes. Proc. Natl. Acad. Sci. USA 2015, 112, 15060–15065. [Google Scholar] [CrossRef] [PubMed]
- Macdonald, A.E.; Clack, C.T.M.; Alexander, A.; Dunbar, A.; Wilczak, J.; Xie, Y. Future cost-competitive electricity systems and their impact on US CO2 emissions. Nat. Clim. Chang. 2016, 6, 526–531. [Google Scholar] [CrossRef]
- Schlachtberger, D.P.; Brown, T.; Schäfer, M.; Schramm, S.; Greiner, M. Cost optimal scenarios of a future highly renewable European electricity system: Exploring the influence of weather data, cost parameters and policy constraints. Energy 2018, 163, 100–114. [Google Scholar] [CrossRef]
- Energy Transitions Commission, Rocky Mountain Institute. China 2050: A Fully Developed Rich Zero-Carbon Economy. 2019. Available online: https://www.energy-transitions.org/publications/china-2050-a-fully-developed-rich-zero-carbon-economy/ (accessed on 24 April 2022).
- Trainer, T. Can renewables etc. solve the greenhouse problem? The negative case. Energy Policy 2010, 38, 4107–4114. [Google Scholar] [CrossRef]
- Trainer, T. A critique of Jacobson and Delucchi’s proposals for a world renewable energy supply. Energy Policy 2012, 44, 476–481. [Google Scholar] [CrossRef]
- Clack, C.T.M.; Qvist, S.A.; Apt, J.; Bazilian, M.; Brandt, A.R.; Caldeira, K.; Davis, S.J.; Diakov, V.; Handschy, M.A.; Hines, P.D.H.; et al. Evaluation of a proposal for reliable low-cost grid power with 100% wind, water, and solar. Proc. Natl. Acad. Sci. USA 2017, 114, 6722–6727. [Google Scholar] [CrossRef]
- Trainer, T. Can Europe run on renewable energy? A negative case. Energy Policy 2013, 63, 845–850. [Google Scholar] [CrossRef]
- Loftus, P.J.; Cohen, A.M.; Long, J.C.S.; Jenkins, J.D. A critical review of global decarbonization scenarios: What do they tell us about feasibility? Wiley Interdiscip. Rev.-Clim. Change 2015, 6, 93–112. [Google Scholar] [CrossRef]
- Smil, V. Energy Transitions: History, Requirements, Prospects, 1st ed.; Prager: Sherman Oaks, CA, USA, 2010. [Google Scholar]
- Heard, B.P.; Brook, B.W.; Wigley, T.M.L.; Bradshaw, C.J.A. Burden of proof: A comprehensive review of the feasibility of 100% renewable-electricity systems. Renew. Sustain. Energy Rev. 2017, 76, 1122–1133. [Google Scholar] [CrossRef]
- Brown, T.W.; Bischof Niemz, T.; Blok, K.; Breyer, C.; Lund, H.; Mathiesen, B.V. Response to ‘burden of proof: A comprehensive review of the feasibility of 100% renewable-electricity systems. Renew. Sustain. Energy Rev. 2018, 92, 834–847. [Google Scholar] [CrossRef]
- Sepulveda, N.A.; Jenkins, J.D.; De Sisternes, F.J.; Lester, R.K. The role of firm low-carbon electricity resources in deep decarbonization of power generation. Joule 2018, 2, 2403–2420. [Google Scholar] [CrossRef]
- Sithole, H.; Cockerill, T.T.; Hughes, K.J.; Ingham, D.B.; Ma, L.; Porter, R.T.J.; Pourkashanian, M. Developing an optimal electricity generation mix for the UK 2050 future. Energy 2016, 100, 363–373. [Google Scholar] [CrossRef]
- Zhang, N.; Xing, L.; Lu, G. Prospects and challenges for the medium and long-term energy and power transformation in China. China Power Enterp. Manag. 2018, 13, 58–63. [Google Scholar]
- Li, Z.; Chen, S.Y.; Dong, W.J.; Liu, P.; Du, E.S.; Ma, L.W.; He, J.K. Low carbon transition pathway of the power sector under carbon emission constraints. Proc. CSEE 2021, 41, 3987–4000. [Google Scholar]
- Frkovic, L.; Cosic, B.; Puksec, T.; Vladimir, N. The synergy between the photovoltaic power systems and battery-powered electric ferries in the isolated energy system of an island. Energy 2022, 259, 124862. [Google Scholar] [CrossRef]
- Percic, M.; Ancic, I.; Vladimir, N. Life-cycle cost assessments of different power system configurations to reduce the carbon footprint in the Croatian short-sea shipping sector. Renew. Sustain. Energy Rev. 2020, 131, 110028. [Google Scholar] [CrossRef]
- Luo, Y.J.; Wang, W.X.; Zhao, D.Q. The impacts of carbon emission trading mechanism on the power transition pathway—Taking Guangdong-Hong Kong-Greater Bay Area as an example. J. Clean. Prod. 2021, 330, 129894. [Google Scholar] [CrossRef]
- Chinese Academy of Engineering (CAE); Guangzhou Institute of Energy Conversion, Chinese Academy and Science (GIEC); Guangdong Energy Research Association; Hong Kong Baptist University; Macau University of Science and Technology. Medium- and Long-Term Scenario Study of Energy Transformation in the Guangdong-Hong Kong-Macao Greater Bay Area; Science Press: Beijing, China, 2020. [Google Scholar]
- Luo, Y.J. Study on the Low-Carbon Transition of the Power Sector under Carbon Emissions Constraint; University of Chinese Academy of Sciences: Beijing, China, 2020. [Google Scholar]
- Kainuma, M.; Matsuoka, Y.; Morita, T. Climate Policy Assessment: Asia-Pacific Integrated Modeling; Springer: Tokyo, Japan, 2003; pp. 247–398. [Google Scholar]
- Luo, Y.J.; Qi, X.L.; Wang, P.; Zhao, D.Q. Study on energy technologies affecting power structures: Based on ahp and fuzzy comprehensive evaluation. Sci. Technol. Manag. Res. 2020, 2020, 50–57. [Google Scholar]
- Electric Power Planning and Designing Institute (EPPDI). Reference Cost Index on the Limitation Design of Thermal Power Engineering; China Electric Power Press: Beijing, China, 2014. [Google Scholar]
- International Renewable Energy Agency (IRENA). Renewable Power Generation Costs in 2019. 2020. Available online: https://www.irena.org/publications/2020/Jun/Renewable-Power-Costs-in-2019 (accessed on 20 April 2021).
- Department of Ecology and Environment of Guangdong Province (GDEE). CO2 Emission Information Reporting Guides for Enterprises (Units) in Guangdong Province. 2021. Available online: http://gdee.gd.gov.cn/shbtwj/content/post_3233358.html (accessed on 1 May 2022).
- Liu, Y.; Tan, X.J.; Yu, Y.; Qi, S.Z. Assessment of impacts of Hubei Pilot emission trading schemes in China—A CGE-analysis using term CO2 model. Appl. Energy 2017, 189, 762–769. [Google Scholar] [CrossRef]
- Wu, J.; Fan, Y.; Xia, Y.; Liu, J. Impacts of initial quota allocation on regional macroeconomy and industry competitiveness. Manag. Rev. 2015, 27, 18–26. [Google Scholar]
- World Intellectual Property Organization. Global Innovation Index 2020. 2020. Available online: https://www.wipo.int/edocs/pubdocs/en/wipo_pub_gii_2020.pdf (accessed on 26 April 2022).
- People’s Government of Guangdong Province. The Several Policies and Measures on Further Promoting Scientific and Technological Innovation. 2019. Available online: http://www.gd.gov.cn/zwgk/wjk/qbwj/yf/content/post_1054700.html (accessed on 26 April 2022).
- Kang, J.J.; Yao, M.T.; Zhu, Q.Y. Analysis of the construction cycle and cost of nuclear power. China Energy 2016, 38, 25–29. [Google Scholar]
- Department of Ecology and Environment of Guangdong Province (GDEE). Verified Carbon Emission Reports of the Thermal Power Plants in the Guangdong Carbon Emission Trading System from 2013–2019. 2020. Available online: http://gdee.gd.gov.cn/ (accessed on 25 April 2021).
- Energy Strategy and Low Carbon Centre (ESLCC) of Guangzhou Institute of Energy Conversion, Chinese Academy of Sciences. The Survey Report on the Resource Thermal Power Plants in Guangdong Province; Guangzhou Institute of Energy Conversion: Guangzhou, China, 2019. [Google Scholar]
- Editorial Committee of China Electric Power Yearbook (ECCEPY). China Electric Power Statistical Yearbook 2019; China Electric Power Press: Beijing, China, 2020. [Google Scholar]
- South China Coal Trading Center (SCCTC). 2019. Available online: http://www.huanancoal.com/ (accessed on 15 July 2021).
- Zhong, S.Y.; Guo, X.M.; Yu, W.Y.; Zhao, J.B. Research on the influence of natural gas power generation on the electricity market. Int. Pet. Econ. 2019, 27, 75–80. [Google Scholar]

| Technology Types | Status Quo (2019) | Potential and Trend | |
|---|---|---|---|
| Thermal Power Generation | Coal Power | The installed capacity was approximately 31 million kW, accounting for 50% of the total installed capacity. The existing coal power units consisted mainly of four types: ultra-supercritical, supercritical, subcritical and below thermal power cogeneration, and subcritical and below power generation. The overall power generation efficiency of the unit was low, and the average standard coal consumption for power generation was approximately 330 g standard coal/kW·h, which was lower than the domestic advanced level. | Guangdong Provincial Government and the Hong Kong Administration Government promised to prohibit the construction and expansion of coal-fired and oil-fired power generation units and to gradually reduce the coal power units. |
| Gas Power | The installed capacity of gas power was approximately 18.35 million kW, and class E and class F power generation units each accounted for nearly 50%. The distributed generation units were just emerging, and there were only a few small units, accounting for only 2%. The unit consumption of the existing gas power units was not high, and the average power consumption was approximately 245 g standard coal/kW·h. | In the next 10 years, the installed capacity of gas power sets will exceed 30 million kW, and 10 new natural-gas-receiving stations or storage stations will be built in Guangdong Province. It is estimated that by 2035, the total natural gas supply capacity in the GBA will be up to 110 billion m3, 5-fold of the current natural gas consumption. | |
| Nuclear Power | Nuclear Power | The installed capacity of the nuclear power units was 7.87 million kW from Shenzhen Dayawan nuclear power station (two 984,000 kW units, operated since 1994), Shenzhen Lingao nuclear power station (two 99 million kW units, operated at phase I since 2003, and two 1.086 million kW units, operated at phase II since 2010 and 2011, respectively) and Jiangmen Taishan nuclear power station (a 1.75 million kW unit, operated since 2018). | The maximum installed capacity of nuclear power units will be increased to 26.62 million kW by 2035. |
| Renewable Energy Power | Biomass Power | The installed capacity of waste incineration power generation units was 1.08 million kW. | By 2035, the population of the GBA will be approximately 100 million, and the amount of waste will be increased to 165,000 tons/day. If the proportion of waste incineration is increased to 80%, the maximum installed capacity of power generation will be increased to 3.29 million kW in 2035. |
| Hydropower | The installed capacity of hydropower units was 1.42 million kW. | The available hydropower resources have been basically exploited, and there will be no new generating units by 2035. The installed capacity of hydropower units will be unchanged in this paper. | |
| Wind Power | The installed capacity of onshore wind power units was approximately 440,000 kW, and they were located in Zhuhai, Jiangmen and Zhaoqing in the Pearl River Delta Region. The offshore wind power projects were just started, with an installed capacity of only 30,000 million kW. | Approximately 1 million kW installed capacity of onshore wind power sets will be installed, mainly in Huizhou and Zhaoqing. The offshore wind power units are limited, mainly in Zhuhai and Huizhou. After 2025, the layout of offshore wind power units will be completed in the GBA, and the maximum installed capacity will be 1.62 million kW. | |
| Solar Power | The installed capacity of solar power units was only 1.45 million kW. | Solar power cannot be commercialized on a large scale in the GBA by 2035. As the land resources are limited, large-scale development of PV power generation units are not applicable in the GBA. However, there is great potential in distributed PV power generation. Based on the annual growth rate of 225,000 kW of distributed PV power generation units in the GBA, the installed capacity will be approximately 11.5 million kW by 2035. | |
| Outsourcing Power | The outsourced power was 275 billion kW·h, accounting for 49.6% of the total power consumption. Of this amount, more than 70% came from the “West-to-east Power Transmission Project”. The average on-grid price was 0.249 CNY/kW·h, which was much lower than the benchmark price of 0.453 CNY/kW·h from grid-connected power generation units in Guangdong Province. The outsourced power has an overwhelming cost advantage compared to the local power generation units. | In this research, the costs and technologies of the outsourcing power and the local power generation are not discussed. To ensure the power supply safety in the GBA, the proportion of the outsourcing power should be essentially stable. As the power demand is growing faster than the construction of power generation units, there will be more demand for outsourced power before 2025. It is assumed that the proportion of outsourced power will increase to 51% by 2025 and 52% by 2035. | |
| Scenarios | Description |
|---|---|
| Business as usual (BAU) | The investment cost of renewable energy technologies available in the GBA decreases steadily under the current rate of technological progress. With the progress of the independent innovation of renewable energy technology and further localization of power generation equipment, the scale effect will gradually ramp up. |
| Renewable energy technology (T1) | Promote renewable energy generation vigorously, and the investment cost of renewable energy technology will be further decreased. |
| Multiple clean and low-carbon technologies (T2) | Promote renewable energy generation rationally, and the investment cost of nuclear power and high-efficiency gas turbine units will gradually reduce with the increase in locally manufactured equipment. Meanwhile, with the improvement of the natural gas receiving station and gas supply network in the GBA, the set gas price will gradually decrease from the current average gas price of CNY 2.5 per cubic meter to CNY 2.3 per cubic meter in 2035, which is close to the current gate price of the second west-east gas transmission line to power plants in various cities. |
| Organized by | A special investigation group on “the medium and long-term energy transition in the GBA” composed of academicians and researchers | ||||
| Duration | 2 March~31 May 2020 | ||||
| Data Content | Status quo, potential and cost of power generation technology | Trend and planning of power generation technology | Scenario parameter settings | Energy carbon emission factor | |
| Data Source | |||||
| Eleven city government departments (see Appendix B Table A2 for a partial list) | √ | √ | √ | × | |
| Scientific research institutions, enterprise visits/verifications (see Appendix B Table A2 for a partial list) | √ | √ | √ | √ | |
| Expert questionnaires (154 valid questionnaires) 1 | √ | √ | √ | × | |
| Studies and reports [26,27,28,29,30,31] | √ | √ | √ | √ | |
Disclaimer/Publisher’s Note: The statements, opinions and data contained in all publications are solely those of the individual author(s) and contributor(s) and not of MDPI and/or the editor(s). MDPI and/or the editor(s) disclaim responsibility for any injury to people or property resulting from any ideas, methods, instructions or products referred to in the content. |
© 2023 by the authors. Licensee MDPI, Basel, Switzerland. This article is an open access article distributed under the terms and conditions of the Creative Commons Attribution (CC BY) license (https://creativecommons.org/licenses/by/4.0/).
Share and Cite
Wang, W.; Luo, Y.; Zhao, D. The Power Transition under the Interaction of Different Systems—A Case Study of the Guangdong–Hong Kong–Macao Greater Bay Area. Sustainability 2023, 15, 5577. https://doi.org/10.3390/su15065577
Wang W, Luo Y, Zhao D. The Power Transition under the Interaction of Different Systems—A Case Study of the Guangdong–Hong Kong–Macao Greater Bay Area. Sustainability. 2023; 15(6):5577. https://doi.org/10.3390/su15065577
Chicago/Turabian StyleWang, Wenxiu, Yuejun Luo, and Daiqing Zhao. 2023. "The Power Transition under the Interaction of Different Systems—A Case Study of the Guangdong–Hong Kong–Macao Greater Bay Area" Sustainability 15, no. 6: 5577. https://doi.org/10.3390/su15065577
APA StyleWang, W., Luo, Y., & Zhao, D. (2023). The Power Transition under the Interaction of Different Systems—A Case Study of the Guangdong–Hong Kong–Macao Greater Bay Area. Sustainability, 15(6), 5577. https://doi.org/10.3390/su15065577


