Article

Novel COVID-19 Outbreak and Global Uncertainty in the Top-10 Affected Countries: Evidence from Wavelet Coherence Approach

1
Department of Finance, College of Business Administration, King Saud University, Riyadh 11587, Saudi Arabia
2
Faculty of Political Science, Department of Islamic Economics and Finance, Sakarya University, Serdivan 54050, Turkey
3
Department of Business Administration, Sukkur IBA University, Sukkur 65200, Pakistan
*
Author to whom correspondence should be addressed.
Sustainability 2023, 15(6), 5556; https://doi.org/10.3390/su15065556
Submission received: 19 November 2022 / Revised: 12 February 2023 / Accepted: 7 March 2023 / Published: 22 March 2023
(This article belongs to the Special Issue Sustainable Financing for Companies under COVID-19)

Abstract

:
This study explores the association of novel COVID-19 with the dominant financial assets, global uncertainty, commodity prices, and stock markets of the top ten corona-affected countries. We employ a wavelet coherence technique to unearth this linkage using daily data of COVID-19 deaths and reported cases from 1 January 2020 until 26 February 2021. The study finds a weak coherence between COVID-19 and global uncertainty variables in the short and medium term, while a strong positive correlation has been witnessed in the long run. The COVID-19 cases impact the stock markets in the short and medium term, while no significant impact is reported in the long run. On the other hand, a substantial impact of the COVID-19 outbreak has also been found on the exchange rate. In addition, the real asset market, such as gold, remains more stable during the COVID-19 outbreak. Thus, the study recommends that investors and portfolio managers should add such assets to their investment options to safeguard the excessive risk and downside momentum of the equity market. The study also has implications for regulators who are concerned with the neutrality of the COVID-19 effect and market stability.

1. Introduction

In our globally interconnected economies, shocks inside a part of the economic system or from outside can transform into extreme worldwide financial slumps through the entire system, contributing to developing disparities across economies. On 30 January 2020, the World Health Organization (WHO) released COVID-19’s first global warning; further, the organization stated COVID-19 was a global pandemic on 11 March 2020, as the figure of confirmed cases escalated globally [1]. The current COVID-19 widespread has led to the most severe financial downturn in about a century, putting people’s well-being at risk, hampering economic growth, and jeopardizing their employment. The scale and speed of the COVID-19 financial crisis are unprecedented. The recession harmed worldwide financial stability, and significant parts of the international economy, including the informal economy, came to a halt. Governments have stopped the free fall of global growth with unprecedented monetary and fiscal care—the latter to the tune of $11.5 trillion globally as of September 2020—to expand support to companies and citizens where conditions and budgetary space permitted. This uncommon monetary interruption can leave enduring marks for quite a long time, emerging from substantial waning in capital stock, business, and profitability. Governments also increased spending to help employees and protect jobs. Government responses to the pandemic’s economic impact totaled $12 trillion globally. The early effects of COVID-19 on world markets were multiple times bigger than that experienced in the early months of the 2008 GFC. Worldwide global production contracted by 4.3 percent in 2020, more than three times what it was before the GFC of 2009 [2].
The moderate regaining of 4.7% predicted in 2021 will barely compensate for the losses in 2020. More than 90 central banks have curtailed policy rates 241 times since March 2020. Several central banks adopted extra monetary and prudential initiatives to boost liquidity and ensure financial stability. Due to the stringent and prolonged lockout measures implemented worldwide during the outbreak, the developed economies were hit the hardest, with an expected production waning of 5.6 percent in 2020. In developing economies, the shrinkage was less severe, with production plummeting by 2.5 percent in 2020. The pandemic wreaked havoc on the global labor market. By April 2020, nearly 2.7 billion jobs, or 81 percent of the global workforce, had been affected by full or partial lockout measures.
COVID-19 affects supply and demand across all asset groups [3,4]. In several ways, the contemporary pandemic parallels to the US Financial Crisis, when investors lost substantial value in their investments [5]. Selected research papers have examined and corroborated the COVID-19 crises’ drastic effects on financial assets and markets [6,7,8,9,10,11]. In the same vein, studies reveal that in epidemics such as financial turmoil, the financial market’s level of uncertainty is at an all-time high [12,13]. Global financial assets have already responded with massive nosedives, volatility, and waning market liquidity. Financial assets have also seen dramatic movement on an unparalleled range while risks have increased markedly, echoing in response to the purported pandemic.
As the global financial milieu suffers due to the COVID-19 pandemic, it is central to investigate how COVID-19 has impinged on the global asset classes. Our motivation for investigating the purported theme comes from multiple studies that reveal that COVID-19 has impacted global financial and macroeconomic variables, including multiple asset classes. In this prospect, our central objective is to investigate how different asset classes respond to the purported pandemic. Following the tracks of [14,15,16] this research adds to the body of information by employing the wavelet coherence procedure to study the co-movement between the purported pandemic with stock market indices, exchange rates, oil prices, gold prices, and global uncertainty variables. Moreover, distinct from other investigations, this research takes a more methodical approach by examining the top ten most infected economies.
Gauging the effects of the COVID-19 outbreak in assets classes, namely, stock markets, exchange rates of the top ten most infected economies, and global asset variables, namely, gold, crude oil, and uncertainty variables, shall provide institutional & individual investors and the portfolios managers & policymakers with a systematical appreciation of the performance and dynamics of the selected assets classes and shall assist in proper risk measurement, portfolio diversification, and policy formulation.
Several scholars have utilized the following different methodologies of data analysis on the effects of the COVID-19 crisis on many aspects of the financial and economic dimensions. Diebold–Yilmaz [17], Markov Switching AR model [18], time-varying VAR (TVP-VAR) [19], wavelet-based Granger causality, and coherence wavelet tests [14], multivariate regressions [20], GJR-GARCH model [21], GARCH (1,1) [22], Wavelet Coherence technique [14,15], Asymmetric Multifractal Detrended Fluctuation Analysis [23].
In the lexicon of finance literature, wavelet-based analysis is increasingly being employed to examine the bilateral relationships between variables [24]. The employment of wavelet coherence assists in investigating lead–lag interplay among the selected variables during the COVID-19 period and assists the stakeholders in exercising caution when making long-term investment decisions [25,26]. Appropriately, investigating by the wavelet catches a more nuanced comprehension of the relationship through the co-movement of the purported variables in both the time and frequency domains [27,28]. The standard techniques deliberate on the time-space perspective [29]. Inline, the study employs the wavelet coherence method, which covers both the cross-wavelet transform and coherence. Our findings are mainly saliently attributable to the fact that as COVID-19 progresses, there is rising anxiety about multifarious potential costs and a hike in global economic uncertainty.
We make the following contributions to the extant literature: firstly, we investigate the impact of daily observations of COVID-19 cases on multiple asset classes. Secondly, the study covers the 10 hardest-hit economies by COVID-19. Our study further extends the studies of [14,15,16] by covering multiple assets. By comparing and analyzing the influences of the COVID-19 outbreak on the multiple asset classes, we present noteworthy implications for portfolio managers and other prime stakeholders for shaping risk management strategies across several regimes.
In this prospect, our central objective in this study is to unearth how different asset classes are responding to the purported pandemic. The following are the most significant empirical findings of the current study:
Firstly, we have found a weak coherence between COVID-19 and global uncertainty variables (USEPU, VIX, OVX, GVZ, EVZ) in the near to medium term while there is strong and positive coherence in the long run. This strong positive coherence is initially led by COVID-19 deaths and cases, and then it reciprocates as the time approaches 256 days in the time–frequency domain. Such time-inconsistent results of the lead–lag relationship of COVID-19 with VIX and OVX have also been conveyed by [14]. Secondly, concerning local stock markets’ reaction to the COVID-19 deaths and cases, it is found that local COVID-19 cases lead the stock market only in the near to medium term, not in the long run. This implies that the local investors give immediate feedback reaction to the incoming information. However, global investors take time to readjust their global portfolios in reaction to market news. Thirdly, in the time–frequency analysis of the COVID-19 pandemic and gold price, the study finds that as time passes, the gold market gets adjusted to COVID-19 information and starts behaving like normal. It is because gold is considered a safer investment option for investors and fund managers. Being considered a haven for investors, they can diversify their portfolio risk by adding gold to their basket of assets. Fourth, a strong connectedness between COVID-19 deaths and cases and ER at a lower scale has been observed, which indicates a significant bearing of the COVID-19 outbreak on the exchange rate returns.
The remainder of this paper is systematized as follows. Section 2 covers the related literature. Section 3 discusses the methodology used and the data. Section 4 provides empirical results and policy recommendations. Section 5 concludes the study and the policy implications.

2. Literature Review

2.1. COVID-19 and Stock Market

Previous studies have examined how pandemics such as SARS and EBOLA affect stock market results [30,31,32,33]. Inline, given the ruthlessness of the current pandemic, scholars have begun investigating COVID-19’s effects, and an apparent pattern between COVID-19 and stock markets has emerged. Ref. [34] employing daily COVID-19 confirmed cases and deaths data from 64 economies as well as stock market returns from 22 January 2020 to 17 April 2020, discovered that stock markets retorted adversely to the development in COVID-19-affirmed cases.
Ref. [35] through the asymmetric power GARCH model, discovered that COVID-19 has a noteworthy negative impact on market returns in the US and Japan. Furthermore, COVID-19 has had a more considerable influence on stock market volatility in the United States, Germany, and Italy than the 2008 crises. However, the GFC affected the Nikkei 225 index and SSEC’s financial volatility more than COVID-19. Ref. [36] using Granger casualties of stock markets from 20 different countries, reveal that COVID-19 causes close financial linkage between countries. Ref. [37] through a smooth transition HAR model, explore the COVID-19 financial crisis in G7 countries and 10 sectors. The study finds clear evidence of a transition to a crisis regime in all countries and industries, but the severity and timing of crises differ. Ref. [38] through martingale difference and conditional heteroscedasticity tests, explore the topmost four affected economies in the current pandemic (USA, Brazil, India, and Russia).
The study reveals no indication of a significant shift in the market efficiency for the US and Brazil. However, following the coronavirus outbreak, Indian stock markets became more information inefficient, while Russian stock markets became more information effective. Ref. [39] unearth the direct and incidental effects of the COVID-19 pandemic on stock market volatility through data from 34 developed and emerging markets, in addition to how certain economic aspects can help to minimize the volatility shock and prevent a possible financial crisis. Ref. [40] covering 76 different countries show that a rise in the Barro Misery Index (BMI) has an unfavorable impact on stock returns and raises stock volatility. The analysis also shows that the effects of BMI mechanisms on stock returns and volatility vary between the multifarious markets. Ref. [41] revealed that COVID-19 had increased the volatility of the ASEAN stock markets.
Ref. [42] assess the effect of COVID-19 on stock market volatility in 11 developed economies and China and show that volatility escalated considerably during the studied period. Ref. [43] bring out that during the COVID-19 pandemic, listed companies in China and G7 countries, both financial and non-financial, have notably higher conditional correlations between their stock returns. However, in the COVID-19 outbreak, the scale of the escalation in these correlations is notably higher for financial firms, putting forward the worth of their part in financial contagion transmission. Ref. [44] through a set of a dozen economies with the most liquid stock markets, showed that the panic activated by the pandemic hurts stock returns through the escalation of the market risk premium channel. Ref. [45] employing the wavelet method, reveal that all ASEAN-5 stock markets exhibited good coherence with the Dow Jones Index as the pandemic progressed (mid-period). However, there is no coherence between the ASEAN-5 stock markets, local COVID-19 events, and the Dow Jones Index at the end of the selected period. Ref. [46] found a negative association between stock markets and COVID-19 regardless of Islamic or conventional stocks. Ref. [47] explored the presence of a strong impact of COVID-19 on Islamic and conventional markets’ volatilities, especially during the long term.
Ref. [48] examined the influence of COVID-19 on the populaces and equity markets of 92 economies. The study shows no connection between a country’s stock market performance and its ability to cope with COVID-19. Ref. [49] through the TVP-VAR connectedness approach, shows that around the time of the COVID-19 outbreak, there is a testimony of a major shift in the arrangement and time-varying patterns of return connectedness through different assets. The outcomes also point to the risk of endangering investors’ portfolios and diminishing the advantages of broadening. Ref. [50] highlight how the impact of COVID-19 is widespread on the microstructure of US value markets. The study advocates that a hike in confirmed coronavirus cases and deaths is connected to a sizable rise in market illiquidity and fluctuations. Ref. [51] reports that emerging stock markets are more subject to UPE than developed market stocks.
Furthermore, the study shows that integrating the UPE indicator into the stock valuation is critical for investment decisions, especially during pandemics. Ref. [52] employing a complex network approach, explores the effects of COVID-19 on 56 global stock indices. Due to COVID-19, the results show a structural shift in the form of node shifts, decreased connectivity, and significant differences in the network’s topological traits. Based on regional positioning, the results also show noteworthy clustering and homogeneity in the international stock market network.

2.2. COVID-19 and Uncertainty

The effects of financial uncertainties on economic and financial variables, namely, overall financial uncertainty, stock market uncertainty, and oil market uncertainty, are increasingly attracting researchers’ attention [12,53,54]. Consequently, as the point of uncertainty in particular financial markets changes, investors are impelled to rebalance their portfolios, and it is pertinent to investigate the effects of global financial uncertainties. The implied volatility, which manifests in investor expectation and market sentiment, is regularly used to determine the uncertainties of specific financial markets relating to global financial uncertainties [55]. COVID-19-related uncertainty has repercussions on the returns and volatility in the US and globally [50,56].
Ref. [57] through wavelet coherence investigation, reveals, relating to COVID-19, that EPU has an increasing impact on sector volatility than the global financial crisis (GFC) across multiple areas. Additionally, during the COVID-19 pandemic, EPU leads all sector volatility, while during the GFC, some sector volatility leads EPU. Ref. [58] show the effect of COVID-19-related uncertainty on regional index returns and volatility. The study shows that COVID-19-related uncertainty has a deleterious effect on all countries. Ref. [59] investigate multiple measures of economic uncertainty in the US and the UK before and after the COVID-19 pandemic. Following the pandemic and its economic consequences, all indicators show notable increases in uncertainty. Ref. [60] report that commodity returns escalate as COVID-19-related fear upsurges. Because of the deleterious correlation between GFI and the stock market, the study deduces that the commodity market serves better safe haven traits than the stock market. Ref. [61] show that the financial sector was a strong transmitter of spillovers to other sectors.

2.3. COVID-19 and Exchange Rate

A set of studies reveals the connection between exchange rate volatility and the pandemic [62,63]. Ref. [64] through a time-varying unit root model, highlights that COVID-19 has affected the Yen–US dollar exchange rate. Ref. [65] through GMM estimation, cover 20 countries from 13 January 2020 to 21 July 2020, and reveal that an increase in COVID-19 reported cases increases exchange rate volatility significantly.
Ref. [22] presents new evidence that disease outbreaks encompass useful data that can be employed to improve exchange rate return and volatility forecasts. The study shows that COVID-19 has a stronger predictive influence over volatility than returns for a one-day ahead forecast horizon employing the total number of infections per million. Ref. [66] use multifractal detrended fluctuation analysis (MF-DFA) to support the presence of multifractality in forex markets, demonstrating a drop-in forex market efficiency through the COVID-19 outbreak and varied effects on the forte of multifractality of exchange rate returns. Through the time-varying spillover model, [67] reveal that the B&R framework spillover index symbolizes some unexpected regional crises. The study reports that internal financial reforms and external economic shocks affect the RMB exchange rate spillover.
Furthermore, the contemporary outbreak of COVID-19 has thrown RMB’s supremacy into disarray. Ref. [68] through a multifactor arbitrage pricing model, revealed that industries were more vulnerable to exchange rate risk during and after the pandemic than other sectors.

2.4. COVID-19—OIL

Not only are commodity markets susceptible to the rule of supply and demand, macroeconomic ingredients (exchange rates and inflation, and political events), are also vulnerable to pandemic factors [69]. The current pandemic has had a major effect on the energy area [70]. During this juncture, the crude oil market has seen some of the highest levels of volatility, partly due to the COVID-19 pandemic and partly due to political maneuvering among oil producers [71]. Ref. [72] state that a daily newspaper-based index of infectious disease uncertainty (EMVID) has an affirmative effect on global oil market volatility. Ref. [73] found a strong spillover of the financial market during economic turmoil.
Ref. [74] utilize the TVP-VAR dependent connectedness index method and report that the financial panic risk has a central mediation effect. Ref. [75] through the DCC-GARCH model’s time-varying correlations, indicate that gold is a haven currency for global crude oil markets during the COVID-19 era. Ref. [76] employing long memory techniques, inspected the bearing of COVID-19 on WTI crude oil prices. Ref. [77] explore that an increase in the non-oil GDP growth rate increases domestic investment, while natural resources crowd out domestic investment. The study discovered that the oil price series means reverting, meaning that the shock would be transient but have long-term consequences. Ref. [78] examine the financial and non-financial industries’ vulnerability to oil price risk during the COVID-19 pandemic. The empirical findings report that positive oil price risk shocks favor oil supply industries in general, while positive oil price shocks hurt oil consumers and financial industries.

2.5. COVID-19 and Gold

Gold is a store of significant worth utilized for speculation and support purposes. In reality, gold is a safe haven asset in global financial markets, oil markets, and during periods of rising inflation. It is also held in reserve by several central banks [79,80,81]. Inline selected studies have revealed that gold is a hedging instrument in portfolio diversification and a safe haven in times of economic uncertainty and volatile markets. Gold has been shown to hold its value during market upheavals [82,83]. Ref. [84] corroborate the gold market’s ability to serve as a safe haven during a pandemic, but with greater efficacy before the outbreak.
Furthermore, regardless of the time, gold consistently outperforms US stocks and other important precious metals such as silver, palladium, and platinum as safe haven assets. Ref. [85] employing the ARMA-GARCH model, examine the behavior of gold-backed cryptocurrencies during the COVID-19 crisis and, in particular, during the bearish phase of 2020. The study revealed that during the COVID-19 crisis, PAX Gold’s volatility increased. Ref. [86] through a bivariate Dynamic Conditional Correlation Generalized Autoregressive Conditional Heteroskedasticity, revealed that gold, US, UK, and German sovereign bonds are secure investments while covering correlation within the major asset classes between the Global Financial Crisis (GFC) and COVID-19’s 100 days. Through a sequential tracking technique, [87] reveal that the role of a safe haven diminished for the majority of the assets assessed, while gold futures endured being robust safe haven assets during the pandemic.
In line, [14] reveal that COVID-19 is an economic crisis. Through wavelet, [88] investigate the time–frequency connection between the number of confirmed COVID-19 cases and selected variables among the 15 economies afflicted the most by the COVID-19 situation. The study reveals that average daily temperature has a noteworthy bearing on the spread of the purported disease.
Our thesis states that the COVID-19 epidemic hurts stock markets and the financial system by cutting returns. Our proposition is supported by the lines of related research conducted on the link between financial markets and severe calamities [89,90] These theoretical links imply that severe events, such as COVID-19, result in a negative reaction in stock prices and related financial variables. This has hindered stock indexes worldwide and has severe spillover effects with the foreign exchange markets [91,92]. Worsened swings in stock market and other related financial variables were caused by concerns over the shocking news of patient infections and fatalities, particularly those leading from the topmost affected economies by COVID-19 cases and deaths [14].
By demonstrating the connection between COVID-19 cases (infections and fatalities) and financial variables, we set the stage for authorities to install appropriate regulations to combat other related outbreaks ahead. Furthermore, in contrast to previous studies, this one takes a much more robust approach by assessing a larger number of countries (the top 10 most infected economies) instead of concentrating on only one. We have not been able to find any investigations that have appeared at the impact of COVID-19 on multiple implied volatilities. Therefore, gaining a better grasp of multiple implied volatilities shall assist us in comprehending the stock and financial markets and give us a clearer perspective of the top 10 most infected economies as a whole.
In summary, the extant literature discloses the paucity of studies covering multiple asset classes in tandem with the global uncertainty variables. The current paper attempts to lessen this research gap by investigating the impact of COVID-19 on stock and exchange rates in the top 10 most affected economies, and further, the impact of the purported pandemic on commodity assets (oil and gold) and global uncertainty variables.

3. Data and Methodology

3.1. Estimation Technique (Wavelet Coherence)

This study has used the wavelet coherence technique, which enables us to study the co-movement between COVID-19 cases/death and global variables, i.e., VIX, WTI, OVX, EVZ, GVZ, SMI, ER, and USEPU through the time–frequency space. One of the main advantages of wavelet methods is that they can present output without splitting the data into different sample periods. Similarly, we can examine correlation patterns between financial data during different regimes using this technique. Wavelet coherence also allows for a three-dimensional analysis by simultaneously considering the time and frequency components and the strength/weakness of the correlation between the time series components. On the other hand, standard time series econometric approaches evaluate the time and frequency components separately [93,94]. In summary, the wavelet coherence approach has four major advantages: (1) measuring the dynamic relationship between variables instead of suggesting a static relation [95]; (2) identifying structural breaks when there is a complete breakdown in correlation or a shift in the specific frequency band; (3) determining the causality relationship at various frequencies; and (4) according to [96], other estimation techniques require parameters while the wavelet model is free from following such rules. Ref. [94] explained Wavelet coherence as follows:
R n 2 s = | s ( s 1 W n X Y s | 2 s ( s 1 W n X s | 2 · S ( s 1 W n Y s | 2
where S is used for something in the series. Otherwise, all times and scales would be identical to one. Conversion in scale and time would be employed to obtain smoothness.
S W = S s c a l e S t i m e W n s
where S t i m e and S s c a l e show time and scale smoothness in wavelet correspondingly. Taking into consideration the nature of our variables and data, [97] smoothing operator, i.e., Morlet Wavelet, is employed:
S t i m e   W | s = ( W n s   c 1 t 2 2 s 2   ) | s ; S t i m e   W ) | s = ( W n s c 2 π ( 0.6   s ) | n
where normalization contents are C1 and C2, and rectangle functions are represented by π . Similarly, 0.6 factor is considered for scale decorrelation length of the Morlet wavelet following [98].   0 R n 2 s 1 is the range of Wavelet coherence two-time, which demonstrates at each scale two time series linear association.   W n X Y s represents cross wavelet power and shows a region time scale where time series demonstrate high common power and can be deliberated for local covariance between two series at each scale. Thus, the two series y(t) and x(t) i.e., cross wavelet power, is explained as:
W n X Y s = W n X s W n Y s
The above equation W n X s and W n Y show two continuous wavelets transform series correspondently where the * represents a complex conjugate.
Lead–lag association can be depicted by the wavelet coherence of different phases where the phase of wavelet coherence can be explained as:
n X Y s = t a n 1 ( I { S ( s 1 W n X Y s ) } R { S ( s 1 W n X Y s ) } )
The wavelet coherence is used to locate regions in time–frequency space where two-time series co-vary. Warmer colors (red) indicate regions with many interrelations, while colder colors (blue) indicate less interrelation, i.e., less dependence between two series. Outside the significant areas, cold regions reflect time and frequencies without dependency on the sequence. As a result, the frequency and time intervals at which macro-economic variables and COVID-19 shift in parallel can be assessed. Since a continuous wavelet transformation uses information from neighboring data sets at any given point, areas at the start and finish of the time interval should be viewed cautiously. As a result, only scales up to 256 days are used. An arrow in the wavelet coherence plot represents the lead/lag phase relationships between the examined series. On a given scale, a zero-phase difference implies that the two-time series move in sync. When the time series are in phase (anti-phase), the arrows point to the right (left). While two series are in phase, they are going in the same direction, while when they are in anti-phase, they are moving in the opposite direction. COVID-19 leads to macroeconomic variables with arrows pointing right down or left up, while macroeconomic variables lead with arrows pointing right up or left down.

3.2. Justification of Using Wavelet Coherence Approach

In this study, we have used the Wavelet coherence model to analyze the relationships among financial assets, global uncertainty, commodity prices, and stock markets as well as COVID-19. The same approach i.e., Wavelet Coherence, is utilized by several studies such as [61,72,99] to investigate stock markets and COVID-19 association. The COVID-19 pandemic has had a profound impact on the global economy and has caused significant changes in these variables. Using the wavelet coherence model to examine the relationships between these variables can provide insights into the impact of the pandemic on the global economy and the financial markets of the top ten countries affected by COVID-19. Wavelet coherence allows for identifying correlations between time series data at different scales and frequencies, providing a more complete understanding of the relationships between variables than traditional linear methods. This is particularly useful when studying the impact of a rapidly evolving event such as the COVID-19 pandemic, where correlations and relationships can change over time. The wavelet coherence model can also account for non-stationary data, which is common in financial and economic data, providing a more accurate representation of the relationships between variables. By analyzing the wavelet coherence between financial assets, global uncertainty, commodity prices, and stock markets of the top ten corona-affected countries, researchers can gain insights into the impact of the pandemic on the global economy and financial markets. The analysis can help to determine which financial assets are most strongly correlated with the spread of the virus, the impact of global uncertainty on commodity prices, and the relationships between stock market performance and the pandemic.

3.3. Data

The selection of the period is reasonable by our research objective and maintained by the obtainability of the data. The data employed in the purported study encompasses daily observations of COVID-19 (measured as a number of the infected cases and deaths of a novel COVID-19 in the 10 most affected economies). The study covers spot prices of multiple assets, namely, two asset classes (stock market indices and exchange rates against the US dollar) from the 10 most affected economies by COVID-19, in tandem with global assets classes (gold and oil) and global uncertainty variables (VIX, OVX, EVZ, GVZ, USEPU). We investigate the impact of COVID-19 confirmed cases and deaths of 10 most-affected economies on the purported variables covering the country traits and global international factors listed below in Table 1. The data for the assets and global uncertainty variables are extracted from the Bloomberg terminal. COVID-19 reported cases and deaths are obtained from Thomson Reuters.
We utilize the daily price of WTI, a standard price in the worldwide oil market, and consider a yardstick price, demonstrating the real-world oil market for the crude oil market.
The data period was carefully chosen to confirm a balanced panel data frame across the cross-section of the economies. We have daily data spanning from 1 January 2020 to 26 February 2021, which gives a total of 2840 observations.
The above Table 2 presents information on the descriptive and distribution properties of the selected variables series or their transformed values in sync with the regular practice in the empirical study. These descriptive statistics proffer central insights that highlight the advance in the analysis part. The SD of COVID-19 deaths and cases are high, representing large variation compared to other variables, while VIX, WTI, OVX, EVZ, and GVZ ER are the least volatile. Large kurtosis values (Kurt) show that the COVID-19 death and cases distributions have fat tails. All the variables, except Gold and WTI, are positively skewed, indicating a high probability of a positive response.

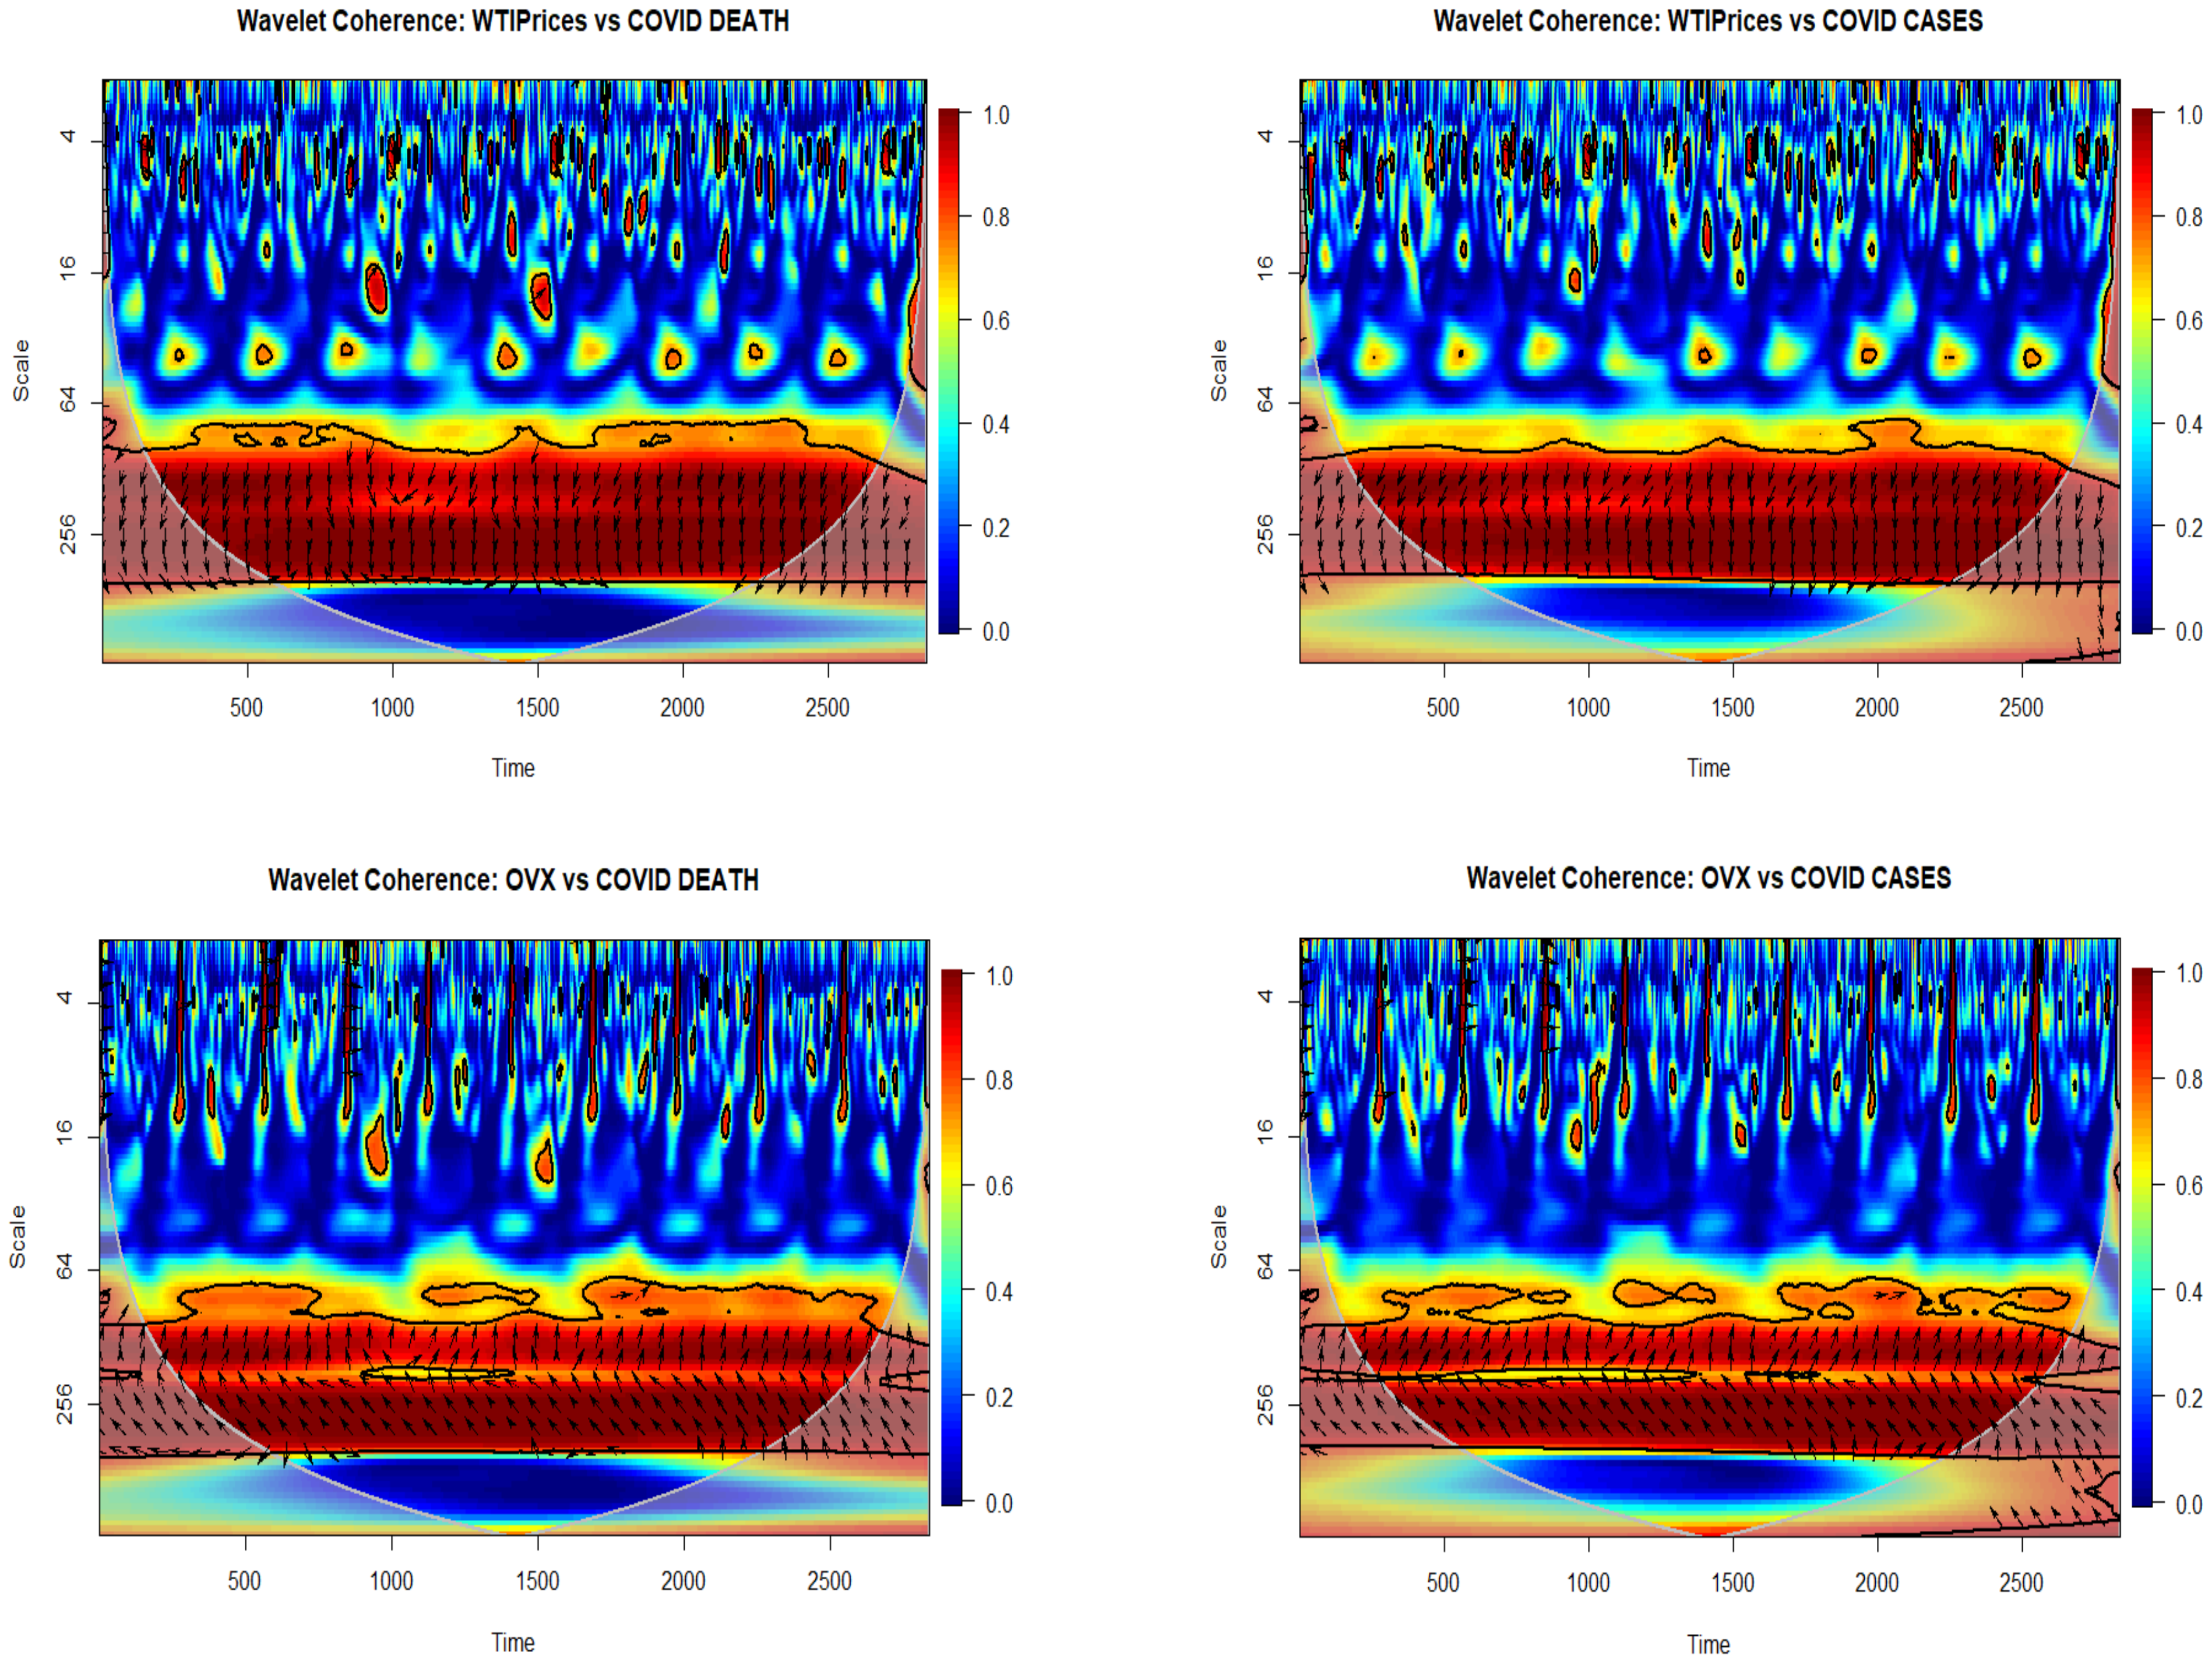
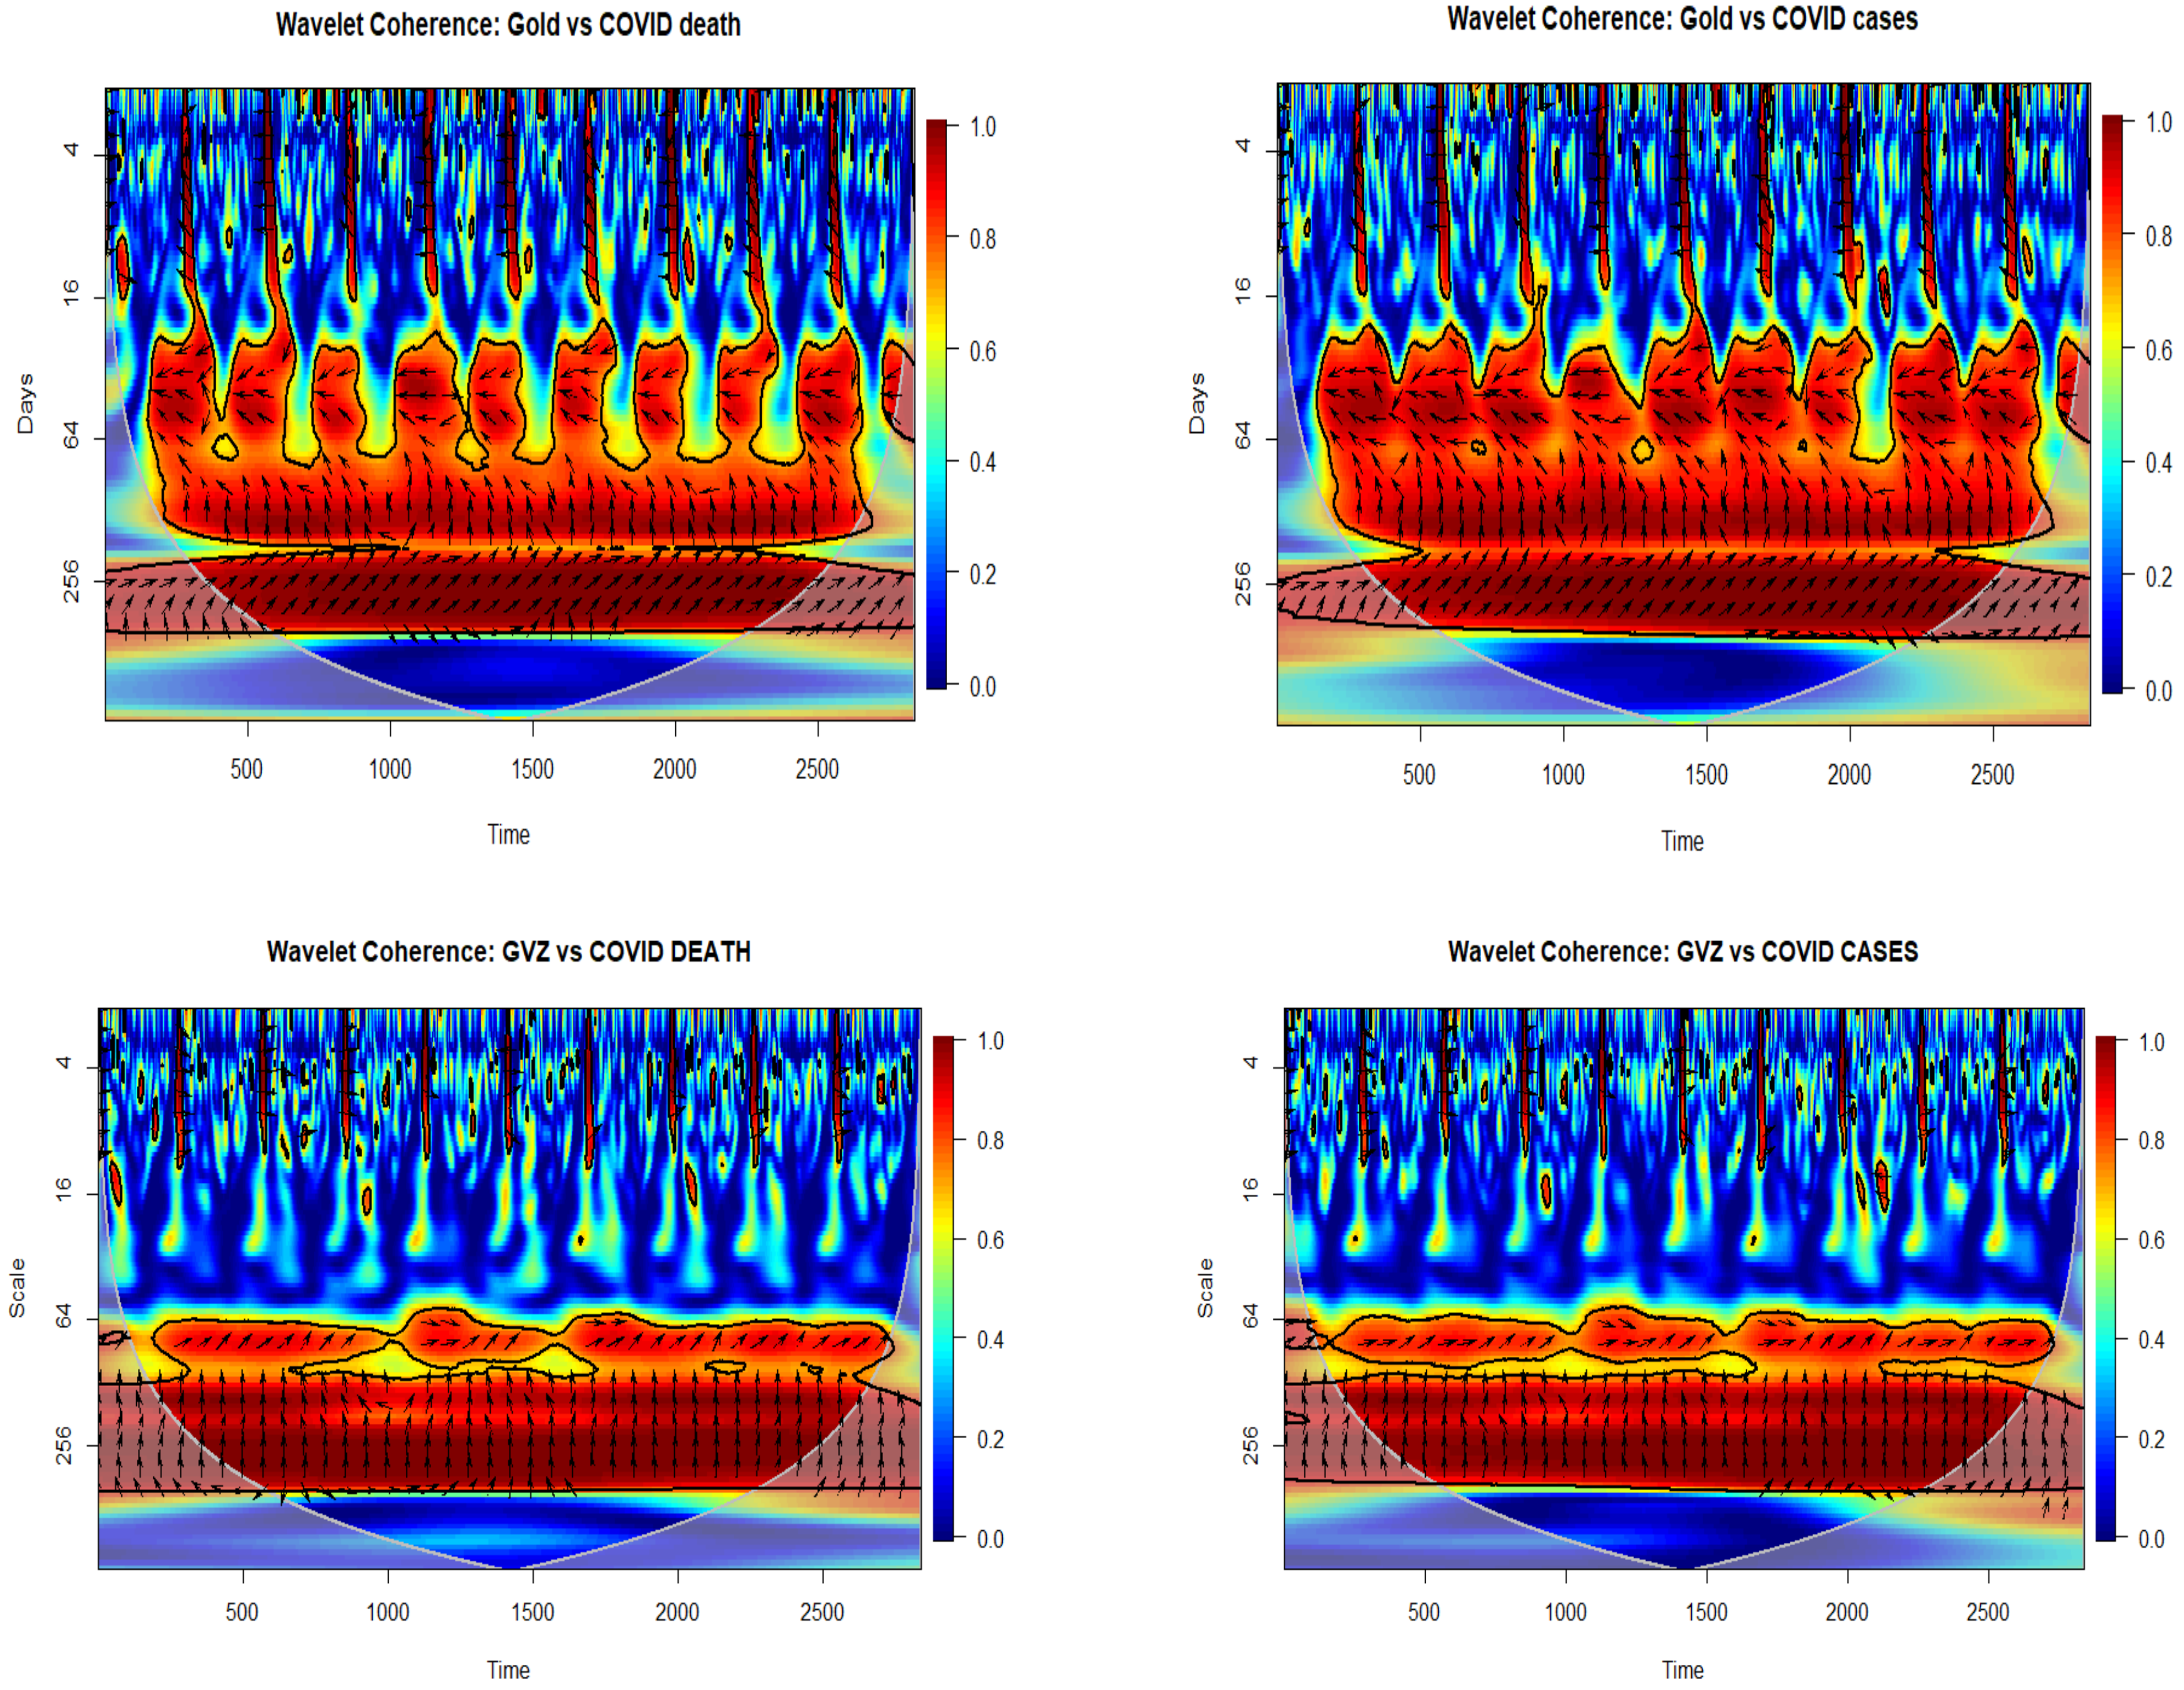
4. Results and Discussion

To assess the coherence between economic variables and novel COVID-19 deaths and cases, we use the wavelet coherence technique discussed in Section 3. The vertical days’ scale is segregated into short term (4–16), medium term (16–64), and long term (64–256). The dark blue and infrequent red spots in the time–frequency domain suggest a low coherence among the pairs of variables over the sample period of this study. At the same time, the dark red zone represents strong dependence between the variables. Similarly, the arrows represent the nature of the co-movement of the two-time series. When arrows are moving towards the right (left), this indicates that two variables have positive (negative) correlations. If the arrow’s direction is towards the right, up (down) indicates that the second variable is leading (lagging), and if the arrow’s direction is towards the left, up (down) indicates that the first variable is leading (lagging). When arrows are upward (downward) with 90°, the second (first) variable is leading with 90° dominance.
In Figure 1, we have found a weak coherence between US economic policy uncertainty and COVID-19 deaths and cases in the near to medium term. However, on the long horizon, there is a strong coherence between US economic policy uncertainty and COVID-19 deaths and cases. COVID-19 deaths and cases initially lead to strong positive correlation, which indicates that it is anticipated to have a negative long-term impact on the economic uncertainties in the US as the time approaches 256 days’ scale in the time–frequency domain. The economic policy uncertainty is primarily related to the US external and internal economic environment, such as exchange rate, oil prices, industrial outcome, and stock markets that react to the uncertainty and rise of bad news of COVID-19. These results are consistent with the findings of [19,50,56,100] that reported the consequence of COVID-19-related information spillover on the EPU and its further impact on the sectoral returns and volatilities. Similarly, in the past, the subprime mortgage crisis in the United States in 2007 started the global financial crisis, and its destruction and effects caused the global economy to keep contracting. In a similar vein, [59] have also witnessed an enormous impact of economic indicators on the overall uncertainty in the US and UK during COVID-19. Global extreme events effects economies differently and enhance the uncertainty of economic policies.
Moreover, pandemic has caused a shift in the global financial market. For the exchange rate, a short-term coherence does exist between ER and COVID-19, which is initially positive and led by COVID-19 deaths and cases from 0–500 days on the timeline and then responded with irreconcilable co-movement by ER from 500–1000 days on the horizontal axis. Consistent with these results, [88] also report that a strong connectedness at a lower scale indicates a significant impact of COVID-19 cases on the exchange rate return and stock market returns. Similarly, there is a positive but insignificant coherence between EVZ and COVID-19 deaths and cases in the short and medium term. The reason behind weak short run coherence can explained through determinants of exchange rate volatility, which is demand and supply of foreign assets, which does not react immediately in crises situations. Moreover, fear of losing financial reserves has also taken part in stability of exchange rate volatility. Ref. [101] found informal economy is harmful to economic stability. Similarly, [102] investigated the inverse association between bank stability and bank profitability.
However, in the long term, i.e., 64–256 days’ scale, there is a strong positive coherence between EVZ and COVID-19 deaths and cases, which is mainly led by COVID-19 deaths and cases. This lead–lag relationship implies the market strength and suggestive causal interaction in the time–frequency which is also consistent with [65], who find that COVID-19 cases increase the exchange rate volatility.
Ref. [103] has also identified that the shockwave impact of COVID-19 is eight-times bigger than the global financial crisis of 2007–2008 on the currency market. The pandemic not only affected the health of the people but also impacted the economies, resulting in reduced expectations and deteriorating financial markets. Figure 2 includes the class of variables representing the global uncertainty in the equity capital markets. The results of wavelet coherence between VIX and the COVID-19 pandemic do not exhibit a persistent and significant correlation between these two variables in the short run (lower scale). However, on the long horizon, a significant coherence exists, primarily led by COVID-19 deaths and cases. Still, the divergence occurs quickly as the stock market reacts to the COVID-19 information spillover. The VIX is usually used as a measure of global investors’ sentiment; thus, the VIX’s reciprocate reaction certifies investors’ reaction in the long horizon when they have enough time to readjust their investment portfolios.
For the country-specific stock markets, we have deliberately considered the stock market indices at a level instead of volatility to check the domestic equity capital market reaction to the COVID-19 pandemic. The results of wavelet coherence are found to be significantly different from the former ones [14,104]. The results exhibit frequent switching of lead–lag relationship between SMI and COVID-19 deaths and cases over the short- and medium-term sample period. This co-movement is significant and positive and led by COVID-19 deaths and cases, and then it is quickly responded to the opposite reaction of domestic stock markets. The stock markets seem to react to bad news coming from Wuhan, then the sudden increase in infected patients and death has created an alarming situation in a very short period. However, in the long run, there is no coherence between SMI and COVID-19 deaths and cases. These results align with [45], who also report that local COVID-19 cases lead the stock market only in the short and medium term, not in the long run for ASEAN-5. However, our results contradict the empirical findings of [88] who found the COVID-19 cases had a long-term impact on stock markets because the investors were expecting longer worldwide lockdowns. The inconsistent reaction of global and domestic stock markets to COVID-19 deaths and cases implies that domestic investors respond spontaneously to the COVID-19 deaths and cases. In contrast, global investors react more to the heterogeneous information regarding COVID-19 deaths and cases worldwide. In addition, when the COVID-19-related information spillover was transmitted, global investors’ sentiments started building up, which signified global uncertainty in the stock market. Consequently, the VIX hits back strongly in the medium and long horizon in the time–frequency domain.
Global policy uncertainty is also represented through global commodity prices and uncertainties. The results of wavelet coherence between global commodity prices/uncertainties and COVID-19 deaths and cases are presented in Figure 3. Concerning WTI oil prices, a weak co-movement has been observed between WTI and COVID-19 deaths and cases in the short term (lower scale). However, in the long term, a significant negative reaction is shown by the oil prices. These results are consistent with [105]. Moreover, WTI oil prices got dropped by more than 80% within 3–4 months since the start of the COVID-19 outbreak and hit the lowest level in the oil market history. Over the past two decades, the price of crude oil has significantly declined on the worldwide market, particularly during the 2007–2008 financial crises and COVID-19. These results align with [106,107], who have also reported a significant drop in oil prices due to the COVID-19 pandemic. Apart from COVID-19 crises, a major oil-exporting country, Saudi Arabia, announced the price discount which subsequently melted down the crude oil market and resulted in higher volatility during that period.
Similarly, concerning oil price volatility, low coherence between OVX and COVID-19 deaths and cases has been observed in the near to medium term. In the long run, a strong red zone and right up arrows represent a significant positive coherence between OVX and COVID-19 deaths and cases. These results are quite parallel to the wavelet coherence between VIX and COVID-19. In this case, COVID-19 deaths and cases are leading OVX in the long run; however, it reciprocates as time progresses. These time-inconsistent results of the lead–lag relationship of COVID-19 with VIX and OVX align with [14]. This implies that like VIX, the volatility of oil prices also gives a stern reaction to COVID-19. As the number of deaths and reported cases toll high, the uncertainty in the oil market also increases. Refs. [41,73] have reported similar results related to pandemic disease and global oil market volatility. On the other hand, after the OPEC+ output agreement collapsed and the COVID-19 epidemic occurred, the crude oil market became a victim of double shock and evolved into a net shock transmitter over time. Consequently, it is incontestable that the rare confluence of rising supply and falling demand in the oil market faced a complicated situation.
In the case of the gold price, a negative and insignificant coherence has been observed between gold price and COVID-19 deaths and cases at a lower scale. This negative relationship becomes significant in the medium term, yet the gold price leads it. However, this nexus becomes positive in the long horizon, strongly led by COVID-19 deaths and cases. This suggests that the immediate reaction of gold prices to COVID-19 was negative, but it did not persist for long because of the safe investment property of gold. Unlike gold price, there is a positive yet weak coherence between GVZ and COVID-19 deaths and cases in the short and medium term, while on the long term, like gold price, a strong positive coherence led by COVID-19 deaths and cases has been observed. However, as time passes, the commodity market adjusts to COVID-19 information and starts behaving like normal. This suggests that gold is a safer investment option for investors and fund managers. Being considered the safe haven for investors, they can diversify their portfolio risk by adding gold to their basket of assets. Ref. [86] have also witnessed increased volatility of gold during COVID-19. However, many studies have considered gold a hedging tool and a safe haven for investors during the time of high economic uncertainty [83,84].
The spillover effects of global uncertainty variables and COVID-19 ranges from low to high contagion effects. The above results depict an unusual response by the stock market and an exceptional rise in economic policy uncertainty. While the oil price volatility shocks can be explained due to travel restrictions around the world, as most of the economic and industrial activities are closely responsive to crude oil prices, OPEC can help in suppressing this risk. From as asset management perspective, investors are redistributing the assets in their portfolios in the short term based on their risk assessments and personal impressions of the impending bad news from the Coronavirus outbreak which caused high volatility in equity markets.

Highlights of the Novelty of Analysis

The following are some of the highlights of the novelty of our analysis.
  • This study is novel in the sense that COVID-19 has had a significant impact on the global economy, leading to an unprecedented level of uncertainty and volatility in financial markets, especially the 10 most impacted countries.
  • The pandemic has affected commodity prices and stock markets differently, highlighting the need for a comprehensive analysis of the relationship between COVID-19 and financial assets.
  • Focusing on the top ten corona-affected countries provides valuable insight into the impact of COVID-19 on the world’s largest economies and how they are coping with the pandemic’s economic fallout.
  • This analysis can also provide a useful reference for policymakers, investors, and business leaders to understand the ongoing effects of COVID-19 on the global economy and financial markets.
  • The study of the relationship between COVID-19 and financial assets can also help identify patterns and trends that can inform future policy decisions and risk management strategies.
  • The integration of multiple variables, such as global uncertainty, commodity prices, and stock markets, provides a comprehensive and holistic understanding of the impact of COVID-19 on the global economy.
  • The novelty of this analysis lies in its focus on the latest developments and the most recent data, ensuring that the findings are up-to-date and relevant in the current context.

5. Conclusions and Policy Implications

This study investigates the impact of COVID-19 on the prime financial assets of the top ten affected economies. It employed the wavelet coherence technique, which allows us to assess the co-movement between COVID-19 cases/deaths and dominant financial asset classes (WTI, GVZ, SMI, ER) as well as the global uncertainty indicators (VIX, OVX, EVZ, USEPU) throughout the time–frequency space.
This study finds a weak coherence between COVID-19 and global uncertainty variables (USEPU, VIX, OVX, GVZ,) in the short and medium term. However, a strong positive correlation has been witnessed in the long run for these variables, which is initially led by COVID-19 deaths and cases. Then, it reciprocates the nature of co-movement as the time approaches 256 days scale in the time–frequency domain. This implies that such a pandemic increases global uncertainty, making global investors and fund managers more vulnerable in their investment settings.
On the other hand, investors are considerably safer in the long run because it is evident that local COVID-19 cases lead the stock market only in the short and medium term, not in the long run, which means that investors holding securities enjoyed consistent returns. In addition, the real asset market, such as gold, remains more stable during the COVID-19 outbreak, being a safe haven and investment alternative for the investors. In the time–frequency analysis of the COVID-19 pandemic and gold price, the study finds that as the time approaches 256 days scale on the vertical axis, the gold market gets adjusted to COVID-19 information and starts behaving like normal. Thus, it is recommended that the investors and portfolio managers add such assets to their investment options to safeguard their excessive risk in inescapable situations. A strong connectedness between COVID-19 deaths and cases and ER at a lower scale has been observed, indicating a noteworthy impact of the COVID-19 outbreak on the exchange rate returns. In similar vein, the oil price also got affected by COVID-19, which can be explained due to imposed travel restrictions and fall of demand in the international market.
The findings highlight that COVID-19 has clearly caused disruption, an unusual change in economic policies, and unprecedented stock market response. Thus, endangering investors’ portfolios and lessening diversification gains.
Our findings offer implications for both practitioners and policymakers. Our endeavor has unequivocal policy implications. Our results inform policymakers in covering prime developed and emerging economies regarding minimizing risk through structuring suitable risk-sharing devices and shaping robust regulatory and informational milieu. This finding shall assist investors and portfolio managers in better appreciating the behavior of various asset prices in ensuing crisis phases. It underlines that COVID-19-related restrictions hurt the financial assets markets. Our findings urge policymakers to participate in public information initiatives, which are critical for the assets market. Practitioners are left with apprehensions over portfolio diversification and asset allocation changes. As a result, our study shed light on these questions. To recover the efficiency of their overall adjusted risks, investors must include assets with relative stability, such as gold, in their investment portfolios. Following the likelihood of commodity assets (oil and gold) as appropriate assets for hedging and safe haven purposes, there is a replacement opportunity for the principal financial asset classes (stocks and foreign exchanges).

Author Contributions

M.Z.R., Conceptualization, methodology, writing original draft validation, supervision, data curation; S.K. Conceptualization, methodology, writing original draft validation, supervision, data curation; G.A., Conceptualization, methodology, writing original draft validation, supervision; M.A., Conceptualization, methodology, writing original draft validation, supervision, resources. All authors have read and agreed to the published version of the manuscript.

Funding

This research received no external funding.

Institutional Review Board Statement

Not applicable.

Informed Consent Statement

Not applicable.

Data Availability Statement

Not applicable.

Conflicts of Interest

The authors declare no conflict of interest.

References

  1. Abbas, S.; Rehman, F.U.; Khan, S.; Rehman, M.Z.; Alonazi, W.B.; Noman, A.A. Crowding-Out Effect of Natural Resources on Domestic Investment: The Importance of Information Communication and Technology (ICT) and Control of Corruption in the Middle East and Central Asia. Sustainability 2022, 14, 13392. [Google Scholar] [CrossRef]
  2. Aggarwal, S.; Nawn, S.; Dugar, A. What caused global stock market meltdown during the COVID pandemic–Lockdown stringency or investor panic? Financ. Res. Lett. 2021, 38, 101827. [Google Scholar] [CrossRef] [PubMed]
  3. Aguiar-Conraria, L.; Soares, M.J. Oil and the macroeconomy: Using wavelets to analyze old issues. Empir. Econ. 2011, 40, 645–655. [Google Scholar] [CrossRef]
  4. Akhtaruzzaman, M.; Boubaker, S.; Sensoy, A. Financial contagion during COVID-19 crisis. Financ. Res. Lett. 2021, 38, 101604. [Google Scholar] [CrossRef]
  5. Akhtaruzzaman, M.; Boubaker, S.; Chiah, M.; Zhong, A. COVID-19 and oil price risk exposure. Financ. Res. Lett. 2020, 42, 101882. [Google Scholar] [CrossRef]
  6. Ali, M.; Khattak, M.A.; Khan, S.; Khan, N. COVID-19 and the ASEAN stock market: A wavelet analysis of conventional and Islamic equity indices. Stud. Econ. Financ. 2022, ahead-of-print. [Google Scholar] [CrossRef]
  7. Ali, M.; Alam, N.; Rizvi, S.A.R. Coronavirus (COVID-19)—An epidemic or pandemic for financial markets. J. Behav. Exp. Financ. 2020, 27, 100341. [Google Scholar] [CrossRef]
  8. Altig, D.; Baker, S.; Barrero, J.M.; Bloom, N.; Bunn, P.; Chen, S.; Davis, S.J.; Leather, J.; Meyer, B.; Mihaylov, E.; et al. Economic uncertainty before and during the COVID-19 pandemic. J. Public Econ. 2020, 191, 104274. [Google Scholar] [CrossRef]
  9. Ben Amar, A.; Belaid, F.; Ben Youssef, A.; Chiao, B.; Guesmi, K. The unprecedented reaction of equity and commodity markets to COVID-19. Financ. Res. Lett. 2021, 38, 101853. [Google Scholar] [CrossRef]
  10. Ashraf, B.N. Stock markets’ reaction to COVID-19: Cases or fatalities? Res. Int. Bus. Financ. 2020, 54, 101249. [Google Scholar] [CrossRef]
  11. Aslam, F.; Aziz, S.; Nguyen, D.K.; Mughal, K.S.; Khan, M. On the efficiency of foreign exchange markets in times of the COVID-19 pandemic. Technol. Forecast. Soc. Change 2020, 161, 120261. [Google Scholar] [CrossRef]
  12. Aslam, F.; Mohmand, Y.T.; Ferreira, P.; Memon, B.A.; Khan, M.; Khan, M. Network analysis of global stock markets at the beginning of the coronavirus disease (COVID-19) outbreak. Borsa Istanb. Rev. 2020, 20, S49–S61. [Google Scholar] [CrossRef]
  13. Atkeson, A. What Will Be the Economic Impact of COVID-19 in the US? Rough Estimates of Disease Scenarios; No. w26867; National Bureau of Economic Research: Cambridge, MA, USA, 2020. [Google Scholar] [CrossRef]
  14. Aye, G.C.; Carcel, H.; Gil-Alana, L.A.; Gupta, R. Does gold act as a hedge against inflation in the UK? Evidence from a fractional cointegration approach over 1257 to 2016. Resour. Policy 2017, 54, 53–57. [Google Scholar] [CrossRef]
  15. Baek, S.; Mohanty, S.K.; Glambosky, M. COVID-19 and stock market volatility: An industry level analysis. Financ. Res. Lett. 2020, 37, 101748. [Google Scholar] [CrossRef]
  16. Bai, Y. Cross-border sentiment: An empirical analysis on EU stock markets. Appl. Financ. Econ. 2014, 24, 259–290. [Google Scholar] [CrossRef]
  17. Baig, A.S.; Butt, H.A.; Haroon, O.; Rizvi, S.A.R. Deaths, panic, lockdowns and US equity markets: The case of COVID-19 pandemic. Financ. Res. Lett. 2021, 38, 101701. [Google Scholar] [CrossRef] [PubMed]
  18. Baker, S.; Bloom, N.; Davis, S.; Terry, S. COVID-Induced Economic Uncertainty; No. w26983; National Bureau of Economic Research: Cambridge, MA, USA, 2020. [Google Scholar] [CrossRef]
  19. Baruník, J.; Kočenda, E.; Vácha, L. Gold, oil, and stocks: Dynamic correlations. Int. Rev. Econ. Financ. 2016, 42, 186–201. [Google Scholar] [CrossRef] [Green Version]
  20. Baur, D.G.; Lucey, B.M. Is Gold a Hedge or a Safe Haven? An Analysis of Stocks, Bonds and Gold. Financ. Rev. 2010, 45, 217–229. [Google Scholar] [CrossRef]
  21. Baur, D.G.; McDermott, T.K. Is gold a safe haven? International evidence. J. Bank. Financ. 2010, 34, 1886–1898. [Google Scholar] [CrossRef]
  22. Benedetto, F.; Mastroeni, L.; Quaresima, G.; Vellucci, P. Does OVX affect WTI and Brent oil spot variance? Evidence from an entropy analysis. Energy Econ. 2020, 89, 104815. [Google Scholar] [CrossRef]
  23. Bhutto, N.A.; Khan, S.; Khan, U.A.; Matlani, A. The impact of COVID-19 on conventional and Islamic stocks: Empirical evidence from Pakistan. J. Econ. Adm. Sci. 2022, ahead-of-print. [Google Scholar] [CrossRef]
  24. Bis.org. COVID-19 Statistical Resources. 2021. Available online: https://www.bis.org/ifc/COVID19.htm (accessed on 27 March 2021).
  25. Bodart, V.; Candelon, B. Evidence of interdependence and contagion using a frequency domain framework. Emerg. Mark. Rev. 2009, 10, 140–150. [Google Scholar] [CrossRef]
  26. Bouri, E.; Cepni, O.; Gabauer, D.; Gupta, R. Return connectedness across asset classes around the COVID-19 outbreak. Int. Rev. Financ. Anal. 2021, 73, 101646. [Google Scholar] [CrossRef]
  27. Bouri, E.; Demirer, R.; Gupta, R.; Pierdzioch, C. Infectious Diseases, Market Uncertainty and Oil Market Volatility. Energies 2020, 13, 4090. [Google Scholar] [CrossRef]
  28. Bouri, E.; Gupta, R.; Tiwari, A.K.; Roubaud, D. Does Bitcoin hedge global uncertainty? Evidence from wavelet-based quantile-in-quantile regressions. Financ. Res. Lett. 2017, 23, 87–95. [Google Scholar] [CrossRef] [Green Version]
  29. Chen, C.D.; Chen, C.C.; Tang, W.W.; Huang, B.Y. The positive and negative impacts of the SARS outbreak: A case of the Taiwan industries. J. Dev. Areas 2009, 43, 281–293. [Google Scholar] [CrossRef]
  30. Chen, M.-H.; Jang, S.S.; Kim, W.G. The impact of the SARS outbreak on Taiwanese hotel stock performance: An event-study approach. Int. J. Hosp. Manag. 2007, 26, 200–212. [Google Scholar] [CrossRef]
  31. Choi, S.Y. Industry volatility and economic uncertainty due to the COVID-19 pandemic: Evidence from wavelet coherence analysis. Financ. Res. Lett. 2020, 37, 101783. [Google Scholar] [CrossRef]
  32. Corbet, S.; Larkin, C.; Lucey, B. The contagion effects of the COVID-19 pandemic: Evidence from gold and cryptocurrencies. Financ. Res. Lett. 2020, 35, 101554. [Google Scholar] [CrossRef]
  33. Dahir, A.M.; Mahat, F.; Amin Noordin, B.A.; Hisyam Ab Razak, N. Dynamic connectedness between Bitcoin and equity market information across BRICS countries: Evidence from TVP-VAR connectedness approach. Int. J. Manag. Financ. 2020, 16, 357–371. [Google Scholar] [CrossRef]
  34. Danielsson, J.; Valenzuela, M.; Zer, I. Learning from history: Volatility and financial crises. Rev. Financ. Stud. 2018, 31, 2774–2805. [Google Scholar] [CrossRef] [Green Version]
  35. Del Giudice, A.; Paltrinieri, A. The impact of the Arab Spring and the Ebola outbreak on African equity mutual fund investor decisions. Res. Int. Bus. Financ. 2017, 41, 600–612. [Google Scholar] [CrossRef]
  36. Dutta, A.; Das, D.; Jana, R.K.; Vo, X.V. COVID-19 and oil market crash: Revisiting the safe haven property of gold and Bitcoin. Resour. Policy 2020, 69, 101816. [Google Scholar] [CrossRef] [PubMed]
  37. Economic Analysis; Policy Division|Dept of Economic; Social Affairs|United Nations. Global Economic Recovery Remains Precarious—The Projected Rebound of 4.7 Percent Will Barely Offset 2020 Losses. 2021. Available online: https://www.un.org/development/desa/dpad/publication/world-economic-situation-and-prospects-february-2021-briefing-no-146/ (accessed on 27 March 2021).
  38. Eichenbaum, M.S.; Rebelo, S.; Trabandt, M. The Macroeconomics of Epidemics; No. w26882; National Bureau of Economic Research: Cambridge, MA, USA, 2020. [Google Scholar]
  39. Farhi, E.; Gabaix, X. Rare disasters and exchange rates. Q. J. Econ. 2016, 131, 52. [Google Scholar] [CrossRef] [Green Version]
  40. Feng, G.-F.; Yang, H.-C.; Gong, Q.; Chang, C.-P. What is the exchange rate volatility response to COVID-19 and government interventions? Econ. Anal. Policy 2021, 69, 705–719. [Google Scholar] [CrossRef]
  41. Gil-Alana, L.A.; Monge, M. Crude Oil Prices and COVID-19: Persistence of the Shock. Energy Res. Lett. 2020, 1, 13200. [Google Scholar] [CrossRef]
  42. Grinsted, A.; Moore, J.C.; Jevrejeva, S. Application of the cross wavelet transformand wavelet coherence to geophysical time series. Nonlinear Process. Geophys. 2004, 11, 561–566. [Google Scholar] [CrossRef]
  43. Guan, L.; Zhang, W.-W.; Ahmad, F.; Naqvi, B. The volatility of natural resource prices and its impact on the economic growth for natural resource-dependent economies: A comparison of oil and gold dependent economies. Resour. Policy 2021, 72, 102125. [Google Scholar] [CrossRef]
  44. Gunay, S. Comparing COVID-19 with the GFC: A shockwave analysis of currency markets. Res. Int. Bus. Financ. 2021, 56, 101377. [Google Scholar] [CrossRef]
  45. Harjoto, M.A.; Rossi, F.; Lee, R.; Sergi, B.S. How do equity markets react to COVID-19? Evidence from emerging and developed countries. J. Econ. Bus. 2020, 115, 105966. [Google Scholar] [CrossRef]
  46. He, X.; Gokmenoglu, K.K.; Kirikkaleli, D.; Rizvi, S.K.A. Co-movement of foreign exchange rate returns and stock market returns in an emerging market: Evidence from the wavelet coherence approach. Int. J. Financ. Econ. 2021, 1–12. [Google Scholar] [CrossRef]
  47. Hkiri, B.; Hammoudeh, S.; Aloui, C.; Yarovaya, L. Are Islamic indexes a safe haven for investors? An analysis of total, directional and net volatility spillovers between conventional and Islamic indexes and importance of crisis periods. Pac.-Basin Financ. J. 2017, 43, 124–150. [Google Scholar] [CrossRef]
  48. 2020. Available online: https://www.npr.org/2020/03/08/813439501/saudi-arabia-stuns-world-with-massive-discount-in-oil-sold-to-asia-europe-and-u-.(n.d.) (accessed on 20 March 2021).
  49. 2021. Available online: https://www.imf.org/external/pubs/ft/ar/2020/eng/spotlight/COVID-19/ (accessed on 27 March 2021).
  50. Hung, N.T. Volatility spillovers and time-frequency correlations between Chinese and African stock markets. Reg. Stat. 2020, 10, 63–82. [Google Scholar] [CrossRef]
  51. Ichev, R.; Marinč, M. Stock prices and geographic proximity of information: Evidence from the Ebola outbreak. Int. Rev. Financ. Anal. 2018, 56, 153–166. [Google Scholar] [CrossRef]
  52. International Energy Agency. Global Energy Review 2020; OECD Publishing: Paris, France, 2020; Available online: https://www.iea.org/reports/global-energy-review-2020/global-energy-and-co2-emissions-in-2020 (accessed on 10 February 2020).
  53. Iyke, B.N.; Ho, S.-Y. Exchange rate exposure in the South African stock market before and during the COVID-19 pandemic. Financ. Res. Lett. 2021, 43, 102000. [Google Scholar] [CrossRef]
  54. Izzeldin, M.; Muradoğlu, Y.G.; Pappas, V.; Sivaprasad, S. The impact of COVID-19 on G7 stock markets volatility: Evidence from a ST-HAR model. Int. Rev. Financ. Anal. 2021, 74, 101671. [Google Scholar] [CrossRef]
  55. James, N.; Menzies, M. Association between COVID-19 cases and international equity indices. Phys. D Nonlinear Phenom. 2021, 417, 132809. [Google Scholar] [CrossRef]
  56. Ji, Q.; Zhang, D.; Zhao, Y. Searching for safe-haven assets during the COVID-19 pandemic. Int. Rev. Financ. Anal. 2020, 71, 101526. [Google Scholar] [CrossRef]
  57. Kamaludin, K.; Sundarasen, S.; Ibrahim, I. COVID-19, Dow Jones and equity market movement in ASEAN-5 countries: Evidence from wavelet analyses. Heliyon 2021, 7, e05851. [Google Scholar] [CrossRef]
  58. Kang, S.H.; Uddin, G.S.; Troster, V.; Yoon, S.-M. Directional spillover effects between ASEAN and world stock markets. J. Multinatl. Financ. Manag. 2019, 52, 100592. [Google Scholar] [CrossRef]
  59. Karim, S.; Khan, S.; Mirza, N.; Alawi, S.M.; Taghizadeh-Hesary, F. Climate finance in the wake of COVID-19: Connectedness of clean energy with conventional energy and regional stock markets. Clim. Chang. Econ. 2022, 13, 2240008. [Google Scholar] [CrossRef]
  60. Karamti, C.; Belhassine, O. COVID-19 pandemic waves and global financial markets: Evidence from wavelet coherence analysis. Financ. Res. Lett. 2022, 45, 102136. [Google Scholar] [CrossRef]
  61. Khalfaoui, R.; Solarin, S.A.; Al-Qadasi, A.; Ben Jabeur, S. Dynamic causality interplay from COVID-19 pandemic to oil price, stock market, and economic policy uncertainty: Evidence from oil-importing and oil-exporting countries. Ann. Oper. Res. 2022, 313, 105–143. [Google Scholar] [CrossRef]
  62. Khan, S.; Ullah, M.; Shahzad, M.R.; Khan, U.A.; Khan, U.; Eldin, S.M.; Alotaibi, A.M. Spillover Connectedness among Global Uncertainties and Sectorial Indices of Pakistan: Evidence from Quantile Connectedness Approach. Sustainability 2022, 14, 15908. [Google Scholar] [CrossRef]
  63. Khan, S.; Bhutto, N.A.; Khan, U.A.; Rehman, M.Z.; Alonazi, W.B.; Ludeen, A. Ṣukūk or Bond, Which Is More Sustainable during COVID-19? Global Evidence from the Wavelet Coherence Model. Sustainability 2022, 14, 10541. [Google Scholar] [CrossRef]
  64. Khan, S.; Aslan, H.; Khan, U.A.; Bhatti, M. Are Islamic and conventional banks decoupled? Empirical evidence from Turkey. Int. J. Emerg. Mark. 2022, ahead-of-print. [Google Scholar] [CrossRef]
  65. Kinateder, H.; Campbell, R.; Choudhury, T. Safe haven in GFC versus COVID-19: 100 turbulent days in the financial markets. Financ. Res. Lett. 2021, 43, 101951. [Google Scholar] [CrossRef]
  66. Kočenda, E.; Moravcová, M. Exchange rate comovements, hedging and volatility spillovers on new EU forex markets. J. Int. Financ. Mark. Inst. Money 2019, 58, 42–64. [Google Scholar] [CrossRef] [Green Version]
  67. Lai, Y.; Hu, Y. A study of systemic risk of global stock markets under COVID-19 based on complex financial networks. Phys. A Stat. Mech. Its Appl. 2021, 566, 125613. [Google Scholar] [CrossRef]
  68. Lee, C.C.; Lee, C.C.; Lien, D. Do country risk and financial uncertainty matter for energy commodity futures? J. Futur. Mark. 2019, 39, 366–383. [Google Scholar] [CrossRef]
  69. Li, S.; Lucey, B.M. Reassessing the role of precious metals as safe havens–What colour is your haven and why? J. Commod. Mark. 2017, 7, 1–14. [Google Scholar] [CrossRef]
  70. Lin, B.; Su, T. Does COVID-19 open a Pandora’s box of changing the connectedness in energy commodities? Res. Int. Bus. Financ. 2021, 56, 101360. [Google Scholar] [CrossRef] [PubMed]
  71. Liu, H.; Manzoor, A.; Wang, C.; Zhang, L.; Manzoor, Z. The COVID-19 outbreak and affected countries stock markets response. Int. J. Environ. Res. Public Health 2020, 17, 2800. [Google Scholar] [CrossRef] [Green Version]
  72. Ma, C.; Rogers, J.H.; Zhou, S. Global Economic and Financial Effects of 21st Century Pandemics and Epidemics. 2020. Available online: https://papers.ssrn.com/sol3/papers.cfm?abstract_id=3565646 (accessed on 8 October 2022).
  73. Ma, Y.R.; Ji, Q.; Pan, J. Oil financialization and volatility forecast: Evidence from multidimensional predictors. J. Forecast. 2019, 38, 564–581. [Google Scholar]
  74. Manela, A.; Moreira, A. News implied volatility and disaster concerns. J. Financ. Econ. 2017, 123, 137–162. [Google Scholar] [CrossRef]
  75. Mensi, W.; Sensoy, A.; Vo, X.V.; Kang, S.H. Impact of COVID-19 outbreak on asymmetric multifractality of gold and oil prices. Resour. Policy 2020, 69, 101829. [Google Scholar] [CrossRef]
  76. Narayan, P.K. Has COVID-19 Changed Exchange Rate Resistance to Shocks? Asian Econ. Lett. 2020, 1, 17389. [Google Scholar] [CrossRef]
  77. Iyke, B.N. The Disease Outbreak Channel of Exchange Rate Return Predictability: Evidence from COVID-19. Emerg. Mark. Financ. Trade 2020, 56, 2277–2297. [Google Scholar] [CrossRef]
  78. Noy, I.; Vu, T.B. The economics of natural disasters in a developing country: The case of Vietnam. J. Asian Econ. 2010, 21, 345–354. [Google Scholar] [CrossRef] [Green Version]
  79. Okorie, D.I.; Lin, B. Stock markets and the COVID-19 fractal contagion effects. Financ. Res. Lett. 2021, 38, 101640. [Google Scholar] [CrossRef]
  80. Papadamou, S.; Fassas, A.; Kenourgios, D.; Dimitriou, D. Direct and Indirect Effects of COVID-19 Pandemic on Implied Stock Market Volatility: Evidence from Panel Data Analysis; University Library of Munich: Munich, Germany, 2020. [Google Scholar]
  81. Reboredo, J.C. Is gold a hedge or safe haven against oil price movements? Resour. Policy 2013, 38, 130–137. [Google Scholar] [CrossRef]
  82. Reboredo, J.C.; Rivera-Castro, M.A. A wavelet decomposition approach to crude oil price and exchange rate dependence. Econ. Model. 2013, 32, 42–57. [Google Scholar] [CrossRef]
  83. Rehman, M.Z.; Khan, S.; Ali, M.; Rehman, F.U.; Alonazi, W.B.; Aljuaid, M. Advance Dynamic Panel Second-Generation Two-Step System Generalized Method of Movement Modeling: Applications in Economic Stability-Shadow Economy Nexus with a Special Case of Kingdom of Saudi Arabia. Mathematics 2022, 11, 85. [Google Scholar] [CrossRef]
  84. Salisu, A.A.; Adediran, I. Gold as a hedge against oil shocks: Evidence from new datasets for oil shocks. Resour. Policy 2020, 66, 101606. [Google Scholar] [CrossRef]
  85. Salisu, A.A.; Akanni, L.; Raheem, I. The COVID-19 global fear index and the predictability of commodity price returns. J. Behav. Exp. Financ. 2020, 27, 100383. [Google Scholar] [CrossRef]
  86. Salisu, A.A.; Raheem, I.D.; Vo, X.V. Assessing the safe haven property of the gold market during COVID-19 pandemic. Int. Rev. Financ. Anal. 2021, 74, 101666. [Google Scholar] [CrossRef]
  87. Salisu, A.A.; Sikiru, A.A.; Vo, X.V. Pandemics and the emerging stock markets. Borsa Istanb. Rev. 2020, 20, S40–S48. [Google Scholar] [CrossRef]
  88. Salisu, A.A.; Vo, X.V.; Lawal, A. Hedging oil price risk with gold during COVID-19 pandemic. Resour. Policy 2020, 70, 101897. [Google Scholar] [CrossRef] [PubMed]
  89. Sergi, B.S.; Harjoto, M.A.; Rossi, F.; Lee, R. Do stock markets love misery? Evidence from the COVID-19. Financ. Res. Lett. 2021, 42, 101923. [Google Scholar] [CrossRef]
  90. Shahzad, S.J.H.; Bouri, E.; Roubaud, D.; Kristoufek, L. Safe haven, hedge and diversification for G7 stock markets: Gold versus bitcoin. Econ. Model. 2020, 87, 212–224. [Google Scholar] [CrossRef]
  91. Shaikh, I. Impact of COVID-19 pandemic on the energy markets. Econ. Chang. Restruct. 2021, 55, 433–484. [Google Scholar] [CrossRef]
  92. Sharif, A.; Aloui, C.; Yarovaya, L. COVID-19 pandemic, oil prices, stock market, geopolitical risk and policy uncertainty nexus in the US economy: Fresh evidence from the wavelet-based approach. Int. Rev. Financ. Anal. 2020, 70, 101496. [Google Scholar] [CrossRef]
  93. Sharma, G.D.; Tiwari, A.K.; Talan, G.; Jain, M. Revisiting the sustainable versus conventional investment dilemma in COVID-19 times. Energy Policy 2021, 156, 112467. [Google Scholar] [CrossRef]
  94. Sharma, G.D.; Tiwari, A.K.; Jain, M.; Yadav, A.; Erkut, B. Unconditional and conditional analysis between COVID-19 cases, temperature, exchange rate and stock markets using wavelet coherence and wavelet partial coherence approaches. Heliyon 2021, 7, e06181. [Google Scholar] [CrossRef] [PubMed]
  95. Shehzad, K.; Xiaoxing, L.; Kazouz, H. COVID-19′s disasters are perilous than Global Financial Crisis: A rumor or fact? Financ. Res. Lett. 2020, 36, 101669. [Google Scholar] [CrossRef]
  96. Sui, L.; Sun, L. Spillover effects between exchange rates and stock prices: Evidence from BRICS around the recent global financial crisis. Res. Int. Bus. Financ. 2016, 36, 459–471. [Google Scholar] [CrossRef]
  97. Szczygielski, J.J.; Bwanya, P.R.; Charteris, A.; Brzeszczyński, J. The only certainty is uncertainty: An analysis of the impact of COVID-19 uncertainty on regional stock markets. Financ. Res. Lett. 2021, 43, 101945. [Google Scholar] [CrossRef] [PubMed]
  98. Torrence, C.; Compo, G.P. A practical guide to wavelet analysis. Bull. Am. Meteorol. Soc. 1998, 79, 61–78. [Google Scholar] [CrossRef]
  99. Torrence, C.; Webster, P.J. Interdecadal changes in the ENSO–monsoon system. J. Clim. 1999, 12, 2679–2690. [Google Scholar] [CrossRef]
  100. Uddin, M.; Chowdhury, A.; Anderson, K.; Chaudhuri, K. The effect of COVID–19 pandemic on global stock market volatility: Can economic strength help to manage the uncertainty? J. Bus. Res. 2021, 128, 31–44. [Google Scholar] [CrossRef]
  101. Vácha, L.; Barunik, J. Co-movement of energy commodities revisited: Evidence from wavelet coherence analysis. Energy Econ. 2012, 34, 241–247. [Google Scholar] [CrossRef] [Green Version]
  102. Wang, Y.; Wei, Y.; Wu, C. Analysis of the efficiency and multifractality of gold markets based on multifractal detrended fluctuation analysis. Phys. A Stat. Mech. Its Appl. 2011, 390, 817–827. [Google Scholar] [CrossRef]
  103. Wasiuzzaman, S.; Rahman, H.S.W.H.A. Performance of gold-backed cryptocurrencies during the COVID-19 crisis. Financ. Res. Lett. 2021, 43, 101958. [Google Scholar] [CrossRef] [PubMed]
  104. Wei, Z.; Luo, Y.; Huang, Z.; Guo, K. Spillover effects of RMB exchange rate among B&R countries: Before and during COVID-19 event. Financ. Res. Lett. 2020, 37, 101782. [Google Scholar] [CrossRef] [PubMed]
  105. World Health Organization. WHO Director-General’s Opening Remarks at the Media Briefing on COVID-19; WHO: Geneva, Switzerland, 2020. [Google Scholar]
  106. Youssef, M.; Mokni, K.; Ajmi, A.N. Dynamic connectedness between stock markets in the presence of the COVID-19 pandemic: Does economic policy uncertainty matter? Financ. Innov. 2021, 7, 13. [Google Scholar] [CrossRef] [PubMed]
  107. Zhang, D.; Hu, M.; Ji, Q. Financial markets under the global pandemic of COVID-19. Financ. Res. Lett. 2020, 36, 101528. [Google Scholar] [CrossRef]
Figure 1. This figure represented the wavelet coherence results of US-related economic policy uncertainty and COVID-19 deaths and reported cases (country-specific). In this class of variables, US POLICY represents the US economic policy uncertainty, EVZ represents the exchange rate volatility, and ER represents the country-specific exchange rate per US dollar. The dark colors (red) show regions with high coherence; the dark blue represents lower coherence. Beyond the significant area, i.e., light blue or yellow colors represents no coherence between pairs. In the time–frequency domain, the time (in days ranging from March 2020 to March 2021) is presented on the horizontal axis, and frequency/scale is represented on the vertical axis. The curvy light grey lines isolate the statistically significant area 5% significance level.
Sustainability 15 05556 g001aSustainability 15 05556 g001b
Figure 2. This figure represented the wavelet coherence results of stock market uncertainty and COVID-19 deaths and reported cases (country-specific). In this class of variables, VIX represents the level of risk/uncertainty in the stock market, and SMI represents the country-specific stock market index. The dark colors (red) show regions with high coherence, and the dark blue color represents lower coherence. Beyond the significant area, i.e., light blue or yellow colors represents no coherence between pairs. In the time–frequency domain, the time (in days ranging from March 2020 to March 2021) is presented on the horizontal axis, and frequency/scale is represented on the vertical axis. The curvy light grey lines isolate the statistically significant area 5% significance level.
Sustainability 15 05556 g002aSustainability 15 05556 g002b
Figure 3. This figure represented the wavelet coherence results of stock market uncertainty and COVID-19 deaths and reported cases (country-specific). In this class of variables, WTI Prices represent global oil prices, OVX represents oil price volatility, and GVZ represents gold price volatility. The dark colors (red) show regions with high coherence, and the dark blue color represents lower coherence. Beyond the significant areas, i.e., light blue or yellow colors represents no coherence between pairs. In the time–frequency domain, the time (in days ranging from March 2020 to March 2021) is presented on the horizontal axis, and frequency/scale is represented on the vertical axis. The curvy light grey lines isolate the statistically significant area 5% significance level.
Sustainability 15 05556 g003aSustainability 15 05556 g003b
Table 1. List of the top 10 most affected economies by COVID-19 Cases and COVID-19 Deaths.
Affected CountriesCOV CasesCOV Deaths
1.United States25,885,662434,934
2.India10,767,208154,522
3.Brazil9,229,322225,099
4.Russia3,868,087179,046
5.United Kingdom3,835,783106,564
6.France3,201,46176,512
7.Spain2,822,80559,081
8.Italy2,560,95788,845
9.Turkey2,485,18226,117
10Germany2,224,89857,454
https://www.worldometers.info/coronavirus/, accessed on 10 December 2022. Note: The numbers of confirmed cases and death cases are as on 1 February 2021.
Table 2. Descriptive Statistics.
STATSNMeanSDMinMaxSkewnessKurtosis
COVDTH284053,720.4674,986.540.00499,209.002.5711.54
COVCAS28402,032,767.003,896,737.000.0027,900,000.003.7220.10
VIX284028.5011.7212.1082.691.937.87
WTI284041.5312.06−37.6363.57−1.288.76
OVX284060.9042.6727.66325.152.5410.32
EVZ28407.642.154.1319.312.0210.34
GVZ284021.256.0110.9148.981.246.20
SMI284019,770.4629,366.911014.10125,076.602.236.91
ER284016.0128.280.7180.931.543.41
USEPU2840269.95143.0222.25807.660.883.52
Gold26361780.09139.141471.242063.54−0.301.94
Disclaimer/Publisher’s Note: The statements, opinions and data contained in all publications are solely those of the individual author(s) and contributor(s) and not of MDPI and/or the editor(s). MDPI and/or the editor(s) disclaim responsibility for any injury to people or property resulting from any ideas, methods, instructions or products referred to in the content.

