Article

Green Spaces over a Roof or on the Ground, Does It Matter? The Perception of Ecosystem Services and Potential Restorative Effects

by
Cristina Matos Silva
1,*,
Fátima Bernardo
2,3,
Maria Manso
1,4 and
Isabel Loupa Ramos
3
1
CERIS, Instituto Superior Técnico, University of Lisbon, 1000-042 Lisbon, Portugal
2
Psychology Department, University of Évora, 7000 Évora, Portugal
3
CiTUA, Instituto Superior Técnico, University of Lisbon, 1000-042 Lisbon, Portugal
4
Department of Civil Engineering, Universidade Lusófona—Centro Universitário de Lisboa, 1749-024 Lisbon, Portugal
*
Author to whom correspondence should be addressed.
Sustainability 2023, 15(6), 5334; https://doi.org/10.3390/su15065334
Submission received: 27 January 2023 / Revised: 8 March 2023 / Accepted: 9 March 2023 / Published: 17 March 2023

Abstract

:
Cities are becoming more vulnerable to climate change and need appropriate adaptation measures. Previous studies demonstrated that urban green spaces provide multiple ecosystem services, improving the health and well-being of urban residents. Yet different urban green spaces provide different services—provisioning, regulating, cultural, or supporting ones. This work aims first to understand if urban green space users perceive the different supplies of provisioning and regulating services offered by different types of urban green spaces. Second, this work seeks to determine if green roof type conditions, as well as vegetation type and access, affect the users’ perceptions of the cultural ecosystem services. This work presents the results of an image-based online survey performed among 376 Portuguese undergraduate students between March and April 2021. The survey is based on nine alternative urban space designs, varying the roof access type and vegetation types. The results show a general preference for urban green spaces with more vegetation, regardless of the type of roof, and a general preference for green spaces with better accessibility. In addition, users’ preference for no-roof conditions appears to be linked to the abundance of vegetation and quality of urban design and not to awareness of an existing roof structure and its influence on the natural processes.

1. Introduction

Cities are major contributors to pollution, consumption, waste, and habitat loss, accelerating the loss of biodiversity around the world [1]. Dense urban areas usually have high overall soil sealing and lack of urban greening. In addition, biodiversity losses and soil sealing affect other ecosystem services as well as the quality of life of urban citizens, causing increased air temperatures and reduced water infiltration. Thus, cities are becoming more vulnerable to climate change and need appropriate adaptation measures. The Sustainable Development Goal 11 aims for cities and communities to become more sustainable, valuing the promotion of universal access to safe, inclusive, and accessible green and public spaces [2].
Previous research has explored strategies to link green spaces to promote biodiversity and ecosystem services [3]. As there are multiple classifications of ecosystem services, TEEB (2010) condenses them into four categories: provisioning, regulating, cultural, and supporting services.
Green spaces promote urban ecosystem services [4], namely to support biodiversity [5], ecological processes [6], or food production, e.g., urban farming [7]. At the same time, they help with climate adaptation [8] through their capacities to regulate urban temperature, improve air quality, reduce stormwater run-off, and mitigate other environmental risks [9].
Additionally, urban green spaces provide cultural ecosystem services [10], giving the opportunity to interact with nature while contributing to social cohesion and providing social, mental, and physical health [11,12] and well-being [13]. They help alleviate negative emotions and improve the users’ moods [14]. In addition, they offer greater restorative potential [10,12,13] compared to urban built spaces [15].
Different aspects contribute to cultural ecosystem provision. The qualitative features of urban green spaces have an impact on the promotion of users’ psychological well-being [16,17] and psychological stress recovery [18,19]. In fact, even small urban parks have restorative potential. Their components (e.g., benches), amount and types of vegetation [20], and presence of other people influence people’s preferences [21]. In addition, their access and use are also relevant. The active use of urban green spaces [22] influences citizens health and well-being more than their passive use [23]. The latest literature is acknowledging the importance of public [24] and private (e.g., green roofs) [25] urban green spaces for citizens health and well-being, namely after the restrictions on social interaction imposed during the COVID-19 pandemic [25].
Several studies present evidence on the potential ecosystem services provided by urban green spaces at the city level. For example, [26] created a methodology to quantify and map the ecosystem services of urban green spaces (e.g., lawn, short shrub, tall shrub, tree, and woodland) and applied it to the city of Rotterdam. [27] applied this ecosystem services quantification method by selecting alternative planting regimes to identify the residents’ ecosystem services priorities, showing a significant preference for supporting services. In summary, the ecosystem services assessment methods involve bio-physical models, geographical information systems (GIS), and valuation studies. Although few studies focus on the evaluation of multiple ecosystem services [28], a review on urban ecosystem services assessment demonstrates that almost 50% are regulating services, 20% are supporting services, 15% are cultural services, and 11% are provisioning services.
Users’ perception [29], preferences [30], and perceived benefits [31] are also analysed by different authors [32] among different urban green spaces. Few studies assess site specific trade-offs in the provision of ecosystem services in urban green spaces [33]. Research gaps were identified in the importance of understanding the stakeholders’ perceptions of the different ecosystem services provided by urban green spaces. In fact, this evaluation can be an important strategy to better design urban green spaces and identify potential directions for policy making.
Following [34], urban green spaces can be classified into 44 different categories, including different sizes and functions (e.g., street trees, street green, gardens, pocket parks, playgrounds, green roofs and green walls, large urban parks, community gardens, forests, and other natural areas). They include private and public urban land covered by vegetation of any kind. Recently, a review was developed to identify the functional linkages between urban green space types, ecosystem services, and human wellbeing [35]. In this study, urban green spaces are subdivided according to their level of naturalness, distinguishing natural green (less disturbed ecosystems), gardens, house green (walls and roofs), transportation green, and designed green (e.g., parks, ornamental green), showing that many studies focus on prominent green roofs and walls, as well as on the functional aspects of green roofs when greening different types of buildings (e.g., residential, administrative, or commercial). In fact, the United Nations recalls that urban citizens’ access to open public spaces is often limited, with 47% of the world’s population living within 400 m of an open public space. Thus, the integration of green roofs and green walls in buildings that allow the greening of grey spaces is crucial to increasing the green spaces of cities.
In summary, different urban green spaces provide different ecosystem services, depending significantly on their composition and configuration. Green roofs are urban green spaces built over a roof, on top of a building slab, and separate from the ground. Even though no specific research studies were identified on the differences between green roofs and other urban green spaces that are built directly in contact with the soil (e.g., gardens and parks), considering their ecosystem services delivery and provisioning. It is expected that characteristics of green roofs, such as substrate depth and vegetation types, influence the ecosystem services provided [36,37]. For example, extensive green roofs are limited in their substrate thickness, limiting their biodiversity provisioning and justifying their use for aesthetic enhancement. Intensive green roofs have a higher substrate thickness, allowing the installation of small trees and shrubs. Therefore, intensive green roofs have a higher potential to be used for recreational purposes while also contributing more to biodiversity and water retention. However, how are these differences in the provisioning of ecosystem services in urban green spaces perceived by their users? To better design green roofs and maximise their ecosystem services, it is important to understand the users’ perceptions of different ecosystem services, and which ones are more relevant to them.
The main research goals of this work are based on the differences of green spaces according to their type (elevated green roof, ground level green roof, and ground green space with no-roof), considering: (1) the identification of the perception of different ecosystem services—provision, regulation, and cultural; and (2) a more in-depth understanding of the perception of cultural ecosystem services, such as their restorative effects and recreational activities. Thus, the two questions we want to answer are whether there is a perception of the real limitations in the supply of provisioning and regulating services by different types of green roofs and whether the roof type affects the perception of cultural ecosystem services.

2. Materials and Methods

This study is supported by an image-based online survey performed among Portuguese undergraduate students. The online survey was performed using visual methodologies of photo elicitation as visual stimuli [38], evoking emotions and feelings, and encouraging reflection [39]. It presents different urban scenarios for the same location using digital imaging simulations.
A web survey was preferred to an on-site survey due to the current restrictions on social distancing. The advantage of using digital imaging simulation over photography is that it creates similar visual characteristics in all presented scenarios. Photographs would only allow for the capture of a specific moment without removing certain visual distinctions that may affect the respondent’s opinion. Additionally, the proposed simulations do not recreate a space already known, in order to exclude a sense of place that could be obtained by some respondents. Therefore, all answers were based on the visual characteristics of each simulated space. For this framework, the methodology presented by [40] using digital manipulation was developed to cope with the underlying fuzzy nature of landscapes in user preference studies. Previous research has also used digital simulations of urban green spaces to identify users’ preferences, applying different visual characteristics to the same locations, varying, for example, on the vegetation type (lawn, shrubs, and trees) and density [41,42,43]. For this purpose, simulations were created using the same focal point as high-rise residential buildings with typical identical architectural features containing a central courtyard. Additionally, simulations with a blue sky and no clouds are usually preferred by their users. In addition, green spaces suggest a summer atmosphere. The gardens designs include the same landscape patterns and composition, with fully grown vegetation and regular maintenance. Pedestrian use is identified by the integration of urban furniture and people walking.
Instead of using a representative sample, this study used a controlled sample based on students to avoid bias in sampling. A representative sample of society is often difficult to obtain and can be misleading, creating variables that are not easily identifiable. Students are frequently used in psychology studies as they are, on average, more homogeneous than non-student participants, excluding the effect of distinct preferences associated with age group and having no associated economic income. Additionally, students are considered to have a large demand for cultural goods and services [44]. Urban green spaces can provide different services to students, including areas to relax, carry out sports, or serve as a place for social gathering and interaction. Recent studies have been evaluating the students’ preferences and their perceived restoration of campus green spaces [23,42,43,45,46]. Therefore, addressing the preferences of an active and young population regarding the access, use, and vegetation characteristics of urban green spaces can help decision-makers in the planning process for urban spaces.

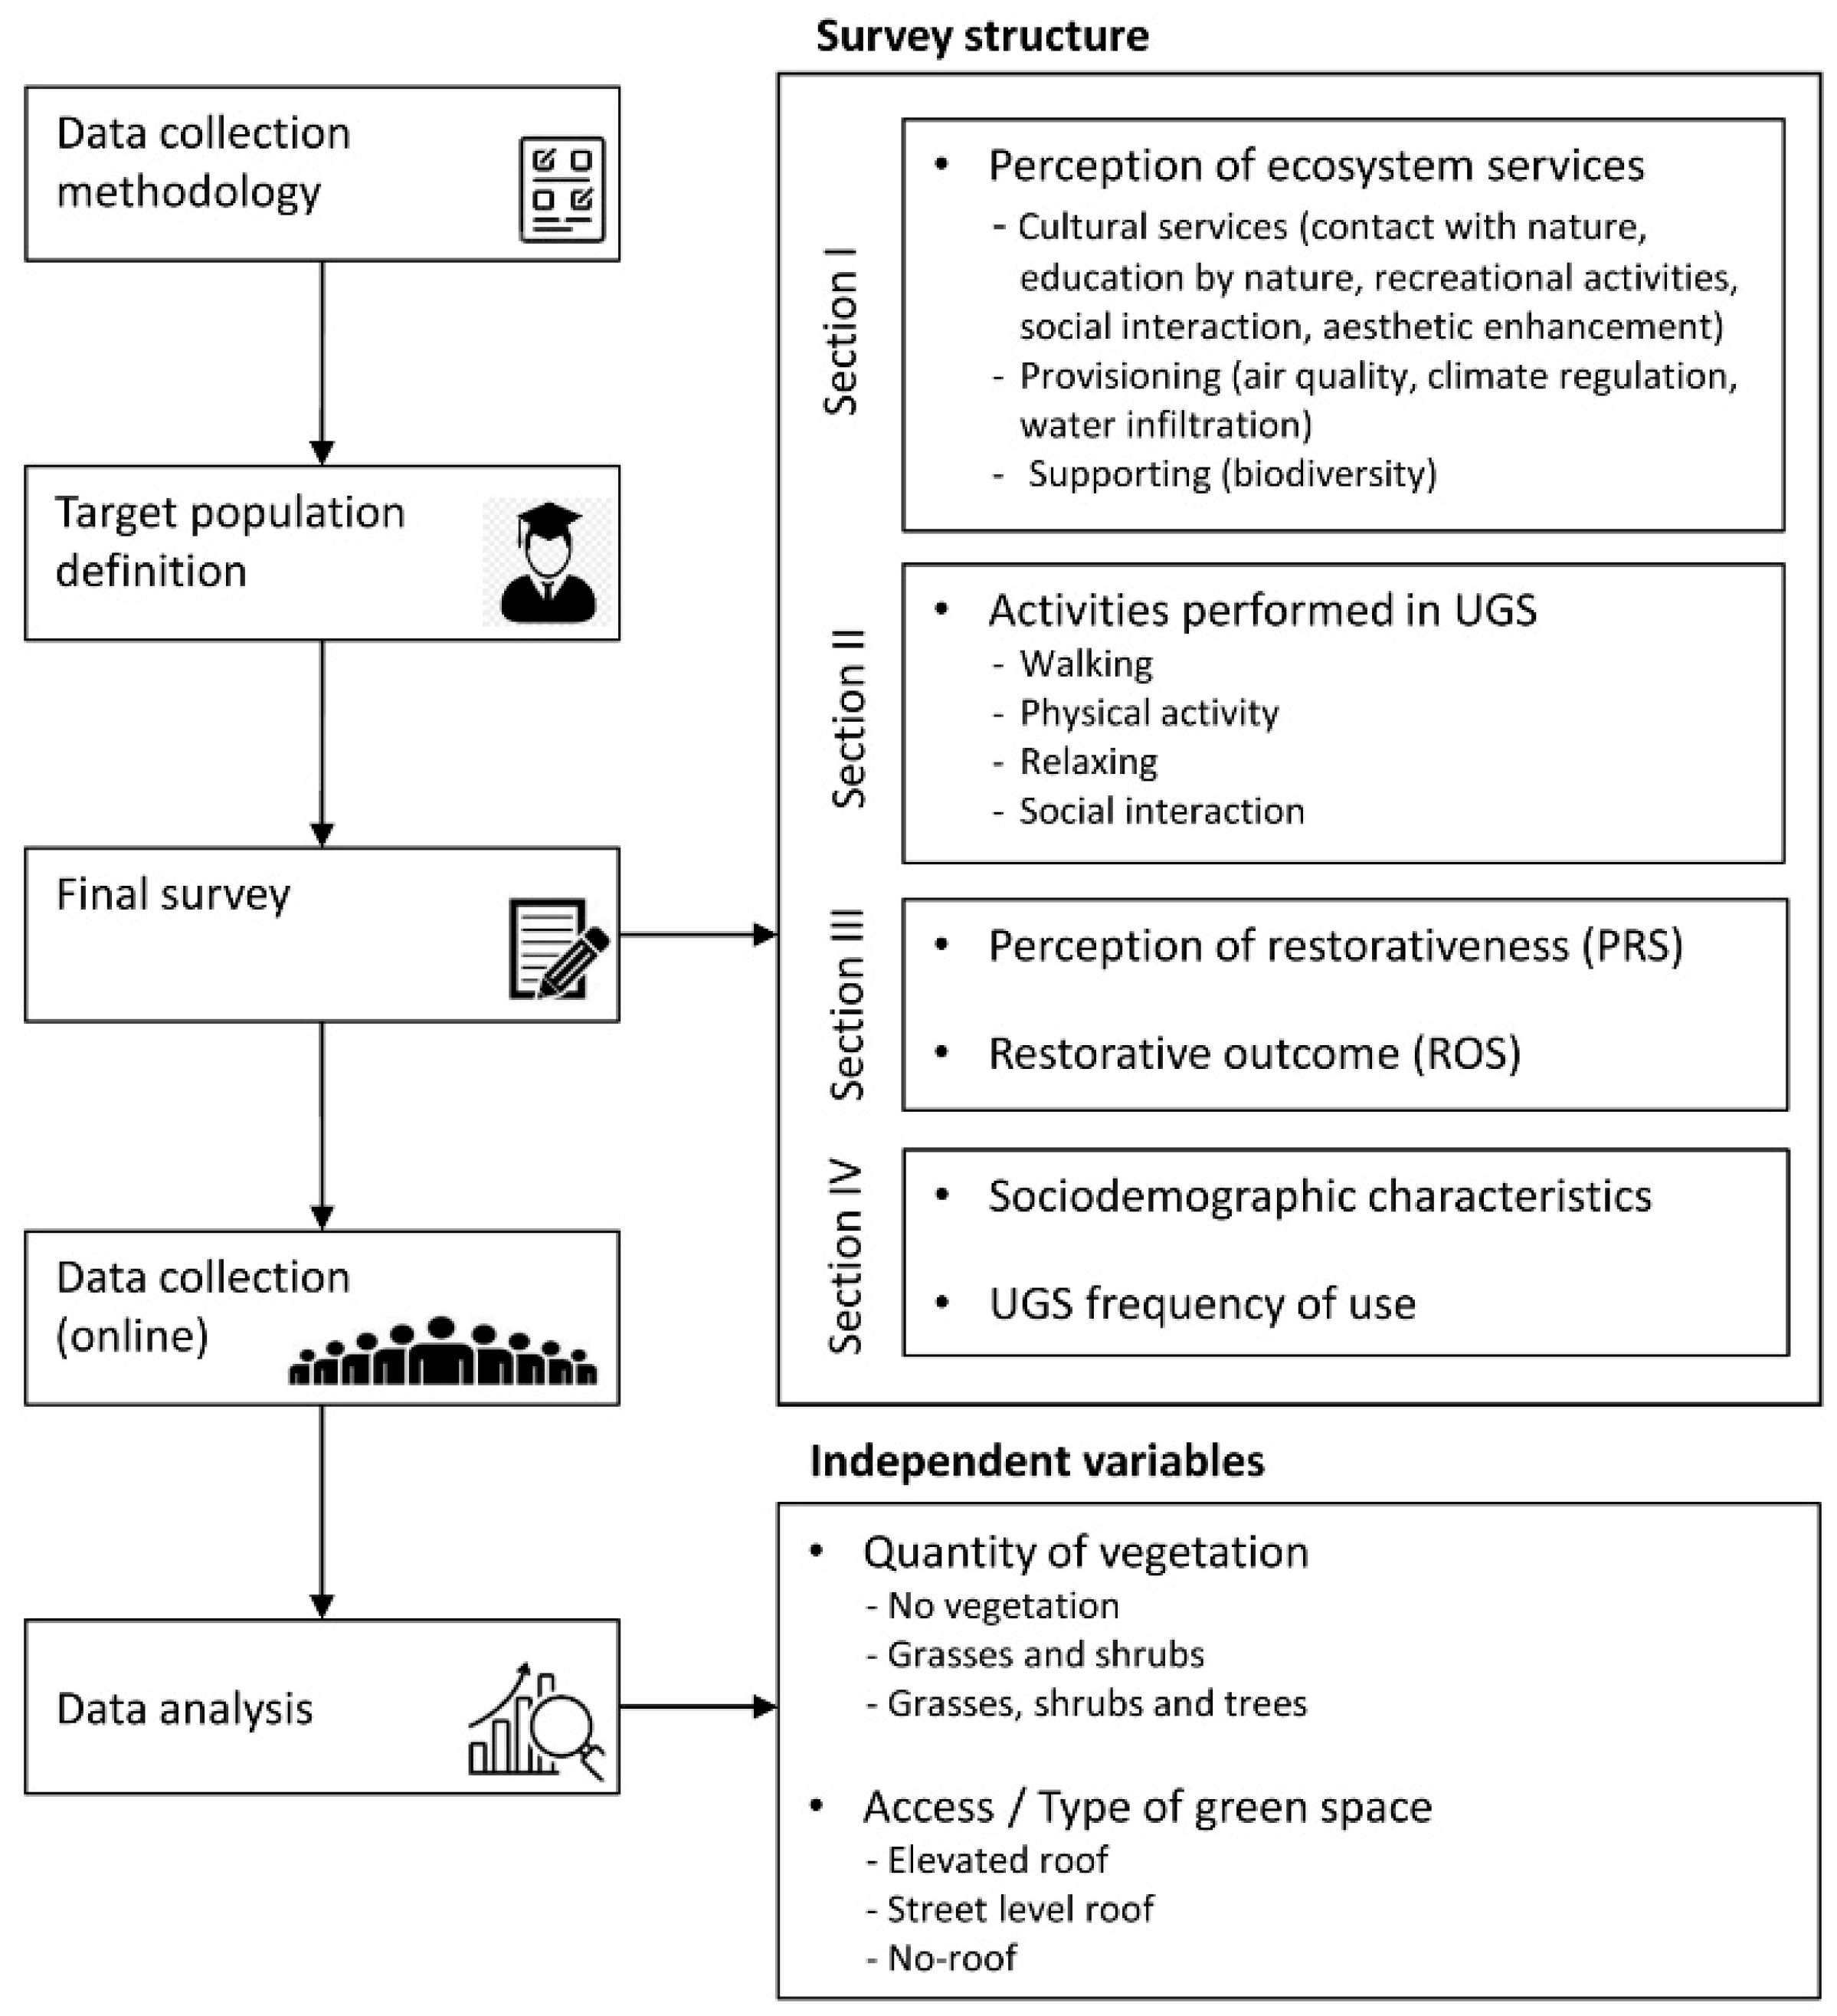
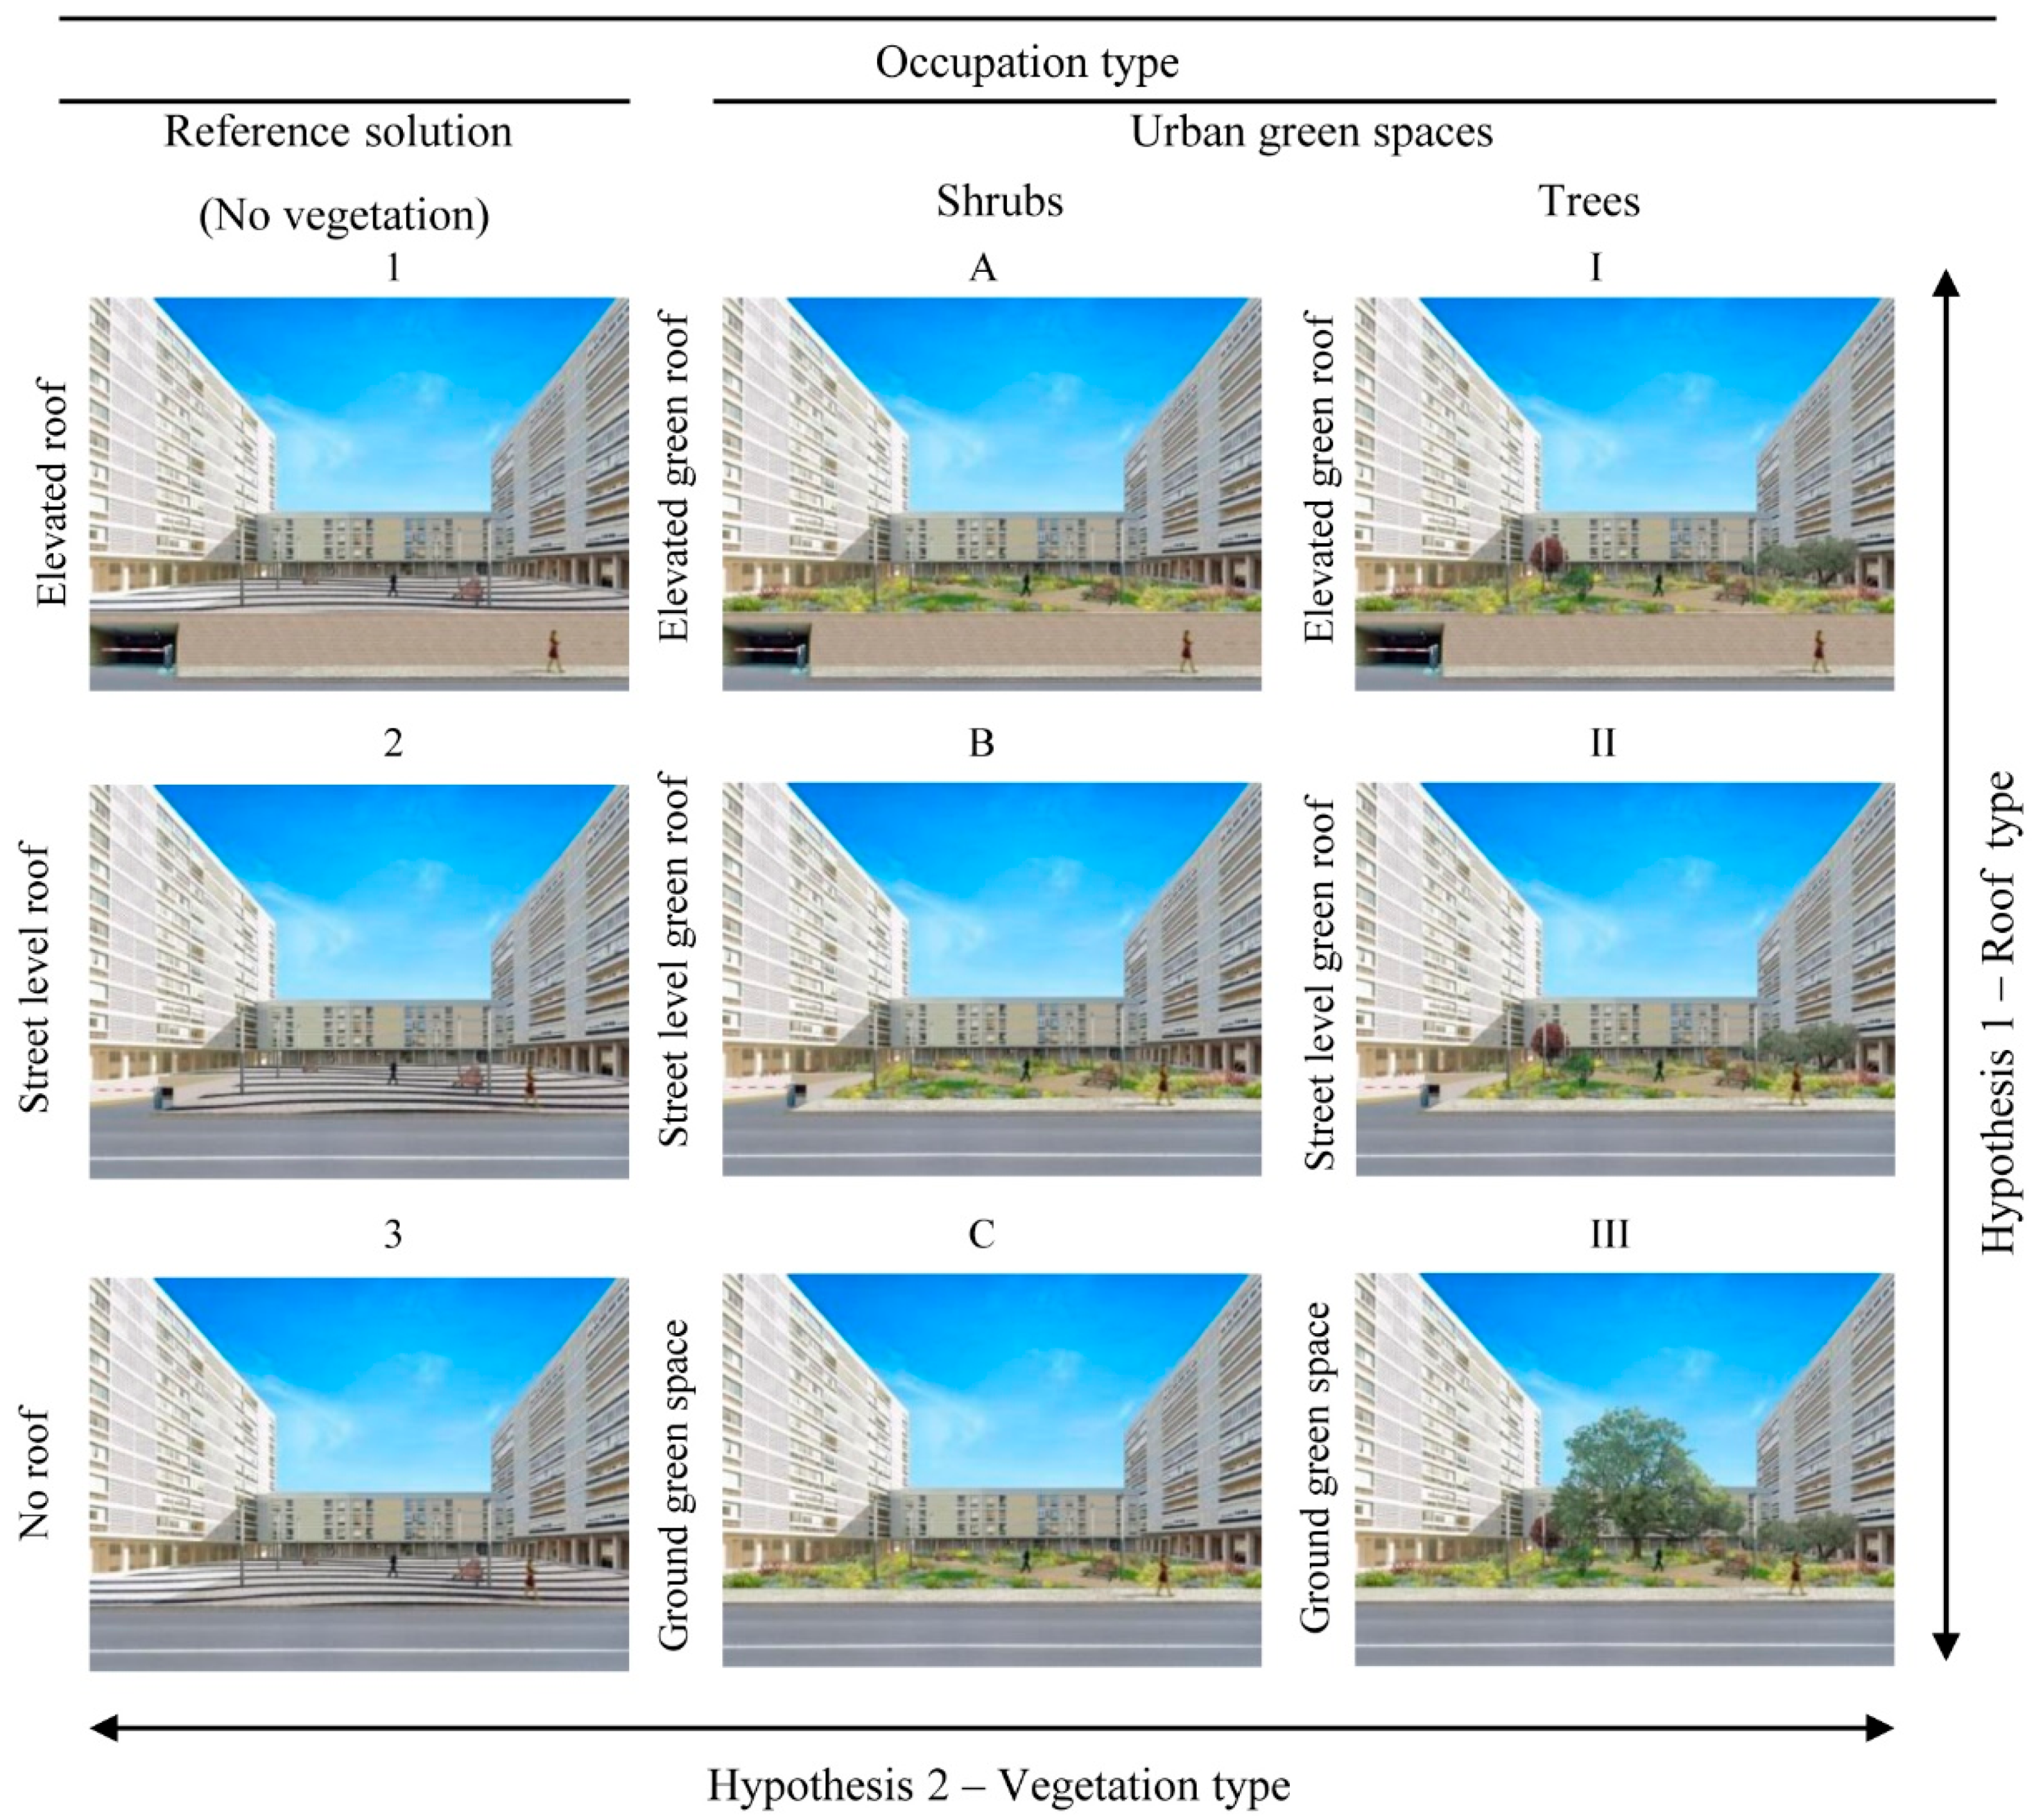
2.1. Survey Structure

The survey was based on previous research [12,41]. The participants were asked to state their level of agreement with a set of statements for each of the 3 simulations from a set of 9 simulations (Table 1).
The survey was divided into four sections (Figure 1). The participants were asked to focus on the characteristics of each simulation before answering.
Section I analyses the perception of ecosystem services provided by urban spaces, building on the literature on ecosystem service perception (i.e., [47,48]), including cultural services (contact with nature, education by nature, recreational activities, social interaction, aesthetic enhancement), regulating services (air pollution, local temperature regulation, and rainwater infiltration), and supporting services (biodiversity). To determine the perception of the ecosystem services provided in a site-specific context, different urban spaces are presented for the same area, and the users’ preferences are identified. All questions in Section I used a 5-point Likert scale, where each benefit is rated according to its importance to each space, with 1 being ‘not important’ and 5 being ‘very important’.
Section II analyses which are the main preferred activities for users to perform in the proposed UGS. The respondents are asked to focus on the image and imagine that they would be living in that area. After, they are requested to classify to what extent they would do certain leisure activities in that location, such as walking, meeting friends/family, doing physical exercise, reading, contemplating the landscape, sunbathing, walking the dog, or having picnics. All questions in Section II used a 5-point Likert scale referring to what activities would probably develop in each space, with 1 being ‘not probably’ and 5 being ‘very probably’.
Section III is based on [12]. This section identifies two aspects: the perception of restorativeness and the restorative outcome. First, the respondents are asked to imagine they are in that location and classify their perception of restorativeness according to the Perceived Restorativeness Scale (PRS). The PRS based on [49] includes 5 items, measuring: being away, fascination, coherence, compatibility, and scope (e.g., “This is a fascinating place that keeps my curiosity alive and stops me from getting bored”). The response scale ranges from 0, which means “Not at all” to 5, which means “Totally” the original scale obtained a Cronbach’s α of = 0.79. The restorative outcome is measured by the Restoration Outcome scale (ROS) as referred to in [12,50,51]. The ROS includes an eight item scale measuring the main aspects of a restorative experience: relaxation and calmness, attention restoration, clearing one’s thoughts, and reflection. In the [12], the scale has an α = 0.93.
Section IV includes the characterization of the sample, including sociodemographic characteristics (gender, age, current studies, year of frequency, location of residence, and classification as an urban/rural person) and urban green space frequency of use.

2.2. Methods

This survey was based on 9 alternative urban space designs (Figure 2), varying according to two main variables: the roof access types and the vegetation types. The vegetation types were divided into: no vegetation (simulations 1, 2, and 3); shrubs (simulations A, B, and C), including simultaneously grasses and shrubs; trees (simulations I, II, and III), including simultaneously grasses, shrubs, and trees. The types of roof access were divided into: elevated roof; street-level roof; and no-roof.
These two variables influence the resulting urban spaces, which can be an urban square (with no-vegetation) or a pocket garden (including several types of vegetation). The pocket garden could be in direct contact with the ground (no-roof) or could be a green roof (at ground level or elevated from street level). The vegetation types applied in each urban green space vary depending on the existence or inexistence of a built underground area (car park) below the public space. Therefore, the presence of larger trees can only be observed in the urban green space with no roof, which would not include a roof slab under the green area and would therefore be in contact with the ground (simulation Trees III in Figure 2). The visual access from the main road to the urban green area also varies, depending on two aspects: the existence of a roof or not, and its level, whether street-level or elevated, towards the main road.
The presence of an entrance to an underground car park was used to draw attention to the existence of a roof structure underneath the urban green area, creating the distinction between no-roof conditions and green roofs.
Two hypotheses were applied in this study considering the use of different urban simulations, as shown in Figure 2, and were applied to two levels of detail: ecosystem services in general and specifically cultural ecosystem services delivered.
Hypothesis 1 (H1). 
Considering the type of roof (elevated roof, street-level roof, and no-roof), there are no differences in the perception of provisioning, regulation, and cultural ecosystem services (ES).
Hypothesis 2 (H2). 
Considering the vegetation type (no vegetation, shrubs, and trees), there are significant differences in the perception of provisioning, regulation, and cultural ecosystem services (ES).
The survey included 30 questions and requested the participants rate each simulation in four different aspects: the perception of ecosystem services (Section I), the preferred activities (Section II), the perception of restorativeness (Section III), and the restorative outcomes (Section IV). Considering the number of questions, it would be very difficult for each participant to rate all 9 simulations. Therefore, the task was divided into nine application conditions, where each respondent rated only three simulations selected from Figure 2. Nine iterations of the same survey were created using three different urban simulations each (Table 1). Each iteration of the survey included three simulations with different vegetation types (i.e., A1I, B2II, C3III, IIIB1, IC2, IIA3, 1IIC, 2IIIA, and 3IB). The distribution of subjects over the conditions was randomised (see Table 1). To control possible order effects, the simulations were presented randomly in the nine conditions. An equivalent number of answers was obtained in each version of the survey, for a total of 1128 answers (Table 2). The survey was answered by 376 Portuguese undergraduate students from different universities in a classroom environment between March and April 2021. Statistical tests were performed using two-way analysis of variance (ANOVA) to evaluate each perceived ecosystem service and the activity preferences.

3. Results and Discussion

The results obtained in the survey are analysed and discussed in this section. The results are based on the data obtained in each section of the survey: Section I, analysis of the perception of cultural, provisioning, and supporting ecosystem services of each urban green space; Section II, identification of the preferred activities to be performed in each urban green space; Section III, analysis of the Perceived Restorativeness Scale (PRS) and Restoration Outcome Scale (ROS) obtained from the use of each urban green space; and Section IV, sociodemographic characteristics and urban green spaces frequency of use.
To simplify the naming of each simulation presented in Figure 2, these are further described in Figure 3, as follows: NoVeg 1, no vegetation on an elevated roof; NoVeg 2, no vegetation on a street-level roof; NoVeg 3, no vegetation and no roof underneath; Shrubs A, grasses and shrubs on an elevated roof; Shrubs B, grasses and shrubs on a street-level roof; Shrubs C, grasses and shrubs with no roof underneath; Trees I, grasses, shrubs, and trees with an elevated roof; Trees II, grasses, shrubs, and trees with a street-level roof; and Trees III, grasses, shrubs, and trees with no roof underneath.
As previously mentioned in the methodology section, the statistical analysis is based on two main variables: vegetation types (no vegetation, shrubs, and trees) and roof access types (elevated roof, street-level roof, and no roof).

3.1. Sample Characteristics

The sample characteristics were based on the results obtained in Section IV of the survey. The sample was composed of 62.5% females (N = 235), with an overall mean age of 21.21 years (SD = 4243). A total of 234 students (62.2%) described themselves as urban, and the remaining lived in rural areas. As for the frequency of use, 14 (3.7%) students mentioned visiting green spaces a few times a year; 43 (11.4%) a few times a month; 47 (12.5%) once a week; 168 (44.7%) a few days a week; and 104 (27.7%) every day.
The sample predominates among urban young students (around 21 years old) that visit urban green spaces on a regular basis.

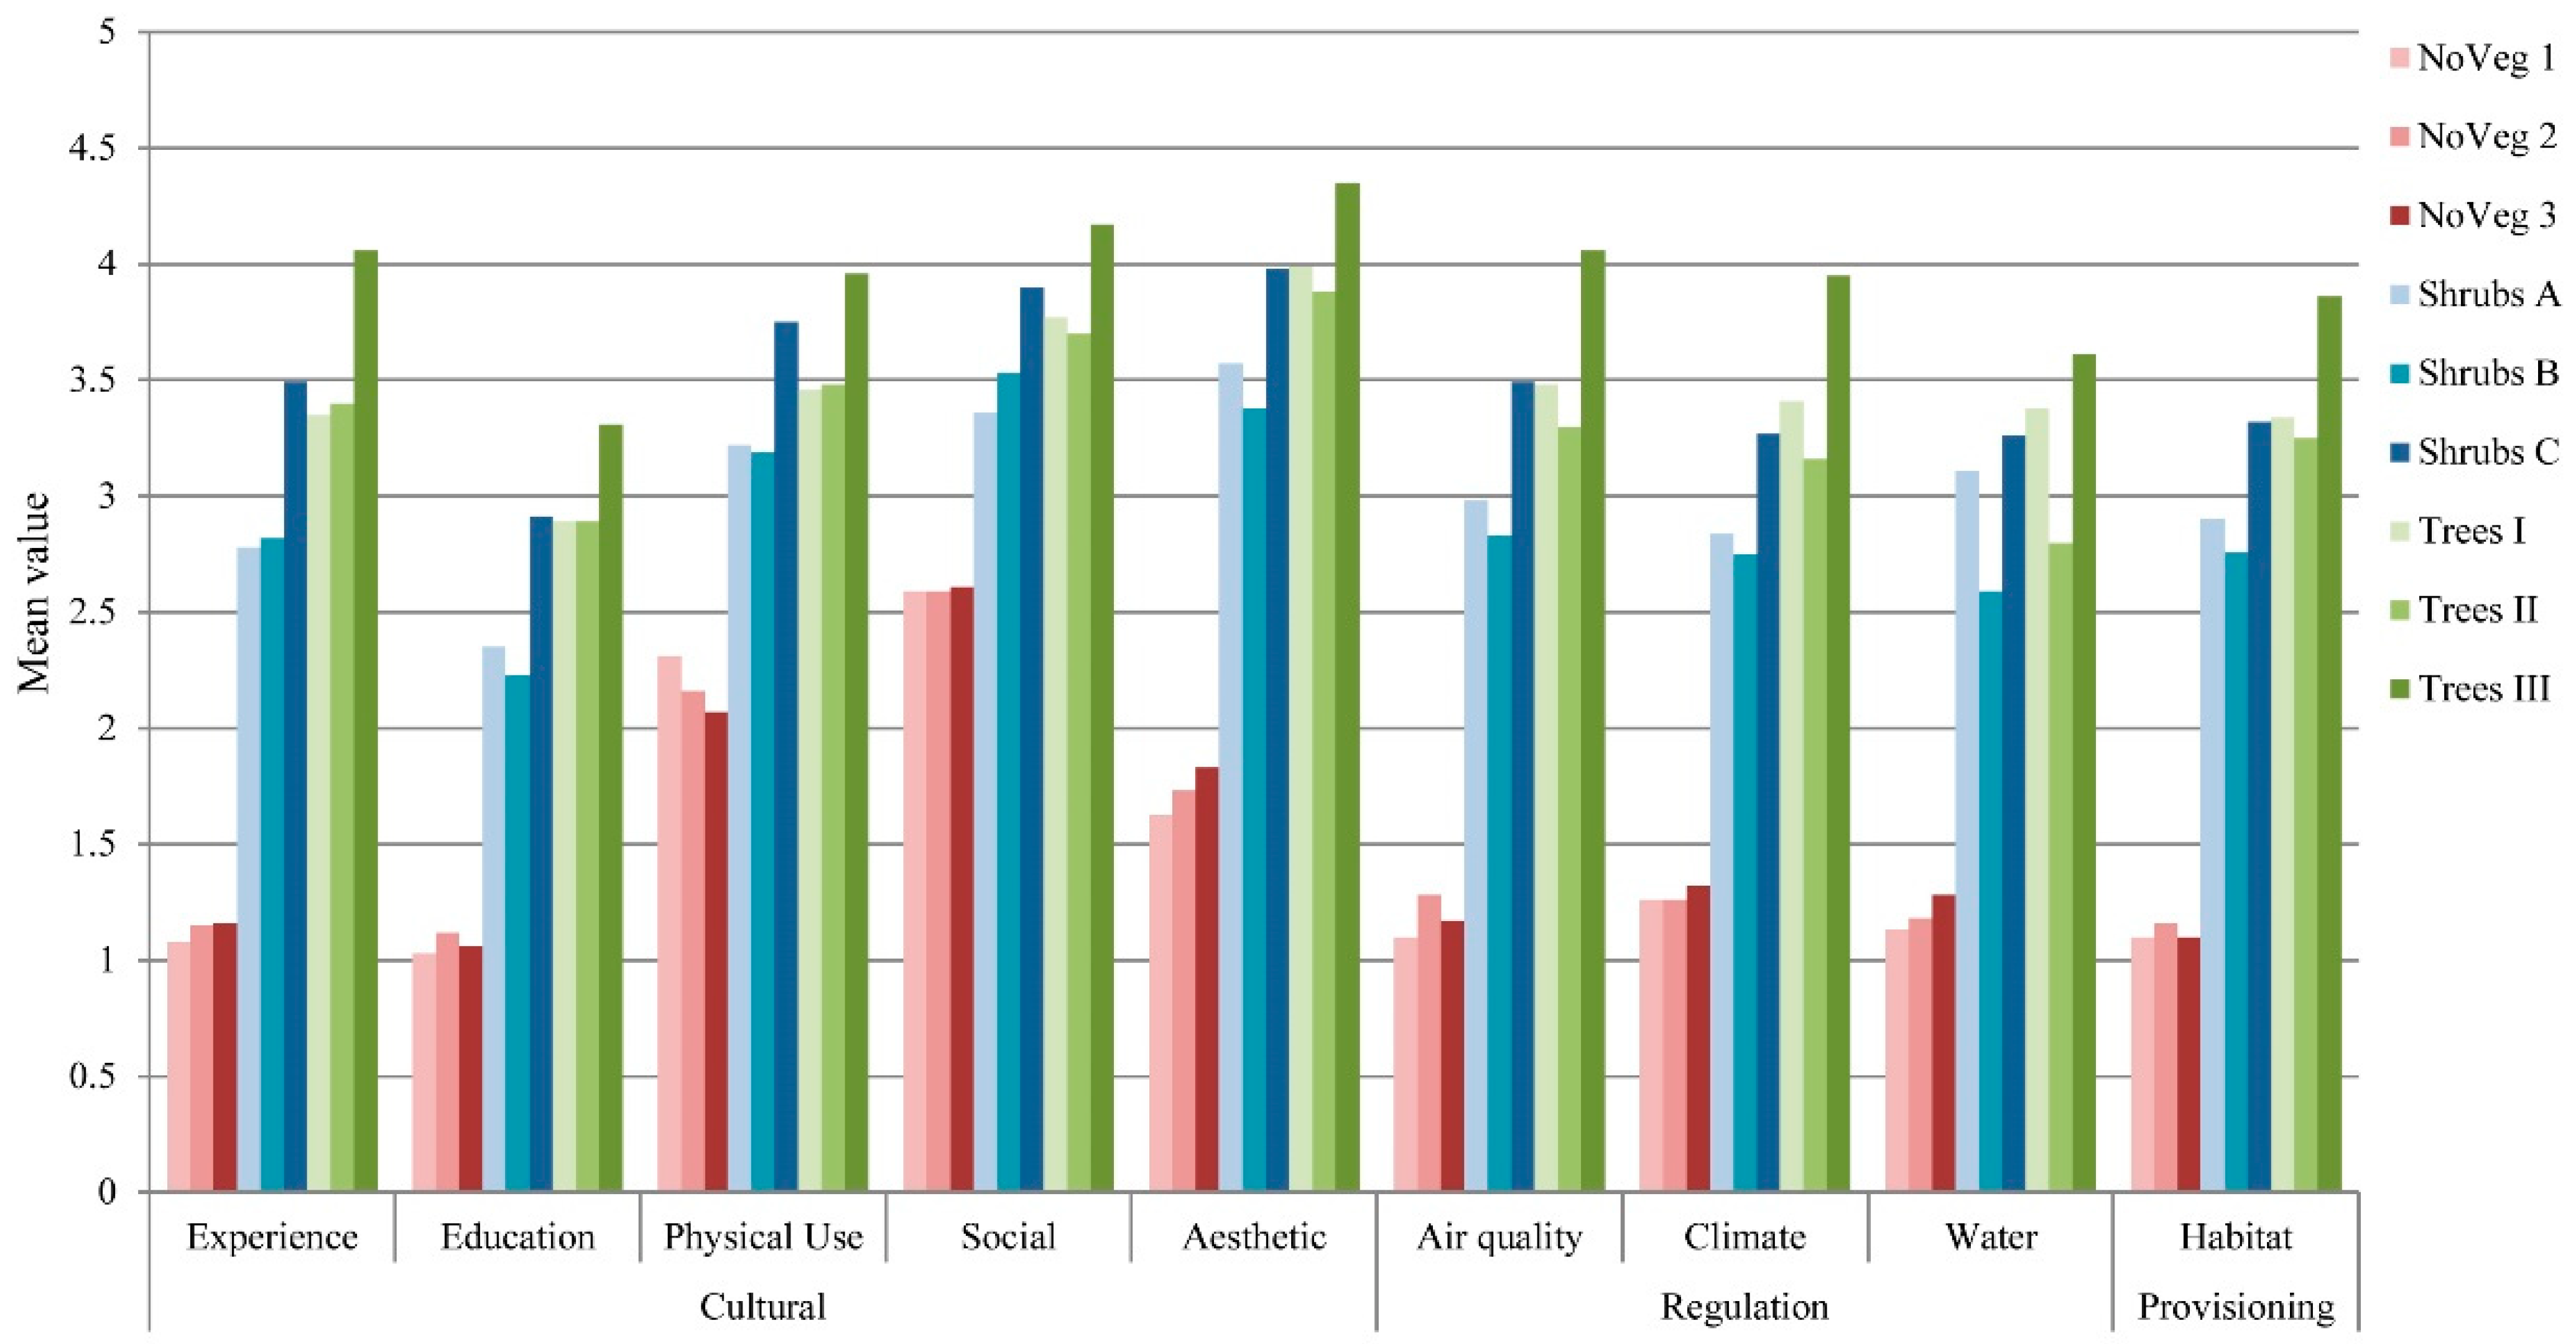
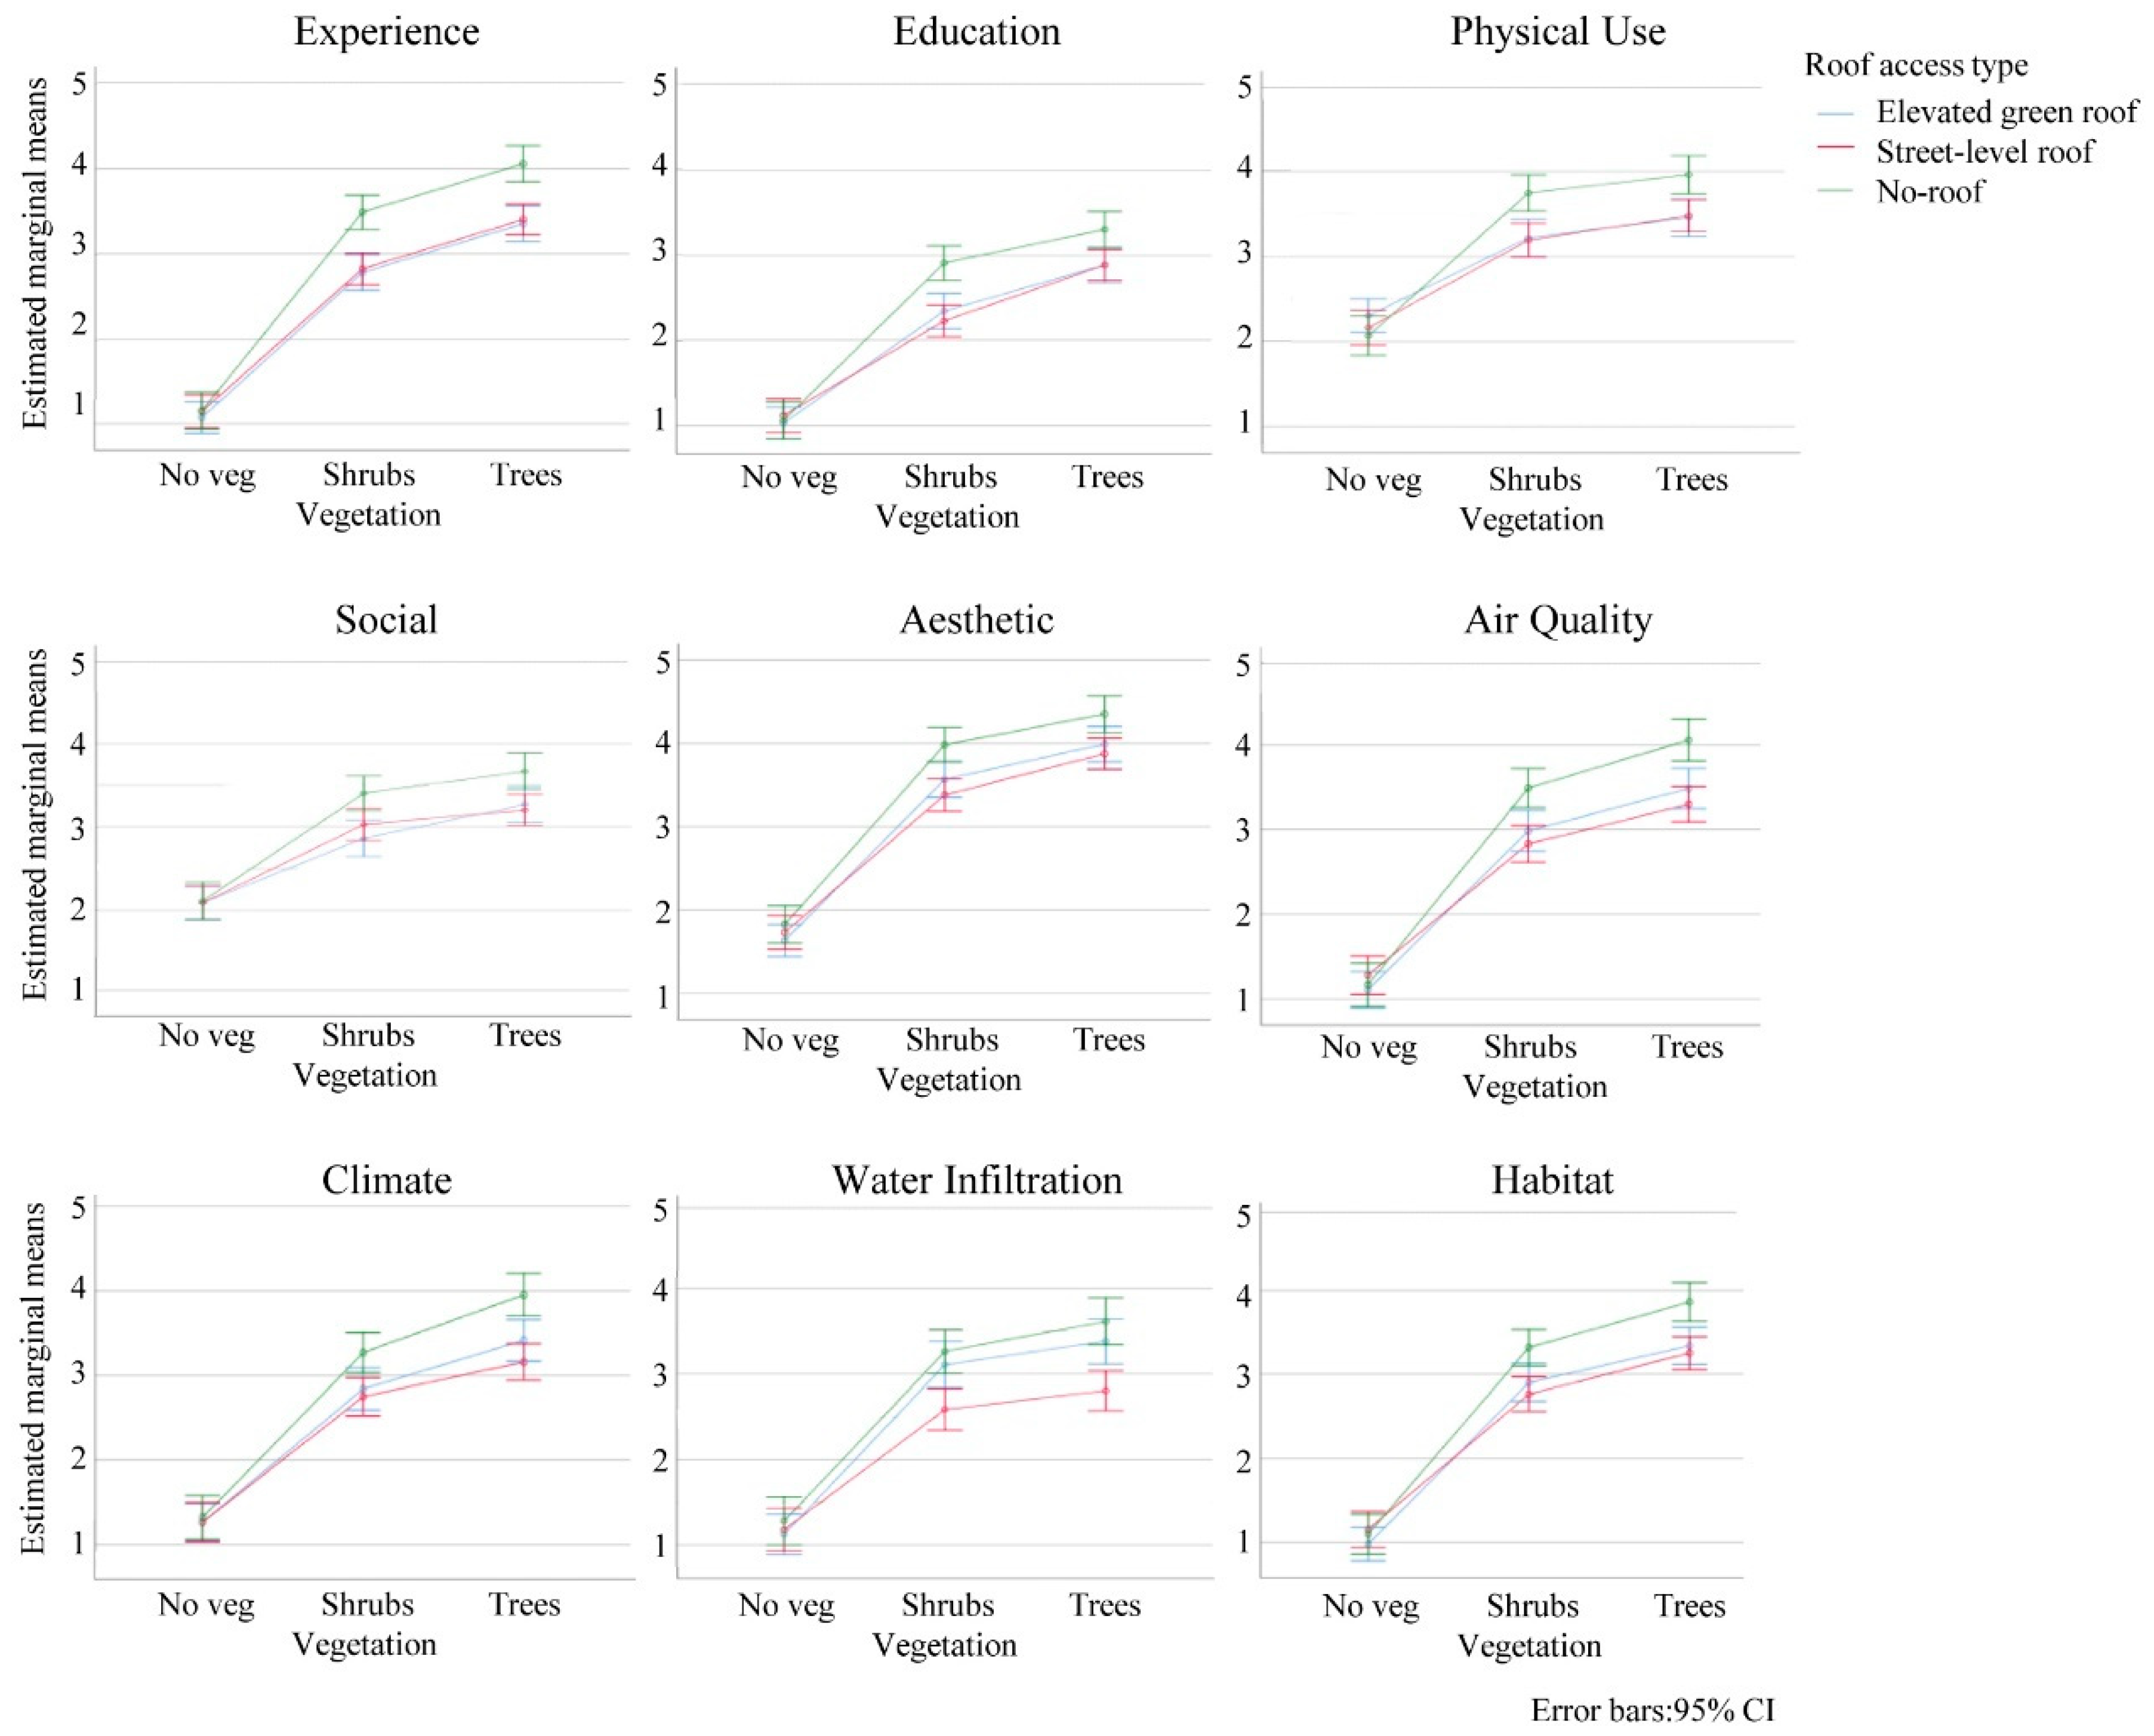
3.2. Perception of Ecosystem Services

The perception of benefits from ecosystem services (cultural, regulatory, or provisioning) is based on the results obtained in Section I of the survey. This perception varies according to the vegetation type (no vegetation, shrubs, and trees), as shown in Figure 3.
The results shown in Figure 3 demonstrate an ill-understanding of the ecosystem services concept by dissociating services from the ecosystem. Meaning that there is an understanding that no vegetation (i.e., no ecosystem) is still providing ecosystem services. This is notably valid for cultural services, such as recreational activities and social encounters, but not for regulation or provisioning services.
There is an understanding that no vegetation (as in squares) can provide cultural services, such as recreational activities (physical use), social encounters, and an aesthetically pleasing environment, but not regulation or provisioning services.
Additionally, it should be noted that, in the presence of vegetation, generally lower importance is given to the delivery of regulating and provisioning services when compared with cultural services. This suggests a misunderstanding of the importance of vegetation in the basic biophysical processes and functions underlying the provision of the service. For instance, how vegetation contributes to climate regulation through shading or evapotranspiration or how it contributes to the regulation of the urban water cycle through retention or infiltration. It has to be noted that in this study we do not investigate the effects of biodiversity, single species, or functional traits that are considered relevant to the support provision of an ecosystem [52], but only the type of vegetation associated with to the level of biomass.
Figure 3. Average value per simulation for each ecosystem service.
Sustainability 15 05334 g003
Nevertheless, the perception of benefits is favoured by the increased presence of vegetation. The situation with more biomass (Trees III) yields the highest value across all ESS, seemingly independent from the roof type. Across regulating and provisioning services, the delivery of services under roof conditions yields higher results than under non-roof conditions with less biomass. For cultural ESS, this relation is not that evident: no-roof conditions are perceived to benefit service provision (to be later explained, this might be related to an ill-understanding of the concept and/or to a perception of a lack of safety due to the presence of the entrance to the underground parking).
An ANOVA two-way analysis was performed followed by a Bonferroni post-hoc test in relation to each perceived ecosystem service, considering two variables (Vegetation and Roof Access) and the interaction of both variables (Veg* Roof access). Vegetation corresponds to the mean value of all types of vegetation, including no vegetation, shrubs, and trees. Roof access corresponds to the mean value of all types of roof access, including no roof, street-level roofs, and elevated roofs. As shown in Table 3, all variables were identified as significant with two exceptions only: social perception and aesthetic perception when both variables (Vegetation* Access) were combined.
Table 3 and Figure 4 show that the perceived pattern of results relating to vegetation type and roof access type is generally the same across all ESS.
Three main results can be observed: (a) having some vegetation (grasses and shrubs) has always been associated with a significant value increase over no vegetation, and the presence of trees has only a marginal increase in value; (b) in the situation of no vegetation on a roof, the type of access is not significantly relevant; and (c) no roof condition is always perceived to provide significantly more benefits, and in general, there is no significant difference between the street-level roof and the elevated roof, with the exception of water infiltration. In the case of the elevated roof, the perception of water infiltration is significantly closer to no roof conditions, which is not real due to the presence of the roof slab. This result emphasises the above-mentioned misunderstanding of the natural processes, both of which are missing to establish the link between imperviousness, rainwater infiltration, and the benefits arising from the increased ecological value of having more biomass (trees) when compared to smaller vegetation.
As previously referred to, the presence of an entrance to an underground car park was used to draw attention to the existence of a roof structure and its imperviousness. Based on the overall results, favouring the no-roof conditions may not be linked to the influence of a roof structure on natural processes, notably the water cycle and biomass development, but may be a mere preference for a situation where the parking entrance and the elevated wall are perceived as disturbing features.

3.3. Access Preference

To gain a better understanding of the access preferences obtained in this study, a second complementary qualitative study was conducted. Images A, B, and C from Figure 2 were shown to a sample of 18 students to capture preferences as well as the reasons for those preferences. The process was repeated for images I, II, and III. In the first set, results show a higher preference (67%) for image C. This preference was justified by the absence of the underground car park entrance, which promoted feelings of insecurity and noisiness. Image A was the least preferred due to the presence of a wall, which conditioned accessibility, as well as the previously mentioned insecurity and noisiness caused by the car entrance. In the second set of images (I, II, and III), image III yielded 78% of preferences by pointing out the presence of the big tree as a strong natural feature, promoting an enhanced contact with nature and shading.

3.4. Cultural Ecosystem Services
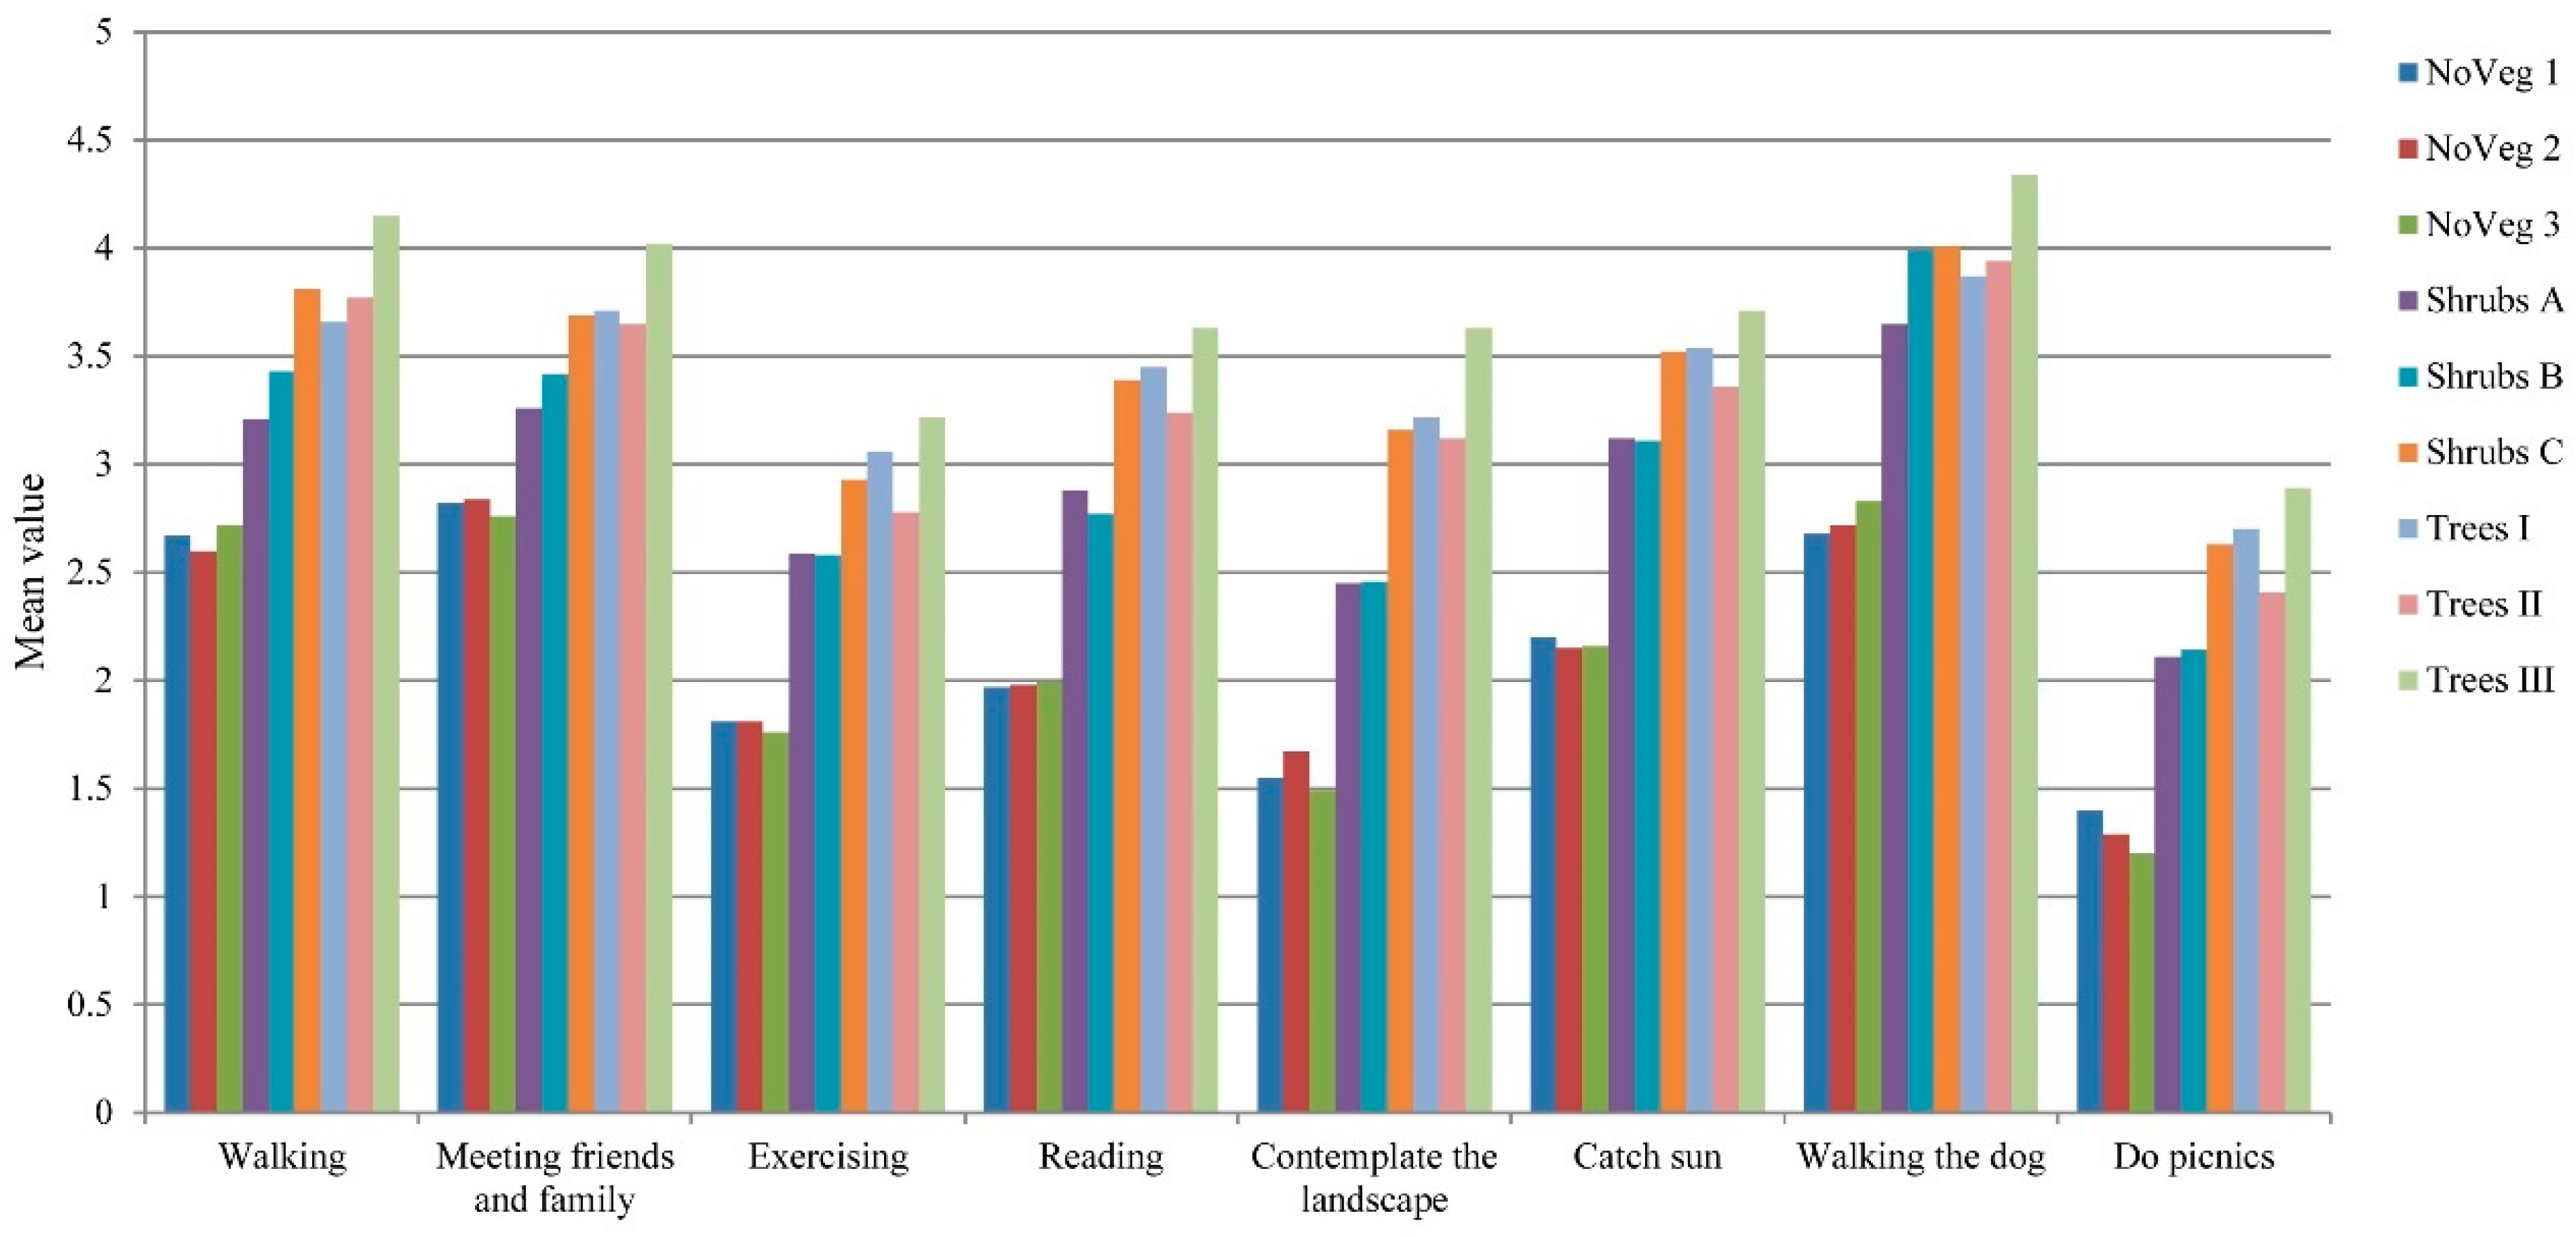
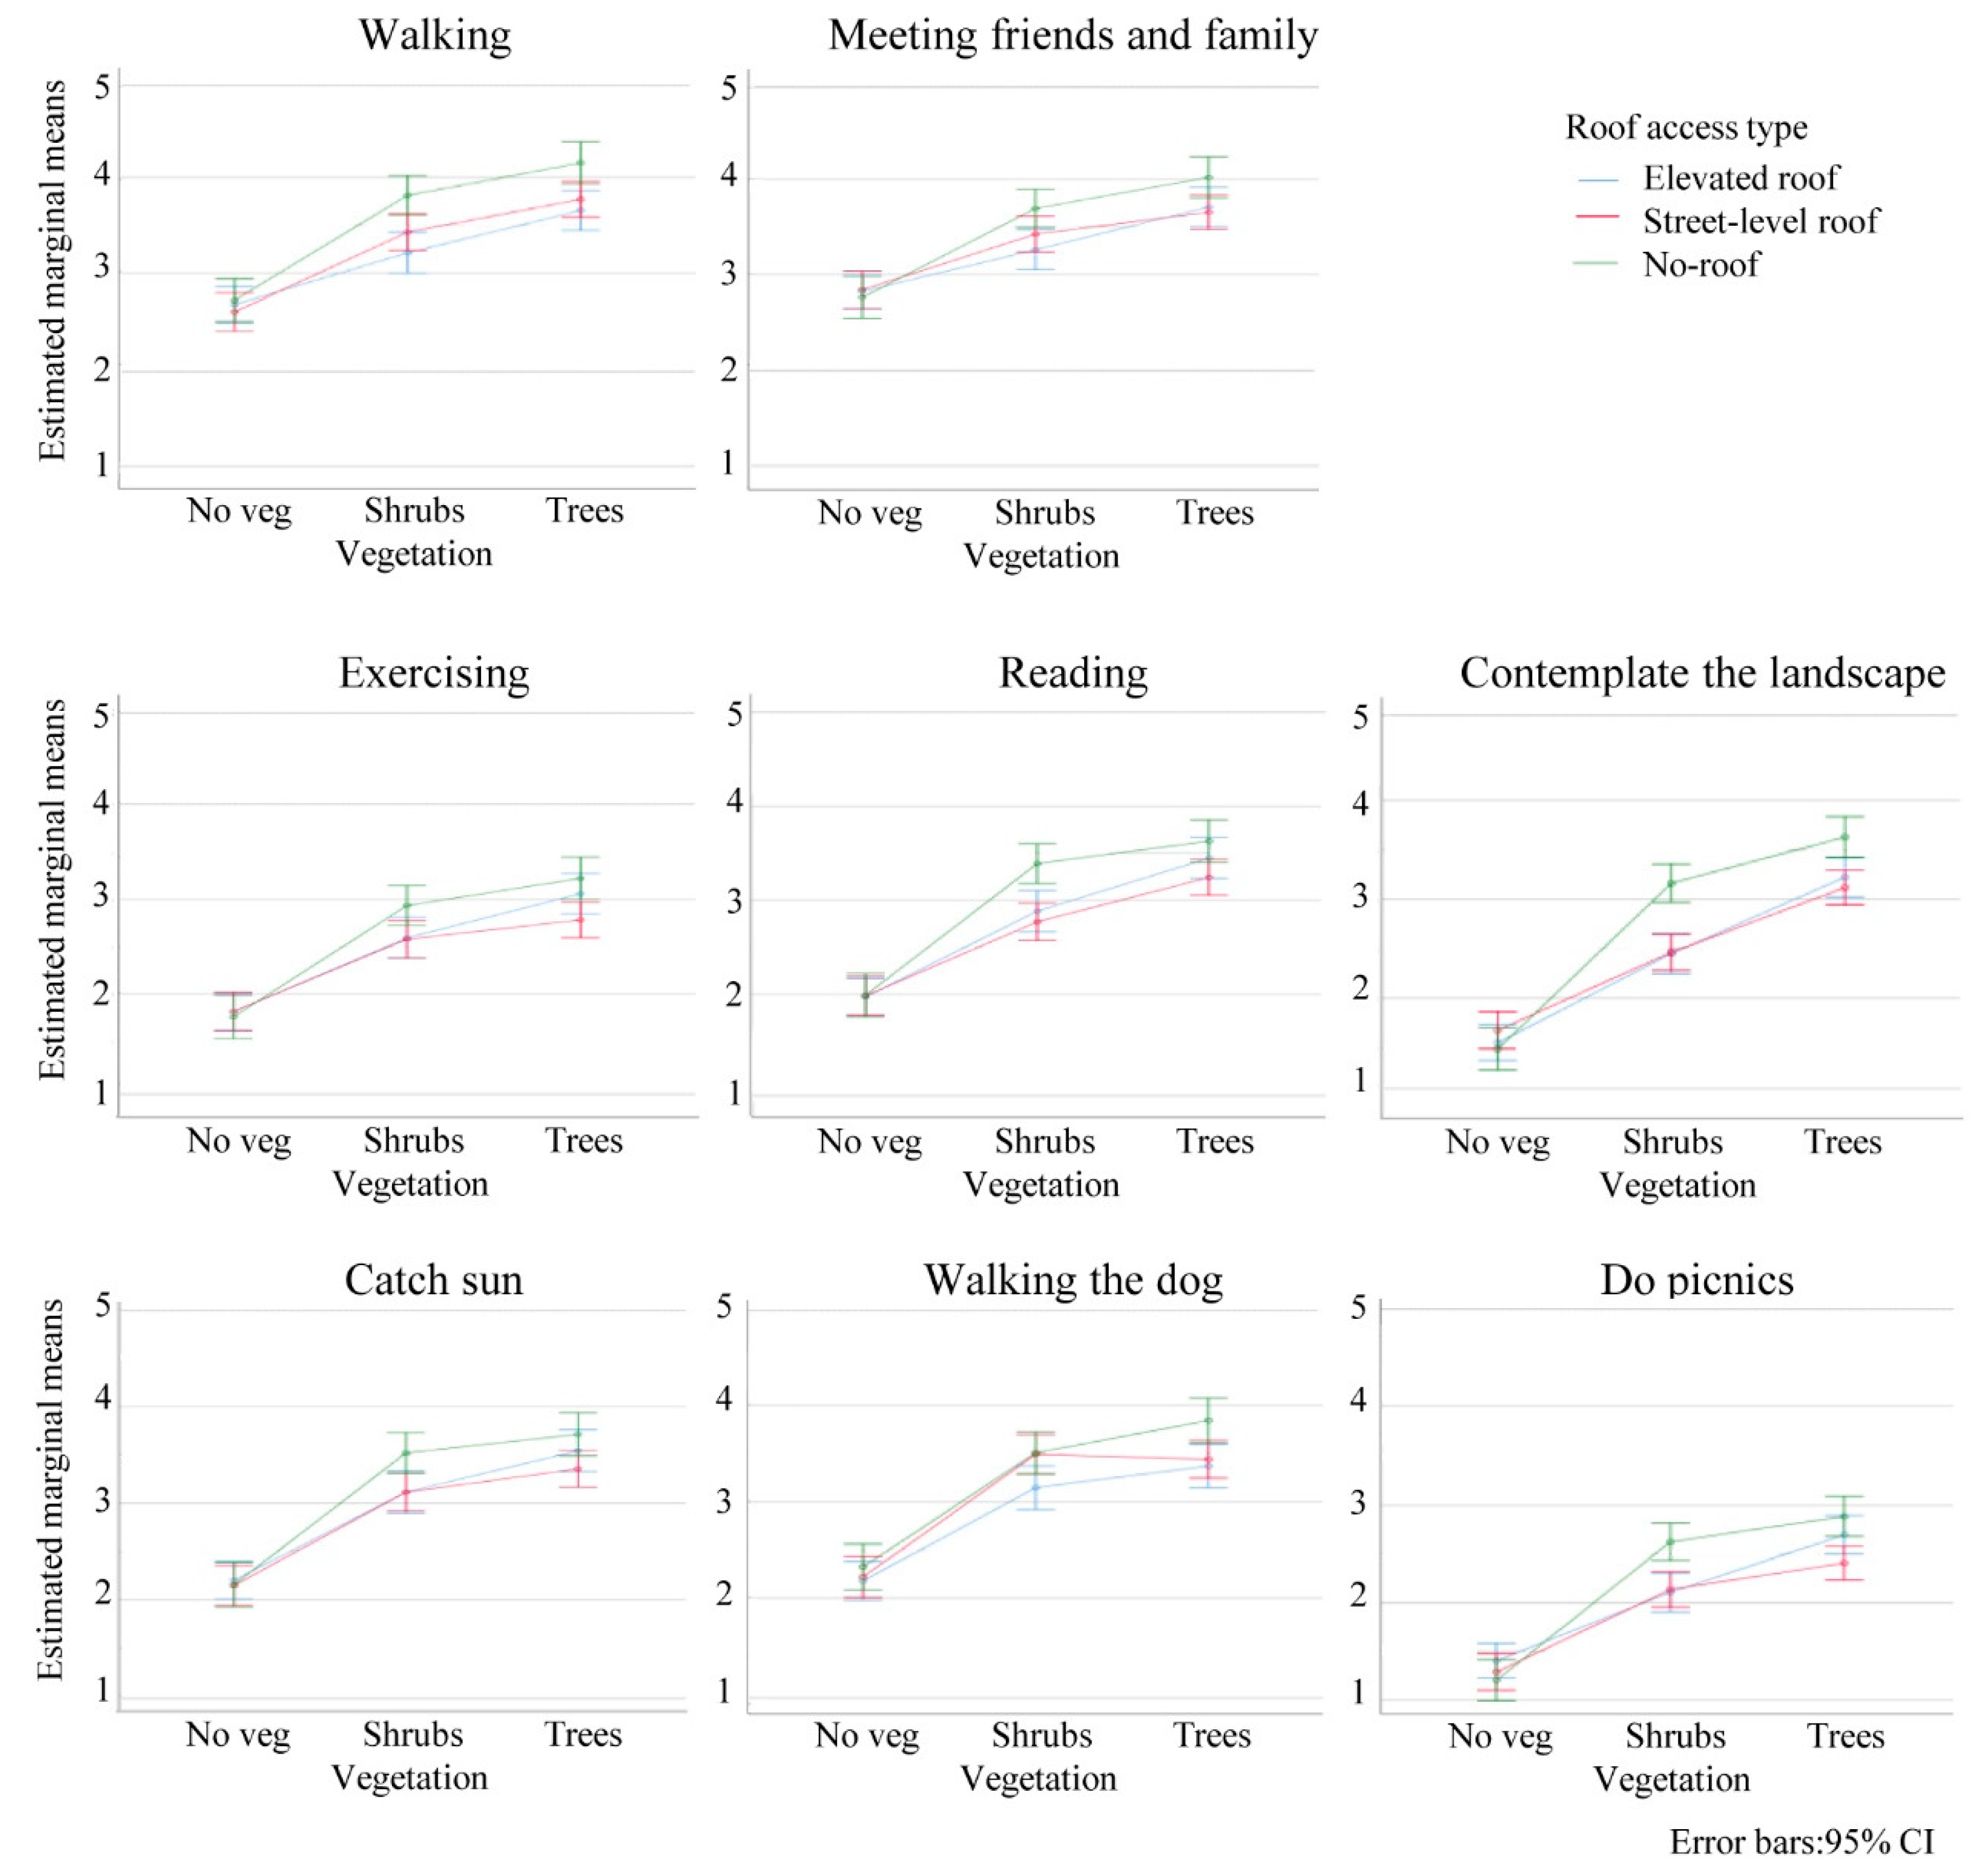
3.4.1. Activities

The analysis of the preferred activities is based on the results obtained in Section II of the survey. As shown in Figure 5 higher preference was given to walking, walking the dog, and meeting with friends and family, demonstrating the importance of green spaces in the promotion of social interaction and well-being in daily activities. Higher means were also obtained with increased vegetation, showing a higher interest in performing all activities in the presence of more vegetation.
A two-way ANOVA was performed followed by a Bonferroni post-hoc test to evaluate the activity preferences considering two variables (Vegetation and Roof Access) and the interaction of both variables (Veg* Roof access). As shown in Table 4, most variables are statistically significant, with exceptions only in walking, exercising, catching the sun, and walking the dog when both variables (Veg* Roof Access) are combined.
Table 4 and Figure 6 show that the perception pattern of results relating to vegetation type and roof access type vary depending on the activity.
The results indicate that: (a) the presence of vegetation has always had a significant value increase over no vegetation across all activities; (b) in situations with no vegetation, the type of roof is not relevant; and (c) under no-roof conditions, it is perceived to be more appealing to develop outdoor activities, especially in urban green areas, with an increased interest in the presence of more biomass. Exceptions were identified for walking, meeting with friends, and walking the dog, in which the street-level roof proved to be more appealing than the elevated roof, which might be related to the sense of security mentioned beforehand and the ease of level access (e.g., stairs). Occasionally, the elevated roof is more appealing than the ground-level roof when including more vegetation, especially for exercising, reading, catching the sun, and having picnics. This may result from the lack of physical and visual contact with the main road and the car park entrance.

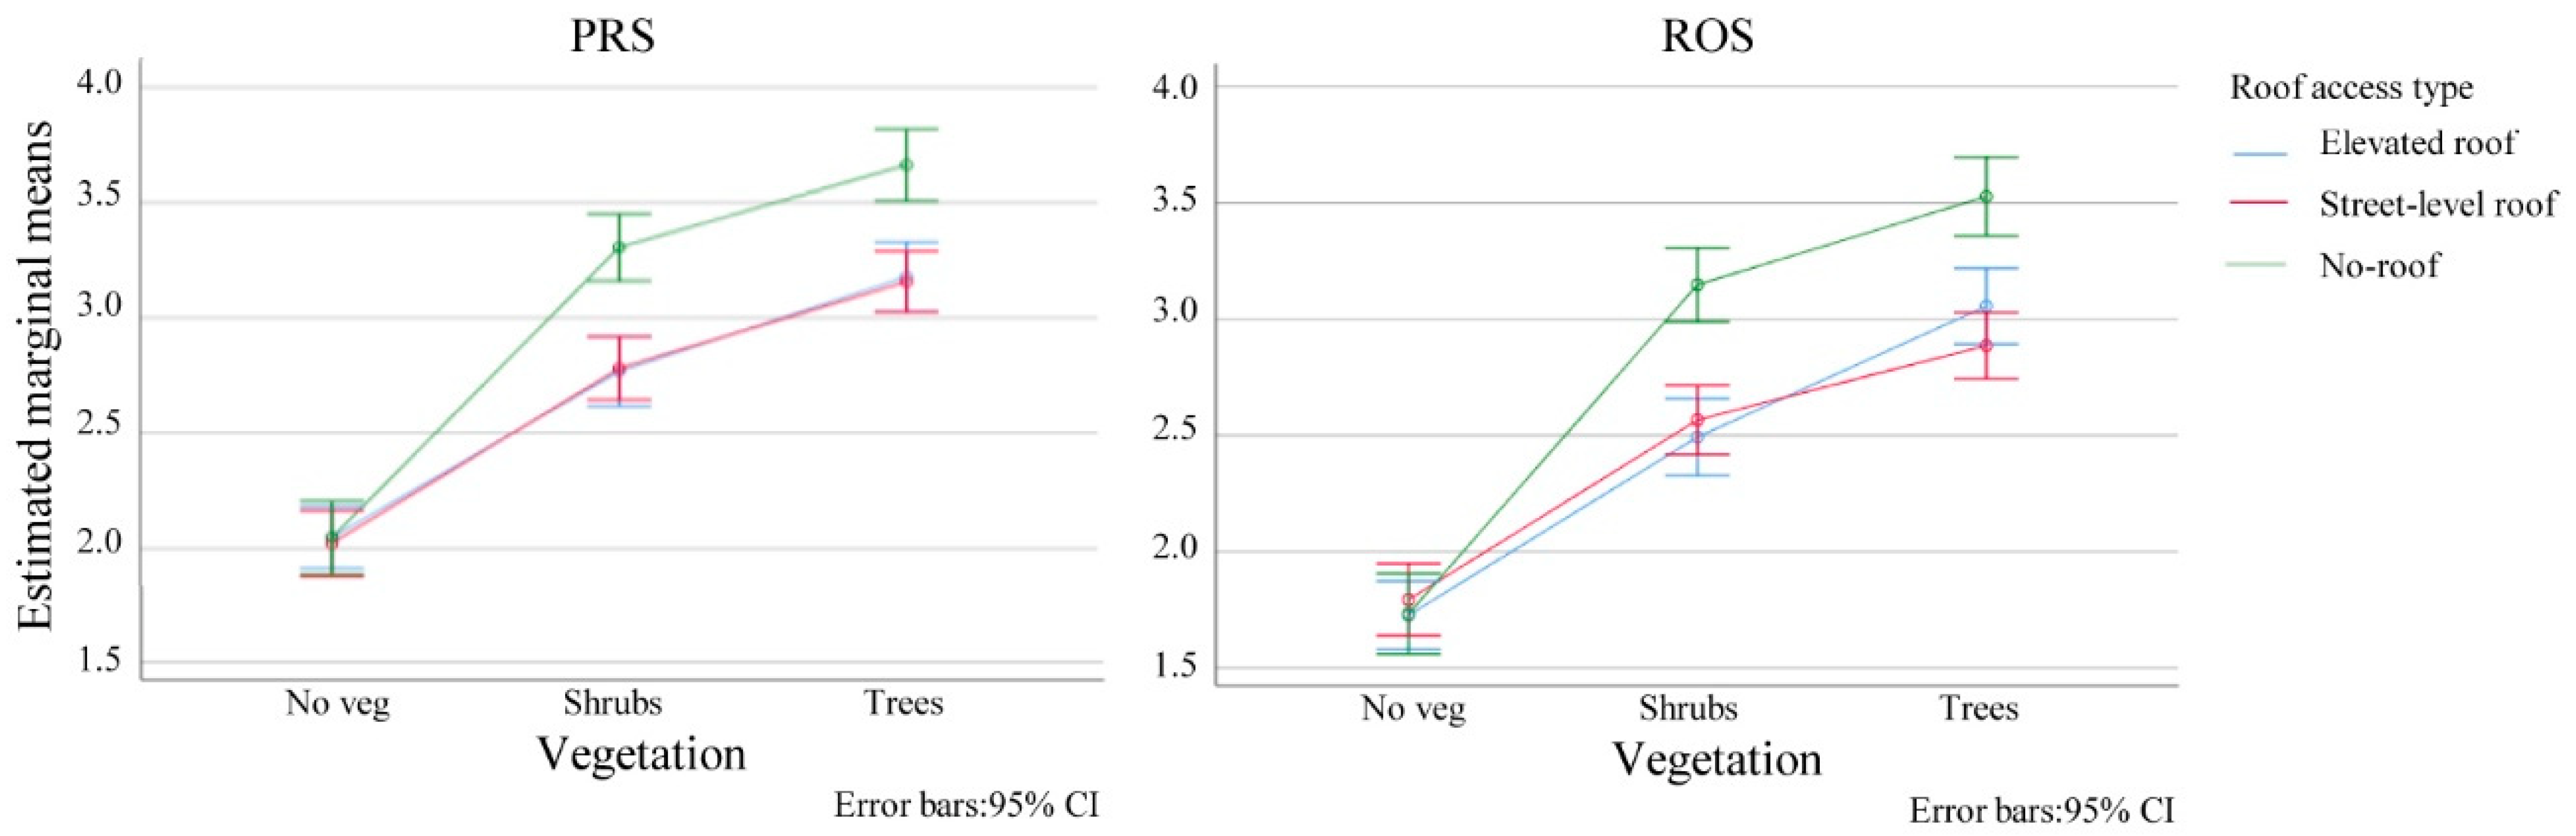
3.4.2. Perceived Restorativeness and Restoration Outcome

The Perceived Restorativeness Scale (PRS) and Restoration Outcome Scale (ROS) are based on the results obtained in Section III of the survey. Table 5 and Figure 7 show the mean values of perceived restorativeness and restoration outcomes. These results demonstrate an increased perception of the restorative potential of urban green spaces compared to urban settings with no vegetation, with increased results in the presence of larger vegetation (Trees III). Higher perception of PRS and ROS is also identified in the no-roof condition with grasses and shrubs (e.g., Shrubs C) compared to the street-level and elevated roofs. These results relate to the general preference for urban green spaces with increased vegetation and to the restoration process resulting from its presence.
A two-way ANOVA was performed followed by a Bonferroni post-hoc test in relation to the perceived restorativeness and restoration outcomes, considering two variables (Vegetation and Roof Access) and the interaction of both variables (Vegetation* Roof Access). The results demonstrate statistically significant effects with high dimensions for PRS (Table 6) and ROS (Table 7).
As shown in Figure 8, the pattern of results relating vegetation type and roof access type is generically similar both in PRS and ROS.
From these analyses, three main results can be observed: (a) the presence of vegetation has always had a significant restorative potential over the absence of vegetation, and the presence of trees has only a marginal restorative increase; (b) in the situation of no vegetation, the type of roof access is not significantly relevant in the restoration process; and (c) no-roof conditions are always perceived as having a higher restoration potential, with no significant difference between a street-level roof and an elevated roof.
These results emphasize the value of being in contact with nature and its influence on citizens’ restorative potential, as well as how the design of urban green areas influences their well-being.

4. Conclusions

This work evaluated the urban green space users’ perceptions of different supplies of provision and regulation of services offered by different types of urban green spaces. Additionally, it determined how vegetation and roof access types affect the users’ perception of cultural ecosystem services.
In general, the results demonstrate that users give preference to urban green spaces with more vegetation (grasses, shrubs, and trees), independent of the type of roof access. Additionally, users give preference to urban green spaces with higher accessibility (urban green spaces without a roof). These preferences may not be linked to the recognition of the inexistence of a roof under the urban green space and its influence on the natural processes (the water cycle and biomass development). In fact, the results demonstrate a preference based on the quality of the urban design, considering the abundance of vegetation and the accessibility of urban green spaces.
There are two main aspects that can be concluded based on the results of this study. Firstly, there is a lack of awareness/knowledge of nature, natural processes, and their interdependencies, leading to a missing systems approach to ecology and an ill-understanding of the role of vegetation. Results show that quantity of vegetation prevails over quality, in line with the findings in [41,53]. Secondly, the results show that urban designs reflecting quality of design, ease of use, and accessibility are more valued. These findings are aligned with previous research work by [54], which states that the frequent use of urban green spaces is associated with their accessibility and level of naturalness. In fact, the results demonstrate that these characteristics are more valued than the provision of ecosystem services when assessing the preference for a green space. Thus, having green spaces on the ground or on green roofs presents no significant difference.
Overall, the results presented in this study have an upside and a downside. On the upside, people do not really care if the green space is located on-ground or on a green roof. This sustains urban development and investment in green spaces on rooftops. On the downside, it also shows that there is a progressive disconnection between people and nature, based first on an aesthetic appreciation of nature as a kind of “décor”, then on the functions of ecosystems and the dependency of humanity on the services provided. This ill-understanding of nature’s services to human well-being is not favourable to the transformative change of societies and expected sustainability goals. However, the results also demonstrate significant findings about citizens’ value of being in contact with nature and its influence on their restorative potential. Additionally, it reinforces the importance of well-designed urban green spaces to promote citizens’ well-being.
The sample size of this study is limited, preventing conclusions beyond its scope. This sample is not representative of society, as young adults have distinct preferences and activities than other age groups, and cultural characteristics may influence users’ perceptions and preferences. Nevertheless, today’s students are the adults and decision-makers of tomorrow. It is important to consider replicating this study in other contexts and with a broader sample. Further studies on urban settings could analyse other characteristics of urban green spaces, such as their different functionalities, accesses, dimensions, or expected population density. Additionally, site specific interventions could be presented to the respondents for further analysis on the scale and vegetation included in urban green spaces.
This study is a source of information on the users’ preferences and the restorative potential of urban green spaces. Considering the methodology used and the main findings, it is believed that this information can help urban planners and designers better design existing and new urban green areas.

Author Contributions

Conceptualization, C.M.S. and I.L.R.; methodology, C.M.S., F.B. and I.L.R.; validation, F.B.; writing—original draft preparation, C.M.S. and M.M.; writing—review and editing, M.M.; supervision, C.M.S., F.B. and I.L.R.; All authors have read and agreed to the published version of the manuscript.

Funding

This work was partly supported by the FCT (Portuguese Foundation for Science and Technology) through the GENESIS project (PTDC/GESURB/29444/2017). This work is part of the research activity carried out at Civil Engineering Research and Innovation for Sustainability (CERIS) and has been funded by Fundação para a Ciência e a Tecnologia (FCT) in the framework of project UIDB/04625/2020.

Informed Consent Statement

Not applicable.

Conflicts of Interest

The authors declare no conflict of interest.

References

  1. CBD. Urban Biodiversity and the Role of Cities in Biodiversity Conservation and Sustainable Use Discussed at Bonn Biodiversity Conference. 2008. Available online: https://www.cbd.int/doc/press/2008/pr-2008-05-26-cities-en.pdf (accessed on 15 September 2022).
  2. UN. Transforming Our World: The 2030 Agenda for Sustainable Development; United Nations: New York, NY, USA, 2015; Available online: https://sdgs.un.org/2030agenda (accessed on 14 September 2022).
  3. Surge, G. GREEN SURGE: All Deliverables. Available online: https://ign.ku.dk/english/green-surge/bokse/green-surge-all-deliverables/ (accessed on 14 September 2021).
  4. Gómez-Baggethun, E.; Gren, Å.; Barton, D.N.; Langemeyer, J.; McPhearson, T.; O’farrell, P.; Andersson, E.; Hamstead, Z.; Kremer, P. Urban ecosystem services. In Urbanization, Biodiversity and Ecosystem Services: Challenges and Opportunities; Springer: Dordrecht, The Netherlands, 2013; pp. 175–251. [Google Scholar]
  5. Wood, E.; Harsant, A.; Dallimer, M.; Cronin de Chavez, A.; McEachan, R.R.; Hassall, C. Not all green space is created equal: Biodiversity predicts psychological restorative benefits from urban green space. Front. Psychol. 2018, 9, 2320. [Google Scholar] [CrossRef] [PubMed] [Green Version]
  6. Whitford, V.; Ennos, A.R.; Handley, J.F. “City form and natural process”—Indicators for the ecological performance of urban areas and their application to Merseyside, UK. Landsc. Urban Plan. 2001, 57, 91–103. [Google Scholar] [CrossRef]
  7. Barthel, S.; Parker, J.; Ernstson, H. Food and green space in cities: A resilience lens on gardens and urban environmental movements. Urban Stud. 2015, 52, 1321–1338. [Google Scholar] [CrossRef] [Green Version]
  8. Bertnatzky, A. The contribution of trees and green spaces to a town climate. Energy Build. 1982, 5, 1. [Google Scholar] [CrossRef]
  9. De Manuel, B.F.; Méndez-Fernández, L.; Peña, L.; Ametzaga-Arregi, I. A new indicator of the effectiveness of urban green infrastructure based on ecosystem services assessment. Basic Appl. Ecol. 2021, 53, 12–25. [Google Scholar] [CrossRef]
  10. Dickinson, D.C.; Hobbs, R.J. Cultural ecosystem services: Characteristics, challenges and lessons for urban green space research. Ecosyst. Serv. 2017, 25, 179–194. [Google Scholar] [CrossRef]
  11. Kabisch, N.; van den Bosch, M.; Lafortezza, R. The health benefits of nature-based solutions to urbanization challenges for children and the elderly–A systematic review. Environ. Res. 2017, 159, 362–373. [Google Scholar] [CrossRef]
  12. Subiza-Pérez, M.; Vozmediano, L.; San Juan, C. Green and blue settings as providers of mental health ecosystem services: Comparing urban beaches and parks and building a predictive model of psychological restoration. Landsc. Urban Plan. 2020, 204, 103926. [Google Scholar] [CrossRef]
  13. Cleary, A.; Roiko, A.; Burton, N.W.; Fielding, K.S.; Murray, Z.; Turrell, G. Changes in perceptions of urban green space are related to changes in psychological well-being: Cross-sectional and longitudinal study of mid-aged urban residents. Health Place 2019, 59, 102201. [Google Scholar] [CrossRef]
  14. Zhu, X.; Gao, M.; Zhang, R.; Zhang, B. Quantifying emotional differences in urban green spaces extracted from photos on social networking sites: A study of 34 parks in three cities in northern China. Urban For. Urban Green. 2021, 62, 127133. [Google Scholar] [CrossRef]
  15. Van den Berg, A.E.; Jorgensen, A.; Wilson, E.R. Evaluating restoration in urban green spaces: Does setting type make a difference? Landsc. Urban Plan. 2014, 127, 173–181. [Google Scholar] [CrossRef]
  16. Chiesura, A. The role of urban parks for the sustainable city. Landsc. Urban Plan. 2004, 68, 129–138. [Google Scholar] [CrossRef]
  17. Aoshima, I.; Uchida, K.; Ushimaru, A.; Sato, M. The influence of subjective perceptions on the valuation of green spaces in Japanese urban areas. Urban For. Urban Green. 2018, 34, 166–174. [Google Scholar] [CrossRef]
  18. Grahn, P.; Stigsdotter, U.K. The relation between perceived sensory dimensions of urban green space and stress restoration. Landsc. Urban Plan. 2010, 94, 264–275. [Google Scholar] [CrossRef]
  19. Hedblom, M.; Gunnarsson, B.; Iravani, B.; Knez, I.; Schaefer, M.; Thorsson, P.; Lundström, J.N. Reduction of physiological stress by urban green space in a multisensory virtual experiment. Sci. Rep. 2019, 9, 10113. [Google Scholar] [CrossRef] [Green Version]
  20. Ma, R.; Luo, Y.; Furuya, K. Gender Differences and Optimizing Women’s Experiences: An Exploratory Study of Visual Behavior While Viewing Urban Park Landscapes in Tokyo, Japan. Sustainability 2023, 15, 3957. [Google Scholar] [CrossRef]
  21. Nordh, H.; Alalouch, C.; Hartig, T. Assessing restorative components of small urban parks using conjoint methodology. Urban For. Urban Green. 2011, 10, 95–103. [Google Scholar] [CrossRef]
  22. Paraskevopoulou, A.T.; Chletsou, M.; Malesios, C. Runners Experience Lower Heart Rate, Increased Speed, and Joy/Calm on Routes with Trees, by the Sea and through Parks: Implications for Climate Change Design. Sustainability 2022, 14, 16280. [Google Scholar] [CrossRef]
  23. Holt, E.W.; Lombard, Q.K.; Best, N.; Smiley-Smith, S.; Quinn, J.E. Active and passive use of green space, health, and well-being amongst university students. Int. J. Environ. Res. Public Health 2019, 16, 424. [Google Scholar] [CrossRef] [Green Version]
  24. Ugolini, F.; Massetti, L.; Calaza-Martínez, P.; Cariñanos, P.; Dobbs, C.; Ostoić, S.K.; Marin, A.M.; Pearlmutter, D.; Saaroni, H.; Šaulienė, I. Effects of the COVID-19 pandemic on the use and perceptions of urban green space: An international exploratory study. Urban For. Urban Green. 2020, 56, 126888. [Google Scholar] [CrossRef]
  25. Manso, M.; Sousa, V.; Silva, C.M.; Cruz, C.O. The role of green roofs in post COVID-19 confinement: An analysis of willingness to pay. J. Build. Eng. 2021, 44, 103388. [Google Scholar] [CrossRef]
  26. Derkzen, M.L.; van Teeffelen, A.J.; Verburg, P.H. Quantifying urban ecosystem services based on high-resolution data of urban green space: An assessment for Rotterdam, the Netherlands. J. Appl. Ecol. 2015, 52, 1020–1032. [Google Scholar] [CrossRef]
  27. Elderbrock, E.; Enright, C.; Lynch, K.A.; Rempel, A.R. A Guide to Public Green Space Planning for Urban Ecosystem Services. Land 2020, 9, 391. [Google Scholar] [CrossRef]
  28. Haase, D.; Larondelle, N.; Andersson, E.; Artmann, M.; Borgström, S.; Breuste, J.; Gomez-Baggethun, E.; Gren, Å.; Hamstead, Z.; Hansen, R. A quantitative review of urban ecosystem service assessments: Concepts, models, and implementation. Ambio 2014, 43, 413–433. [Google Scholar] [CrossRef] [Green Version]
  29. Zhang, H.; Chen, B.; Sun, Z.; Bao, Z. Landscape perception and recreation needs in urban green space in Fuyang, Hangzhou, China. Urban For. Urban Green. 2013, 12, 44–52. [Google Scholar] [CrossRef]
  30. Zhang, X.; Ni, Z.; Wang, Y.; Chen, S.; Xia, B. Public perception and preferences of small urban green infrastructures: A case study in Guangzhou, China. Urban For. Urban Green. 2020, 53, 126700. [Google Scholar] [CrossRef]
  31. Wendel, H.E.W.; Zarger, R.K.; Mihelcic, J.R. Accessibility and usability: Green space preferences, perceptions, and barriers in a rapidly urbanizing city in Latin America. Landsc. Urban Plan. 2012, 107, 272–282. [Google Scholar] [CrossRef]
  32. White, E.V.; Gatersleben, B. Greenery on residential buildings: Does it affect preferences and perceptions of beauty? J. Environ. Psychol. 2011, 31, 89–98. [Google Scholar] [CrossRef] [Green Version]
  33. Miller, S.M.; Montalto, F.A. Stakeholder perceptions of the ecosystem services provided by Green Infrastructure in New York City. Ecosyst. Serv. 2019, 37, 100928. [Google Scholar] [CrossRef]
  34. Cvejić, R.; Eler, K.; Pintar, M.; Železnikar, Š.; Haase, D.; Kabisch, N.; Strohbach, M.; Haase, D. Green Surge Report D3.1: A Typology of Urban Green Spaces, Ecosystem Services Provisioning Services and Demands. 2015. Available online: https://ign.ku.dk/english/green-surge/rapporter/D3.3__Classification_of_UGI.pdf (accessed on 15 September 2022).
  35. Haase, D.; Kabisch, N.; Pintar, M.; Strohbach, M.; Zeleznikar, S.; Cvejic, R.; Eler, K. Green Surge Report D3.3: Classification of UGI Based on Their Functionality, Services, Synergies, Trade-Offs and Spacial Conflicts. Version 1. 30th August 2016. Available online: https://ign.ku.dk/english/green-surge/rapporter/D3.3__Classification_of_UGI.pdf (accessed on 15 September 2022).
  36. Oberndorfer, E.; Lundholm, J.; Bass, B.; Coffman, R.R.; Doshi, H.; Dunnett, N.; Gaffin, S.; Köhler, M.; Liu, K.K.Y.; Rowe, B. Green Roofs as Urban Ecosystems: Ecological Structures, Functions, and Services. BioScience 2007, 57, 823–833. [Google Scholar] [CrossRef]
  37. Manso, M.; Teotónio, I.; Silva, C.M.; Cruz, C.O. Green roof and green wall benefits and costs: A review of the quantitative evidence. Renew. Sustain. Energy Rev. 2021, 135, 110111. [Google Scholar] [CrossRef]
  38. Bignante, E. The use of photo-elicitation in field research. EchoGéo 2010, 11. [Google Scholar] [CrossRef] [Green Version]
  39. Glaw, X.; Inder, K.; Kable, A.; Hazelton, M. Visual methodologies in qualitative research: Autophotography and photo elicitation applied to mental health research. Int. J. Qual. Methods 2017, 16, 1–8. [Google Scholar] [CrossRef]
  40. Barroso, F.L.; Pinto-Correia, T.; Ramos, I.L.; Surová, D.; Menezes, H. Dealing with landscape fuzziness in user preference studies: Photo-based questionnaires in the Mediterranean context. Landsc. Urban Plan. 2012, 104, 329–342. [Google Scholar] [CrossRef] [Green Version]
  41. Nassauer, J.I.; Wang, Z.; Dayrell, E. What will the neighbors think? Cultural norms and ecological design. Landsc. Urban Plan. 2009, 92, 282–292. [Google Scholar] [CrossRef]
  42. Hami, A.; Abdi, B. Students’ landscaping preferences for open spaces for their campus environment. Indoor Built Environ. 2021, 30, 87–98. [Google Scholar] [CrossRef]
  43. Van den Bogerd, N.; Dijkstra, S.C.; Seidell, J.C.; Maas, J. Greenery in the university environment: Students’ preferences and perceived restoration likelihood. PLoS ONE 2018, 13, e0192429. [Google Scholar] [CrossRef]
  44. State, K.; Hudson, M. Accessibility and Pressures of a Growing Student Population on Urban Green Spaces. Meliora Int. J. Stud. Sustain. Res. 2019, 2. [Google Scholar] [CrossRef]
  45. Akpinar, A. How is high school greenness related to students’ restoration and health? Urban For. Urban Green. 2016, 16, 1–8. [Google Scholar] [CrossRef]
  46. Speake, J.; Edmondson, S.; Nawaz, H. Everyday encounters with nature: Students’perceptions and use of university campus green spaces. Hum. Geogr.-J. Stud. Res. Hum. Geogr. 2013, 7, 21–31. [Google Scholar] [CrossRef] [Green Version]
  47. Casado-Arzuaga, I.; Onaindia, M.; Madariaga, I.; Verburg, P.H. Mapping recreation and aesthetic value of ecosystems in the Bilbao Metropolitan Greenbelt (northern Spain) to support landscape planning. Landsc. Ecol. 2014, 29, 1393–1405. [Google Scholar] [CrossRef]
  48. Schmidt, K.; Walz, A.; Martín-López, B.; Sachse, R. Testing socio-cultural valuation methods of ecosystem services to explain land use preferences. Ecosyst. Serv. 2017, 26, 270–288. [Google Scholar] [CrossRef]
  49. Negrín, F.; Hernández-Fernaud, E.; Hess, S.; Hernández, B. Discrimination of urban spaces with different level of restorativeness based on the original and on a shorter version of hartig et al.’s perceived restorativeness scale. Front. Psychol. 2017, 8, 1735. [Google Scholar] [CrossRef] [Green Version]
  50. Korpela, K.M.; Ylén, M.; Tyrväinen, L.; Silvennoinen, H. Determinants of restorative experiences in everyday favorite places. Health Place 2008, 14, 636–652. [Google Scholar] [CrossRef] [Green Version]
  51. Korpela, K.M.; Ylén, M.; Tyrväinen, L.; Silvennoinen, H. Favorite green, waterside and urban environments, restorative experiences and perceived health in Finland. Health Promot. Int. 2010, 25, 200–209. [Google Scholar] [CrossRef] [Green Version]
  52. Schwarz, N.; Moretti, M.; Bugalho, M.N.; Davies, Z.G.; Haase, D.; Hack, J.; Hof, A.; Melero, Y.; Pett, T.J.; Knapp, S. Understanding biodiversity-ecosystem service relationships in urban areas: A comprehensive literature review. Ecosyst. Serv. 2017, 27, 161–171. [Google Scholar] [CrossRef] [Green Version]
  53. Bernardo, F.; Loupa-Ramos, I.; Silva, C.M.; Manso, M. The Restorative Effect of the Presence of Greenery on the Classroom in Children’s Cognitive Performance. Sustainability 2021, 13, 3488. [Google Scholar] [CrossRef]
  54. Lai, S.; Deal, B. Parks, Green Space, and Happiness: A Spatially Specific Sentiment Analysis Using Microblogs in Shanghai, China. Sustainability 2023, 15, 146. [Google Scholar] [CrossRef]
Figure 1. Survey structure.
Sustainability 15 05334 g001
Figure 2. Urban simulations developed with variations on the roof access type and vegetation types.
Sustainability 15 05334 g002
Figure 4. Estimated marginal means of ecosystem services depending on vegetation type and roof access type.
Sustainability 15 05334 g004
Figure 5. Mean values of activities per simulation.
Sustainability 15 05334 g005
Figure 6. Estimated mean values of vegetation type and roof type for each activity.
Sustainability 15 05334 g006
Figure 7. Mean values of the Perceived Restorativeness Scale (PRS) and Restoration Outcome Scale (ROS) per simulation.
Sustainability 15 05334 g007
Figure 8. Estimated marginal means of the Perceived Restorativeness Scale (PRS) and Restoration Outcome Scales (ROS).
Sustainability 15 05334 g008
Table 1. Survey iterations and number of respondents per condition.
Simulation Combinations
A1IB2IIC3IIIIIIB1IC2IIA31IIC2IIIA3IB
N Total = 376466233423434563336
Table 2. Number of answers per simulation (total: 1128).
No
Vegetation
With Vegetation
ShrubsTrees
Elevated roof144113116
Ground-level roof129140152
No roof103123108
Total376376376
Table 3. Means and two-way ANOVA for ecosystem services.
Ecosystem
Services
VariablesNo
Vegetation
ShrubsTreesFSigPower
Vegetation1.123.033.57487.4240.0001.000
ExperienceRoof access2.302.522.9520.3440.0001.000
Veg* Roof access 4.0950.0030.918
Vegetation1.072.493.01295.3220.0001.000
EducationRoof access2.012.132.4710.7130.0001.000
Veg* Roof access 3.4930.0080.990
Vegetation2.193.383.61156.2410.0001.000
Physical UseRoof access2.942.983.307.0900.0011.000
Veg* Roof access 4.3440.0020.931
Vegetation2.603.603.86121.4220.0001.000
SocialRoof access3.193.303.597.8120.0001.000
Veg* Roof access 1.9710.0970.952
Vegetation1.723.634.05421.6150.0001.000
AestheticRoof access2.953.053.4411.4850.0000.994
Veg* Roof access 1.5680.1810.488
Vegetation1.183.093.57353.7250.0001.000
Air QualityRoof access2.412.522.9611.6130.0001.000
Veg* Roof access 3.9710.0030.994
Vegetation1.282.953.47273.8810.0001.000
ClimateRoof access2.412.442.8911.2170.0001.000
Veg* Roof access 2.3790.0500.992
Water
Infiltration
Vegetation1.192.963.21220.9870.0001.000
Roof access2.432.232.7613.0730.0000.994
Veg* Roof access 2.6760.0310.747
Vegetation1.07 a2.99 b3.86 c396.7440.0001.000
HabitatRoof access2.29 a2.45 a2.81 b10.1480.0000.986
Veg* Roof access 2.7430.0270.759
a,b,c Different letters represent significantly different averages on the Bonferroni post-hoc test.
Table 4. Means and two-way ANOVA for activities.
ActivitiesVariablesNo VegetationShrubsTreesFSigPower
Roof access3.183.273.5610.2420.0000.987
WalkingVegetation2.663.493.86102.4460.0001.000
Veg* Roof access 1.9370.1020.587
Roof access3.263.303.493.9670.0190.712
Meeting friends and familyVegetation type2.813.463.8072.2020.0001.000
Veg* Roof 2.0310.0880.610
Roof access2.442.422.664.0500.0180.722
ExercisingVegetation type1.802.702.99107.3150.0001.000
Veg* Roof access 1.9230.1040.583
Roof access2.712.703.047.5840.0010.946
ReadingVegetation type1.983.013.42145.7010.0001.000
Veg* Roof access 2.3490.0530.683
Roof access2.342.462.8011.6040.0000.994
Contemplate the
landscape
Vegetation type1.572.693.30242.2450.0001.000
Veg* Roof access 6.2200.0000.989
Roof access2.902.903.164.4230.0120.762
Catch the sunVegetation type2.173.253.52135.7290.0001.000
Veg* Roof access 1.4740.2080.461
Roof access3.343.583.756.2010.0020.893
Walking the dogVegetation type2.733.894.03124.7900.0001.000
Veg* Roof access 1.3600.2460.427
Have picnicsRoof access2.021.972.276.8000.0010.920
Vegetation type1.312.292.64153.8870.0001.000
Veg* Roof access 4.2710.0020.929
Table 5. Perceived Restorativeness Scale (PRS) and Restoration Outcome Scale (ROS).
No VegetationShrubsTreesF (sig)
123ABCIIIIII
PRS Mean N2.04722.02172.04662.76812.78143.30573.17763.15663.663067.48 (0.000)
ROS Mean N1.72661.79361.73302.49342.56703.14843.05602.88653.527867.74 (0.000)
Table 6. Two-way ANOVA results for the Perceived Restorativeness Scale (PRS).
No VegetationShrubsTreesFSigPower
Vegetation2.0383 a2.9489 b3.3085 c241.2270.0001.000
Roof access2.6172 a2.6841 a3.0329 b20.7930.0001.000
Vegetation* Roof access 4.7750.0010.955
a,b,c Different letters represent significantly different averages on the Bonferroni post-hoc test.
Table 7. Two-way ANOVA results for the Restoration Outcome Scale (ROS).
No VegetationShrubsTreesFSigPower
Vegetation1.7513 a2.7350 b3.1230 c239.2940.0001.000
Roof access2.3723 a2.4454 a2.8346 b21.3620.0001.000
Vegetation* Roof access 6.8300.0010.994
a,b,c Different letters represent significantly different averages on the Bonferroni post-hoc test.
Disclaimer/Publisher’s Note: The statements, opinions and data contained in all publications are solely those of the individual author(s) and contributor(s) and not of MDPI and/or the editor(s). MDPI and/or the editor(s) disclaim responsibility for any injury to people or property resulting from any ideas, methods, instructions or products referred to in the content.

