Article

Neighborhood-Level LCA and Hotspot Analysis of Embodied Emissions of a New Urban Area in Reykjavík

by
Hjördís Sóley Sigurðardóttir
1,
Jukka Heinonen
1,*,
Ólafur Ögmundarson
2 and
Áróra Árnadóttir
1
1
Faculty of Civil and Environmental Engineering, University of Iceland, Hjardarhagi 2-6, 107 Reykjavik, Iceland
2
Faculty of Food Science and Nutrition, University of Iceland, Aragata 14, 101 Reykjavik, Iceland
*
Author to whom correspondence should be addressed.
Sustainability 2023, 15(6), 5327; https://doi.org/10.3390/su15065327
Submission received: 17 February 2023 / Revised: 9 March 2023 / Accepted: 13 March 2023 / Published: 17 March 2023

Abstract

:
The built environment sector causes significant climate change impacts, which indicates an opportunity for the sector to be of great importance in reducing its global impact. The main strategy has focused on urban density and transport as well as studying the emissions caused by buildings with life-cycle assessments (LCAs). However, a holistic approach is often missing, where life-cycle environmental impacts are assessed, and goals are considered at the planning stage. This study proposes LCA on a neighborhood scale for a holistic approach and to identify how LCA can be used to reduce impacts when designing and for decision-making at the planning stage. The focus is on the pre-use phase because that phase has been proven to cause a significant spike in carbon emissions when considering the near future and is crucial in reaching climate goals. The study case is a new neighborhood plan in Reykjavík, Iceland. The assessment focuses on the climate change impact of building a new neighborhood. The study identifies materials as a key factor. It demonstrates how the total emissions of the neighborhood are reduced when more environmentally friendly materials are replaced by traditional ones. It reduces GHG emissions by up to 40% in total.

1. Introduction

Since the Industrial Revolution, human behavior has impacted Earth’s stability greatly, as scientific evidence has proven, and it is the leading factor of global environmental changes, where climate change is considered one of the biggest threats [1], and the development trends are alarming. How humans will succeed in forming urban developments will have a significant impact on the future of our epoch, the Anthropocene, which is characterized by human activities causing pressure on the Earth system [2]. The human pressure on Earth’s system is increasingly connected to urbanization, and the UN world cities report from 2020 states that cities account for 70% of global carbon emissions and they consume 2/3 of the world’s energy [3]. An important role is played by the impervious surfaces which dominate in urban settlements [4]. According to Unep-Sbi [5], 37% of the global energy-related CO2 emissions came from the construction and operation of buildings in 2020, compared to 38% in 2019.
While the climate impact from urban settlements has been recognized long ago, densification has been the proposed solution to reduce greenhouse gas (GHG) emissions in planning settlements. The emphasis has been revealed in a broad range of literature that high-density mixed-use developments with high-rise buildings lead to lower energy use for housing and reduce reliance on private cars [6,7,8,9,10]. However, when considering overall consumption, life in less dense areas can be less GHG-intensive. The indirect emissions of urbanization are often not accounted for in studies, and the average urban citizen often has a higher income, more leisure time to spend, travels more by airplane, and uses goods and services outside of their homes to a greater extent than people in rural areas [11].
The use of a life cycle assessment (LCA) as a method for assessing the environmental impacts of buildings has become well-established [12,13,14,15,16,17] and is considered the most comprehensive way to assess the environmental impacts related to buildings [18]. In LCA studies of buildings, the emphasis has been on the use phase, which has led to the development of buildings becoming more energy efficient [19]. However, a shift of focus has occurred in today’s literature, where more attention is now on the pre-use phase regarding building materials than before [15,20,21,22,23,24]. The construction materials and the pre-use phase overall are causing much higher emissions than previously considered and form a significantly higher share of the overall whole life cycle emissions than has been reported in many earlier studies [15,21,22,24]. While this is related to the decline in use phase emissions intensity, it also relates to an improved understanding of the importance of the emissions related to the built environment development phase. It can be well above 50% of buildings’ overall life cycle emissions within a 50-year timespan and not 10% as it has often been assumed [24]. Moreover, the construction of low-energy buildings can generate more GHG emissions than the construction of conventional buildings [24]. The embodied emissions in construction materials are becoming crucial when building new settlements and could be a very important mitigation option for effectively reducing the emissions as fast as possible [25,26].
However, little focus has been paid to the built environment in a larger scope, like cities and neighborhoods, which is evident in the scarce literature on the matter [13,14,15,16,17]. These larger-scale systems, like neighborhoods and cities, have the potential for addressing the early-stage design and decision-making process to minimize the environmental impacts caused by the future built environment [13,15,16,17] since many of the major design decisions are taken at this stage [15,20,23,27]. Early design phase LCAs allow material replacement, which has high potential as a mitigation option [23,28]. The current literature on LCA studies at the neighborhood scale varies in complexity, which makes a comparison between studies difficult [15,16,22]. The system boundary ranges from studies of clusters of buildings to more complex studies taking other aspects of the neighborhood into account, like mobility, infrastructure, other spaces, and networks [15,22]. The assessment scope regarding the built environment often seems to be limited when conducting an LCA study, which frequently excludes important systems that are an integral part of development, such as the infrastructure, construction site, and technical building equipment. These systems could add significantly to the spike of emissions from what often is reported [12]. Including the infrastructure, water, and sewage systems in assessing a new residential area can add around 9% to the GHG emission at the pre-use phase [24]. Also related to the pre-use phase, the construction site has been reported to add 3–15% to the emissions and technical building equipment about 7% [12]. However, neighborhood-scale studies have shown that buildings account for the largest part of the overall emissions of the neighborhoods [15,16].
While the embodied emissions of materials can account for over 40% of overall emissions on a neighborhood scale [15], using wood as the main building material can reduce this share to under 20%, even while using passive house standards and on-site energy production [22]. This highlights the benefits of setting ambitious climate goals already in the planning phase, including building materials. Wood is considered an important building material for climate change mitigation options, as it produces fewer emissions during the production phase compared to other construction materials, such as steel and concrete, and it works as a tool for carbon sequestration [29].
Other promising bio-based material options regarding material replacements to reduce environmental emissions are straw and hemp-based building elements, where the straw-based materials show the most favorable outcome for reducing the emissions [30,31]. Concerning material durability and life span, the use of circular design options can be useful for getting a better result from the long-term environmental perspective [32]. By using a leaner design with durable materials and flexibility for changes of use in the future, the life cycle environmental performance can be significantly improved [27], especially because the physical life span when a building reaches its technical limit is usually not the building’s actual life span, but rather the functional life span, as societal changes and loss of value are a more common cause of a building’s end of life [33].
In Iceland, until recently, environmental issues have not been of focus in relation to the Icelandic building sector. This new shift in focus is demonstrated in a new chapter in the Icelandic Climate Action plan that aims at reducing GHG emissions from the building sector [34]. However, there are challenges in tracing the impact of the construction industry because a large part of it is connected to materials and the construction phase of buildings, which are typically imported. At the same time, the GHG emissions from the built environment development in Iceland are significant: a recent assessment estimated the annual load from Icelandic buildings at 360,000 t CO2eq/year, of which 58% are embodied emissions [35]. The embodied emissions have a pronounced role in Iceland due to the geothermal heat and hydropower-based stationary energy system. However, despite these renewable energy sources, energy use still accounts for around 30% of the life cycle emissions of Icelandic buildings, and the average Icelandic household uses 4–5 tons of hot water per square meter per year, mainly for heating [36]. If covering all the components of the built environment, such as roads and bridges, the emission would even be higher [35]. This also applies to building LCAs, which typically omit all the built-up areas that serve the buildings included in the assessment [12]. Therefore, studies of the construction sector should cover all relevant components related to the assessment object. This can be addressed by looking at development projects at a larger scale, like urban plans and individual neighborhood development projects, which include buildings and infrastructure systems and all other outer elements relating to the development at the studied neighborhood or site.
Today, on the one hand, urban plans normally implement a standard environmental impact assessment (EIA) according to the act on the environmental assessment of plans and planning laws which mostly focuses only on local impacts [37,38]. On the other hand, LCA studies have focused on individual buildings lacking a larger scale in terms of the planning of urban developments and site planning stages [15,16,17]. Therefore, there seems to be a research gap to be filled where these larger scale views are taken into account with the global impacts in a similar way as LCA has been carried out for buildings in achieving a holistic view.
This paper aims to analyze how LCA on a new urban plan can contribute to reducing the GHG emissions of a new urban area. The focus is on how LCA can provide information for the planning as well as for policymakers, already at the design phase, to make informed decisions regarding environmental improvements and to have a holistic global view of the impacts caused by the construction of future developments. Important decisions are taken at this scale concerning infrastructure, open areas, and building types, their density and sizes, which greatly affect the construction phases taking place later in the process. In addition, materials used for construction are rarely addressed at this urban scale which the paper considers highly relevant and should be considered as one of the important factors. The focus of this paper is on investigating the environmental impacts caused by the pre-use phase of a plan for a new neighborhood for ~1700 residents with ~100,000 m2 of floor space to be built in the near future in Reykjavík, Iceland, using LCA to capture the global impacts. The estimated impacts are studied from conventional construction methods and materials mostly used in Iceland, with a concrete cast on site. More importantly, the dominance of using concrete for building construction also applies to most locations globally [39]. With the results from the LCA of the site plan using the conventional method of construction and materials, which will be referred to as the base case, the paper looks into other alternative options for reducing the environmental impact caused by the pre-use phase. This phase is carried out by using material replacement scenarios developed from hotspot analysis results. For comparability purposes to other similar studies, the focus regarding impact categories will be on GHG emissions, but other impact categories following the ReCiPe method [21] will be provided as an appendix. This adds to the knowledge about them in the built environment context and provides an additional benchmark for future studies.

2. Materials and Methods

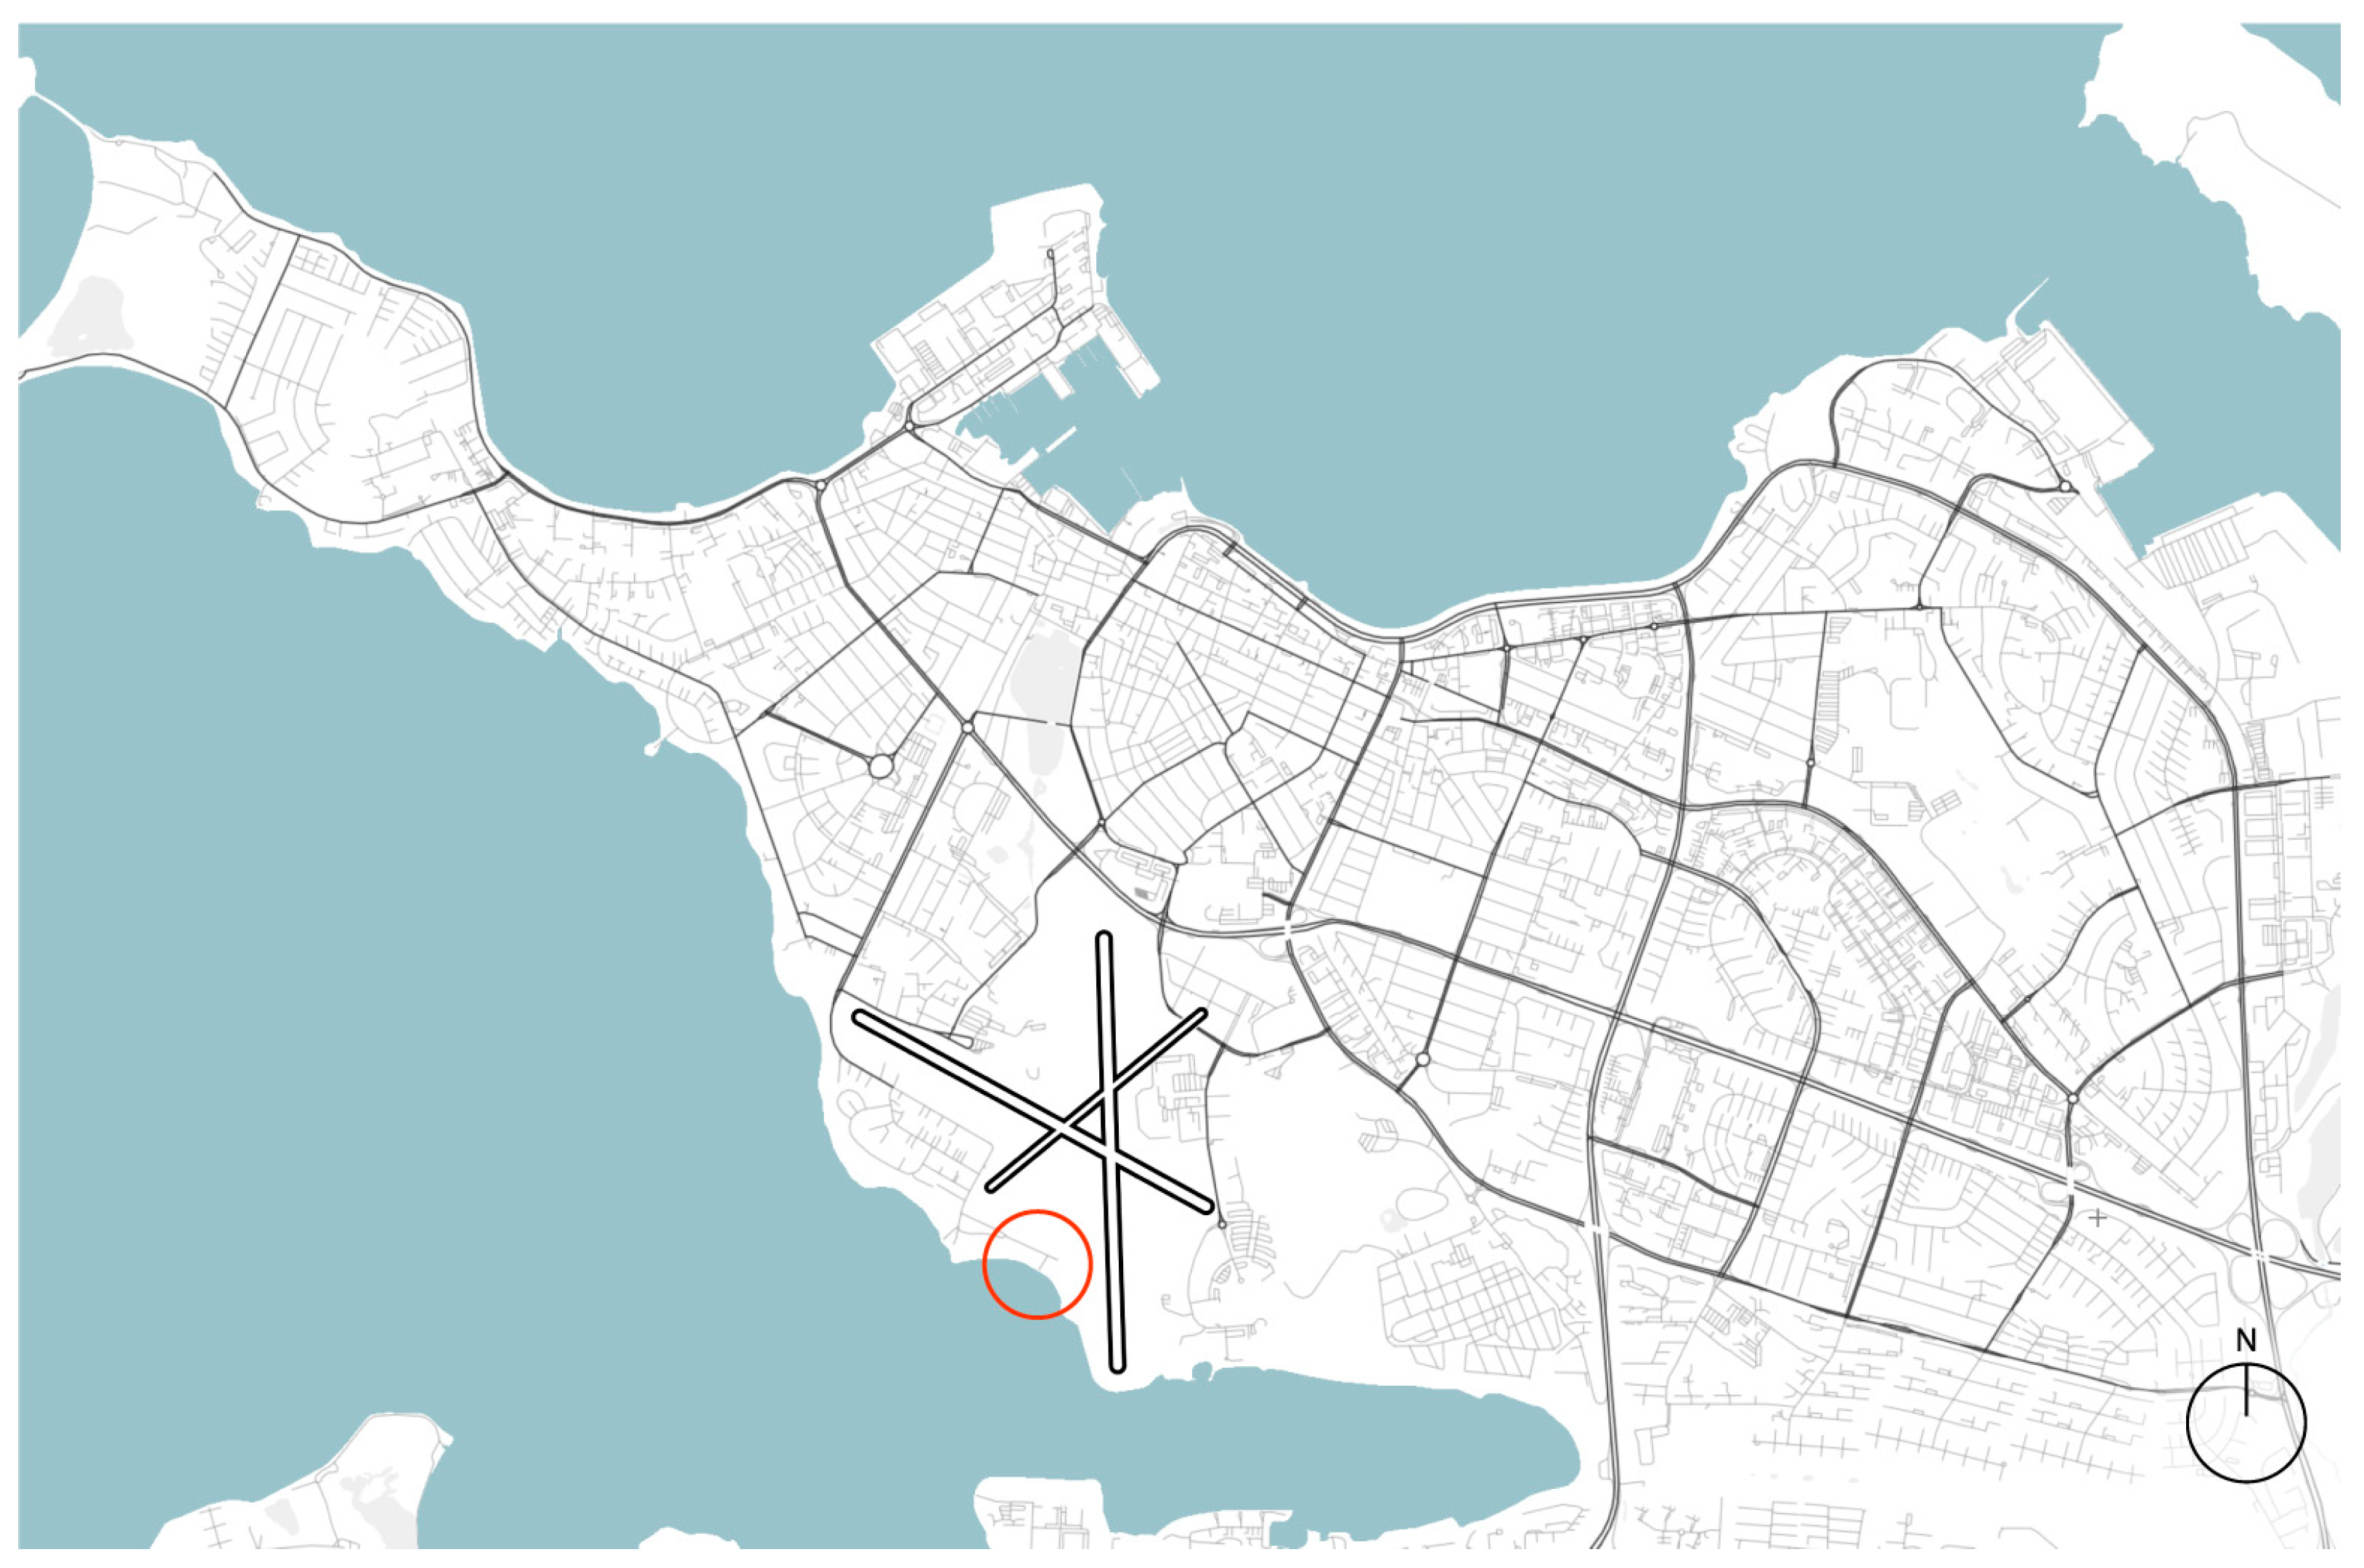
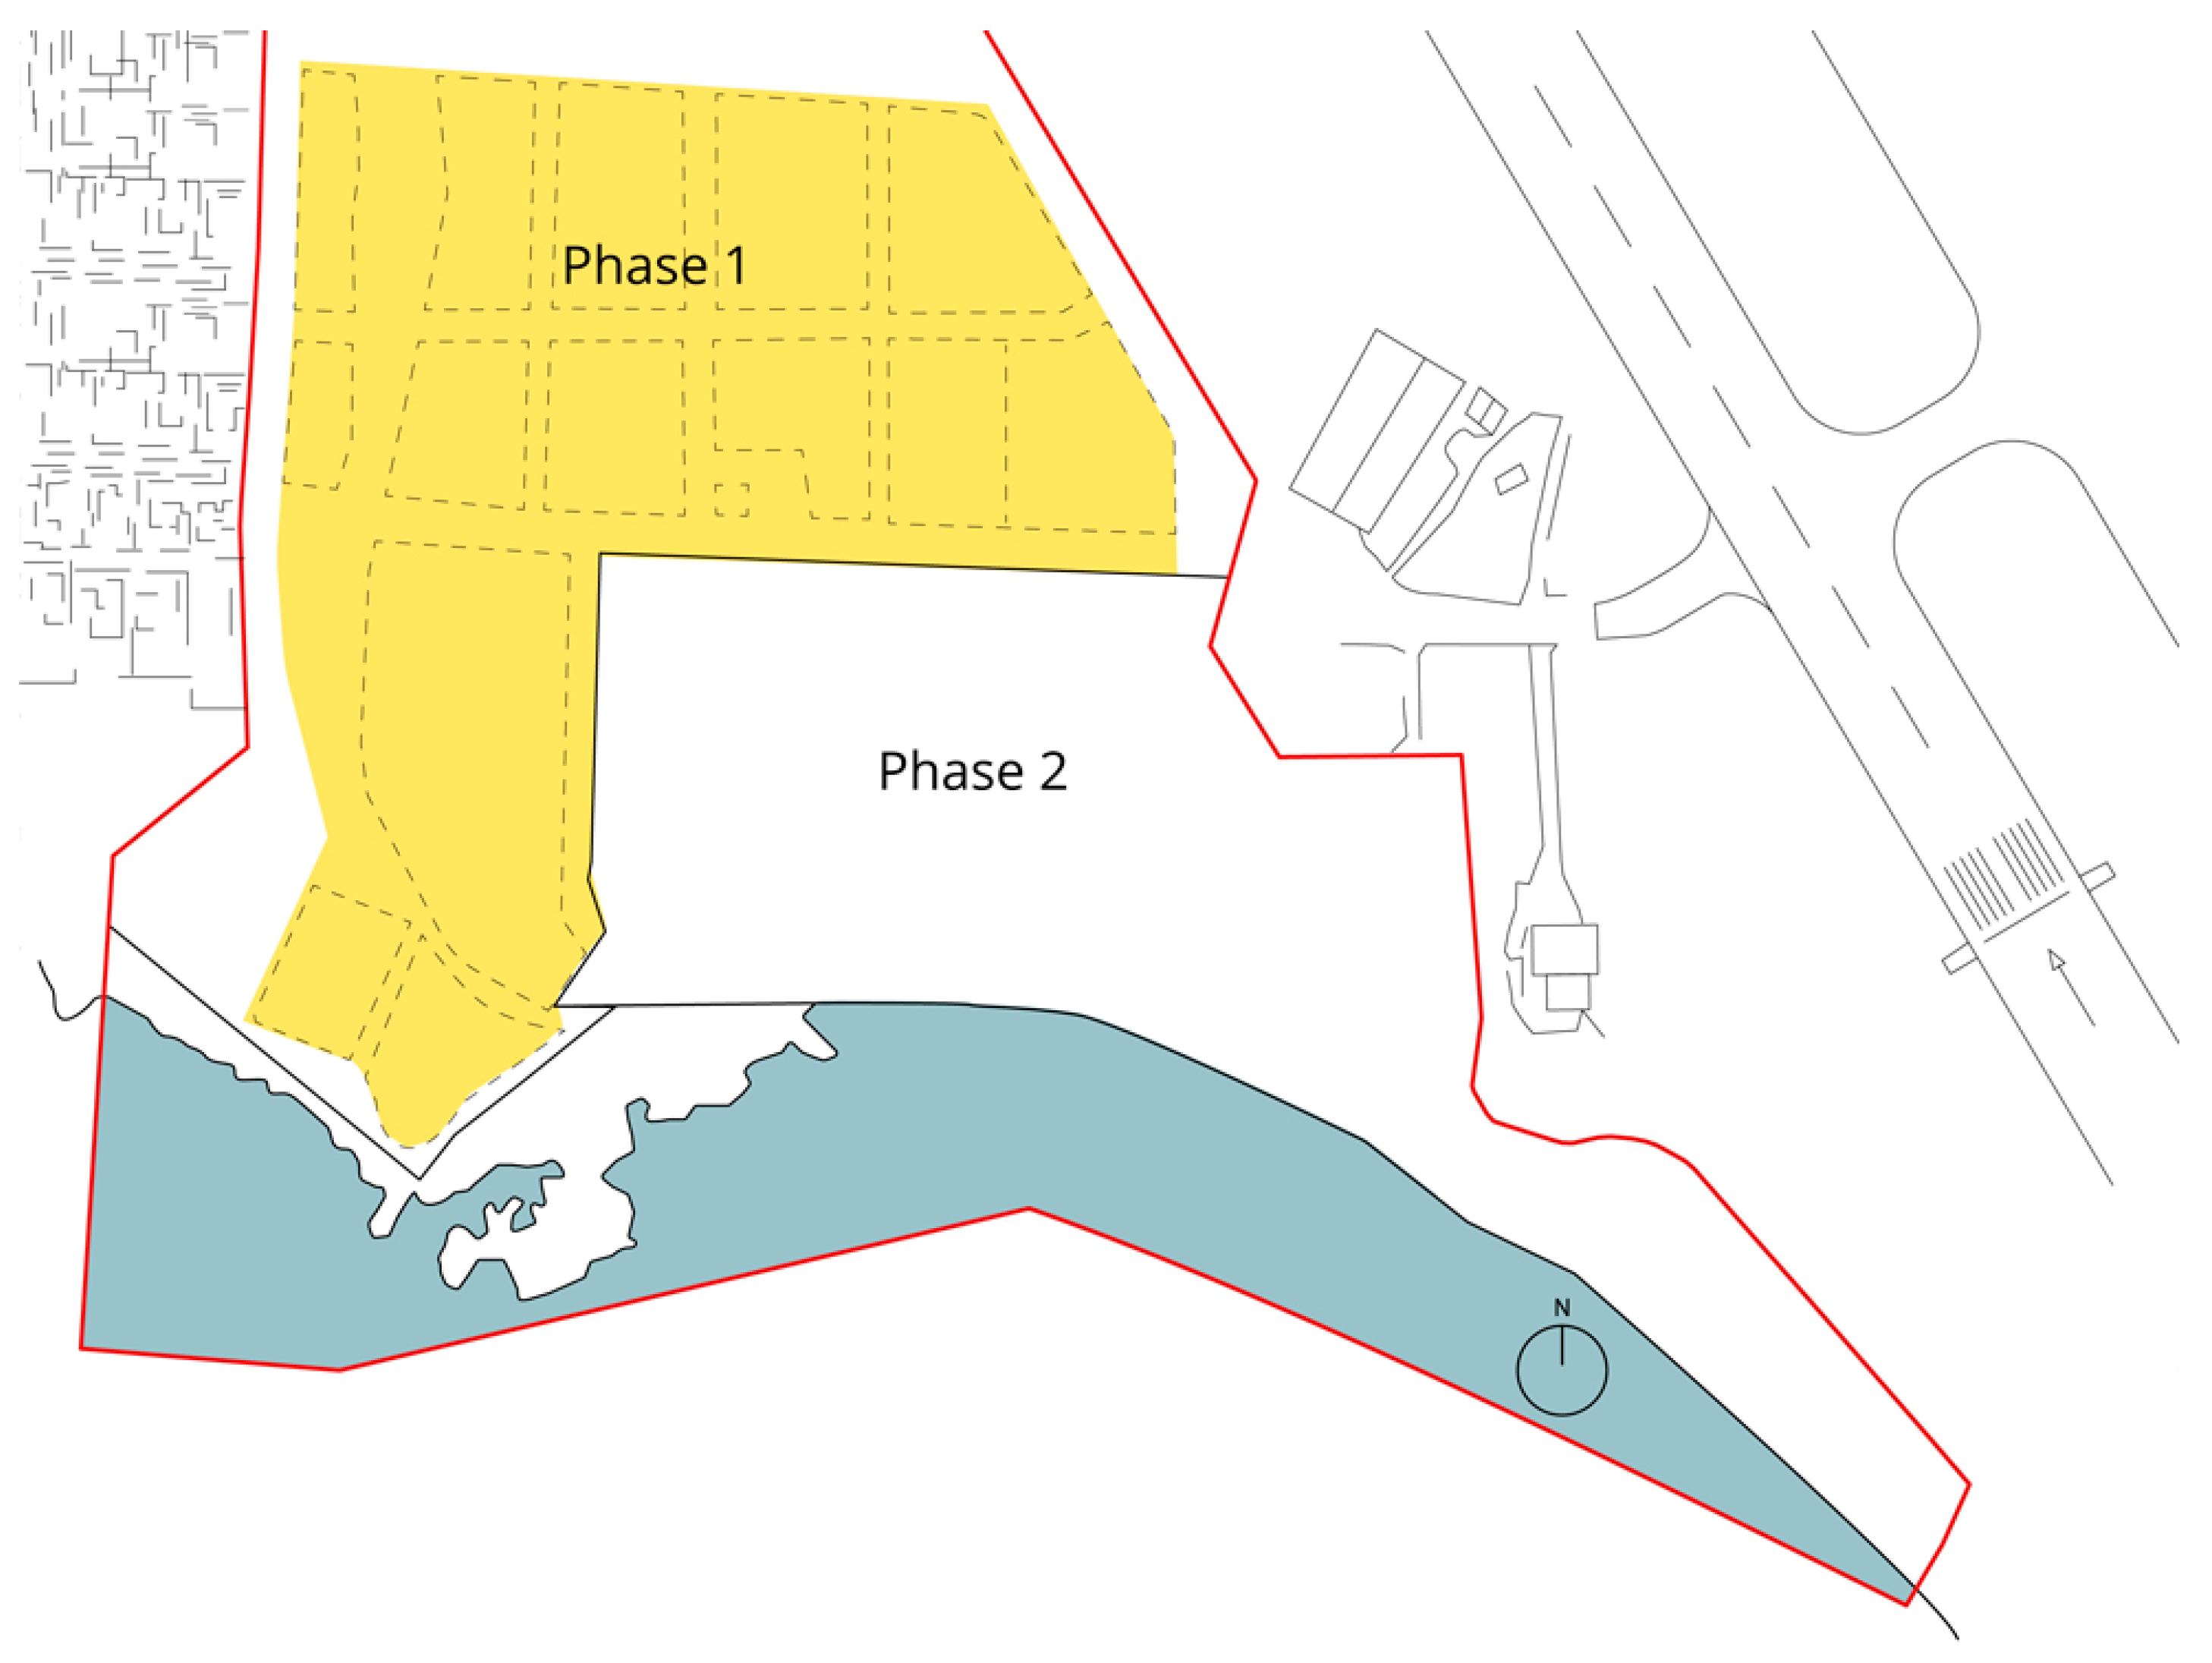
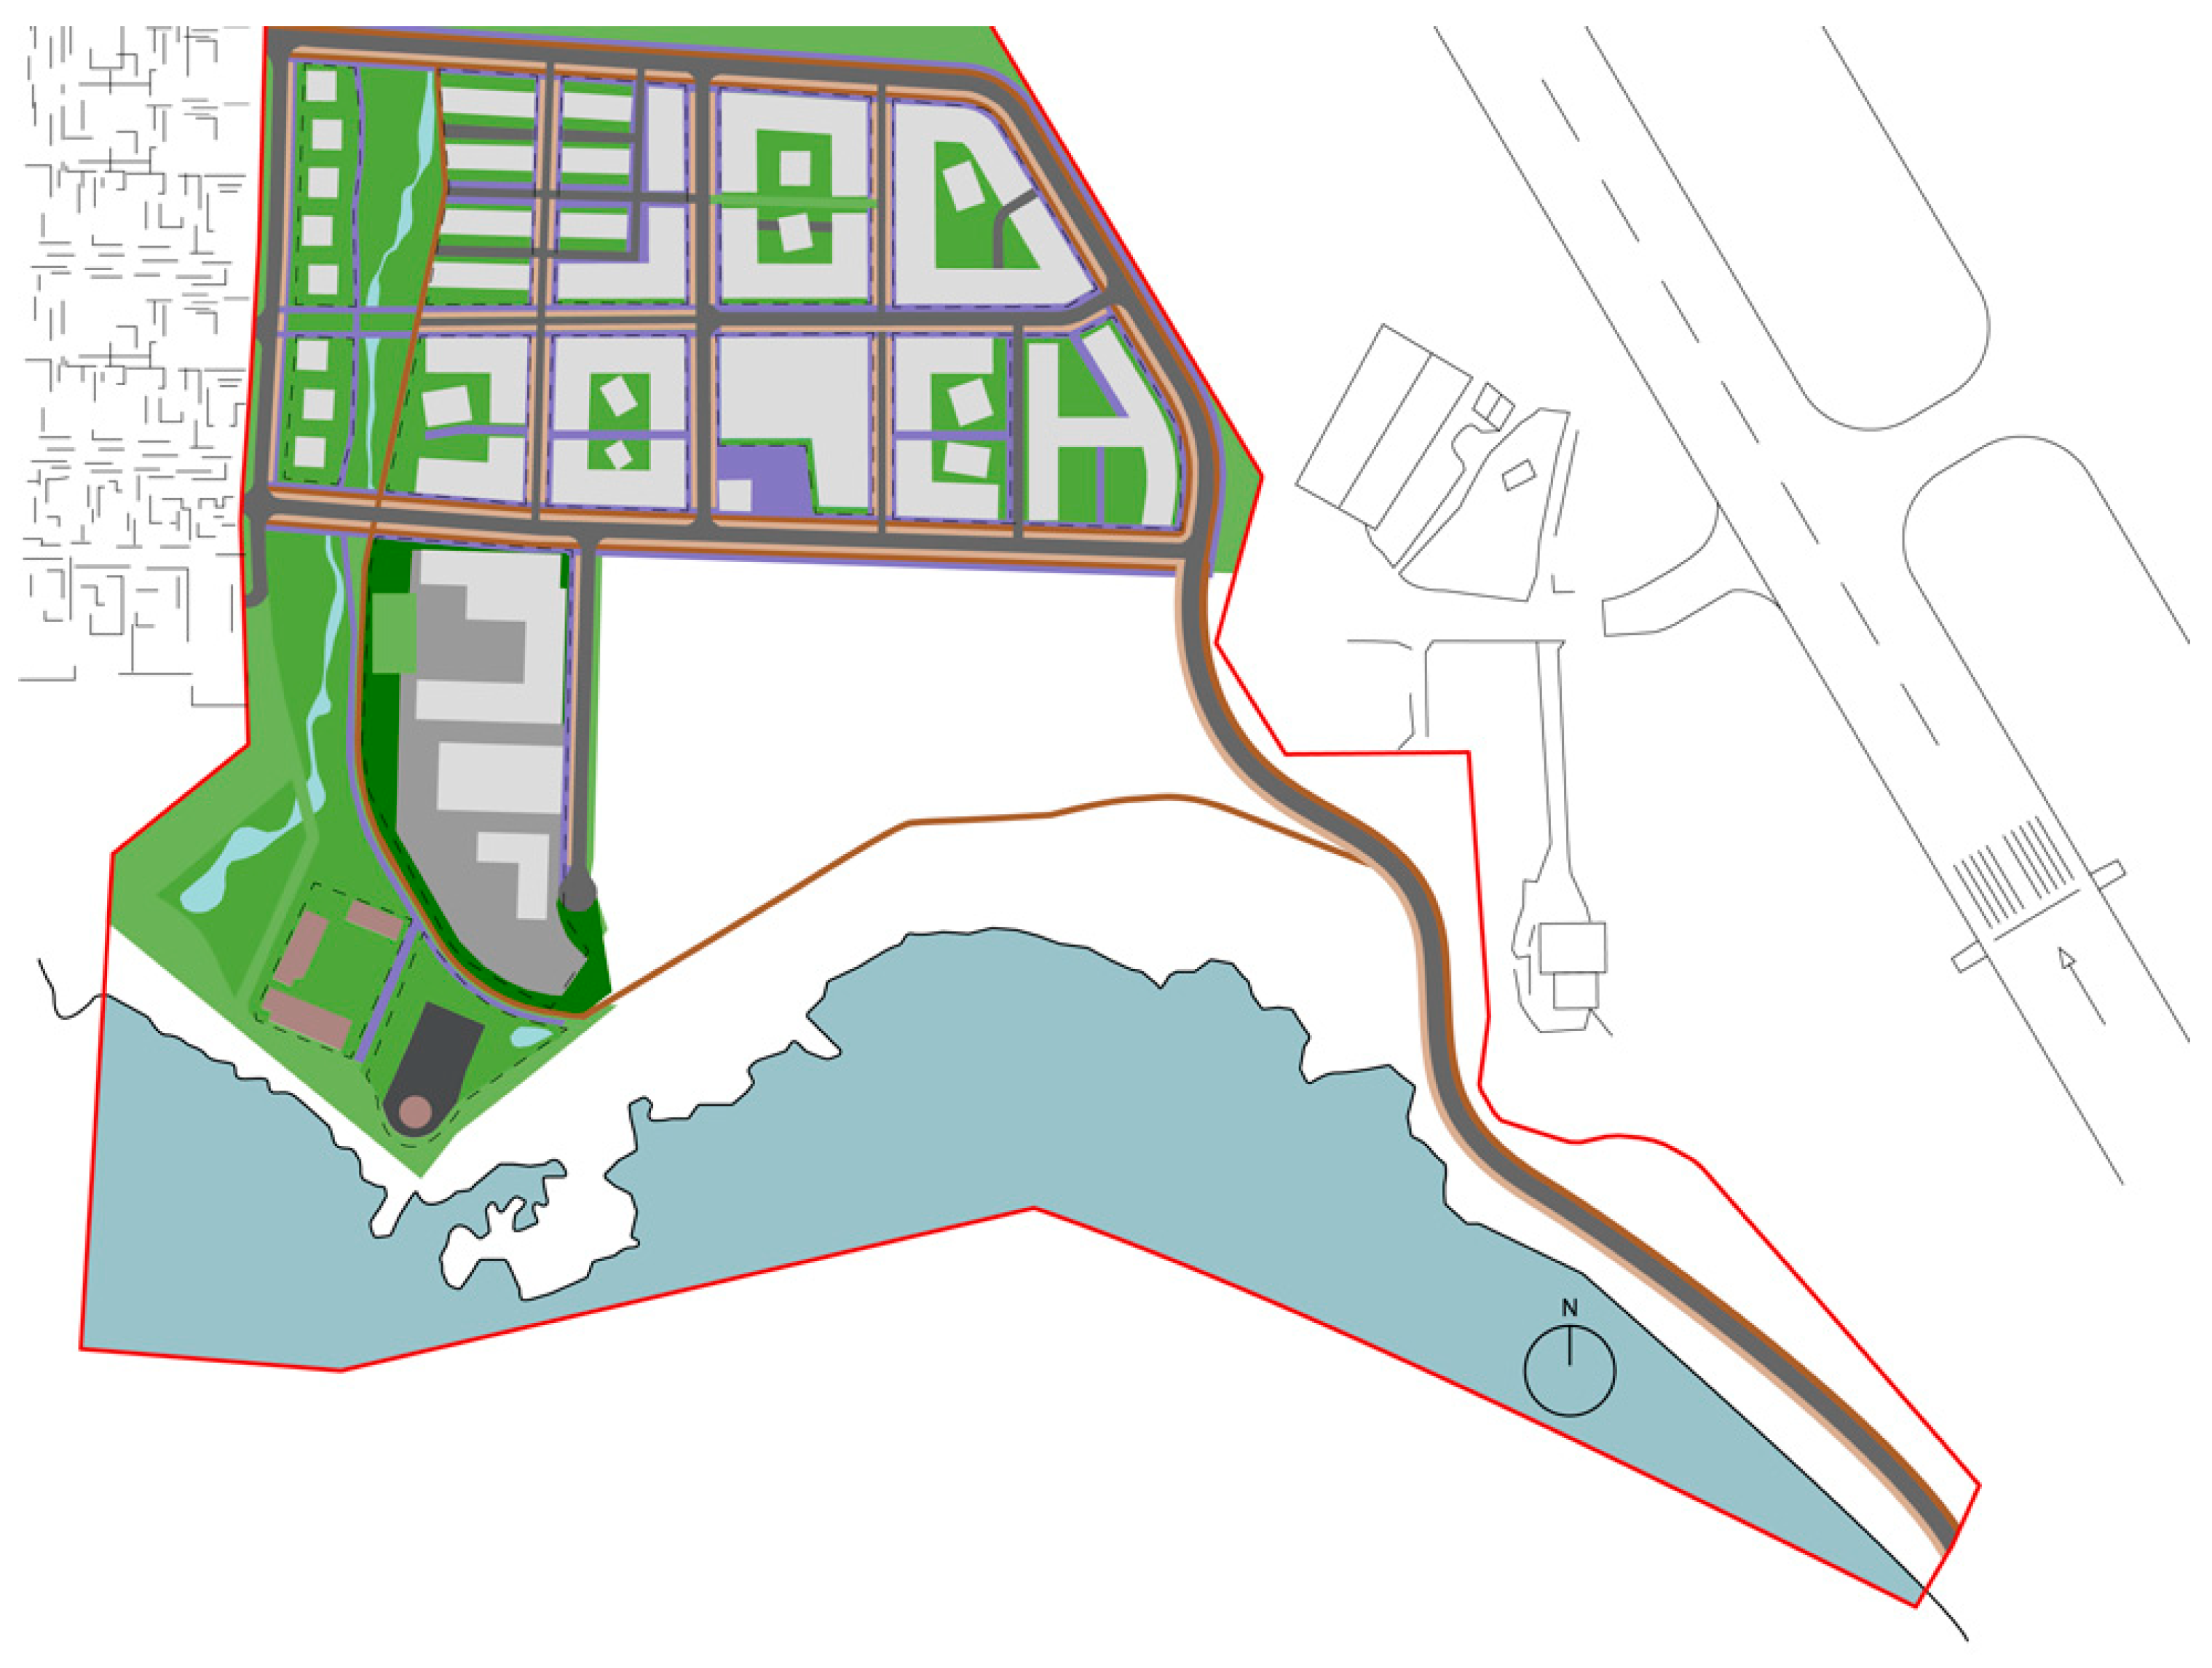
2.1. Case Study Description

The study area is New Skerjafjörður, the first phase, shown in Figure 1, with an area size of 950,000 m2. The planned building construction is 104,945 m2 on a building floor area of 59,790 m2. The plan is to build 685 residential apartments for around 1700 residents [40]. The New Skerjafjörður area is in central Reykjavík, the capital of Iceland, with a population of ~130,000 (~230,000 in the Reykjavík Capital Region). Reykjavík is the most northern capital city in the world, located in southwestern Iceland at latitude 64.13548 and longitude −21.89541 [41]. The weather conditions in Reykjavík are largely affected by the Gulf Stream, causing mild coastal weather. The average temperature in Reykjavík is 10.6 °C/51 °F in July, and in January, it is 0 °C/32 °F [42]. The Reykjavík municipal plan 2010–2030 defines New Skerjafjörður as a developing site with the aim of becoming a holistic and dense urban area. The focus is on sustainable and efficient urban development with better use of the city’s land, services, roads, and utility systems [43].
The Reykjavík municipal plan 2040 has divided New Skerjafjörður into two areas, Skerjafjörður 1 (12a), which is the first phase to be constructed, and Skerjafjörður 2 (12b), the second phase of the New Skerjafjörður construction. Together, New Skerjafjörður 1 and 2 are 1,750,000 m2 and are planned to have about 1300 apartments with around 3250 residents [44]. The division of the area is shown in Figure 2.
In the first phase of the development of the area, the site plan for New Skerjafjörður will be constructed as an explanatory drawing, as shown in Figure 3. It is divided into 13 sites, and each site has been given specific terms and conditions. The plan is to build 685 apartments, a kindergarten, an elementary school, a parking house, shops, and services, along with recreational areas and transportation constructions for cars, bikes, and pathways [45]. The second phase of New Skerjafjörður will be left out in this case study, and the focus is only on the first phase since that site plan is further ahead in the development phase and has been approved.
The site plan claims diverse architecture with a well-designed cityscape and a green look [45]. Different approaches are introduced in this plan regarding transportation and parking in the area from what is known in other neighborhoods of the city. Pedestrians and cyclists are the priority in the planning design, and car parking is only located in the middle of the area where a parking house will be situated, also facilitating a grocery store and some other services [45]. The neighborhood will be surrounded by various green areas and a coastline. Surface water will be cleaned with natural solutions (blue-green) before entering the utility system and the sea [45]. Table 1 shows the main sizes regarding the area and building load of the first phase of New Skerjafjörður.

2.2. Method

The LCA method can contribute to the built environment by understanding where the major hotspots come from and from which phase of the lifetime they appear [21,23]. The LCA phases are distinguished between the pre-use, use, and after-use phases [21], whereas this study only focuses on the pre-use phase. The product system studied is at the midpoint level of the mechanism, using midpoint impact categories which are 18 in total [21]. The study uses process LCA, a quantitative assessment focusing on assessing energy and mass flows, process by process [12,21,46]. The LCA is conducted according to ISO (the International Organization for Standardization) 14040 and 14044, which are standardizations for LCA [47,48].

2.3. Research Process

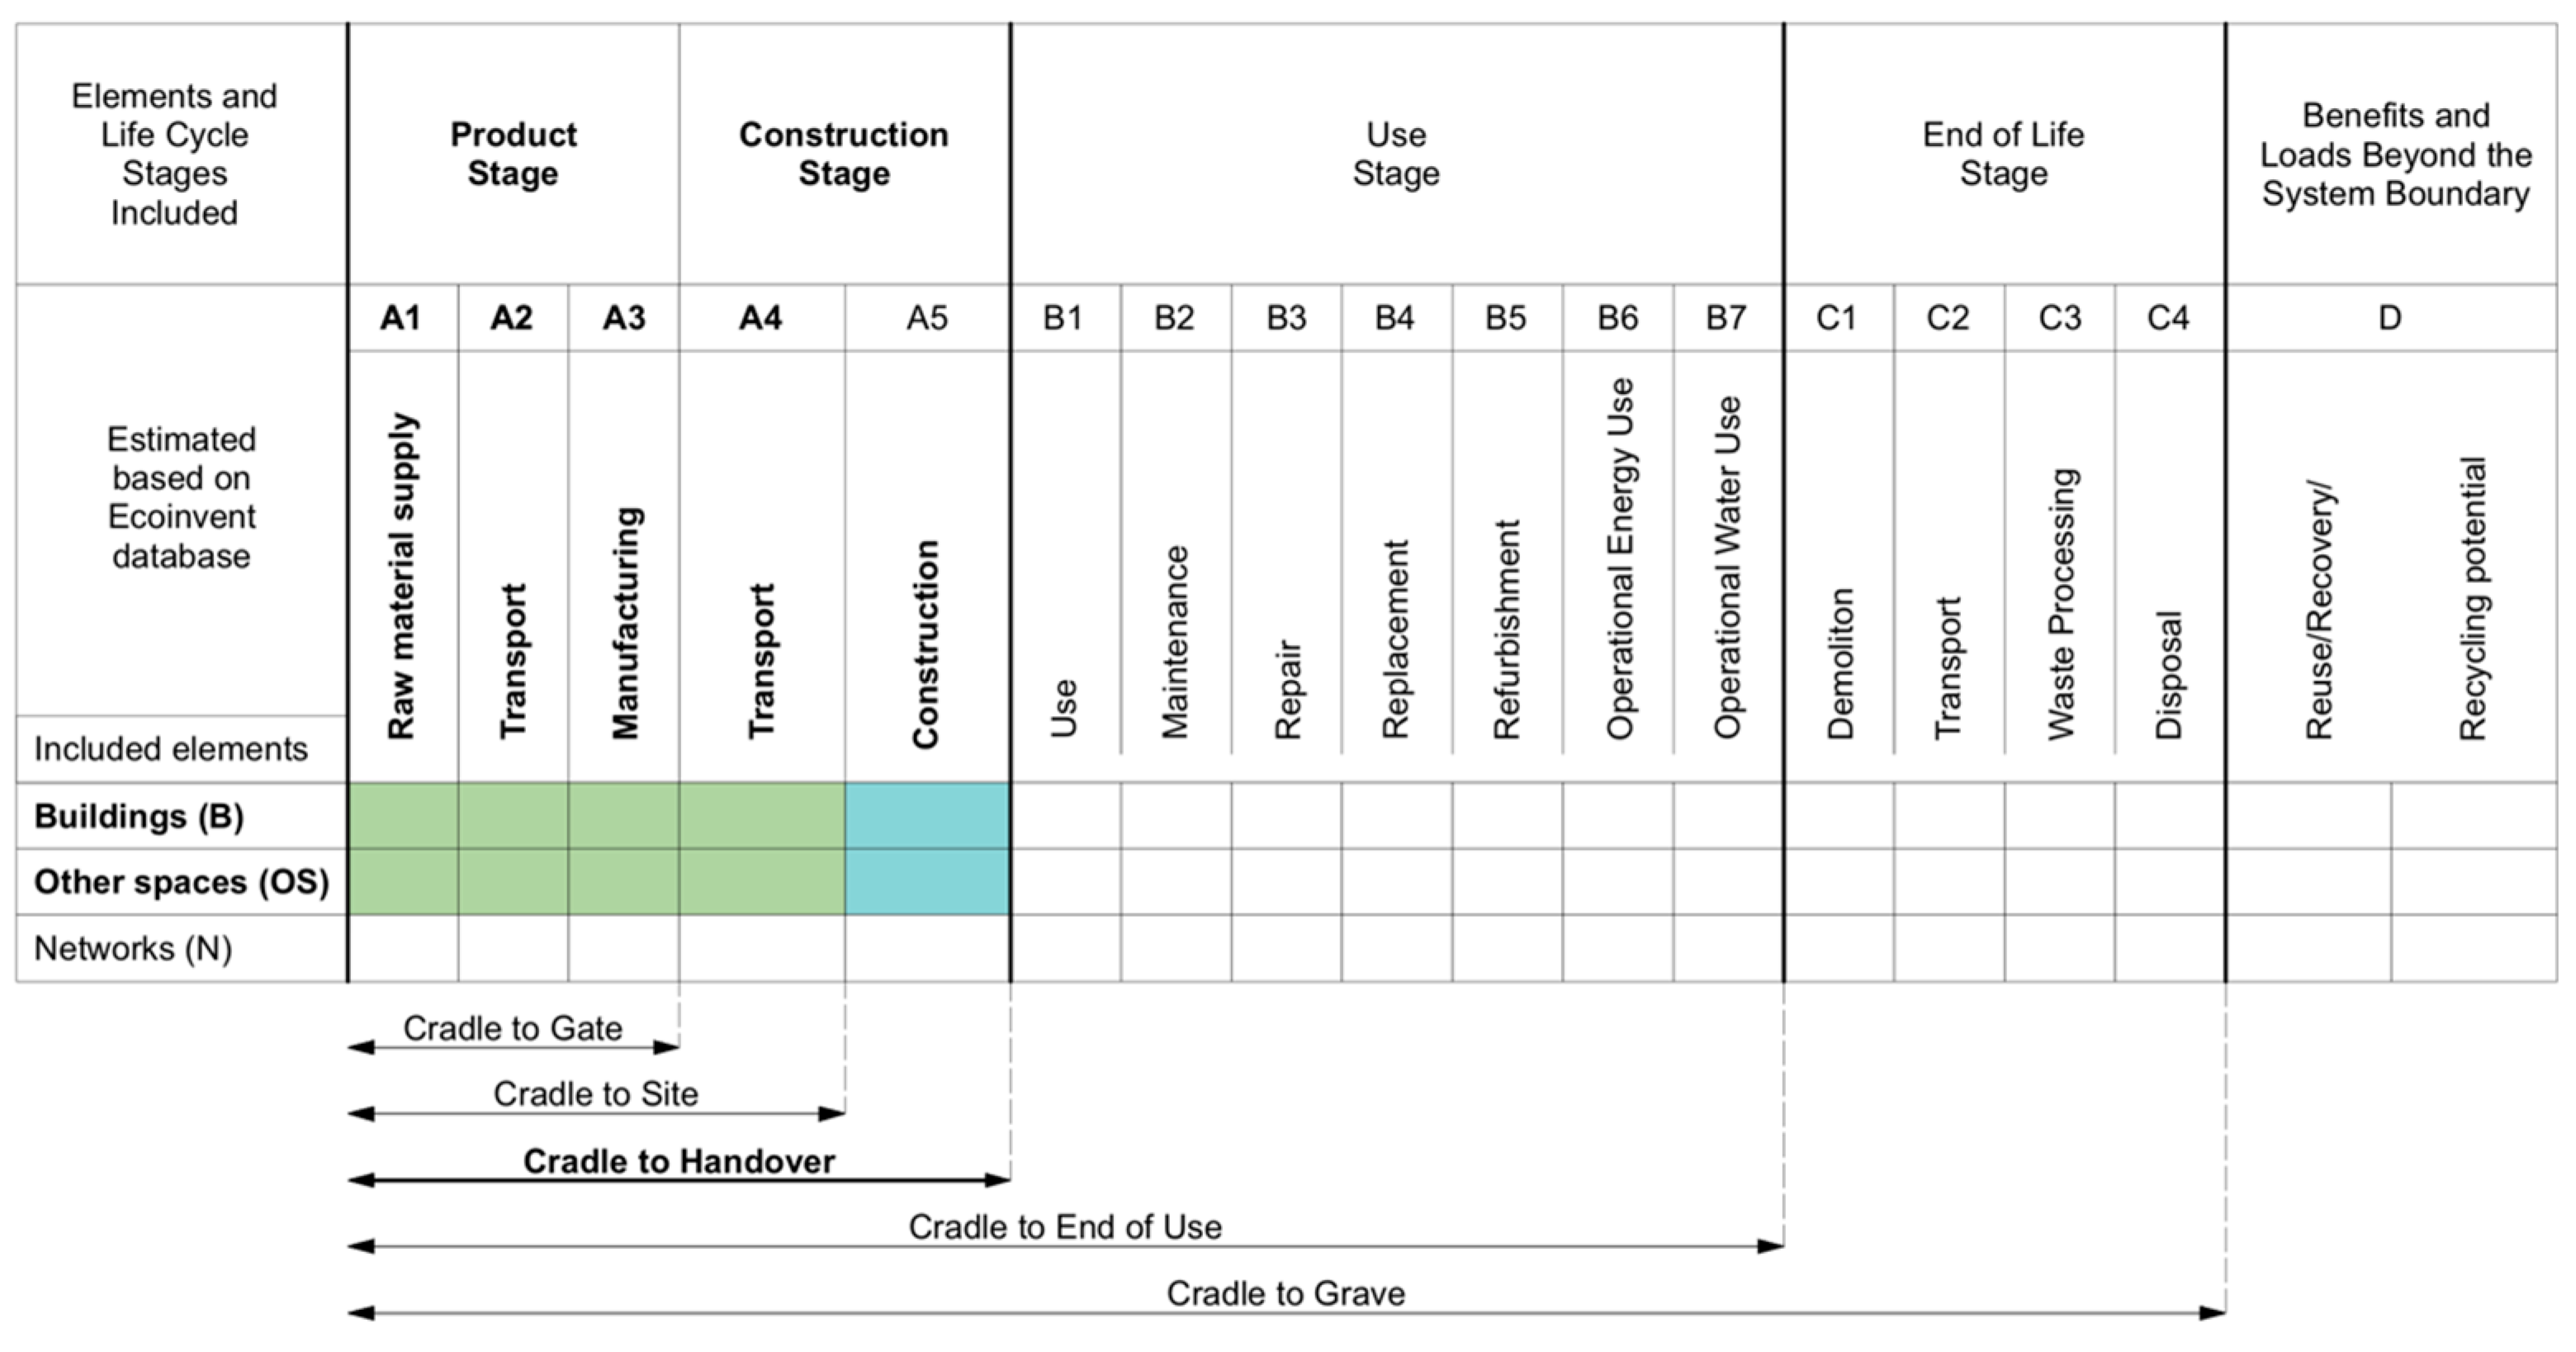
2.3.1. Goal and Scope Definition

The main goal of the study is to assess the environmental impacts from the pre-use phase of the first phase of New Skerjafjörður based on the neighborhood plan with a focus on GHG emissions. The goal is also to study what elements of the neighborhood of the pre-use phase cause the highest environmental load and how that impact can be reduced. The study used information from the approved site plan, its terms and conditions, and other supporting documents. The site plan document and special terms are used as the main information for conducting the LCA, along with images showing references for the building facades. The study divided the site plan into three main domains: Buildings (B), Other Spaces (OS), and Networks (N) to account for the environmental impacts. Detailed architectural drawings for the chosen site plan are not available. Therefore, with this information, further development of simple preliminary architectural drawings of the buildings was designed. Drawings of floor plans and facades were made to obtain more detailed information for the accounting of the material load for conducting the process LCA. The study used a simplified version when conducting the quantitative assessment for the Buildings (B) and Other Spaces (OS) since limitations are associated with a lack of detailed drawings to account for those domains. The Network (N) domain with systems such as heating pipes and electrical wiring is not accounted for in the study because of a lack of information.
First, the estimated impacts are studied from traditional construction methods and materials mostly used in Iceland, referred to in the study as the base case. It has been stated in a corresponding letter from the Reykjavík Planning Department that the majority of the buildings will most likely be constructed with a concrete cast on site as is traditionally done in Iceland [49]. With the results from the LCA of the site plan using the base case, some hotspot analyses are conducted. The hotspot analysis provides more detailed information on what elements are causing the highest emissions load. The study uses the information from the hotspot analysis to look into other alternative options for reducing the environmental impact effectively. Building material comparison and material replacement scenarios are studied as other alternatives. The material lifetime and durability are not assessed but are addressed through other literature in the discussion section. The study’s main functional unit (FU) is the overall area studied, with a total construction volume (Buildings and Other Spaces) of 178,855 m2. However, results for other relevant functional units are also presented in the results chapter, which focuses on different aspects of the neighborhood, and results utilizing one square meter (m2) of the gross area provide a comparison to other literature case studies:
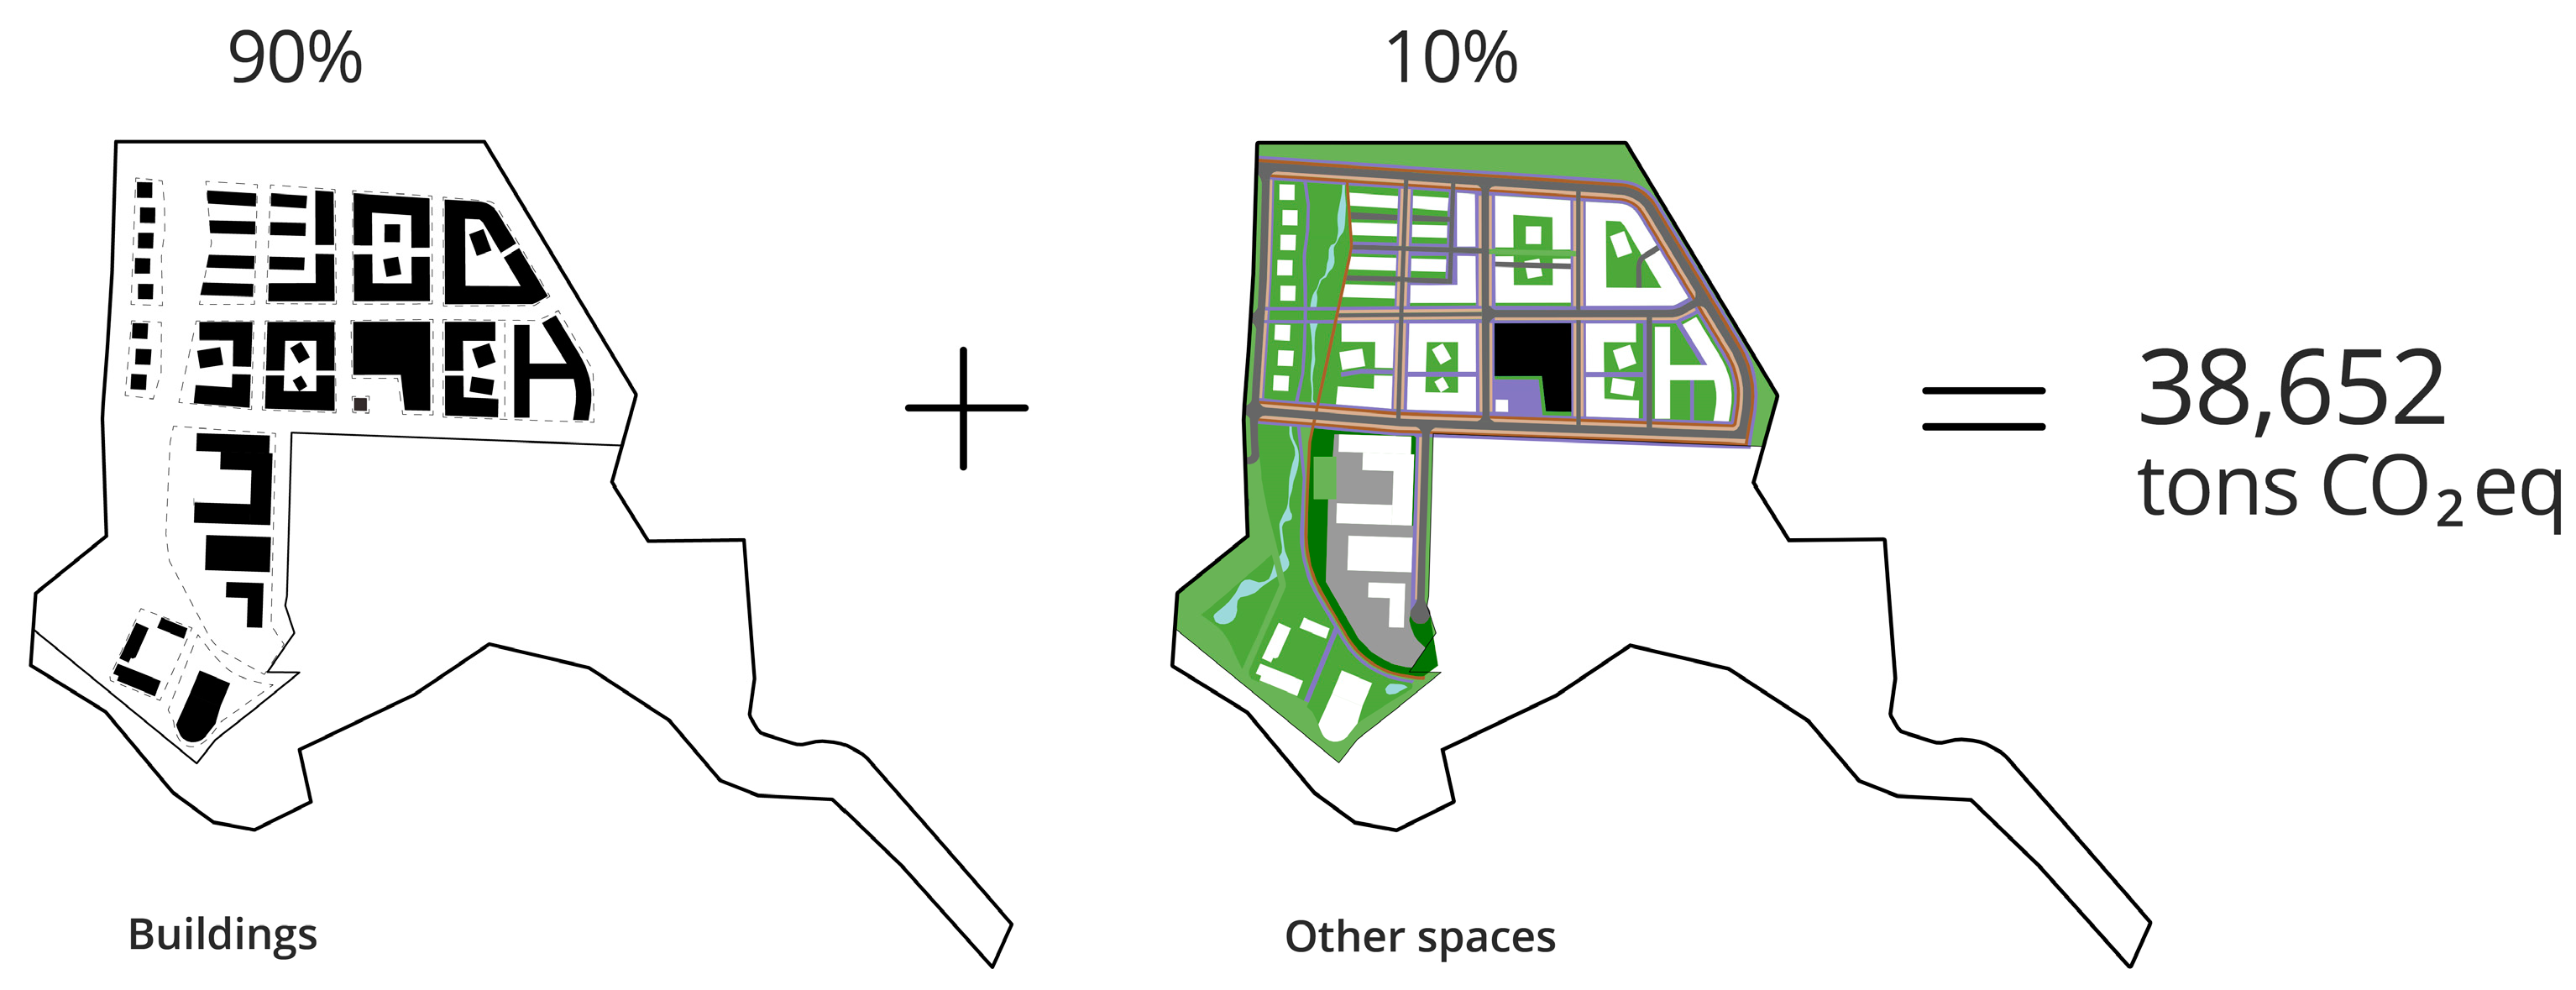
  • Emissions per one square meter (m2) of the gross area of the total construction volume of both Buildings and Other Spaces (178,850 m2).
  • All emissions from residential construction per m2 of the gross area of the residential spaces (67,520 m2).
  • All emissions from residential construction and constructions of related spaces per m2 of residential space (the related spaces taken into account from the Other Spaces domain, mainly parking house 6000 m2).
  • Emissions from total residential construction and related spaces per resident.
  • Emissions from total residential construction and related spaces per residence.
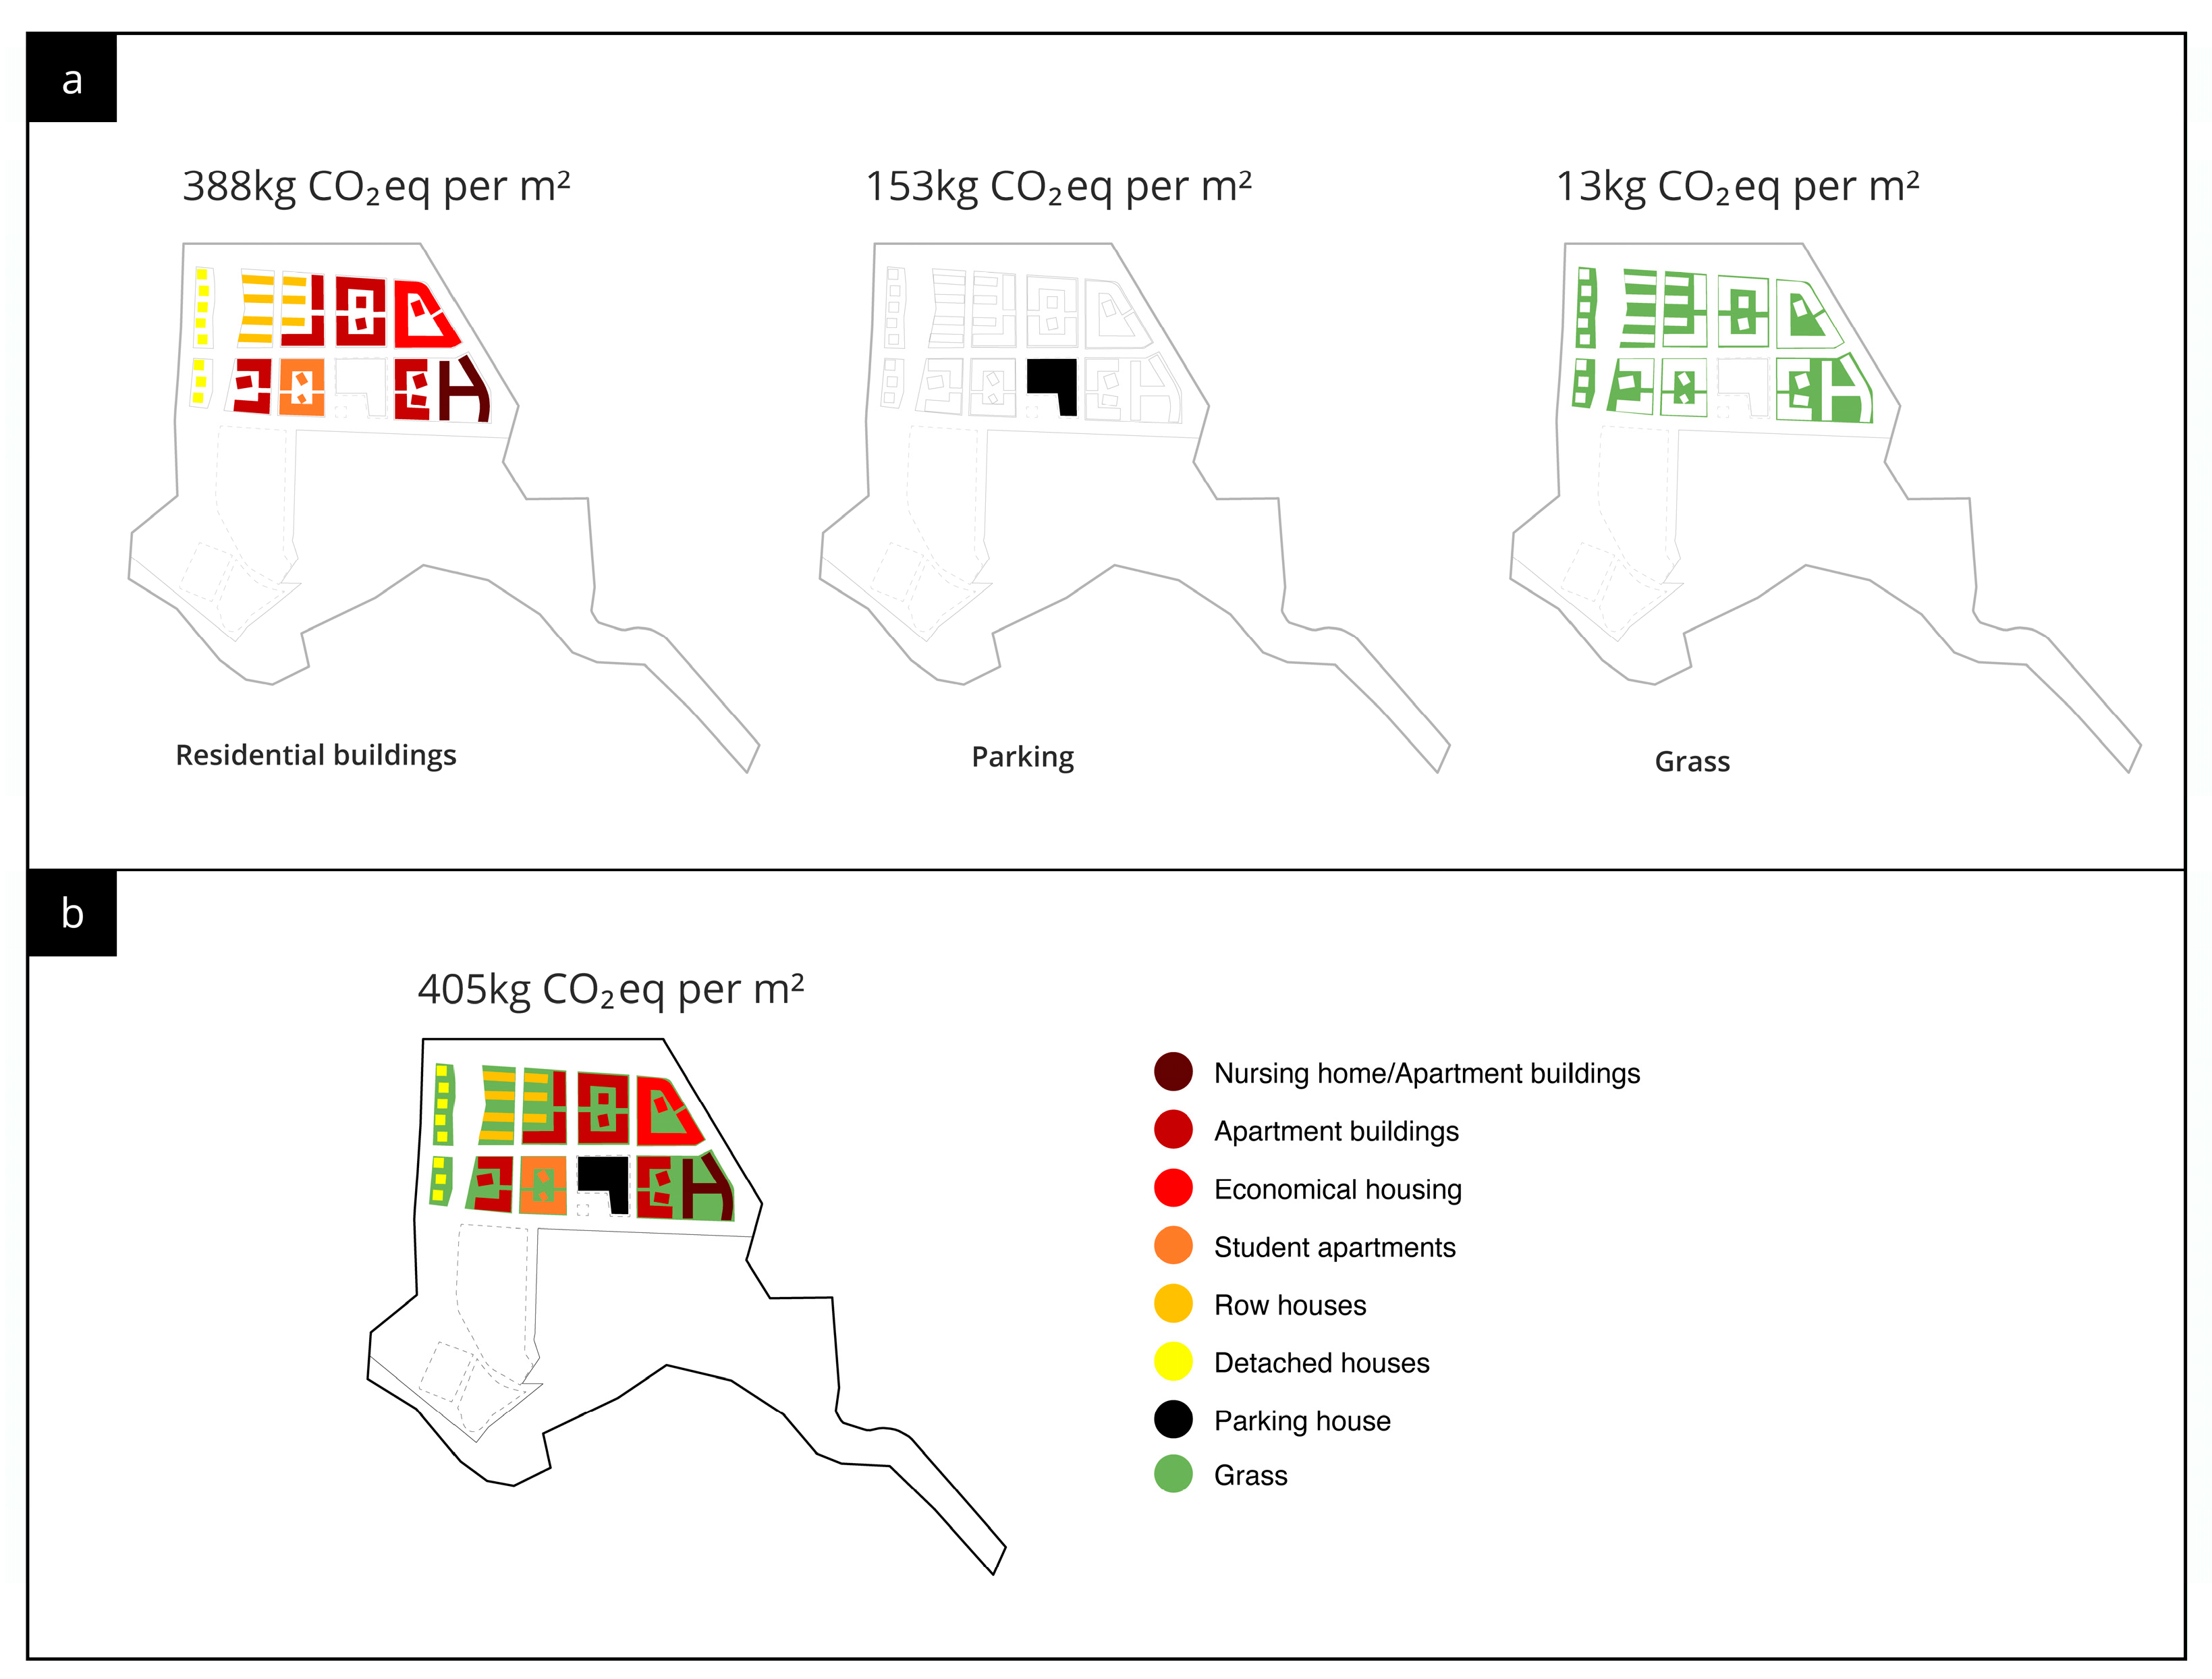
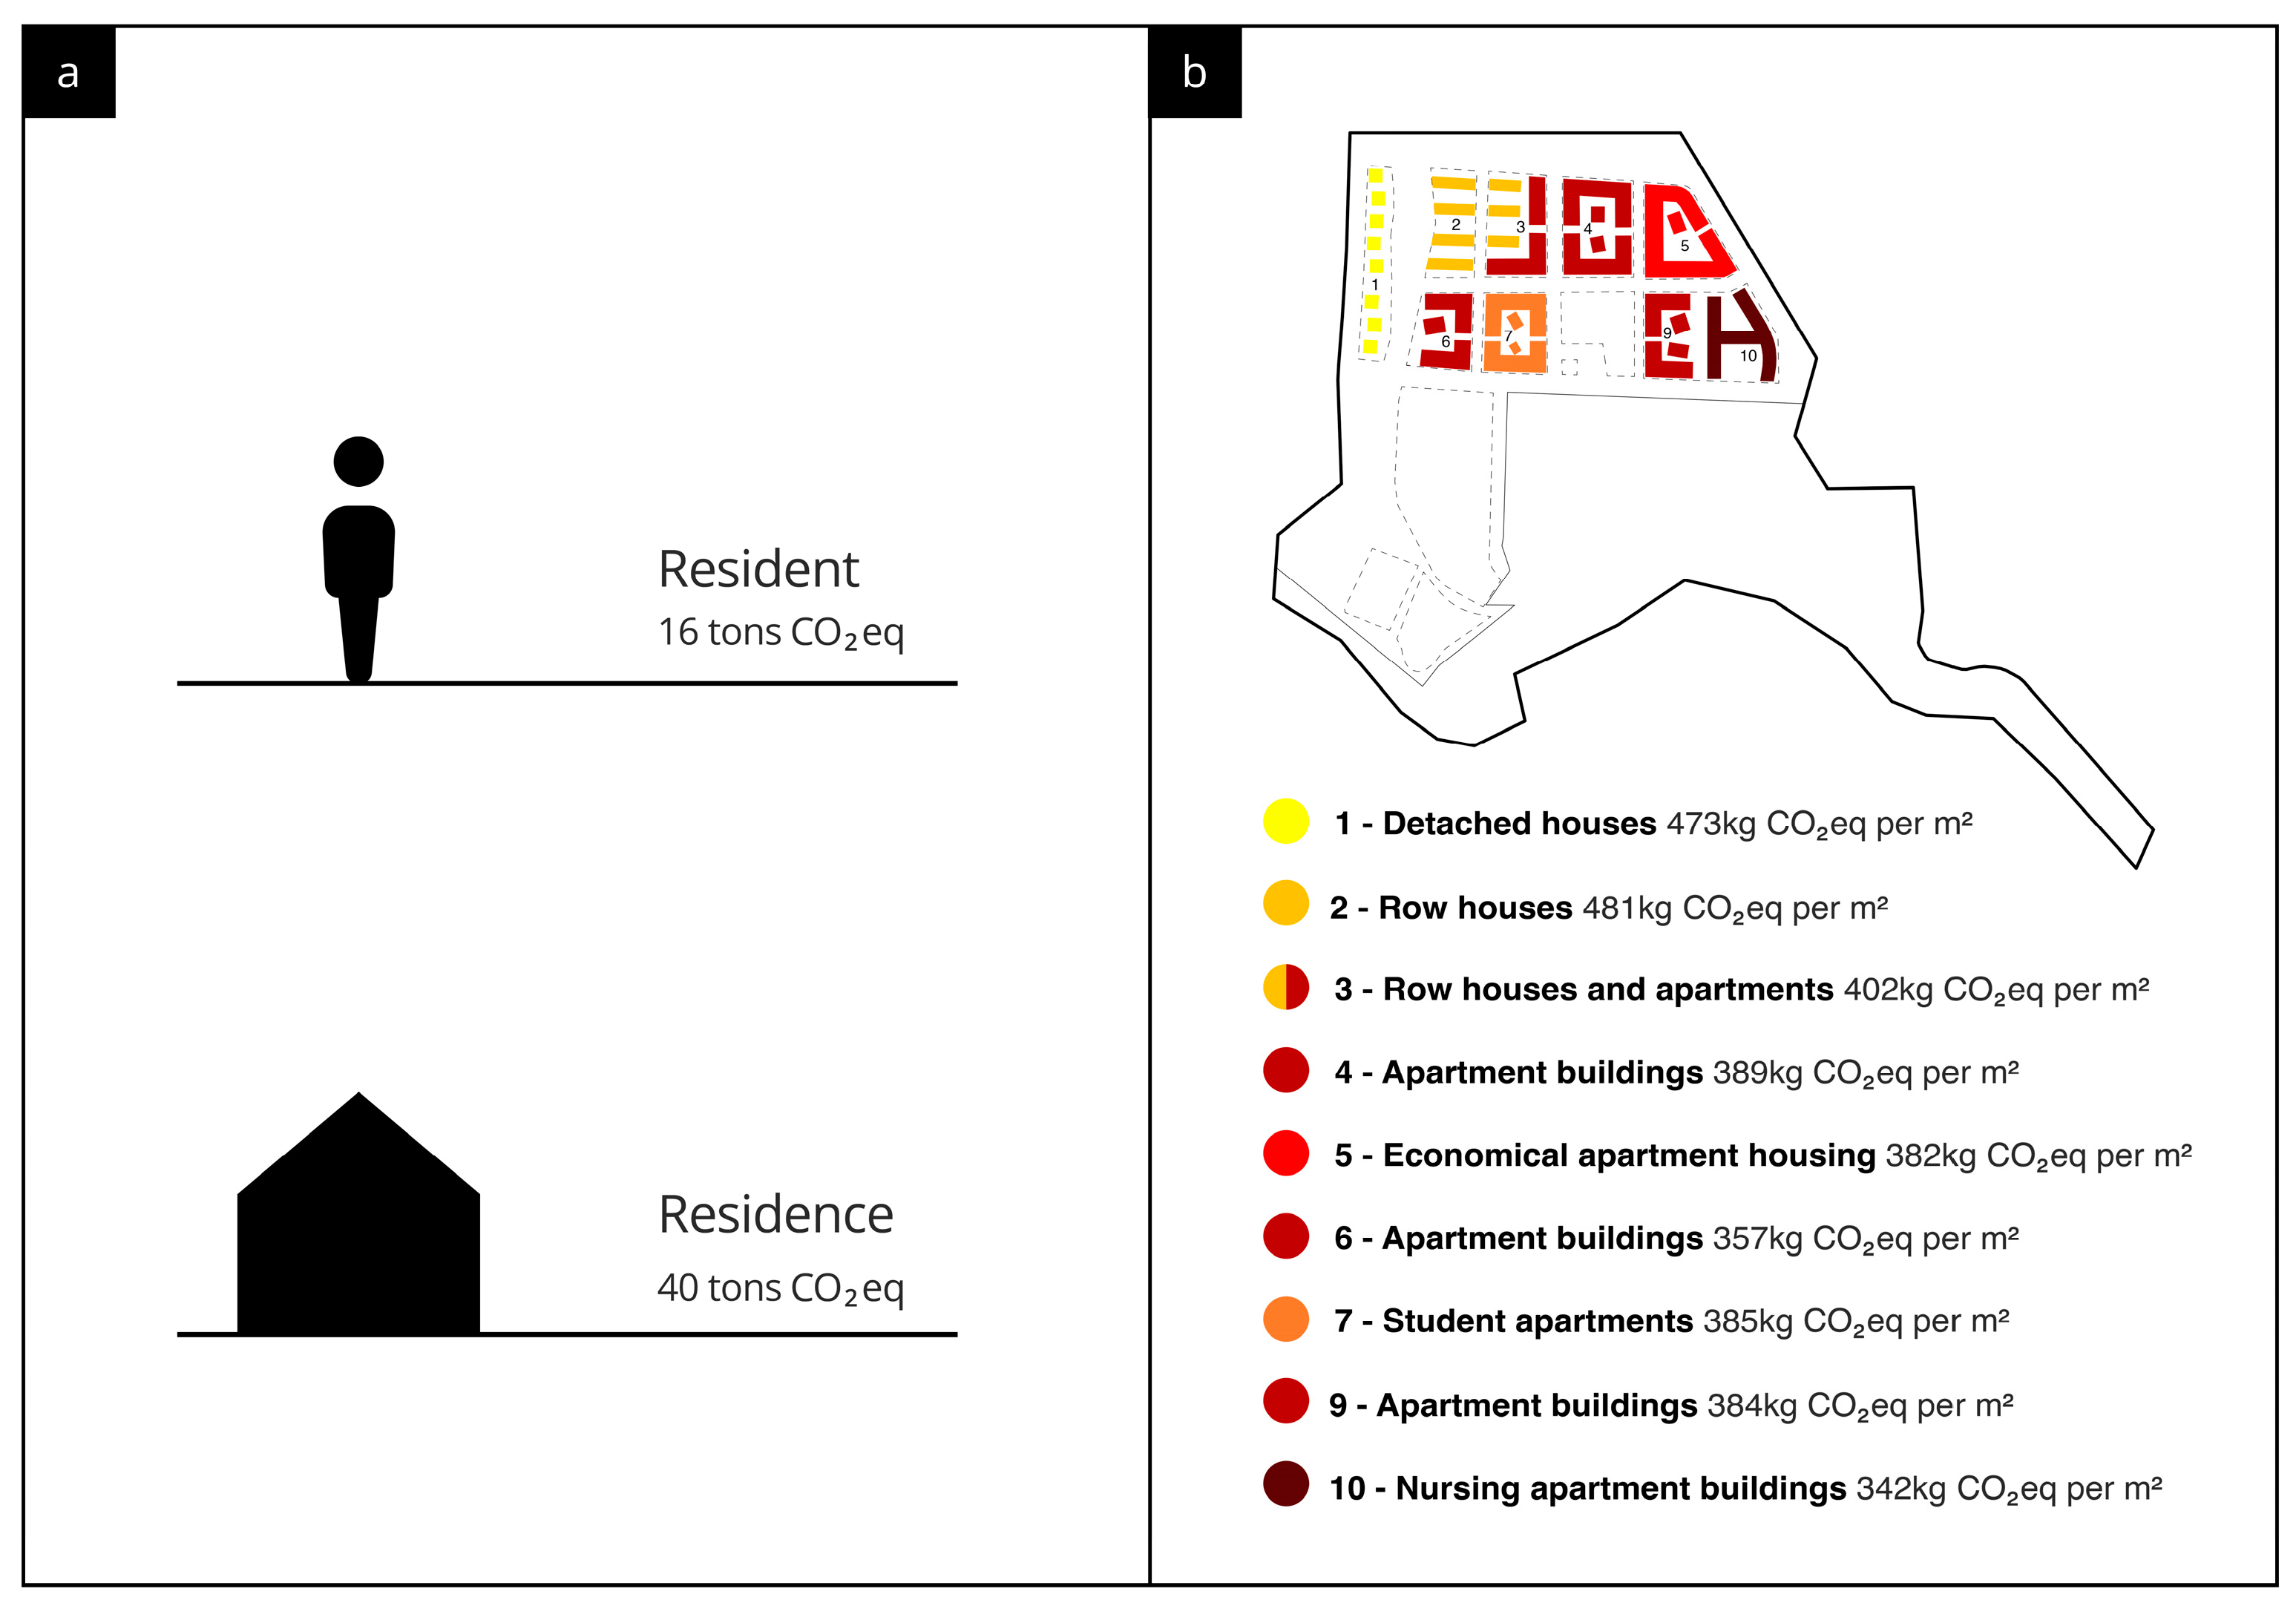
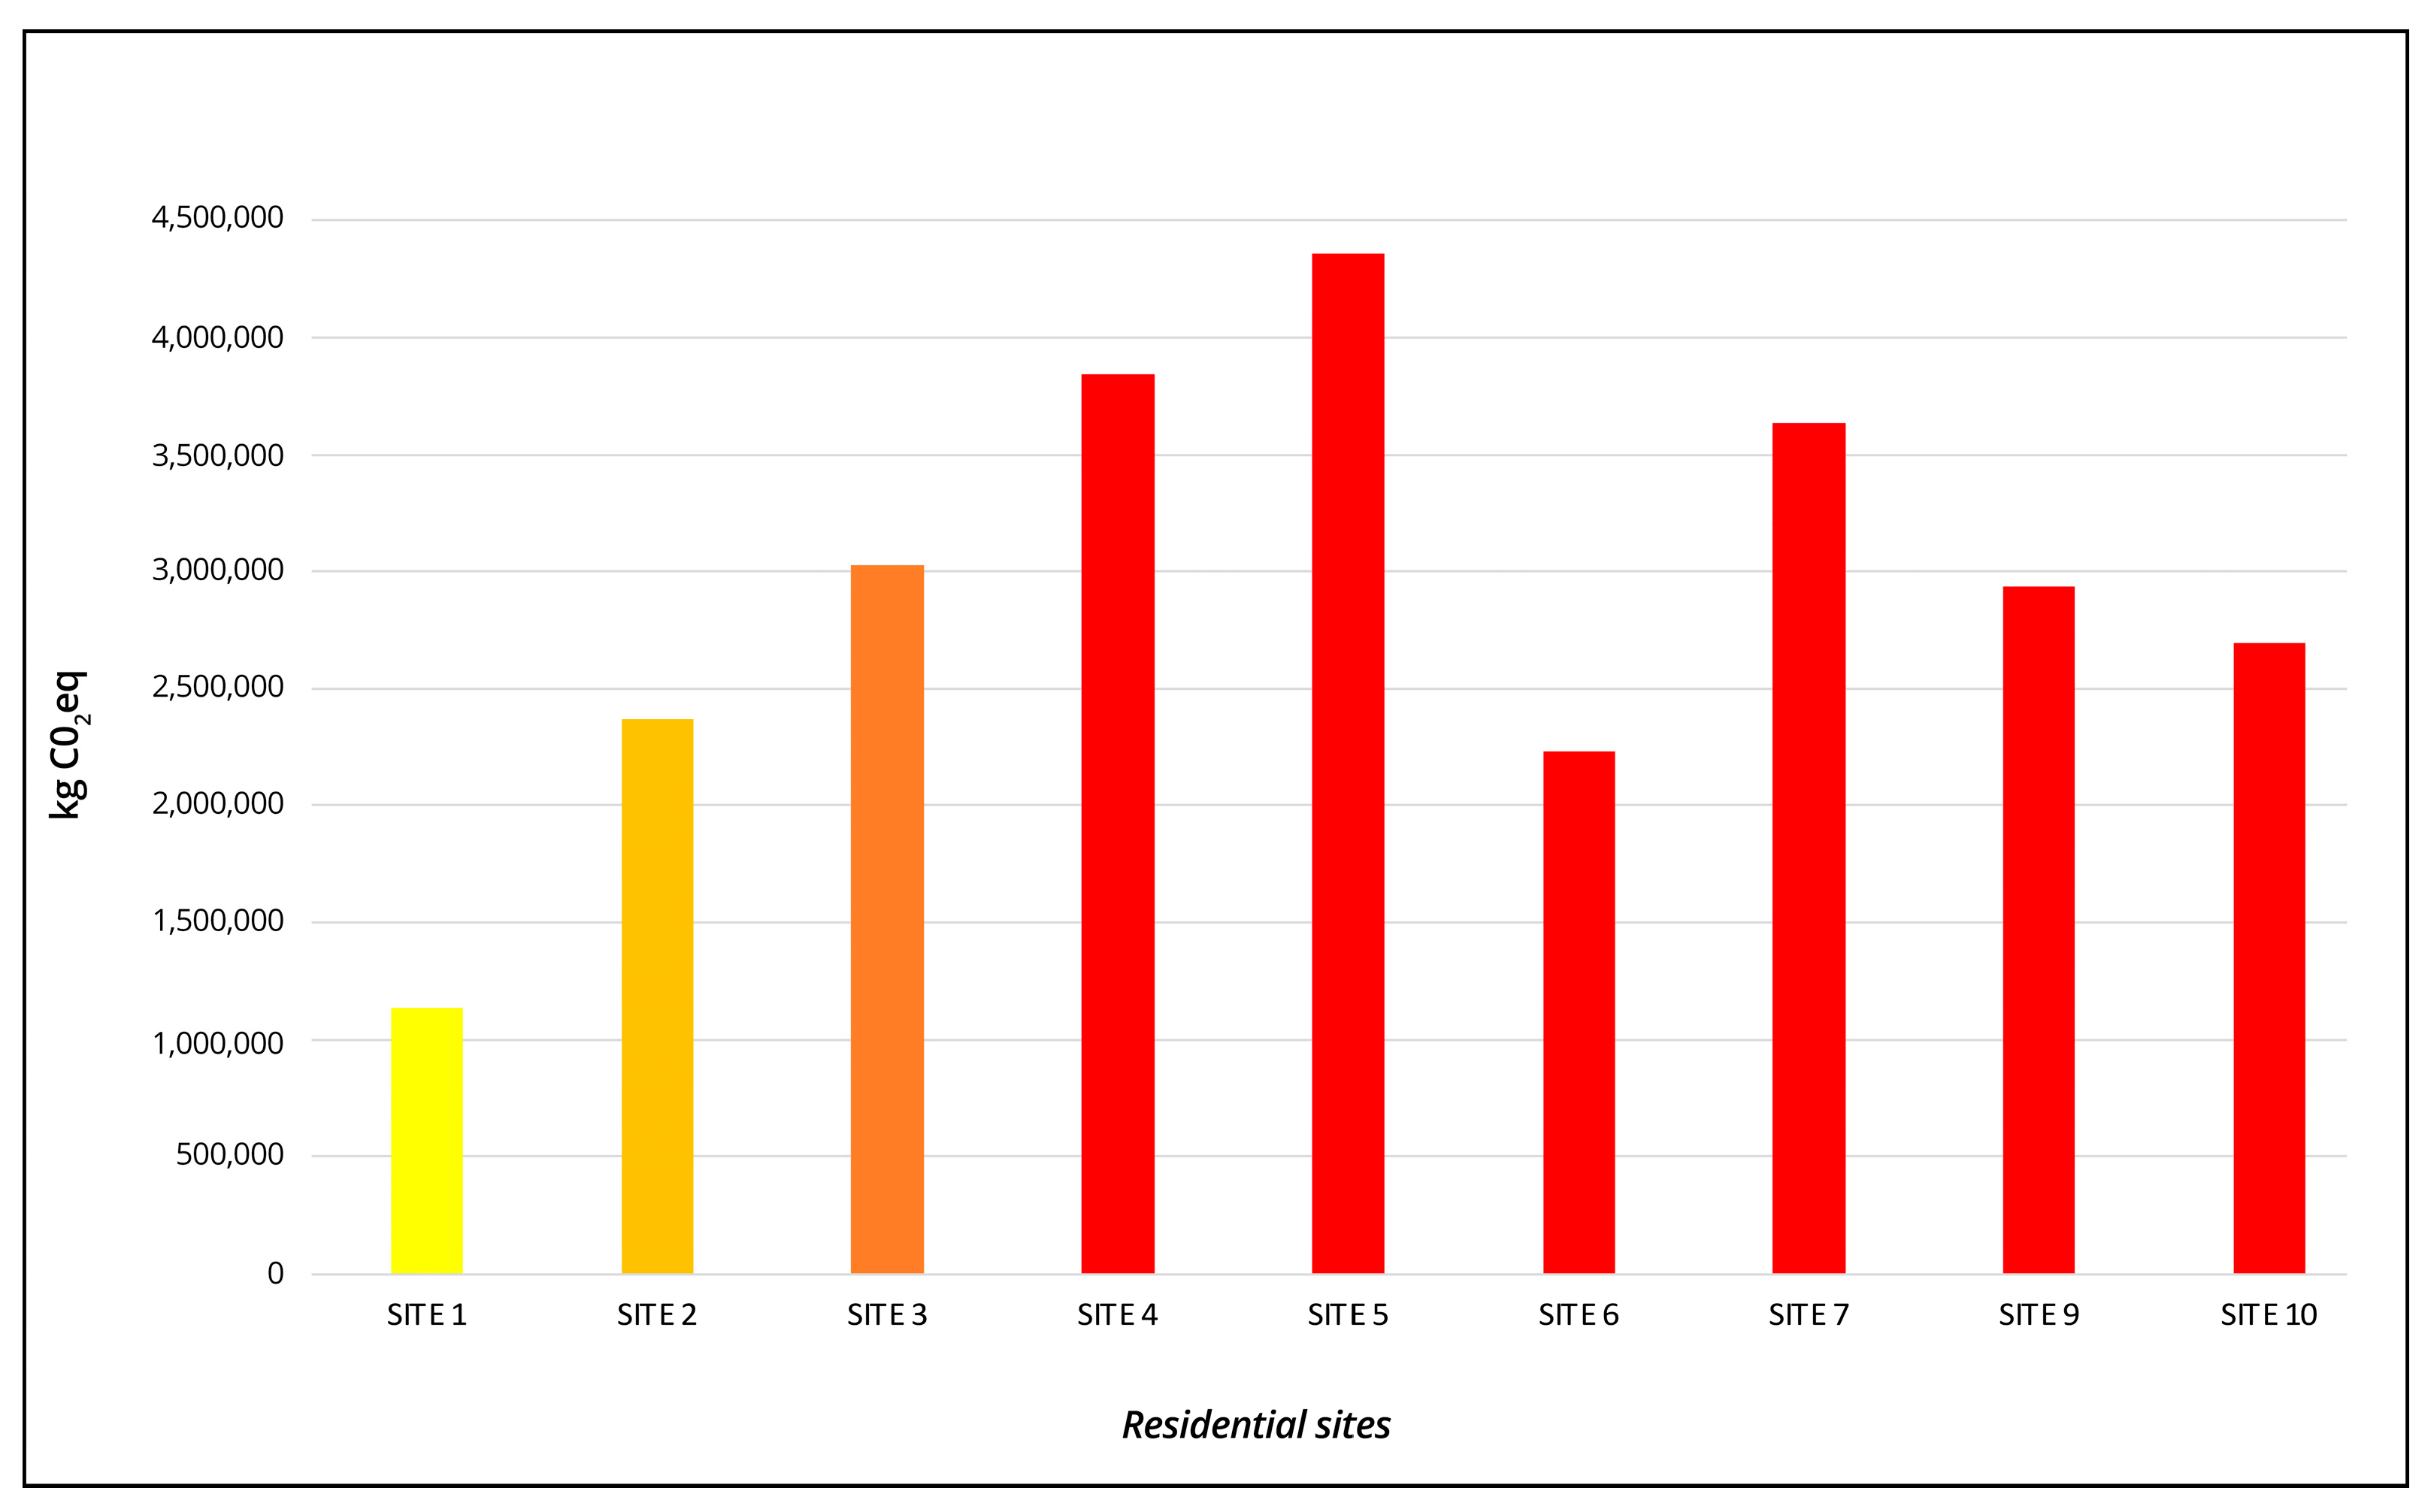
  • Emissions per one m2 of the gross area of the total construction volume of buildings for each site of the residential houses.
The case study conducted the predicted environmental impacts from the pre-use phase of the site plan of the first phase of New Skerjafjörður [39,44] from Cradle-to-Handover (A1–A5) for Buildings and Other Spaces domains as shown in Figure 4. The study assessed stages A1–A4 using process LCA, but A5 is estimated with information from the study by Heinonen et al. [18]. Networks were not included in the assessment.
The site plan is divided into two main domains: Buildings (B) and Other Spaces (OS), as shown in Table 2. Each domain is divided into further separations where it becomes clearer how much environmental impact comes from each domain. The site plan separation into domains is a similar approach as done by other existing literature when conducting the neighborhood LCA studies discussed in the introduction. In relation to existing neighborhood literature, the study would have accounted for the Network domain as the third main domain that is a part of the construction of the neighborhood, but the Network domain will not be included in this study due to a lack of data. The LCA covers the construction volume of all the buildings planned within the Buildings domain (B), considering raw materials extraction, transport, manufacturing, and building construction is estimated with information from the study by Heinonen et al. [18]. Other space domains (OSs) cover the infrastructure construction for cars, bicycles, and pedestrians, as well as open space, and parking areas mostly made up by constructing a parking house. All construction volumes are shown in Table 2. A diagram of the domains included (Building and Other Spaces) is shown in Figure 5.

2.3.2. Life-Cycle Inventory

Information on the data collection for the Life cycle inventory (LCI) is divided into two subsections in relation to the site plan domains division. Each subsection describes how the different domains were studied regarding the LCI.

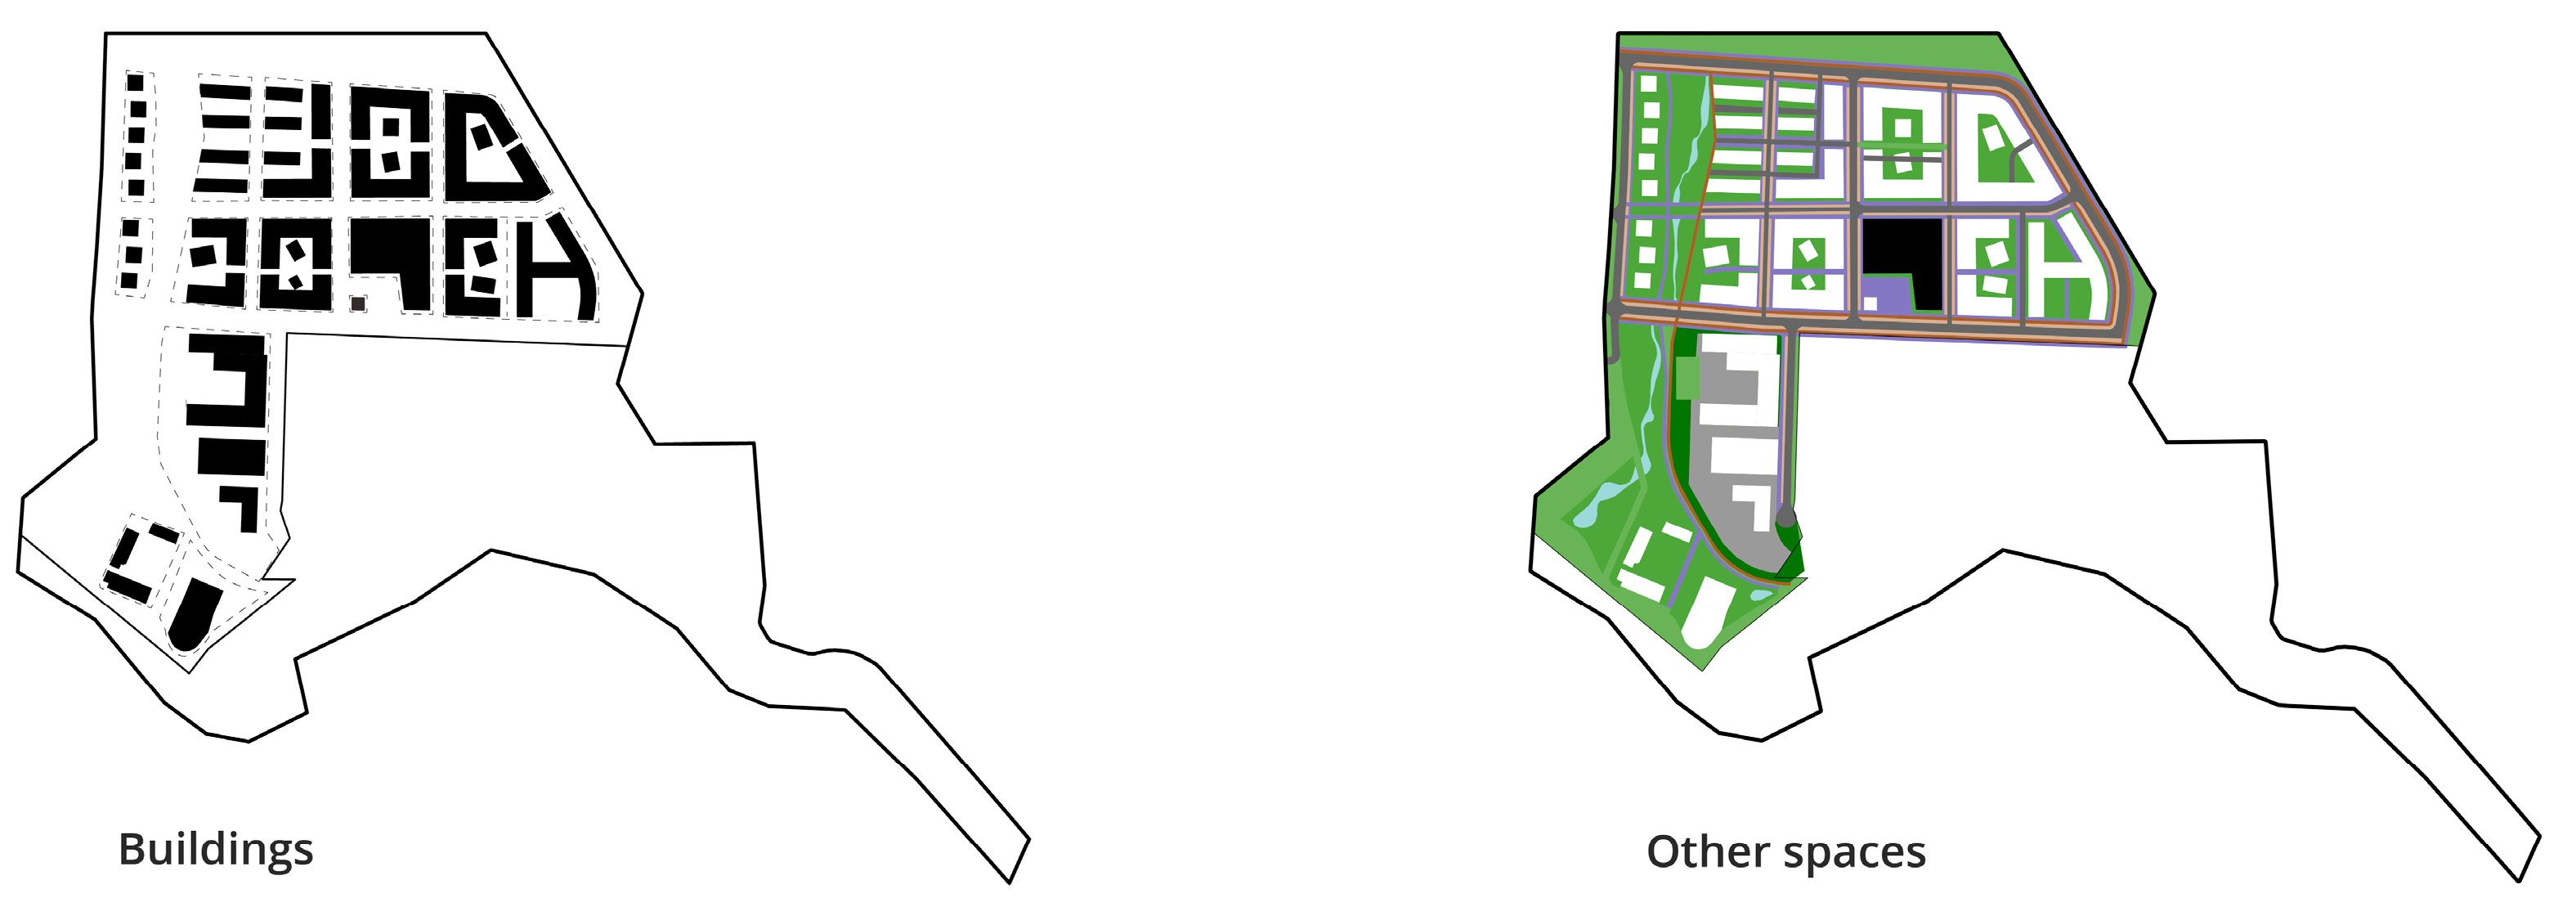
2.3.2.1. Building´s Domain (B)

The estimated construction volume for each site was developed from the site plan and its special terms [40,45] into simple preliminary architectural drawings. The drawings were used to account for the predicted material load used for constructing the buildings. The material quantity data of each site were gathered through the preliminary drawings made from the site plan and site-specific data retrieved from Reykjavíkurborg, Umhverfis- og skipulagssvið [40,45]. The building materials specification was divided according to the Building2000 reference system used in Heinonen et al. [18], shown in Table 3.
Each building system is divided further into main materials, as shown in Supplementary Materials Table S1. In addition, the quantity load of the different building materials for the Buildings domain is found in the Supplementary Materials. The processes chosen from Ecoinvent 3.71 database were not changed to match Icelandic conditions, mostly to keep the study simple to use and not too time-consuming, which is an important issue if the method is to be used by the designers at the development stage. The situation is also that Iceland is forced to import most of the building elements and materials, and only a small share of it is produced in the country. The results will, therefore, not be accurate for Icelandic conditions but will still show trends. Regarding transportation distance, the study used a market average that was estimated for an unknown location and is included in the Ecoinvent 3.71 database. In Earth and Groundwork, the excavation was based on a 2.6 m average depth to reach solid ground, according to the site research information [40]. In Foundation and Frame and Roof Structures, the reinforcement calculation estimation was based on typical Icelandic construction, which has often been considered to be 50 kg reinforcement/m3 concrete (B. Marteinsson, personal communication, 16 June 2021). The concrete strength was estimated to be the same for the overall site for simplification using 30–32 Mpa (C30/37) commonly used for most parts of buildings [49]. The calculation for the basement slab was estimated to be 0.12 m thick, and other floor slabs and walls were 0.20 m thick. The insulation used was stone wool, 0.10 m thick, and the roof insulation, 0.225 m thick and for the foundation, polystyrene insulation of 0.10 m thickness was used. For the pitched roof structures, 50 mm × 250 mm timber rafters and 25 mm × 150 mm wood boards were used for the accounting. In complementary works, the window frames chosen were timber/aluminum with double-pane glazing. Internal doors chosen were timber, and external doors were timber with glass. In Finishes, the cladding calculation in the study divided the quantity load between 1/3 being timber and 2/3 being aluminum, roughly based on images from the neighborhood plan documents and the current trend of building claddings in Reykjavík. For roof claddings, the study used aluminum for the same reasons as the cladding was chosen, except where the plan’s special terms required it to be grass. For the interior of the lightweight walls, the study used 2 × 12 mm gypsum boards onto a galvanized steel frame most commonly used today and with 0.45 m thick stone wool insulation inside. The interior surfaces were treated with water-based paint. The surface material for the floors was hardwood 8 mm thick and 11 mm thick ceramic tiles in wet rooms, floors, and walls. Basement floors were treated with epoxy-coating paint. Fittings, equipment, and installations like kitchen or bathroom furniture and elevators inside the apartment buildings were not included in the study as well Mechanical Works. Construction Site was estimated with information from the study by Heinonen et al. [18]. Previous studies are used to discuss the magnitude of the downward bias due to the cutoffs. Included and excluded information regarding materials for the buildings are listed in Supplementary Materials Table S1, and the overall material load within the Buildings domain is also visible. Supplementary Materials Tables S2–S14 show the material load and impacts within each impact category for each neighborhood site within the Buildings domain.

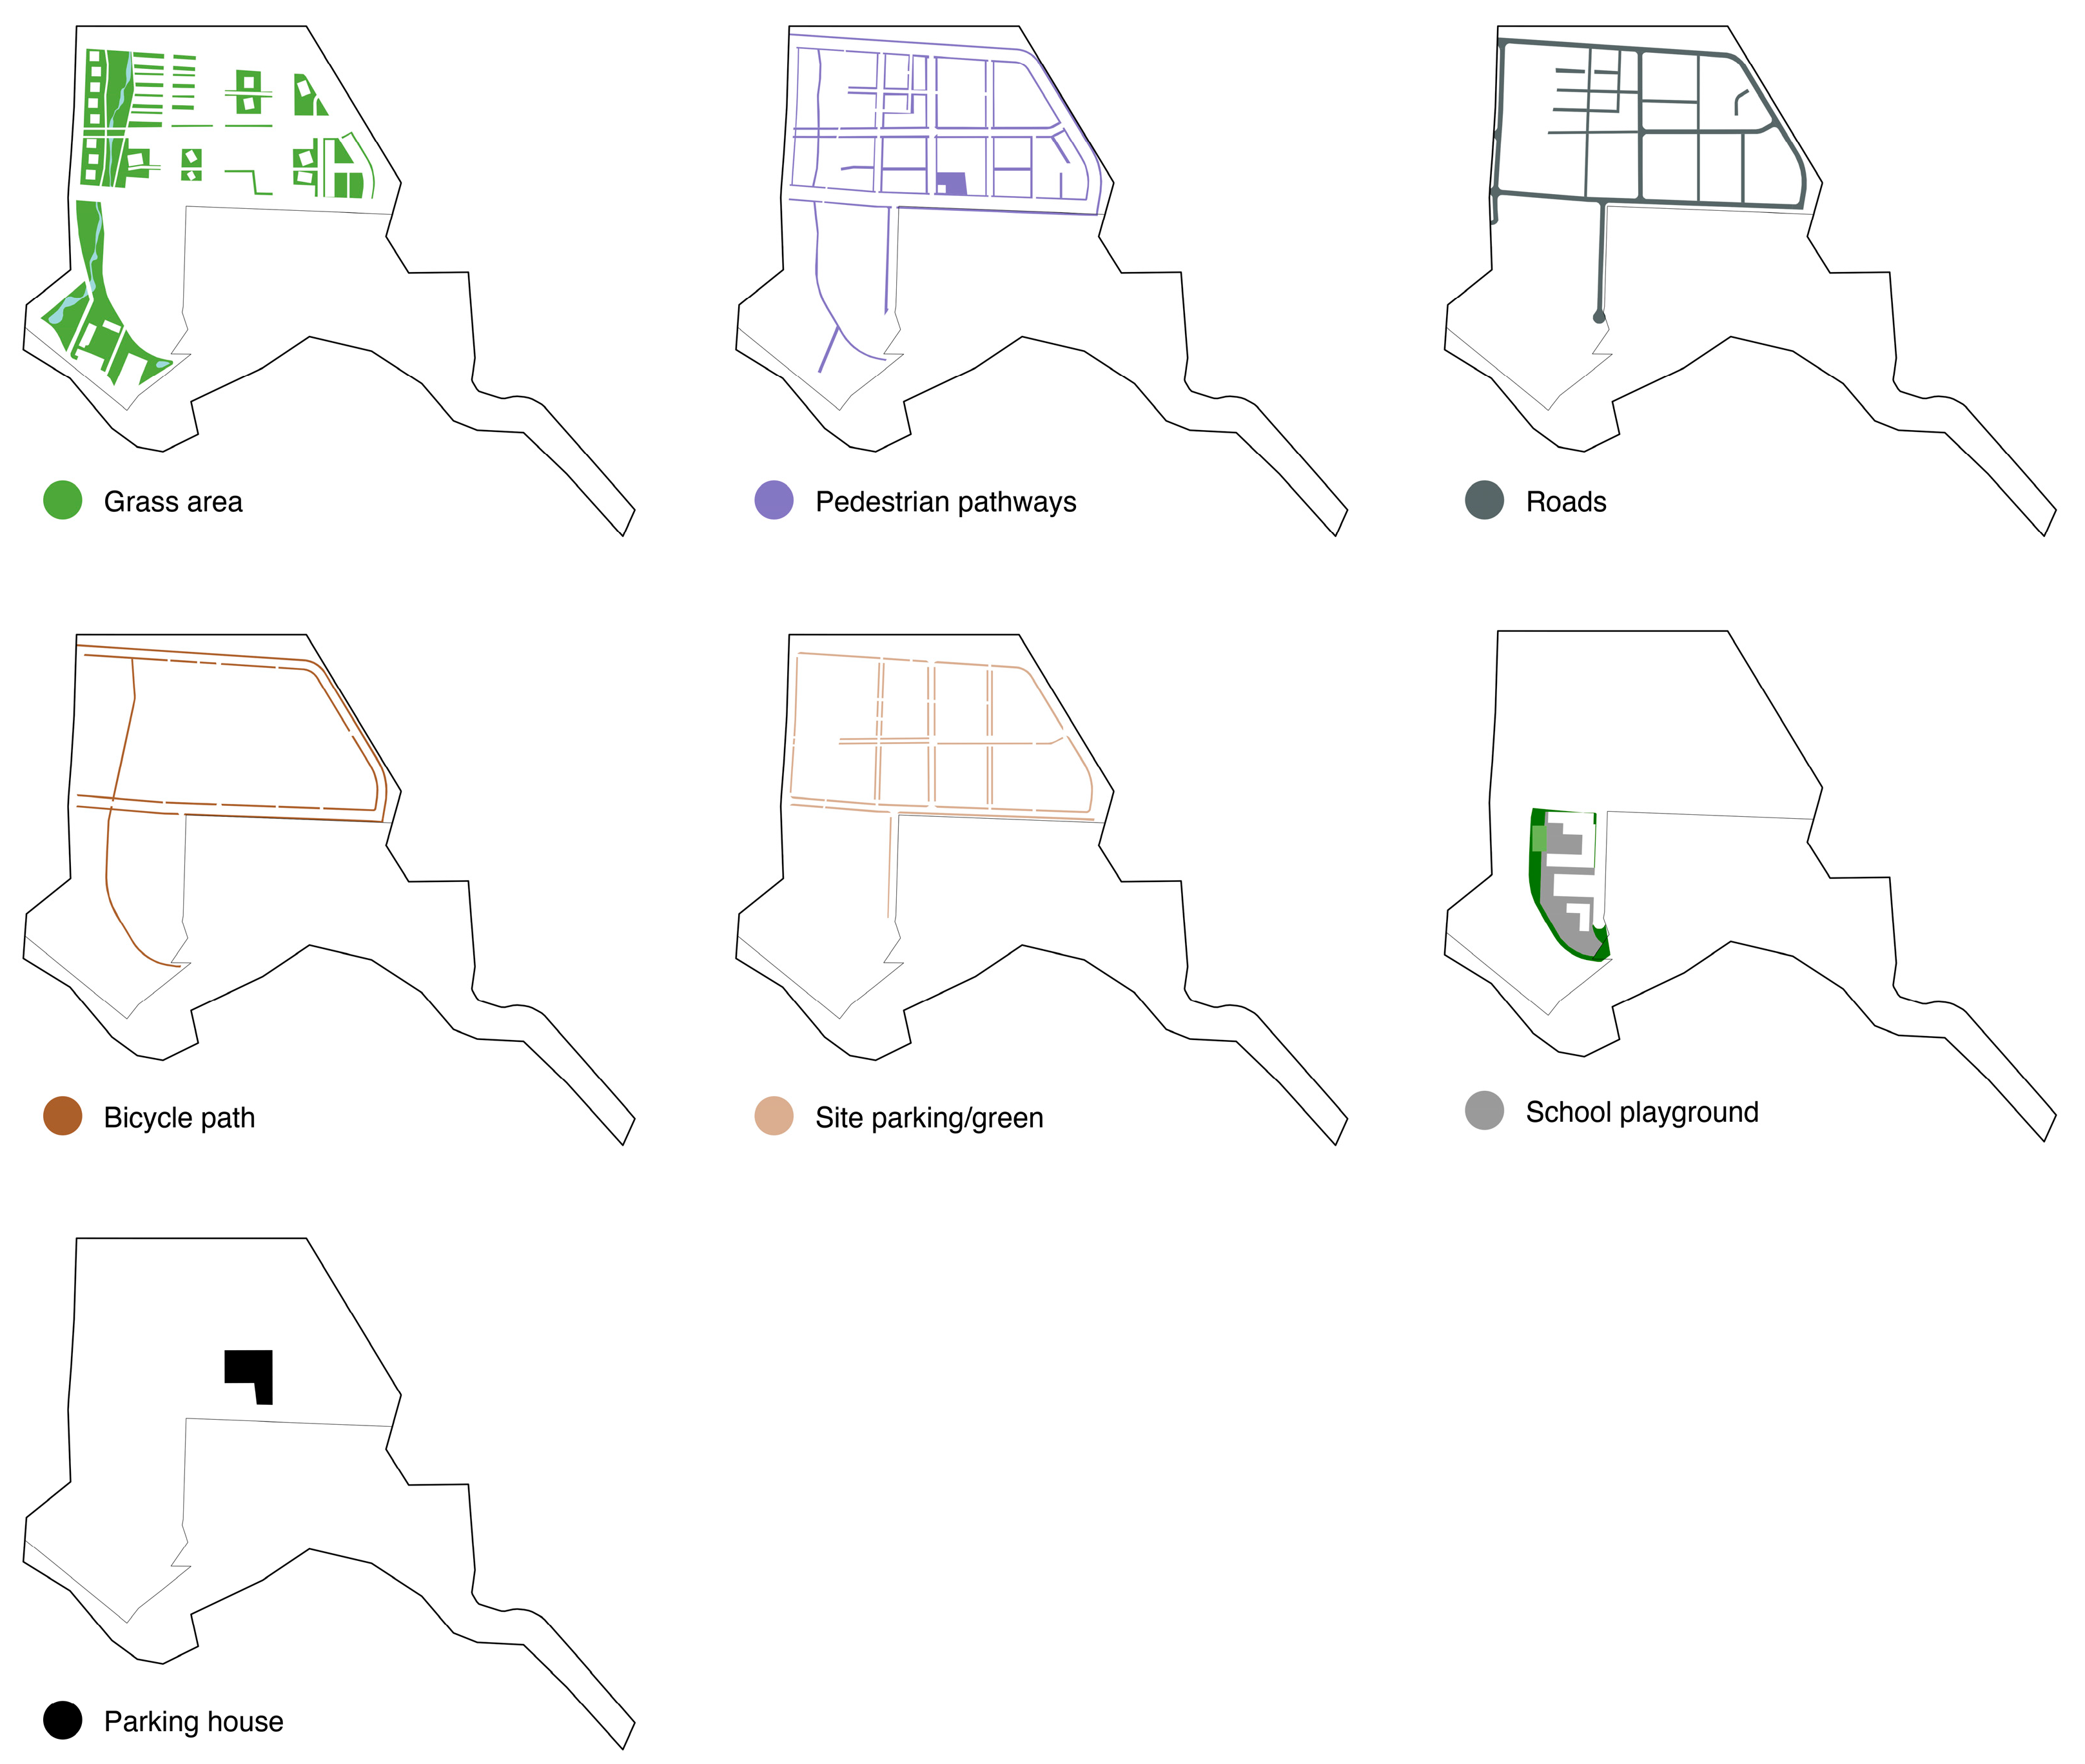
2.3.2.2. Other Spaces Domain (OS)

The estimated construction load for the Other Spaces (OS) domain was calculated from the site plan and other supporting documents [40,45]. Additional information used were preliminary road designs received from Reykjavík’s environment and planning department to account for the material load with process LCA. The Other Spaces (OS) domain is divided into seven systems, as shown in Figure 6. Table S15 in Supplementary Materials shows the system division, and under each system, the main materials are listed, as well as the quantity of each material. In Roads, the calculation was carried out by using Ecoinvent 3.71 to run the quantity of the surface material and also using an LCA report for typical road construction in Iceland by the EFLA engineering office [50]. The parking house was calculated in the same way as the building systems were accounted for in the Buildings (B) domain. For Pedestrian pathways, Site parking/green, Bicycle paths, Grass areas, and School playgrounds, the study focused on surface materials only due to a lack of data and for simplification. Table S16 in the Supplementary Materials shows the material load and impacts within each impact category for the different systems within the Other Spaces domain.

2.4. Life Cycle Impact Assessment (LCIA)

The elementary flows from the LCI are converted into environmental impacts through characterization factors. The conducted LCA for this study follows the ISO 14040/14044 standards [47,48]. The study includes the mandatory steps of selecting impact categories, classification, and characterization [21]. The software chosen for the study is openLCA version 1.10, and the database used for background processes is Ecoinvent 3.7.1. The study shows characterized results at the midpoint level. Midpoint-level impact indicators provide extensive results [50]. The impact assessment method is Midpoint (H) ReCiPe2016, which contains 18 typical midpoint categories. The ReCiPe2016 is a modern method that gives a balanced cause-effect chain [51].

3. Results

This section is divided into subheadings. It provides a concise and precise description of the experimental results, their interpretation, as well as the experimental conclusions that can be drawn.

3.1. The Pre-Use Phase Emission Estimation

3.1.1. Overall Area

The results for the two domains assessed, Buildings and Other Spaces, with a total construction volume of 178,855 m2, provide an estimate of the total climate change impact to be around 38,652 tons CO2eq as shown in Figure 7. The impact was 90% from the Buildings domain and 10% from the Other Spaces domain. Table S17 in Supplementary Materials shows the results for all 18 impact categories, both separately for the Buildings and the Other Spaces domain and the total impact of the two domains combined. Tables S2–S14 in the Supplementary Materials show the material load and impacts within each impact category for each site of the neighborhood within the Buildings domain.
Emissions per square meter of the built-up area of Buildings and Other Spaces domains (178,850 m2) for climate change are 216 kg CO2eq per m2. However, when the domains are studied separately for the Buildings domain (98,950 m2) the climate change impact is 359 kg CO2eq per m2, and for the Other Spaces domain (79,905 m2) 39 kg CO2eq per m2. The results for the total impact for one m2 of the gross area in all of the impact categories assessed are shown in Supplementary Materials in Table S18.

3.1.2. Residential Space

The result for the residential buildings (Figure 8a) is 388 kg CO2eq per m2, for the parking house 153 kg CO2eq per m2, and for the grass area 13 kg CO2eq per m2. When combined together, all emissions from residential and related spaces are 405 kg CO2eq per m2 of residential space (67,520 m2), as shown in Figure 8b. The parking house is considered highly relevant as a related space to the residential buildings since no parking is allowed on the residential sites themselves. The results for the total impact for one m2 of the gross area of all residential and related spaces in all of the impact categories assessed are shown in Supplementary Materials in Table S19.
The climate change impact per resident of the neighborhood was estimated at ~16 tons CO2eq, including emissions from all residential and related spaces (assuming 1700 residents in total). The climate change impact results per residence provide an estimate of ~40 tons CO2eq for an average apartment (685 residential apartments in total). Both results are shown in Figure 9a. The results per resident and per residence of the gross area of all residential and related spaces for the 18 impact categories assessed are shown in Supplementary Materials in Table S20. Among the three types of residential buildings of the neighborhood (detached houses, row houses, and apartment buildings), apartment buildings (sites 4 to 10) have the lowest impact per m2 (Figure 9b). The emission per gross area m2 for each residential site for each impact category is shown in Supplementary Materials in Table S21.
However, the total climate change impact of the different residential sites shows that apartment building sites cause the highest load, mostly due to large buildings on the sites, as shown in Figure 10.

3.2. Hotspot Analysis

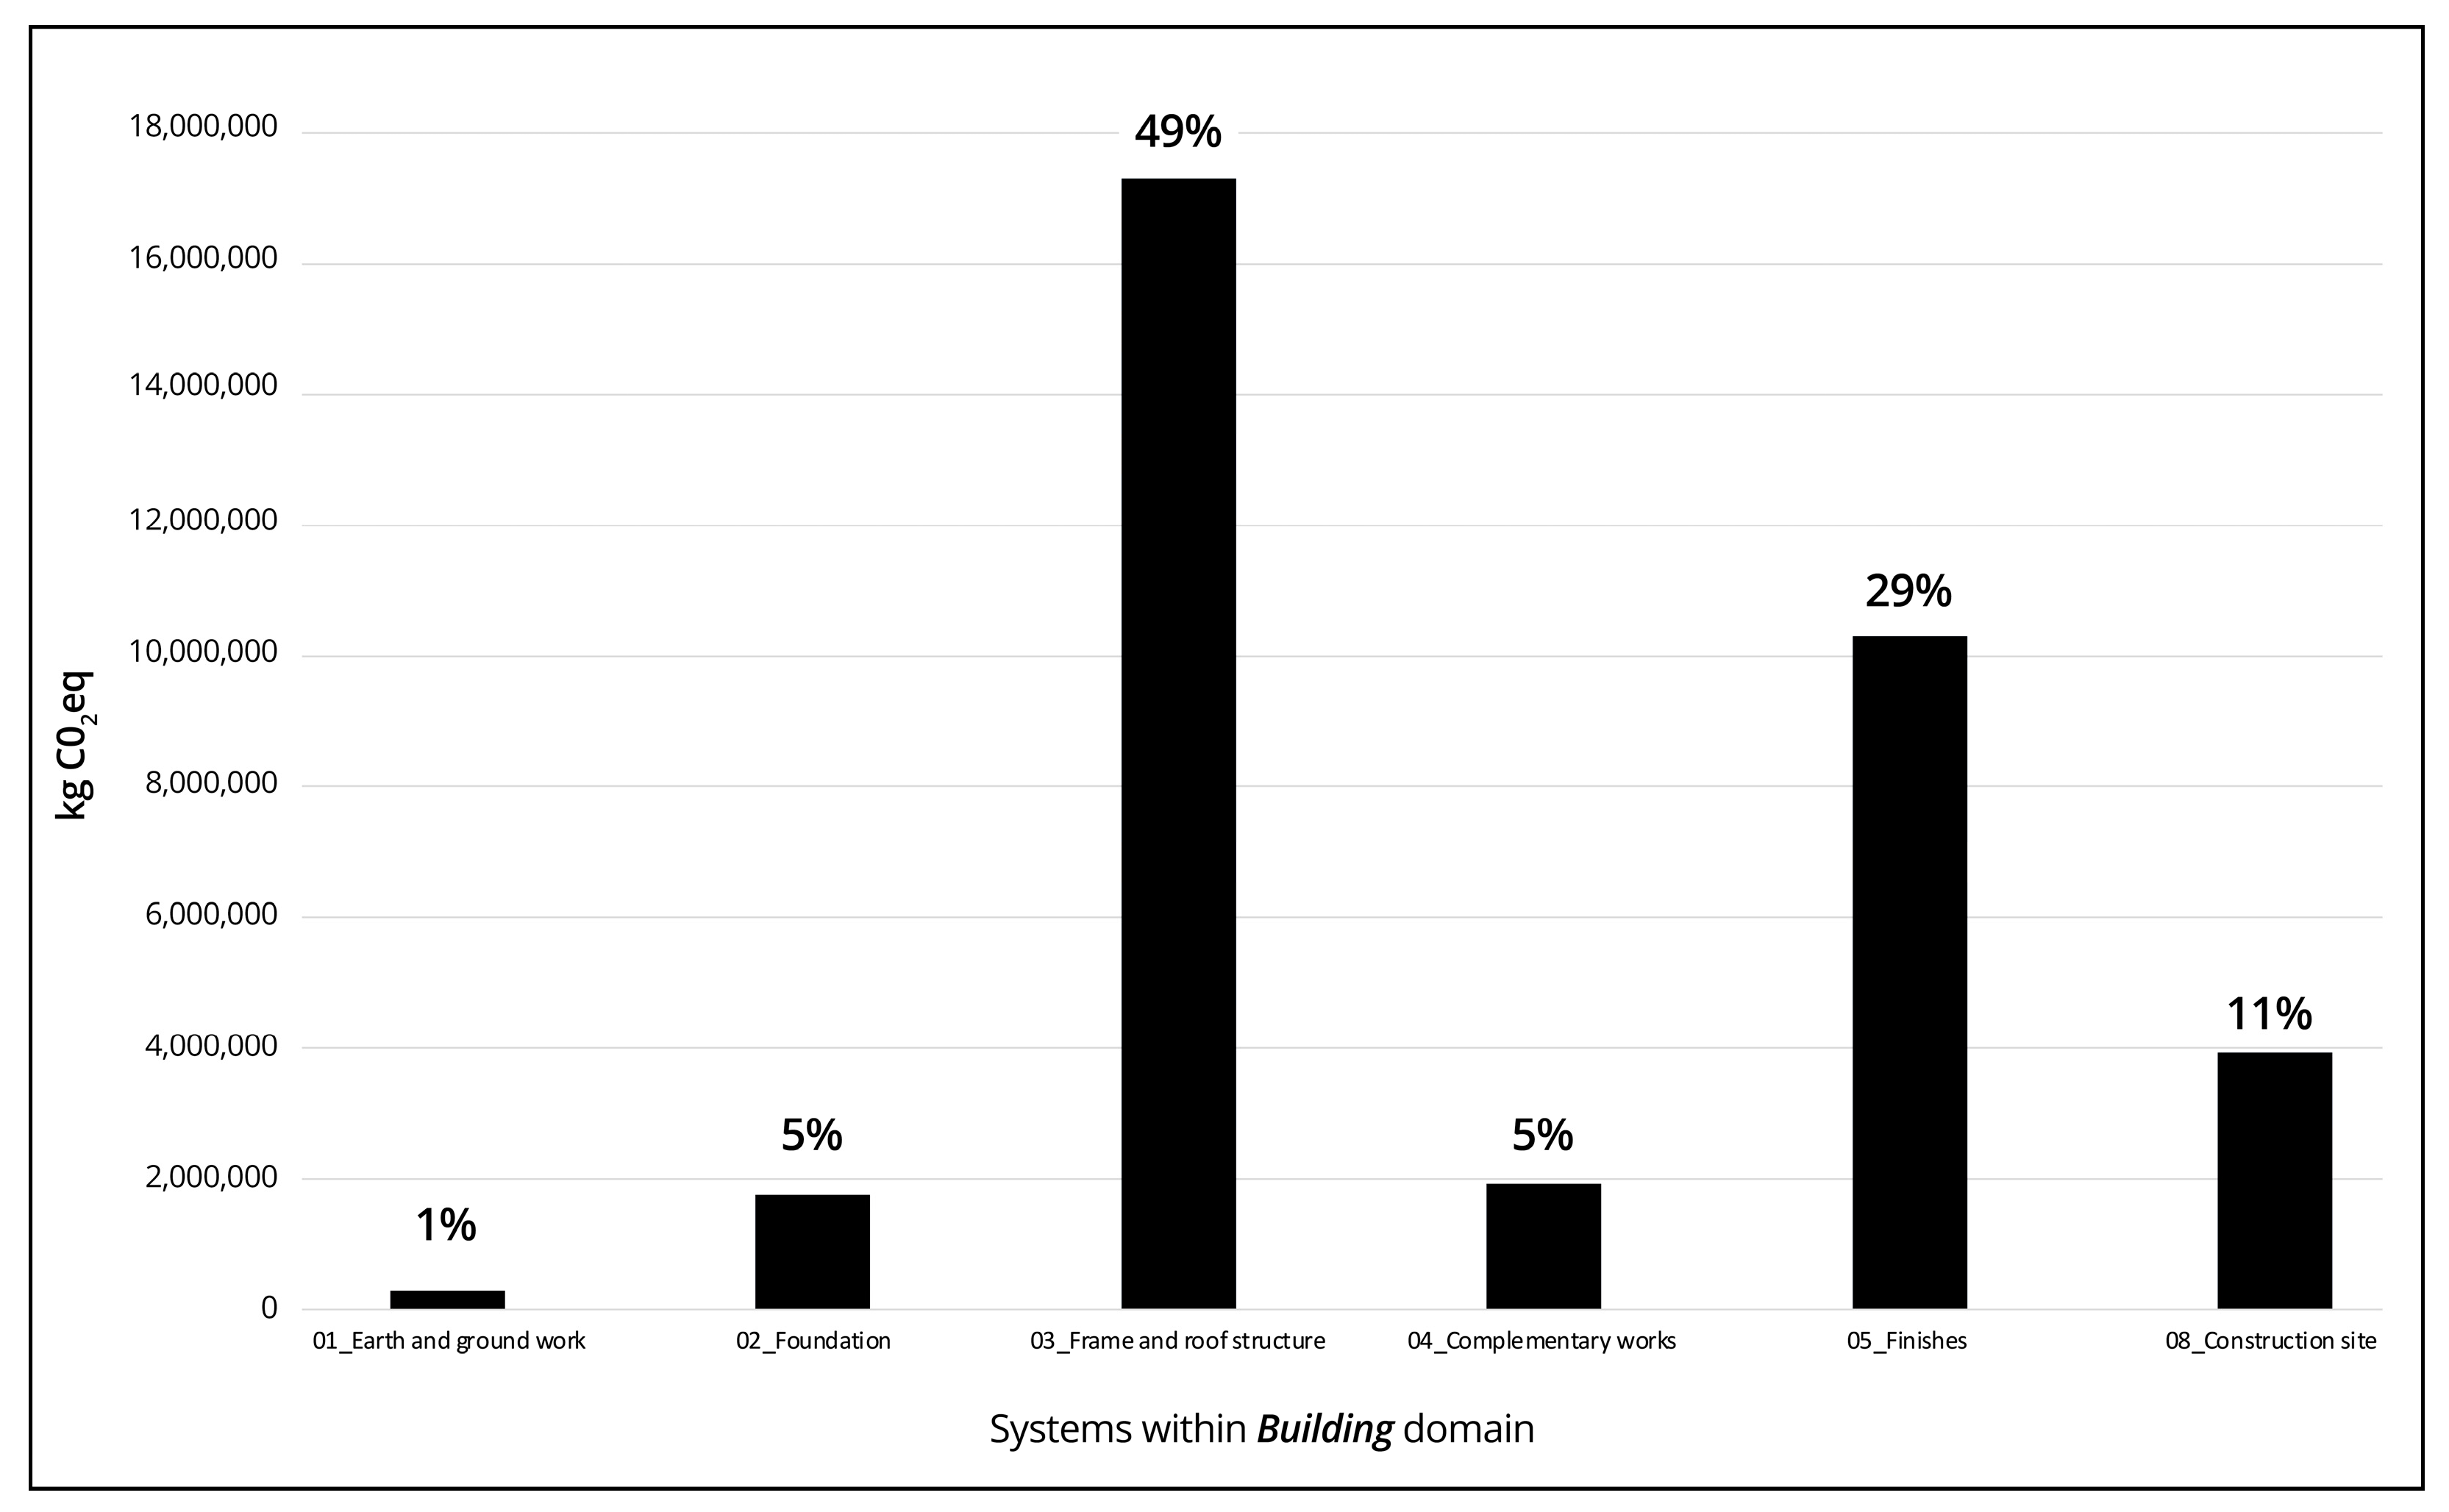
3.2.1. Hotspots by Different Building Systems within the Building Domain

A hotspot analysis was conducted to study the emission load coming from different building systems. Within the Buildings domain, the assessment covered six of the eight building systems (Table 3). Frame and Roof Structure contribute the largest share of the six systems studied, with 49% of the total climate change impacts, and the second is Finishes, with 29%, as shown in Figure 11. The impact of the gross distribution shows that Frame and Roof Structure contribute 17,319 tons of CO2eq, and Finishes contribute 10,310 tons of CO2eq within the Buildings domain. Results for the different building systems and their percentage of contribution to the overall impacts for each of the assessed impact categories are shown in Supplementary Materials in Table S22.

3.2.2. Hotspot Analysis of the Highest Contribution System within the Building Domain

The building systems’ frame and roof structure and finishes within the building’s domain that caused the highest emissions were studied further and analyzed by materials within each system. Within the Frame and Roof Structure, concrete contributes 73% of the total climate change emissions within the system. For the system of Finishes, the aluminum wall cladding contributes to 49% or almost half of the overall emissions within the system. Aluminum roof cladding is the second largest emission contributor to the system, with 34% of the climate change emissions impacts.

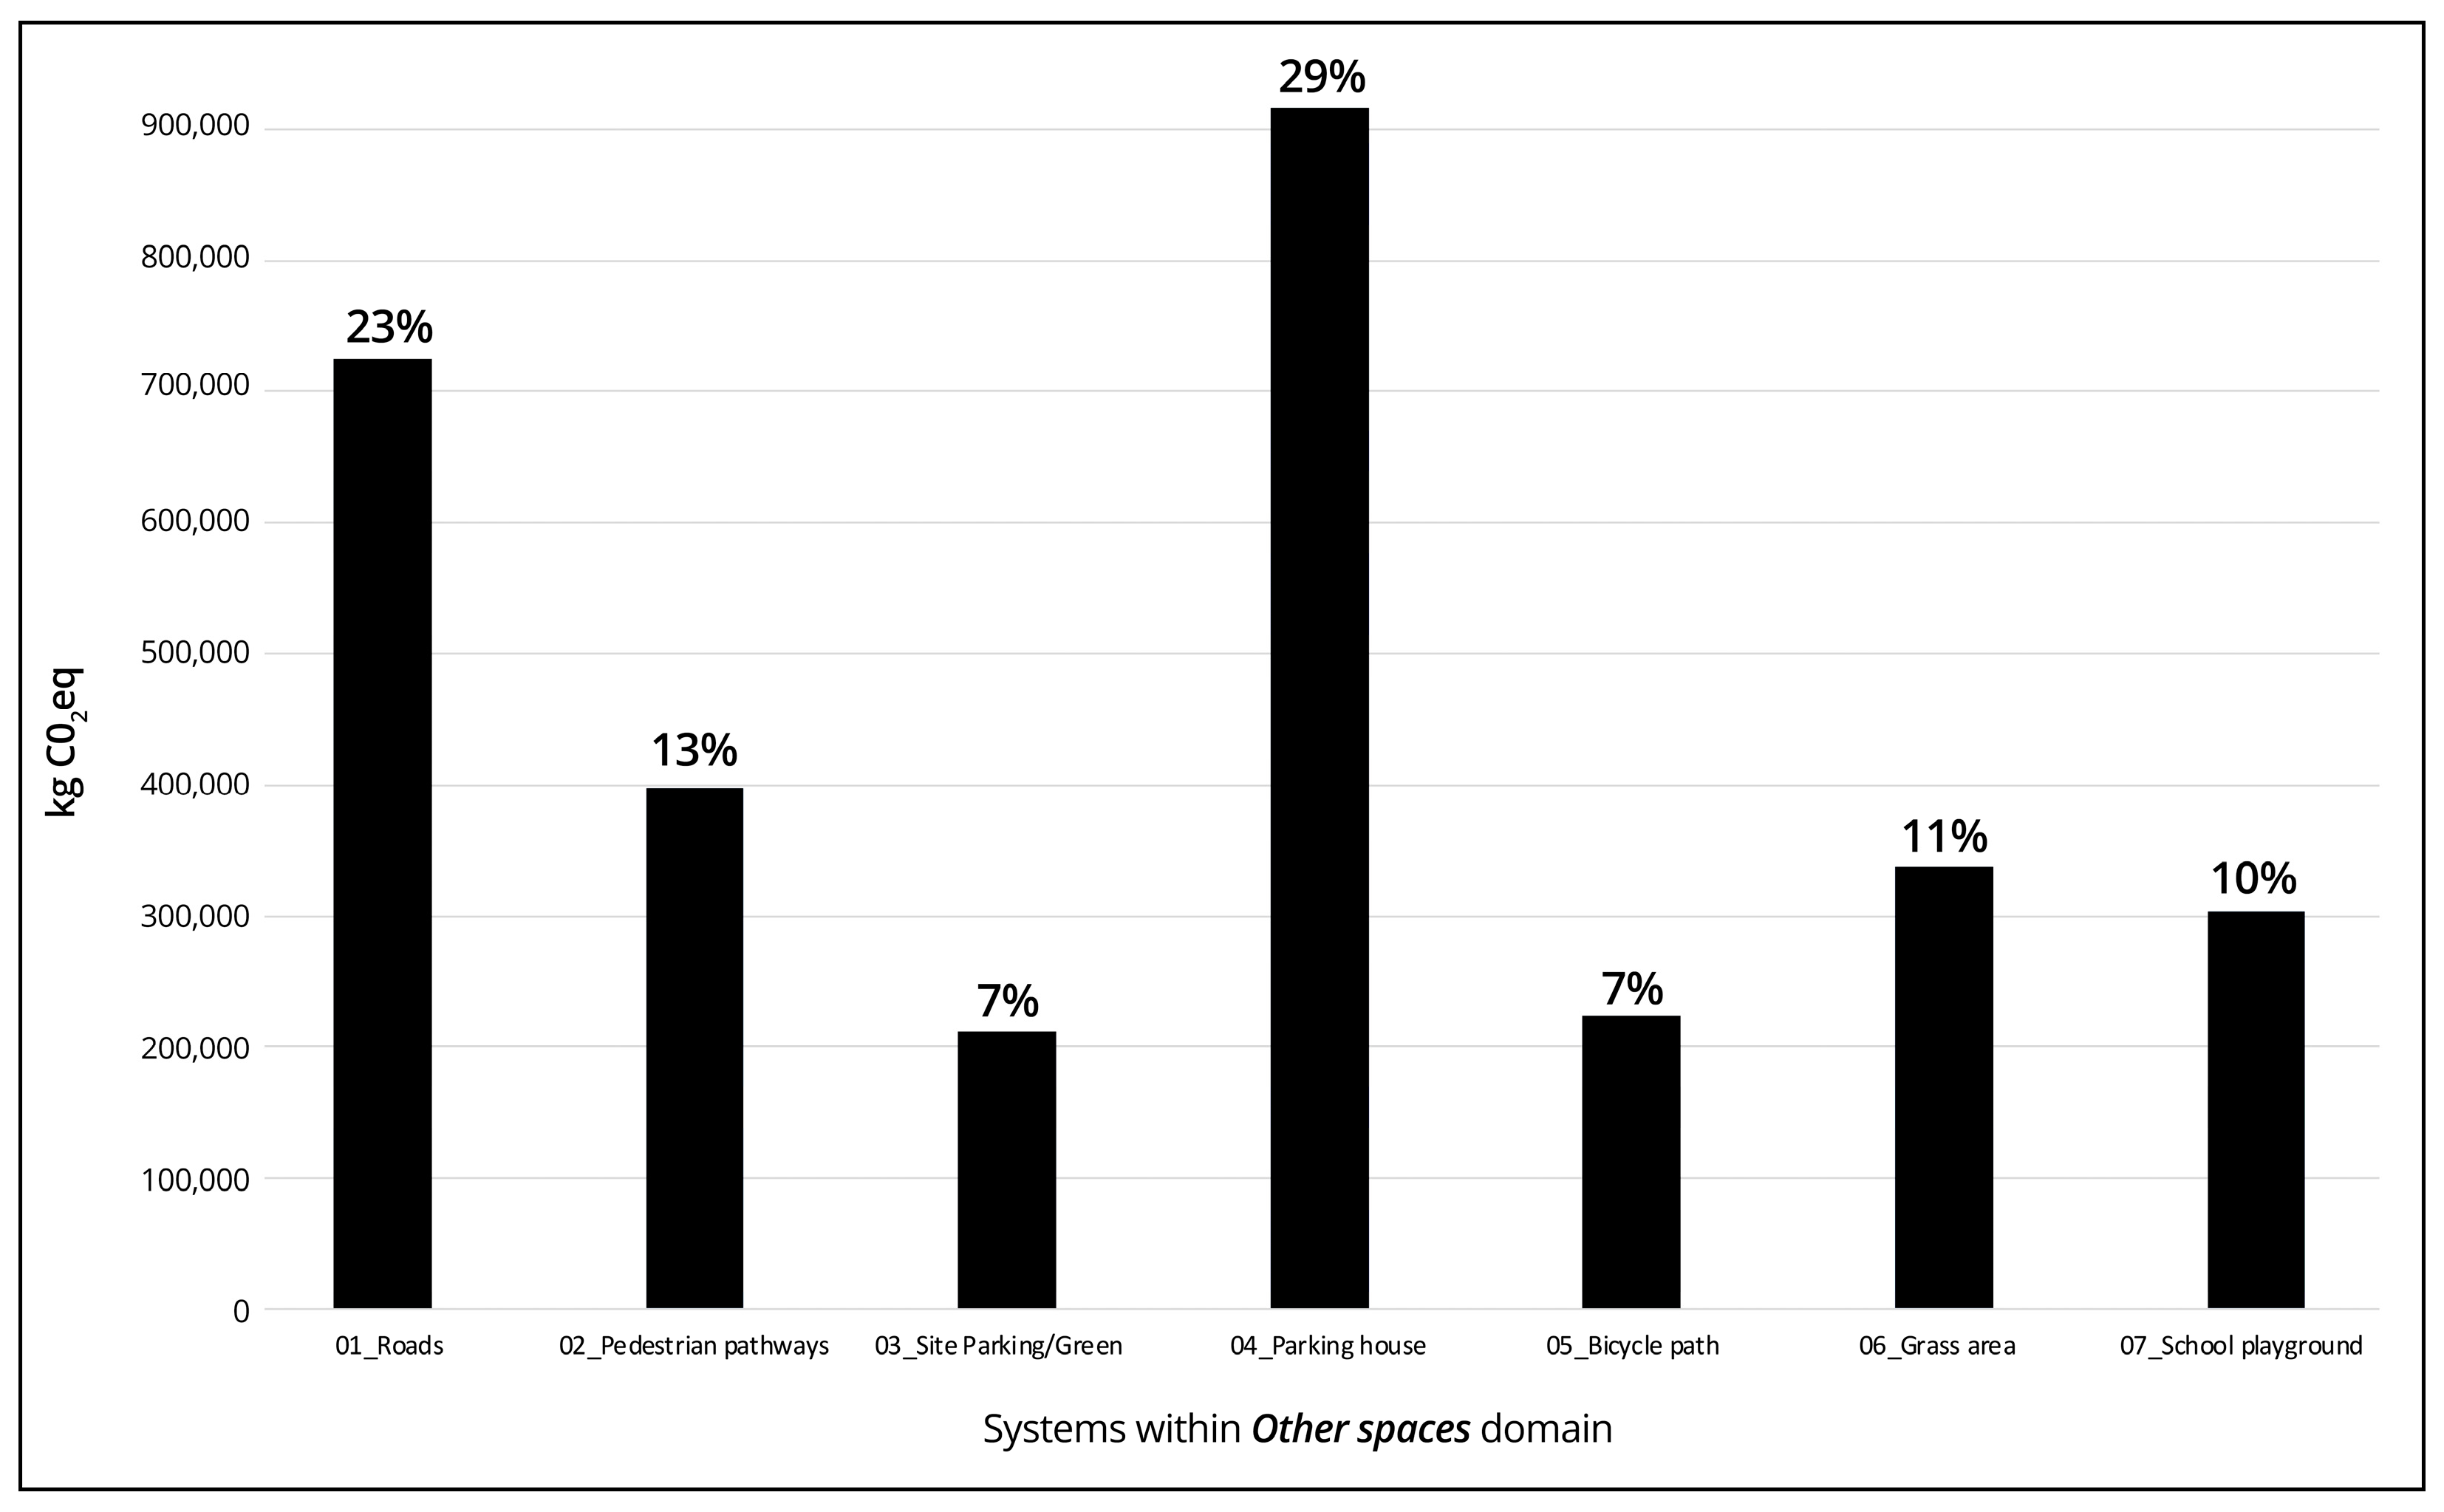
3.2.3. Hotspots by Different Systems within the Other Spaces Domain

Hotspot analysis of the different systems within the Other Spaces domain is divided into seven categories and shows the estimation of how much each system category contributes in relation to each other. The Parking house has the highest contribution to climate change emissions or 29%, and Roads come next with 23%, as shown in Figure 12. The Parking house contributes 917 tons CO2eq in total, and the Roads 725 tons CO2eq. The different systems within the Other Spaces domain and their percentage of contribution to the overall impact for the 18 impact categories assessed are visible in Supplementary Materials in Table S23.

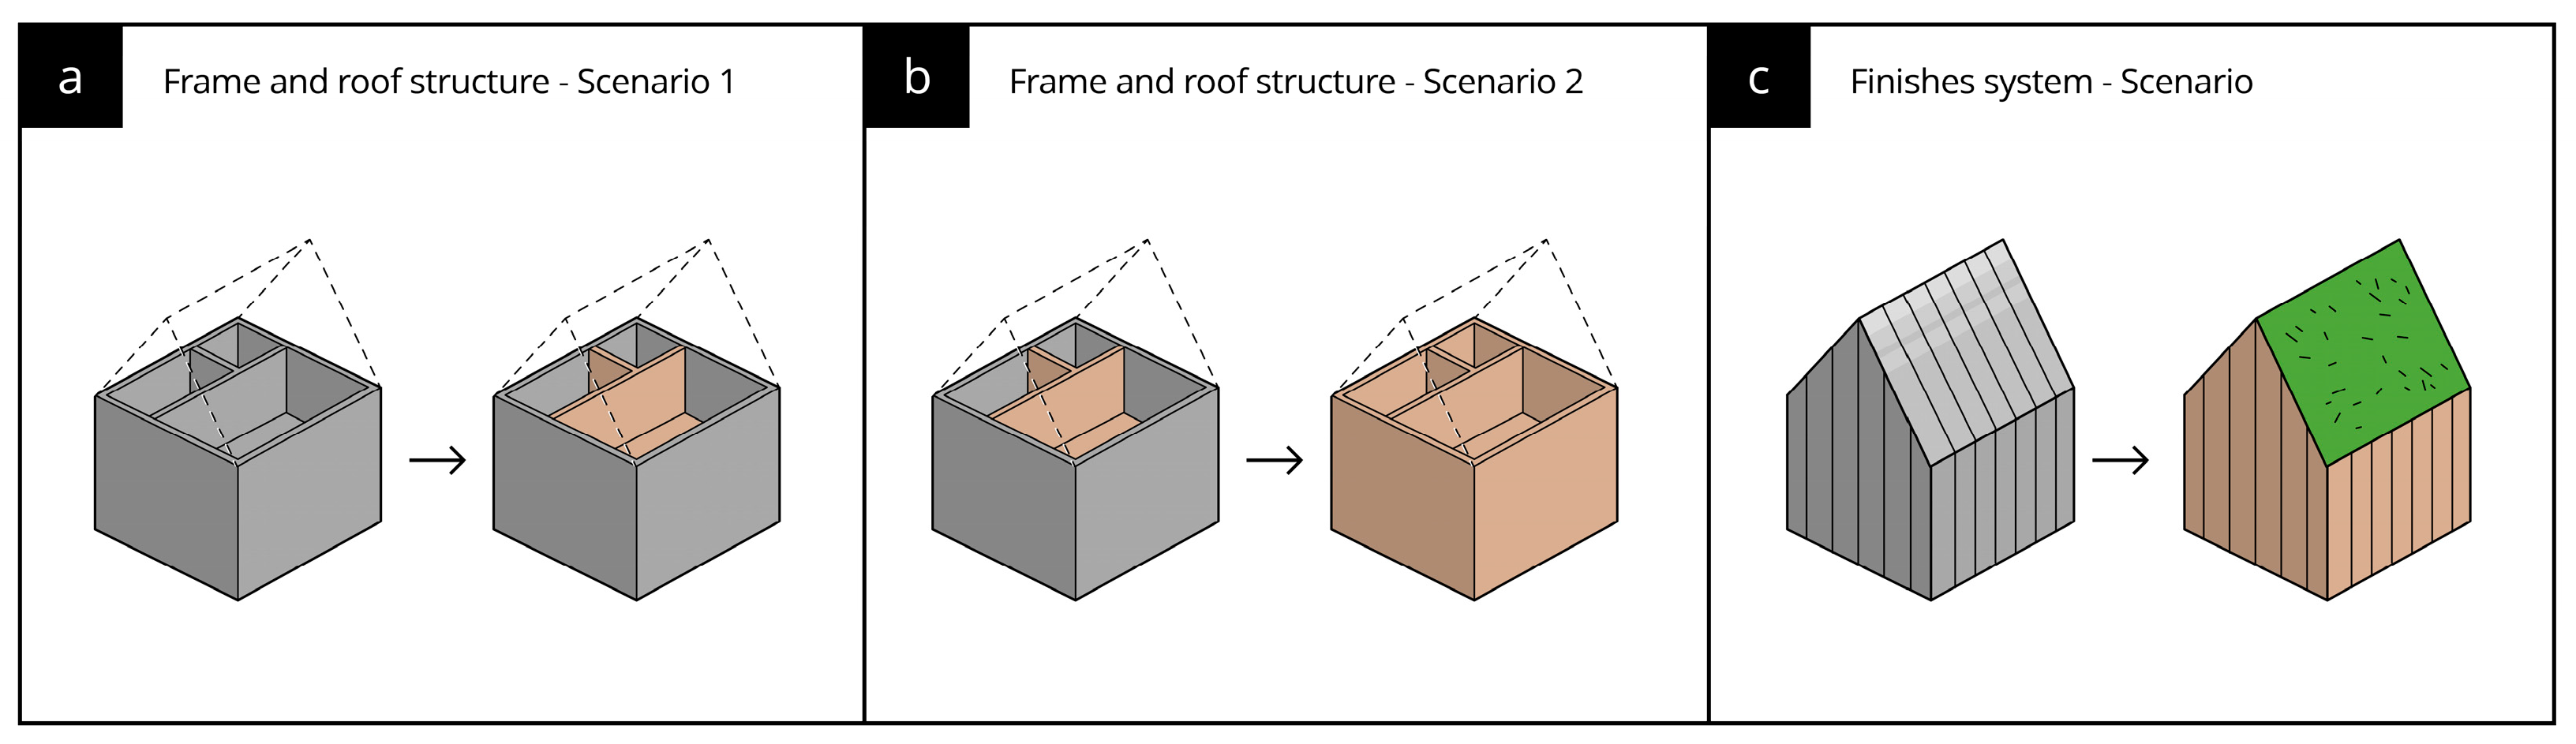
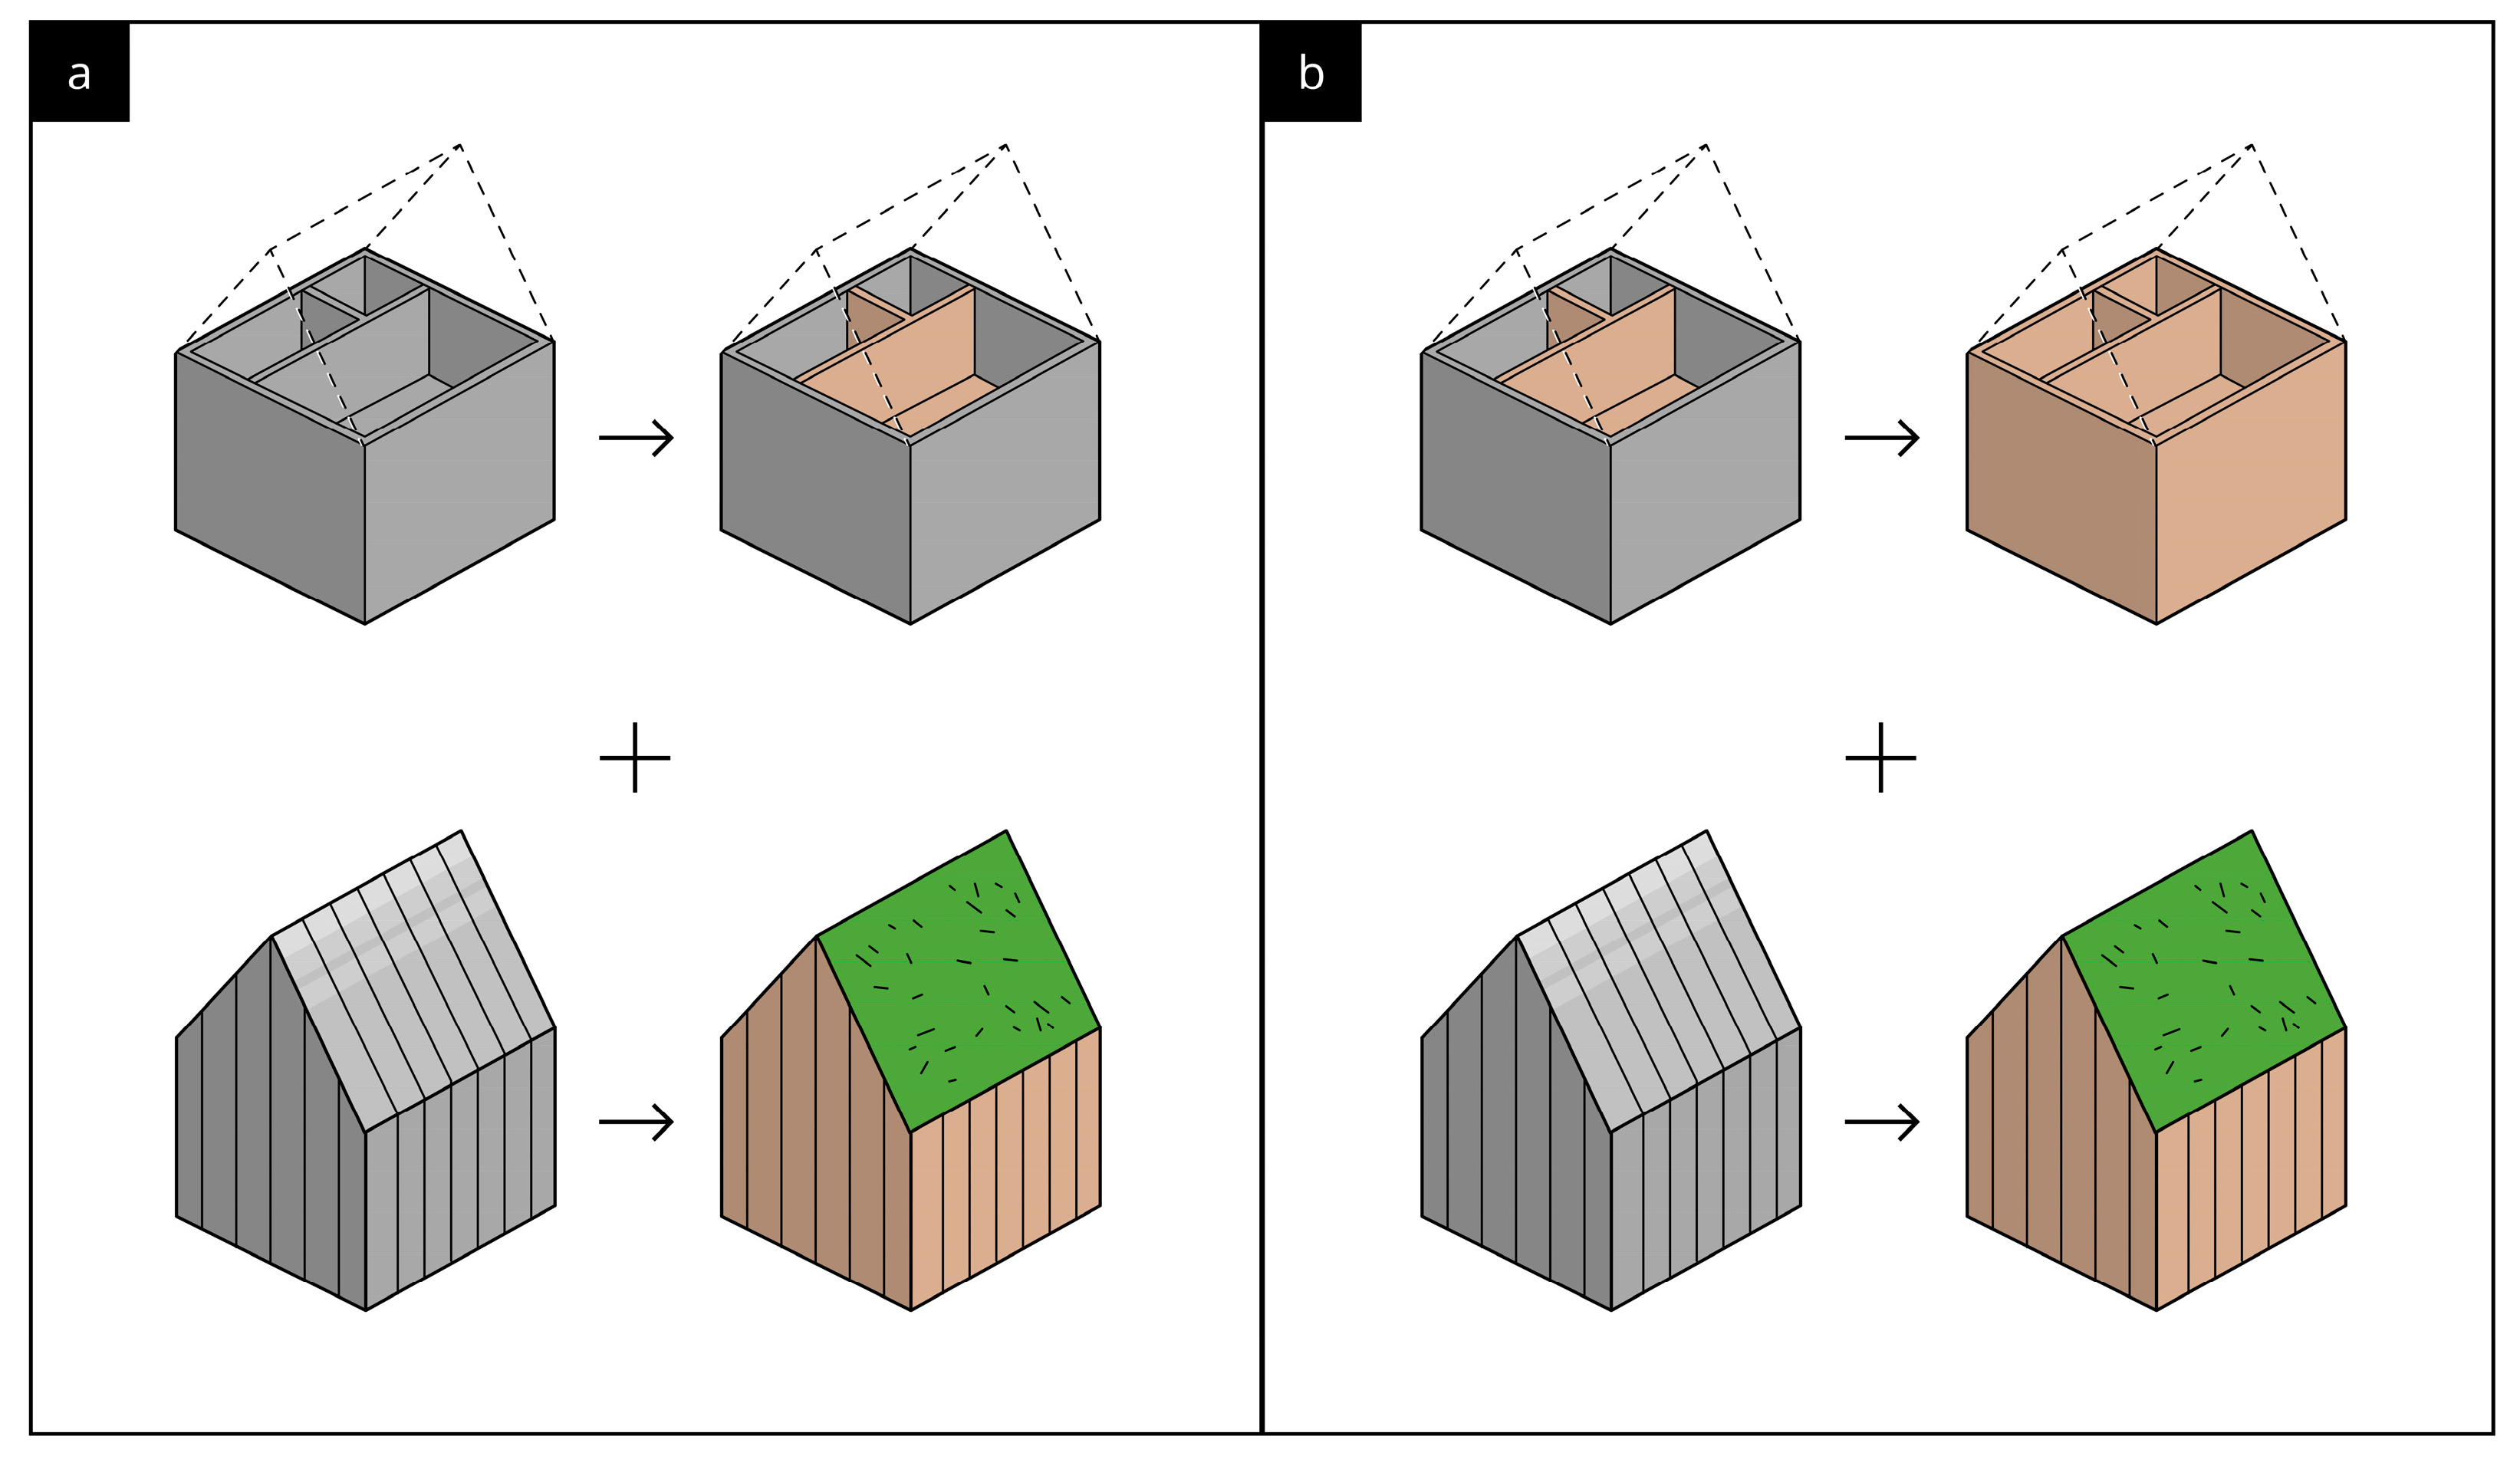
3.2.4. Material Replacement Scenarios

Replacement scenarios were conducted for the systems with the highest contribution within the Buildings domain (Frame and Roof Structure and Finishes). The results from the hotspot analysis showed that concrete contributed most of the emissions within the Frame and Roof Structure system, and aluminum cladding contributed most within the Finishes system, and therefore in the scenarios, those materials were replaced with less emission-loaded materials. The replacement scenarios use the same “Building system” as the base case assessment, described in Section 2.3.2.1. Building´s domain, and only replace materials within the Frame and Roof Structure system and cover materials within the Finishes system. Scenario 1 for the Frame and Roof Structure replaced all the internal concrete walls, stairs, and roof structures, shown in Figure 13a, with CLT timber structures, where the key qualities of the building structures were kept unchanged. The replacement estimated CLT internal timber walls to be 0.1 m thick, while the internal concrete walls were 0.2 m in the base case. The scenario decreased the use of reinforcement in accordance with the replacement of internal concrete. While insulation increased for noise quality reasons, adding 0.26 m thick insulation between apartments and 0.4 m thick insulation on upper floor slabs as used in the newly built CLT apartment building, Hagasel 23 in Reykjavík. The material quantity changes are shown in Table S24 in Supplementary Materials. The results for scenario 1 shows that climate change impact decreased by 5421 tons CO2eq or 31% from the base case. Scenario 2 also replaced all the external concrete walls with a CLT timber structure, as shown in Figure 13b, decreasing the reinforcement in accordance with the replacement of concrete while insulation for the exterior walls was kept the same at 0.1 m. The replacement of Scenario 2 led to a decrease of 7543 tons CO2eq or 44% from the base case. Table S24 in Supplementary Materials shows the quantity and materials used in different scenarios of the Frame and Roof Structure system.
Regarding the U-values of the buildings, the base case scenario is roughly estimated, showing U-values little under the maximum criteria according to Icelandic building regulations, as shown in Table 4, while the replacement scenario using CLT, shows even better thermal performance, as shown in Table 4.
The material replacement scenario for the Finishes system all-aluminum exterior wall claddings with timber, and all roofs were covered with grass instead of aluminum, as shown in the diagram in Figure 13c. The results for this scenario show that climate change impact decreased by 8204 tons CO2eq which is 80% from the base case. The quantity and materials from the base case to the replacement scenario are visible in Table S25 in Supplementary Materials. The replacement of roof cladding decreased climate change impact by 3310 tons CO2eq which is a 90% decrease from the base case. The replacement of wall cladding for all the buildings from being covered 2/3 with aluminum and 1/3 with timber to all being clad with timber shows a climate change impact decreased by 4893 tons CO2eq or a decrease of almost 97% from the base case. Tables S26–S30 in Supplementary Materials show results for the replacement scenarios for all the 18 impact categories assessed for the Frame and Roof Structure system and the Finishes system.
The results show the difference in the overall neighborhood emissions from using the base case scenario vs. the replacement of materials both in Frame and Roof Structure and in Finishes systems, as shown in Figure 14a,b. The results using scenario 1 in Frame and Roof Structure combined with the Finishes scenario show a decrease in climate change impact on the neighborhood to give an estimate of 13,625 tons CO2eq which is a 38% decrease from the base case. Using scenario 2 in the Frame and Roof Structure combined with the scenario of the Finishes system shows a 41% decrease in climate change impact from the base case to an estimated 15,747 tons CO2eq. Tables S31 and S32 in the Supplementary Materials show results for the replacement scenarios for the neighborhood, including the 18 impact categories assessed.

4. Discussion

This study aimed at providing a holistic view of the emissions embodied in the construction of a new neighborhood in Reykjavík, Iceland, namely the New Skerjafjörður neighborhood, and is also filling in the literature gap of LCA at a planning stage. The current built environment LCA literature lacks such case studies, which include the other built structures beyond buildings and look at the emissions allocating those from the supporting structures to the buildings driving those emissions. Further, with the case study consisting of conventional steel-reinforced concrete frame buildings with high GHGs associated, the aim was to analyze how changes in the material choices can reduce GHG emissions.

4.1. The Base Case Assessment

The results identify what elements of the pre-use phase neighborhood construction cause the most emissions and demonstrate the gain of using LCA already in the design stage. In that phase, LCAs can inform how to reduce the environmental load both for the design and policy making. While the main body of the paper focused on reporting the GHG emissions, 17 other ReCiPe impact categories were reported in the appendices, and therefore also contribute to the accumulation of knowledge over different impacts related to the built environment development.
The case neighborhood has a total construction volume (buildings and other spaces) of 178,855 m2. The results show a total climate change impact of 38,652 tons CO2eq., ~90% of which from the Building, 359 kg CO2eq/m2, and 10% from Other Spaces, 39 kg CO2eq/m2. This division between the two domains is very similar to the study by Säynäjoki et al. [24], which is one of the few previous studies that has analyzed emissions from the construction of a new residential area, including all built structures.
When assigning the impact of Buildings and Other Spaces related to the residential buildings to only the residential spaces, the results show a total climate change impact of 405 kg CO2eq/m2. When studied separately, the residential buildings accounted for 388 kg CO2eq per m2 and the parking house 153 kg CO2eq per m2 and the grass area 13 kg CO2eq per m2. The parking house is considered a space related to the residential buildings since there are no parking spaces available within the residential sites themselves, and residents are expected to use the parking house located in the neighborhood. This is a new approach regarding residential parking in Reykjavík. The emissions from the parking house add 14 kg CO2eq per m2 to the emissions attributable to the residential spaces. The road construction emissions resulted in ~725 tons of CO2eq, which is 50.5 kg CO2eq/m2. The road emissions results are very similar to the LCA study by Ingólfsdóttir et al. [52] for a typical Icelandic road. Generally, the assessed climate impacts are similar to those in previous studies for similar building types and when using a similar process—the LCA approach (see, e.g., the review of [12]). However, the assessment scope in this study left out two of the eight building systems, Fittings, and Mechanical Works, which would add to the climate change impact by around 44 kg CO2eq per m2 if using estimates from Heinonen et al. [18]. If included, according to the estimates from Heinonen et al., the total impact of residential and related spaces would be 449 kg CO2eq per m2, pushing this study well above the average level from Säynäjoki et al. [12]. Overall, Säynäjoki et al. [12] showed that previous case studies had reported estimates between 30–2000 kg of GHG emission per gross area, but this includes all building types and different impact assessment methods. The highest process LCA results were 770 kg CO2e m2 in their review, and the vast majority were between 200–400 kg CO2eq per m2 for concrete structure buildings. The large emissions range is, to a great extent, because of the different LCA methods chosen for the assessments. IO LCA results tend to be the highest, process LCA the lowest, and Hybrid LCA between those two [12].
We also reported the impact per resident planned to live in the neighborhood (1700 residents estimated in total). This FU gives an estimate of ~16 tons CO2eq per resident, using total residential and related spaces. GWP per residence (685 residential apartments in total) resulted in an estimate of ~40 tons CO2eq. These FUs provide useful information for decision-makers in terms of comparability with other per capita emission estimates, such as consumption-related carbon footprints, which a recent study estimated at ~7 tons CO2eq./a for an average consumer in Iceland [53]. Regarding the climate impact in relation to different building types, row houses accounted for the highest emissions with 480 kg CO2eq per m2, with detached houses closely following with 472 kg CO2eq per m2. The row houses had basement areas which the detached houses did not have. The apartment buildings accounted for 342–389 kg CO2eq per m2. Regarding apartment buildings, however, e.g., elevators were not included in the assessment. What considerably narrows down the gap between apartment buildings and other types is the large amount of common space within the apartment buildings. In addition, the outer spaces of the building sites were not included when studying these different types. The outer spaces are different between building sites regarding sizes and design implementations, how much area is paved or with grass. The climate change impact from the Other Spaces domain shows that the concrete pathway accounts for ~3 tons CO2eq per m2 while the grass area accounts for around 13 kg CO2eq per m2. Future studies should pay attention to this potentially important aspect.

4.2. The Hotspot Analysis

Since the Buildings domain was the dominant factor of the domains assessed, hotspot analysis was used to assess the emission load division between the building systems. Six of the eight systems categories were assessed, Earth and Ground Work, Foundation, Frame and Roof Structures, Complementary Works, Finishes, and Construction Site, while Fittings and Mechanical Works were not included. The results showed the Frame and Roof Structure had the highest emissions, accounting for 49% of the total emissions or 17,319 tons CO2eq, and thereafter Finishes, which accounted for 29% or 10,310 tons CO2eq. The Construction Site system, which was estimated with information from the study by Heinonen et al. [18], came in third place.
Further hotspot analyses on the Frame and Roof Structure and the Finishes systems were carried out since those two contributed the utmost of the emissions. Concrete was the material that had by far the highest environmental load in the Frame and Roof Structure system and accounted for 73% of the total climate change emissions, and reinforcement came next with almost 22%. Aluminum contributed the highest amount of emissions in the system of Finishes. Aluminum wall cladding accounted for 43.5%, and aluminum roof cladding was 34.5% of the total climate change emissions.

4.3. The Alternative Material Scenarios

This study showed the importance of considering the building materials that will be used for the buildings of a future built neighborhood. If materials and their impact would be considered in the site plan and the site plan terms, it could reach up to 41% CO2eq reductions in the overall neighborhood, according to this study, decreasing the emission load within the Buildings domain from 359 to 200 kg CO2eq/m2, meaning the lower end in the comparison presented by Säynäjoki et al. [12]. This reduction was achieved with replacement within the Frame and Roof Structure and Finishes, meaning that the potential is even higher if all systems were considered. In this study, wood was chosen as the replacement material (CLT and external cladding). It is also important to mention that the U-values of the buildings were not compromised by the replacement of concrete to the CLT structure. The base case scenario showed U-values little under the Icelandic building, but the replacement scenario using CLT gave even better thermal performance than the base case. Wood caused fewer emissions in the production phase compared to other construction materials such as steel and concrete, and wood can also act as a carbon sink [29,54]. Bio-based building materials like wood and bamboo are considered, according to current technology, the best way to store carbon in the built environment, where the highest amount of carbon storage is found in buildings constructed with massive cross-laminated timber (CLT) [55]. Bio-based materials might cause a higher end-of-life impact, which was not considered in this study, but this has also been questioned due to the high uncertainty related to the end-of-life timing and options at the time for buildings built now or in the future [32].
The results are very similar to the study by Amiri et al. [29], also using the process LCA method, which focused on embodied carbon emissions in an Icelandic educational building. That study showed a 43% decrease in climate change impact if wooden structures were chosen instead of reinforced concrete. The impact decreased from 644 to 379 kg CO2eq/m2 between the base case and the wooden building scenario. These results of the New Skerjafjörður study demonstrate that GHG emissions can be reduced if taking a holistic approach toward the future built neighborhood already at the planning stage. The building materials have a significant impact, and if materials with lower impacts are chosen, such as CLT for construction and facades clad with timber and grass on rooftops, then climate change impact can be reduced compared to the base case approach. It is also worth mentioning that this assessment does not include the carbon content of timber products. Depending on the end-of-life treatment of the timber products, using CLT could even make the buildings almost carbon neutral.
Weather conditions in each specific area as well as its natural conditions, play an important role. Icelandic harsh weather conditions and natural events like earthquakes and eruptions need to be taken into account when choosing the most suitable materials in relation to their durability and replacement rate. The study only considered the pre-use phase of the construction, and therefore, the material life span was not assessed in the study. According to Ji et al. [33], it is known that diverse aspects affect the building life span, and there is a great difference between building durability and its actual life span. The physical life span when a building reaches its technical limit is usually not the building’s actual life span. The functional life span when a building loses its value because of societal changes is much more common. Redevelopment of an area and buildings that no longer serve their uses or have lacked maintenance are the primary reasons affecting the building life span [33]. Similar results were found in a study by Huuhka and Lahdensivu [56] on demolished buildings in Finland, where most demolitions of buildings were due to new construction plans, especially within the city area. Wooden buildings and buildings made of reinforced concrete are generally considered to have 50–100 years life span, but in a study by Ji et al. [33], wooden buildings’ real average life span was 52.6 years, and buildings made of reinforced concrete real life span showed the average of 22.8 years. The study also claimed that wooden buildings had the highest average life span of the main frame types studied (which covered wood, brick, reinforced concrete, masonry, and steel, among other materials) and outlived reinforced concrete buildings by more than double [33].
It is of great relevance to promote building design that focuses on the disassembly of the materials at the end of their service in one building and reuse for a new service life circle in a new building. Today, the demolition of buildings is difficult because the materials are hard to separate and usually end up in landfills or incinerators [57]. For the disassembly of building materials to be of success, radical changes are needed in the way buildings are designed and built. Design for disassembly (DfD) is a promising strategy to be used for extending the service life of buildings which is an important factor in the development of low-carbon construction [32]. The DfD strategy uses standardized elements that are joined together and separated easily without using chemical connections [32]. A circular built environment would be a promising transition for reducing environmental impacts, resource consumption, and building waste [27].

4.4. Limitations

The data used for estimating the material quantity for the buildings and other spaces were based on the site plan drawings for the New Skerjafjörður area. These documents are not accurate architectural drawings and, therefore, simple preliminary architectural drawings were developed in the study from the available documents. Because of the large scale of the assessment, the architectural drawings were not developed in detail, which led to some uncertainty regarding the material load accuracy. For instance, the assessment estimated the bearing capacity for the reinforcement to be 50 kg/m3 concrete, which was based on typical Icelandic construction (B. Marteinsson, personal communication, 16 June 2021). However, that estimation is much lower than presented in the study by Amiri et al. [28], which calculates the reinforcement to be around 100 kg/m3 concrete. In addition, according to K. Sigurbjartsson, constructing architect, the amount of reinforcement has been changing in recent years, and nowadays, 60–80 kg/m3 concrete is commonly used (K. Sigurbjartsson, personal communication, September 5, 2022). If the reinforcement would be estimated using 100 kg/m3 concrete for the New Skerjafjörður assessment for all the buildings within the Buildings domain, the total climate change impact would increase from 37 to 74 kg CO2eq/m2, and the climate impact of the Building from 359 to 396 kg CO2eq/m2.
Uncertainties in relation to the life cycle inventory (LCI) of the assessment are apparent both in the Buildings domain and the Other Spaces domain. The LCI was more comprehensive in the Buildings domain than in the Other Spaces domain, and the Network domain was not included at all. The LCI for the Buildings domain left out two of the eight building systems, Fittings and Mechanical Works and the system of the Construction Site was not assessed with process LCA but estimated using results from the study by Heinonen et al. [18]. The Other Spaces domain only assessed the cover materials of the area, not accounting for the underground layers. The Networks domain likely has only a limited impact on the results if assuming similarity with the case assessed by Lausselet et al., [15], according to whom it only added 0.6% to the overall emissions. Overall, however, these data limitations raise uncertainty regarding the results, and according to Säynäjoki et al. [12], the results can report much lower emissions when the LCI is not comprehensive enough. Even with extensive LCI, the assessment is considered to suffer from a truncation error [12]. If only the direct energy consumption is included, the results show a truncation error of about 50%, and by including the second tier, the truncation error can still be 30% [12].
The Ecoinvent database used for this study is considered the most used database for the building sector [28]. However, the uncertainty aspect relates to the preciseness of the results due to different result outcomes between different database software used for the LCAs. This aspect regarding uniformity between software was tested by Emami et al. [58] using Ecoinvent with SimaPro software compared with GaBi software database, which concluded there was a significant difference between the results. Climate change impacts showed differences in the building load emissions, with results being 15% between the software databases [58]. Säynäjoki et al. [12] also discussed how all buildings that process LCAs suffer from the so-called first-tier truncation bias, meaning that with many components, the final production phase is cut out only when the material quantities are included.
The uncertainty regarding the preciseness of the results is partly because the Ecoinvent processes used for the study assessment were not changed or modified in any way to match the Icelandic conditions. The study used the Ecoinvent 3.71 database for the assessment, and no alternations were made to the available processes. That was done to keep the neighborhood assessment easy to use and less time-consuming, with the purpose of it being a useful tool for architects and designers at the design stage when planning a new area. However, the Ecoinvent database is mainly based on average or case values which might not be very precise regarding specific case conditions [18]. The uncertainties can also relate to the different software versions used for the assessment, which can give different results.
The model uncertainties also relate to the method chosen for the LCA assessment. The three different LCA methods available (process LCA, IO LCA, and hybrid LCA) do not come to the same results regarding the emission load when assessing the built environment [12,59]. Typically, process LCAs provide the lowest estimates due to the inherent truncation error, the IO LCA the highest, and the hybrid method is something in between the two [12]. This same finding was recently presented by Lausselet et al. [22,60] in a similar neighborhood-level study, who reported a much higher emission estimate when using a hybrid approach compared to process LCA. Due to the different inherent limitations of the process and IO LCA approaches, it has been claimed that a hybrid approach would produce the most accurate results [46,61,62,63].

5. Conclusions

The building sector has an enormous opportunity to play a leading role in combatting climate change and its impacts. A holistic approach is needed where environmental goals are set in the planning stage. The use of the LCA method could come of great importance for identifying the climate change emissions of the future built urban forms and for finding solutions to limit the emissions load as much as possible for future development. Material impacts need to be considered in site plan documents and their supporting special terms. In this way, the planning stage authorities, e.g., municipalities, could significantly limit the impact of future construction with stricter terms of materials for new neighborhoods. That would set the stage for both the architects as well as the developers and owners to take the next step in designing the neighborhood.
A holistic view of the environmental impacts on future settlements is important for making decisions that can minimize the impact as much as possible. Site plans and supporting papers like site plan terms and special terms should inform about the environmental impact predicted when planning a future settlement. Information regarding the environmental impacts can be studied with LCA. Furthermore, LCA is recommended for architects and designers to find solutions as well as for policy- and decision-makers to limit the impact as much as possible by studying other alternative solutions and having a holistic view of future developments. Thus, the municipality or others responsible for urban settlement developments could limit the material impact of future construction by using stricter terms of materials for new neighborhoods.

Supplementary Materials

The following supporting information can be downloaded at: https://www.mdpi.com/article/10.3390/su15065327/s1, Table S1: The building systems and the main materials in each system with the total quantity load of each material for the overall Buildings domain of the neighborhood. Tables S2–S14: Material load and impacts for Buildings domain site 1–13. Table S15: The seven systems of Other Spaces (OS) and the main materials in each system with the neighborhood total quantity load. Table S16: Material load and impacts for Other Spaces domain. Table S17: Results showing the total construction volume of the area within the Buildings (B) and Other Spaces (OS) domain for the 18 impact categories. Table S18: Results for one m2 of the gross area of the total built-up area of Building and Other Spaces domains for the 18 impact categories. Table S19: Results for one m2 of the gross area of all residential and related spaces of Buildings and Other Spaces domains for the 18 impact categories. Table S20: Results per resident and per residence of the gross area of all residential and related spaces for the 18 impact categories. Table S21: Results for one m2 of the gross area of the total building construction volume of the residential sites for the 18 impact categories. The results also show the different building types on each site. Table S22: Results for the different building systems and their percentage of contribution of the overall impact for each of the assessed impact categories. Red color shows the highest impact of over 50%, orange represents between 30–50%, yellow represents 10–30%, and the green color shows the lowest impact, which is under 10%. Table S23: Results for the different systems within the Other Spaces domain and their percentage of contribution to the overall impact for the 18 impact categories. Red color shows the highest impact of over 50%, orange represents between 30–50%, yellow represents 10–30%, and green color shows the lowest impact, which is under 10%. Table S24: Materials and quantity for the base case and replacement scenarios 1 and 2 for Frame and Roof Structure. Table S25: Materials and quantity for the base case and replacement scenario for Finishes. Table S26: Results for replacement scenario 1 of Frame and Roof Structure. Table S27: Results for replacement scenario 2 of Frame and Roof Structure. Table S28: Results for replacement scenario 1 for Finishes. Table S29: Results for replacement of roof claddings. The base case used mostly aluminum and partly grass, which was replaced so that all buildings were covered with grass. Table S30: Results for replacement of wall cladding of all the buildings. The base case used 2/3 aluminum and 1/3 timber, replaced with all buildings clad with timber. Table S31: Results show emissions changes for the neighborhood. Base case replaced with scenario 1 of Frame and Roof Structure and replacement scenario of Finishes. Table S32: Results show emissions changes for the neighborhood. Base case replaced with scenario 2 of Frame and Roof Structure and replacement scenario of Finishes.

Author Contributions

Conceptualization, all authors; methodology, all authors; software, H.S.S. and Ó.Ö.; validation, J.H., Á.Á. and Ó.Ö.; formal analysis, H.S.S.; investigation, H.S.S.; data curation, H.S.S.; writing—original draft preparation, H.S.S.; writing—review and editing, all authors; visualization, H.S.S.; supervision, J.H., Á.Á. and Ó.Ö.; project administration, J.H. All authors have read and agreed to the published version of the manuscript.

Funding

This research received no external funding.

Institutional Review Board Statement

Not applicable.

Informed Consent Statement

Not applicable.

Data Availability Statement

All the relevant data is published in the main body of the paper or as tables in the Supplementary Materials.

Acknowledgments

The authors thank Björn Marteinsson and Kjartan Sigurbjartsson for their contribution regarding the information on material load within the Icelandic building industry.

Conflicts of Interest

The authors declare no conflict of interest.

References

  1. Rockström, J.; Steffen, W.; Noone, K.; Persson, Å.; Chapin, F.S.; Lambin, E.F.; Lenton, T.M.; Scheffer, M.; Folke, C.; Schellnhuber, H.J.; et al. A safe operating space for humanity. Nature 2009, 461, 472–475. [Google Scholar] [CrossRef] [PubMed]
  2. Steffen, W.; Broadgate, W.; Deutsch, L.; Gaffney, O.; Ludwig, C. The trajectory of the Anthropocene: The great acceleration. Anthr. Rev. 2015, 2, 81–98. [Google Scholar] [CrossRef]
  3. UN-Habitat. World Cities Report 2020: The Value of Sustainable Urbanization. 2020. Available online: https://unhabitat.org/sites/default/files/2020/10/wcr_2020_report.pdf (accessed on 10 February 2021).
  4. Getter, K.L.; Rowe, D.B. The role of extensive green roofs in sustainable development. HortScience 2006, 41, 1276–1285. [Google Scholar] [CrossRef] [Green Version]
  5. United Nations Environment Programme. 2021 Global Status Report for Buildings and Construction: Towards a Zero-Emission, Efficient and Resilient Buildings and Construction Sector. Nairobi. 2021. Available online: https://www.unep.org/resources/report/2021-global-status-report-buildings-and-construction (accessed on 14 May 2022).
  6. Ewing, R.; Cervero, R. Travel and the built environment: A meta-analysis. J. Am. Plan. Assoc. 2010, 76, 265–294. [Google Scholar] [CrossRef]
  7. Fuller, R.; Crawford, R. Impact of past and future residential housing development patterns on energy demand and related emissions. J. Hous. Built Environ. 2011, 26, 165–183. [Google Scholar] [CrossRef]
  8. Holden, E.; Norland, I.T. Three challenges for the compact city as a sustainable urban form: Household consumption of energy and transport in eight residential areas in the greater Oslo region. Urban Stud. 2005, 42, 2145–2166. [Google Scholar] [CrossRef]
  9. VandeWeghe, J.R.; Kennedy, C. A spatial analysis of residential greenhouse gas emissions in the Toronto census metropolitan area. J. Ind. Ecol. 2007, 11, 133–144. [Google Scholar] [CrossRef]
  10. Glaeser, E.L.; Kahn, M.E. The greenness of cities: Carbon dioxide emissions and urban development. J. Urban Econ. 2010, 67, 404–418. [Google Scholar] [CrossRef] [Green Version]
  11. Heinonen, J.; Jalas, M.; Juntunen, J.K.; Ala-Mantila, S.; Junnila, S. Situated lifestyles: I. How lifestyles change along with the level of urbanization and what the greenhouse gas implications are—A study of Finland. Environ. Res. Lett. 2013, 8, 025003. [Google Scholar] [CrossRef]
  12. Säynäjoki, A.; Heinonen, J.; Junnila, S.; Horvath, A. Can life-cycle assessment produce reliable policy guidelines in the building sector? Environ. Res. Lett. 2017, 12, 013001. [Google Scholar] [CrossRef] [Green Version]
  13. Albertí, J.; Balaguera, A.; Brodhag, C.; Fullana-i-Palmer, P. Towards life cycle sustainability assessment of cities. A review of background knowledge. Sci. Total Environ. 2017, 609, 1049–1063. [Google Scholar] [CrossRef] [PubMed]
  14. Albertí, J.; Brodhag, C.; Fullana-i-Palmer, P. First steps in life cycle assessments of cities with a sustainability perspective: A proposal for goal, function, functional unit, and reference flow. Sci. Total Environ. 2019, 646, 1516–1527. [Google Scholar] [CrossRef]
  15. Lausselet, C.; Borgnes, V.; Brattebø, H. LCA modelling for Zero Emission Neighbourhoods in early stage planning. Build. Environ. 2019, 149, 379–389. [Google Scholar] [CrossRef]
  16. Lotteau, M.; Loubet, P.; Pousse, M.; Dufrasnes, E.; Sonnemann, G. Critical review of life cycle assessment (LCA) for the built environment at the neighborhood scale. Build. Environ. 2015, 93, 165–178. [Google Scholar] [CrossRef]
  17. Zhang, B.; Su, S.; Zhu, Y.; Li, X. An LCA-based environmental impact assessment model for regulatory planning. Environ. Impact Assess. Rev. 2020, 83, 106406. [Google Scholar] [CrossRef]
  18. Heinonen, J.; Säynäjoki, A.; Junnonen, J.-M.; Pöyry, A.; Junnila, S. Pre-use phase LCA of a multi-story residential building: Can greenhouse gas emissions be used as a more general environmental performance indicator? Build. Environ. 2016, 95, 116–125. [Google Scholar] [CrossRef] [Green Version]
  19. Sartori, I.; Hestnes, A.G. Energy use in the life cycle of conventional and low-energy buildings: A review article. Energy Build. 2007, 39, 249–257. [Google Scholar] [CrossRef]
  20. Anand, C.K.; Amor, B. Recent developments, future challenges and new research directions in LCA of buildings: A critical review. Renew. Sustain. Energy Rev. 2017, 67, 408–416. [Google Scholar] [CrossRef]
  21. Hausichld, M.Z.; Rosenbaum, R.K.; Olsen, S.I. Life Cycle Assessment; Springer: Berlin/Heidelberg, Germany, 2018; Volume 2018. [Google Scholar]
  22. Lausselet, C.; Lund, K.M.; Brattebø, H. LCA and scenario analysis of a Norwegian net-zero GHG emission neighbourhood: The importance of mobility and surplus energy from PV technologies. Build. Environ. 2021, 189, 107528. [Google Scholar] [CrossRef]
  23. Ruuska, A.P.; Häkkinen, T.M. The significance of various factors for GHG emissions of buildings. Int. J. Sustain. Eng. 2015, 8, 317–330. [Google Scholar] [CrossRef]
  24. Säynäjoki, A.; Heinonen, J.; Junnila, S. A scenario analysis of the life cycle greenhouse gas emissions of a new residential area. Environ. Res. Lett. 2012, 7, 034037. [Google Scholar] [CrossRef]
  25. Crawford, R.H.; Bartak, E.L.; Stephan, A.; Jensen, C.A. Evaluating the life cycle energy benefits of energy efficiency regulations for buildings. Renew. Sustain. Energy Rev. 2016, 63, 435–451. [Google Scholar] [CrossRef]
  26. Müller, D.B.; Liu, G.; Løvik, A.N.; Modaresi, R.; Pauliuk, S.; Steinhoff, F.S.; Brattebø, H. Carbon Emissions of Infrastructure Development. Environ. Sci. Technol. 2013, 47, 11739–11746. [Google Scholar] [CrossRef] [PubMed]
  27. Eberhardt, L.C.M.; van Stijn, A.; Kristensen Stranddorf, L.; Birkved, M.; Birgisdottir, H. Environmental Design Guidelines for Circular Building Components: The Case of the Circular Building Structure. Sustainability 2021, 13, 5621. [Google Scholar] [CrossRef]
  28. Amiri, A.; Emami, N.; Ottelin, J.; Sorvari, J.; Marteinsson, B.; Heinonen, J.; Junnila, S. Embodied emissions of buildings—A forgotten factor in green building certificates. Energy Build. 2021, 241, 110962. [Google Scholar] [CrossRef]
  29. Amiri, A.; Ottelin, J.; Sorvari, J.; Junnila, S. Cities as carbon sinks—Classification of wooden buildings. Environ. Res. Lett. 2020, 15, 094076. [Google Scholar] [CrossRef]
  30. Mouton, L.; Allacker, K.; Röck, M. Bio-based building material solutions for environmental benefits over conventional construction products—Life cycle assessment of regenerative design strategies (1/2). Energy Build. 2023, 282, 112767. [Google Scholar] [CrossRef]
  31. Mouton, L.; Trigaux, D.; Allacker, K.; Röck, M. Low-tech passive solar design concepts and bio-based material solutions for reducing life cycle GHG emissions of buildings—Life cycle assessment of regenerative design strategies (2/2). Energy Build. 2023, 282, 112678. [Google Scholar] [CrossRef]
  32. Joensuu, T.; Leino, R.; Heinonen, J.; Saari, A. Developing Buildings’ Life Cycle Assessment in Circular Economy-Comparing methods for assessing carbon footprint of reusable components. Sustain. Cities Soc. 2022, 77, 103499. [Google Scholar] [CrossRef]
  33. Ji, S.; Lee, B.; Yi, M.Y. Building life-span prediction for life cycle assessment and life cycle cost using machine learning: A big data approach. Build. Environ. 2021, 205, 108267. [Google Scholar] [CrossRef]
  34. Stjórnarráðið. Aðgerðaáætlun í loftslags—Álum—Aðgerðir Íslenskra Stjórnvalda til að Stuðla að Samdrætti í Losun Gróðurhúsalofttegunda til 2030; The Icelandic Government: Reykjavík, Iceland, 2020. Available online: https://www.stjornarradid.is/library/—-Rit--skyrslur-og-skrar/Adgerdaaetlun%20i%20loftslagsmalum%20onnur%20utgafa.pdf (accessed on 8 March 2023).
  35. Bjarnadóttir, S.; Marteinsson, B. Vegvísir að Vistvænni Mannvirkjagerð 2030. 1.Hluti Mat á Kolefnislosun frá Íslenskum Byggingariðnaði; Húsnæðis-Og Mannvirkjastofnun: Reykjavík, Iceland, 2022. [Google Scholar]
  36. Hollráð um Heitt Vatn: Hvernig Getum við Nýtt Heita Vatnið Betur? Available online: https://www.veitur.is/hollrad-um-heitt-vatn (accessed on 8 March 2023).
  37. Alþingi. Lög um Umhverfismat Framkvæmda og Áætlana nr. 111/2021. Available online: https://www.althingi.is/altext/stjt/2021.111.html (accessed on 4 March 2023).
  38. Alþingi. Skipulagslög nr. 123/2010. Available online: https://www.althingi.is/lagas/nuna/2010123.html (accessed on 9 August 2022).
  39. Huang, B.; Gao, X.; Xu, X.; Song, J.; Geng, Y.; Sarkis, J.; Fishman, T.; Kua, H.; Nakatani, J. A life cycle thinking framework to mitigate the environmental impact of building materials. One Earth 2020, 3, 564–573. [Google Scholar] [CrossRef]
  40. Reykjavíkurborg, Umhverfis-og skipulagssvið. Aðalskipulag Reykjavíkur 2040, A: Megin Markmið um Þróun Byggðar og Vindandi Ákvæði um Landnotkun, Byggingarmagn, Þéttleika og Yfirbragð Byggðar; Umhverfis-og Skipulagssvið: Reykjavík, Iceland, 2021. [Google Scholar]
  41. Geodatos. Reykjavík Geographic Coordinates. Available online: www.geodatos.net/en/coordinates/iceland/reykjavik (accessed on 4 March 2023).
  42. Islandsstofa. The Big Picture. Available online: https://www.iceland.is/the-big-picture/nature-environment/geography#:~:text=The%20average%20summer%20temperature%20in,often%20changes%20in%20an%20instant (accessed on 4 March 2023).
  43. Reykjavíkurborg, Umhverfis-og Skipulagssvið. Aðalskipulag Reykjavíkur 2010–2030 B-hluti; Umhverfis-og Skipulagssvið: Reykjavík, Iceland, 2014. [Google Scholar]
  44. Reykjavíkurborg, Umhverfis-og Skipulagssvið. Skerjafjörður, Rammaskipulag, Greinargerð og Leiðarljós; Umhverfis-og Skipulagssvið: Reykjavík, Iceland, 2018. [Google Scholar]
  45. Reykjavíkurborg, Umhverfis-og Skipulagssvið. Nýi Skerjafjörður-Tillaga að Nýju Deiliskipulagi. Greinargerð og Almennir Skipulagsskilmálar, 26 júní 2020; Umhverfis-og skipulagssvið: Reykjavík, Iceland, 2021. [Google Scholar]
  46. Crawford, R.H.; Bontinck, P.-A.; Stephan, A.; Wiedmann, T.; Yu, M. Hybrid life cycle inventory methods–A review. J. Clean. Prod. 2018, 172, 1273–1288. [Google Scholar] [CrossRef]
  47. ISO Standard Nr. 14044; Environmental Management-Life Cycle Assessment-Requirements and Guidelines. International Organization for Standardization: London, UK, 2006.
  48. ISO Standard Nr. 14040; Environmental Management-Life Cycle Assessment-Requirements and Guidelines. International Organization for Standardization: London, UK, 2006.
  49. Steinsteypan. Hefbundnar Steyputegundir. Available online: https://steinsteypan.is/steypa/stadladar-steyputegundir (accessed on 10 April 2022).
  50. Dong, Y.H.; Ng, S.T. Comparing the midpoint and endpoint approaches based on ReCiPe—A study of commercial buildings in Hong Kong. Int. J. Life Cycle Assess. 2014, 19, 1409–1423. [Google Scholar] [CrossRef]
  51. Huijbregts, M.A.; Steinmann, Z.J.; Elshout, P.M.; Stam, G.; Verones, F.; Vieira, M.; van Zelm, R. ReCiPe2025 armonizedonised life cycle impact assessment method at midpoint and endpoint level. Int. J. Life Cycle Assess. 2017, 22, 138–147. [Google Scholar] [CrossRef]
  52. Ingólfsdóttir, G.; Gunnarsson, F.; Bjarnadóttir, H.; Stefánsdóttir, M.; Gunnarsson, R. Vistferilsgreining Fyrir Veg—Rannsóknarverkefni Vegagerðarinnar 2012; Efla verkfræðistofa: Reykjavík, Iceland, 2012. [Google Scholar]
  53. Heinonen, J.; Olson, S.; Czepkiewicz, M.; Árnadóttir, Á.; Ottelin, J. Too much consumption or too high emissions intensities? Explaining the high consumption-based carbon footprints in the Nordic countries. Environ. Res. Commun. 2022, 4, 125007. [Google Scholar] [CrossRef]
  54. Churkina, G.; Organschi, A.; Reyer, C.P.; Ruff, A.; Vinke, K.; Liu, Z.; Reck, B.K.; Graedel, T.E.; Schellnhuber, H.J. Buildings as a global carbon sink. Nat. Sustain. 2020, 3, 269–276. [Google Scholar] [CrossRef]
  55. Kuittinen, M.; Zernicke, C.; Slabik, S.; Hafner, A. How can carbon be stored in the built environment? A review of potential options. Archit. Sci. Rev. 2023, 66, 91–107. [Google Scholar] [CrossRef]
  56. Huuhka, S.; Lahdensivu, J. Statistical and geographical study on demolished buildings. Build. Res. Inf. 2016, 44, 73–96. [Google Scholar] [CrossRef]
  57. Bribián, I.Z.; Capilla, A.V.; Usón, A.A. Life cycle assessment of building materials: Comparative analysis of energy and environmental impacts and evaluation of the eco-efficiency improvement potential. Build. Environ. 2011, 46, 1133–1140. [Google Scholar] [CrossRef]
  58. Emami, N.; Heinonen, J.; Marteinsson, B.; Säynäjoki, A.; Junnonen, J.-M.; Laine, J.; Junnila, S. A life cycle assessment of two residential buildings using two different LCA database-software combinations: Recognizing uniformities and inconsistencies. Buildings 2019, 9, 20. [Google Scholar] [CrossRef] [Green Version]
  59. Säynäjoki, A.; Heinonen, J.; Junnonen, J.M.; Junnila, S. Input–output and process LCAs in the building sector: Are the results compatible with each other? Carbon Manag. 2017, 8, 155–166. [Google Scholar] [CrossRef]
  60. Lausselet, C.; Crawford, R.H.; Brattebø, H. Hybrid life cycle assessment at the neighbourhood scale: The case of Ydalir, Norway. Clean. Eng. Technol. 2022, 8, 100503. [Google Scholar] [CrossRef]
  61. Pomponi, F.; Lenzen, M. Hybrid life cycle assessment (LCA) will likely yield more accurate results than process-based LCA. J. Clean. Prod. 2018, 176, 210–215. [Google Scholar] [CrossRef] [Green Version]
  62. Stephan, A.; Crawford, R.H.; Bontinck, P.-A. A model for streamlining and automating path exchange hybrid life cycle assessment. Int. J. Life Cycle Assess. 2018, 24, 237–252. [Google Scholar] [CrossRef]
  63. Majeau-Bettez, G.; Strømman, A.H.; Hertwich, E.G. Evaluation of process- and input-output-based life cycle inventory data with regard to truncation and aggregation issues. Environ. Sci. Technol. 2011, 45, 10170–10177. [Google Scholar] [CrossRef]
Figure 1. New Skerjafjörður overview picture, area marked with red circle.
Sustainability 15 05327 g001
Figure 2. The site plan construction division between the first and second phases.
Sustainability 15 05327 g002
Figure 3. The explanatory drawing of phase 1.
Sustainability 15 05327 g003
Figure 4. System boundary of the LCA for the site plan according to BS EN 15804. Adapted from U.S Green Building Council, 2012.
Sustainability 15 05327 g004
Figure 5. Buildings domain and Other Spaces domain diagram.
Sustainability 15 05327 g005
Figure 6. Diagram of systems within the Other Spaces domain.
Sustainability 15 05327 g006
Figure 7. Diagram of the assessed domains, Buildings, and Other Spaces showing the total impact of climate change.
Sustainability 15 05327 g007
Figure 8. (a) A diagram of the results of the residential buildings, grass area, and parking house is shown separately. (b) Diagram of the results of the residential buildings, grass area, and the parking house combined together and divided by the area of the residential spaces.
Sustainability 15 05327 g008
Figure 9. (a). Shows the impact (kg CO2eq) per resident and per residence of the neighborhood. (b). Shows the impact (kg CO2eq) for one m2 of gross residential space of the different building types of each site.
Sustainability 15 05327 g009
Figure 10. Shows the impact (kg CO2eq) for the gross distribution of building load for the different residential sites of the neighborhood.
Sustainability 15 05327 g010
Figure 11. The climate change impact (kg CO2eq) of the gross distribution by different building systems and the percentage of contribution within different systems within the Buildings domain.
Sustainability 15 05327 g011
Figure 12. Shows the climate change impact (kg CO2eq) by different systems and the percentage of contribution within different systems within the Other Spaces domain.
Sustainability 15 05327 g012
Figure 13. (a). The frame and roof structure diagram of scenario 1 (concrete replaced with CLT timber structure for all internal walls, stairs, and roof structure). (b). Scenario 2, where the external concrete walls are also replaced with CLT timber structures. (c). Diagram of the replacement scenario for the Finishes system where aluminum claddings are replaced with timber and aluminum roof replaced with grass.
Sustainability 15 05327 g013
Figure 14. (a). Frame and Roof Structure scenario 1 and replacement scenario of the Finishes system. (b). Frame and Roof Structure scenario 2 and replacement scenario of the Finishes system.
Sustainability 15 05327 g014
Table 1. The first phase of New Skerjafjörður characteristics.
CharacteristicsDescription
NS1. Total area site size950,000 m2
Total building site size59,790 m2
Total residential apartments685
Utilization ratio (A + B spaces *)1.5
Total Utilization ratio1.8
Total construction volume (A + B space)87,840 m2
Total underground volume17,105 m2
Total construction volume104,945 m2
* A spaces are closed spaces; B spaces are closed at the top but open on sides partly or fully.
Table 2. The site plan system boundary domain division.
Buildings (B)m2Other Spaces (OS)m2
Residential (68%)67,315Roads14,346
Detached houses2400Pedestrian pathways12,405
Row houses7780Site Parking/Green6470
Apartment buildings28,453Parking house6000
Economical apartments11,392Bicycle path5248
Student housing9430Grass area26,127
Nursing homes7860School playground9309
Service (32%)31,630
School and Kindergarten19,250
Shops/services11,340
Pumping station1040
Total construction volume B98,945Total construction volume OS79,905
Table 3. Building system used for Buildings (B).
Building Systems
1Earth and Groundwork (e.g., excavation, ground structure and improvement, drains and pipelines)
2Foundations (e.g., foundation walls, columns and ground beams)
3Frame and Roof Structures (e.g., external walls, load-bearing internal walls and columns, insulation)
4Complementary Works (e.g., windows, doors)
5Finishes (e.g., surface materials, paints)
6Fittings, equipment and installations (e.g., kitchen and bathroom furniture, devices, appliances)
7Mechanical Works (e.g., heating, plumbing and drainage, HV AC, electricity system)
8Construction Site (e.g., fuels, electricity, water)
Table 4. Shows U-values for Icelandic building regulation, base case, and CLT scenario.
Building PartRegulation Maximum (U)Base CaseCLT Scenario
Roof0.200.20N/A
External walls0.400.390.33
Basement slab0.300.250.25
Windows/doors2.0/3.01.751.75
Disclaimer/Publisher’s Note: The statements, opinions and data contained in all publications are solely those of the individual author(s) and contributor(s) and not of MDPI and/or the editor(s). MDPI and/or the editor(s) disclaim responsibility for any injury to people or property resulting from any ideas, methods, instructions or products referred to in the content.

