
Brand Premium and Carbon Information Disclosure Strategy: Evidence from China Listed Companies


Abstract
1. Introduction
2. Related Research and Hypothesis Development
2.1. Brand Value Creation
2.2. The Influence of Carbon Information Disclosure on Brand Value
2.3. How Does the Carbon Information Disclosure Influence Brand Value?
2.3.1. Carbon Information, Customer and Brand Value
2.3.2. Carbon Information, Analyst Rating and Brand Value
2.3.3. Carbon Information, Financial Performance and Brand Value
3. Research
3.1. Sample and Data
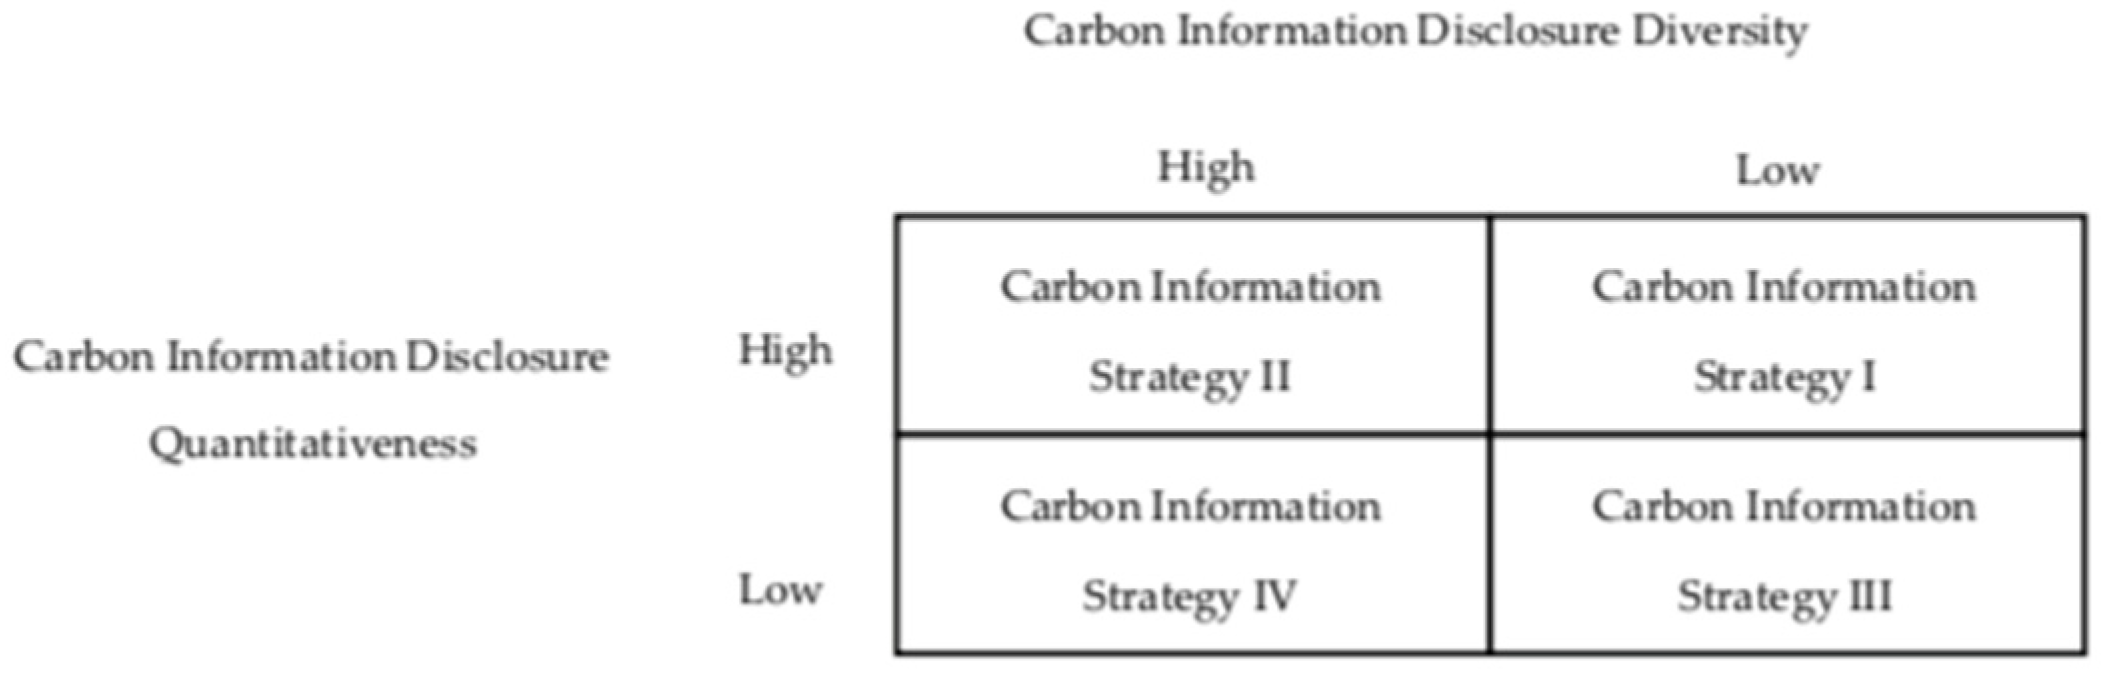
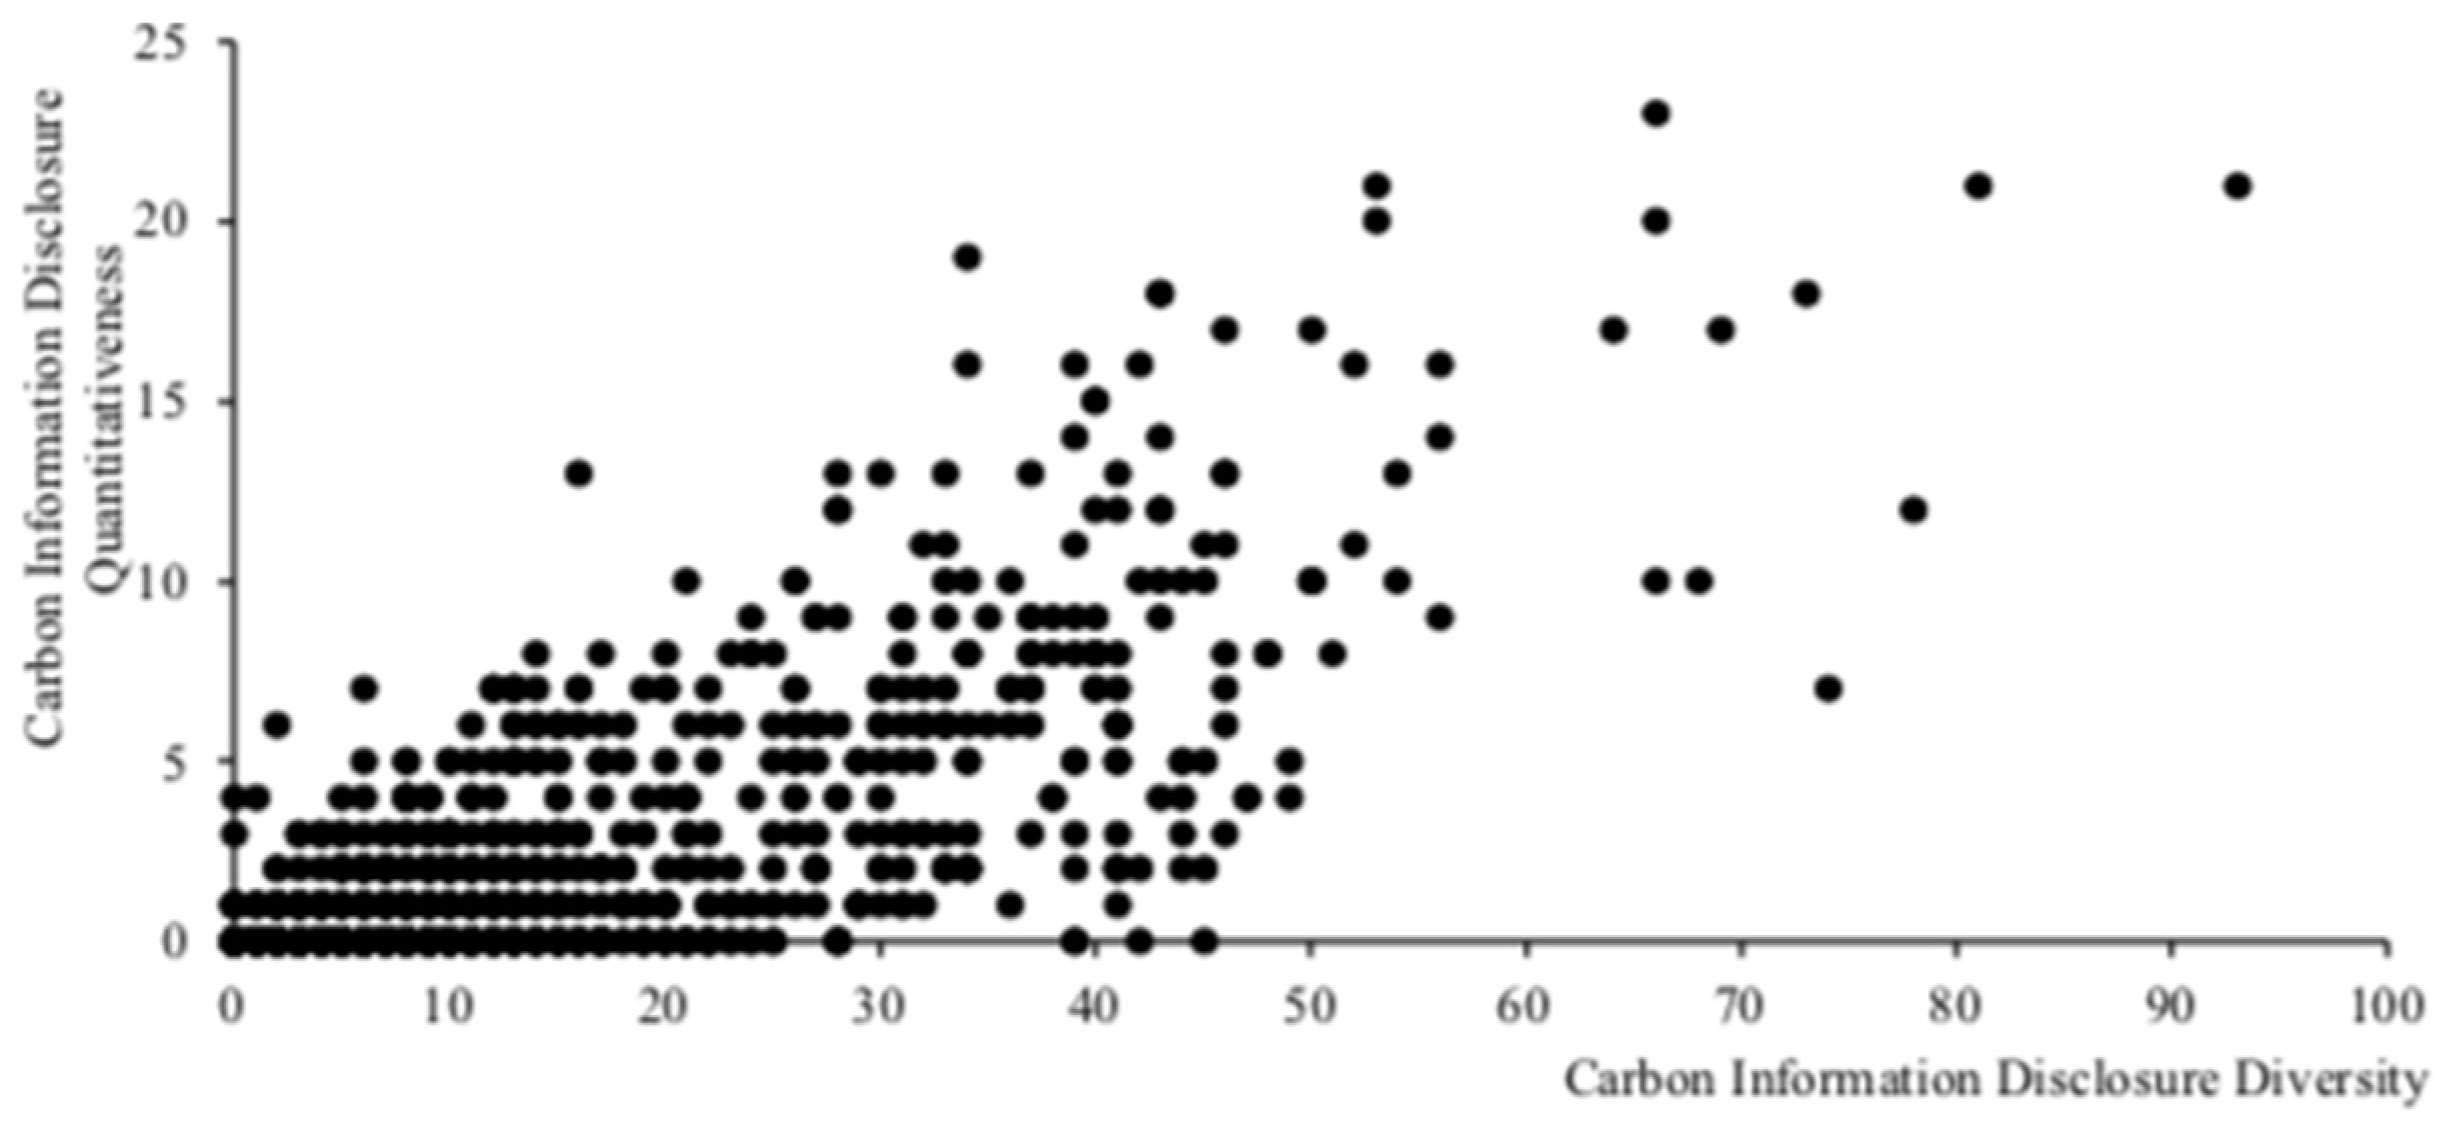
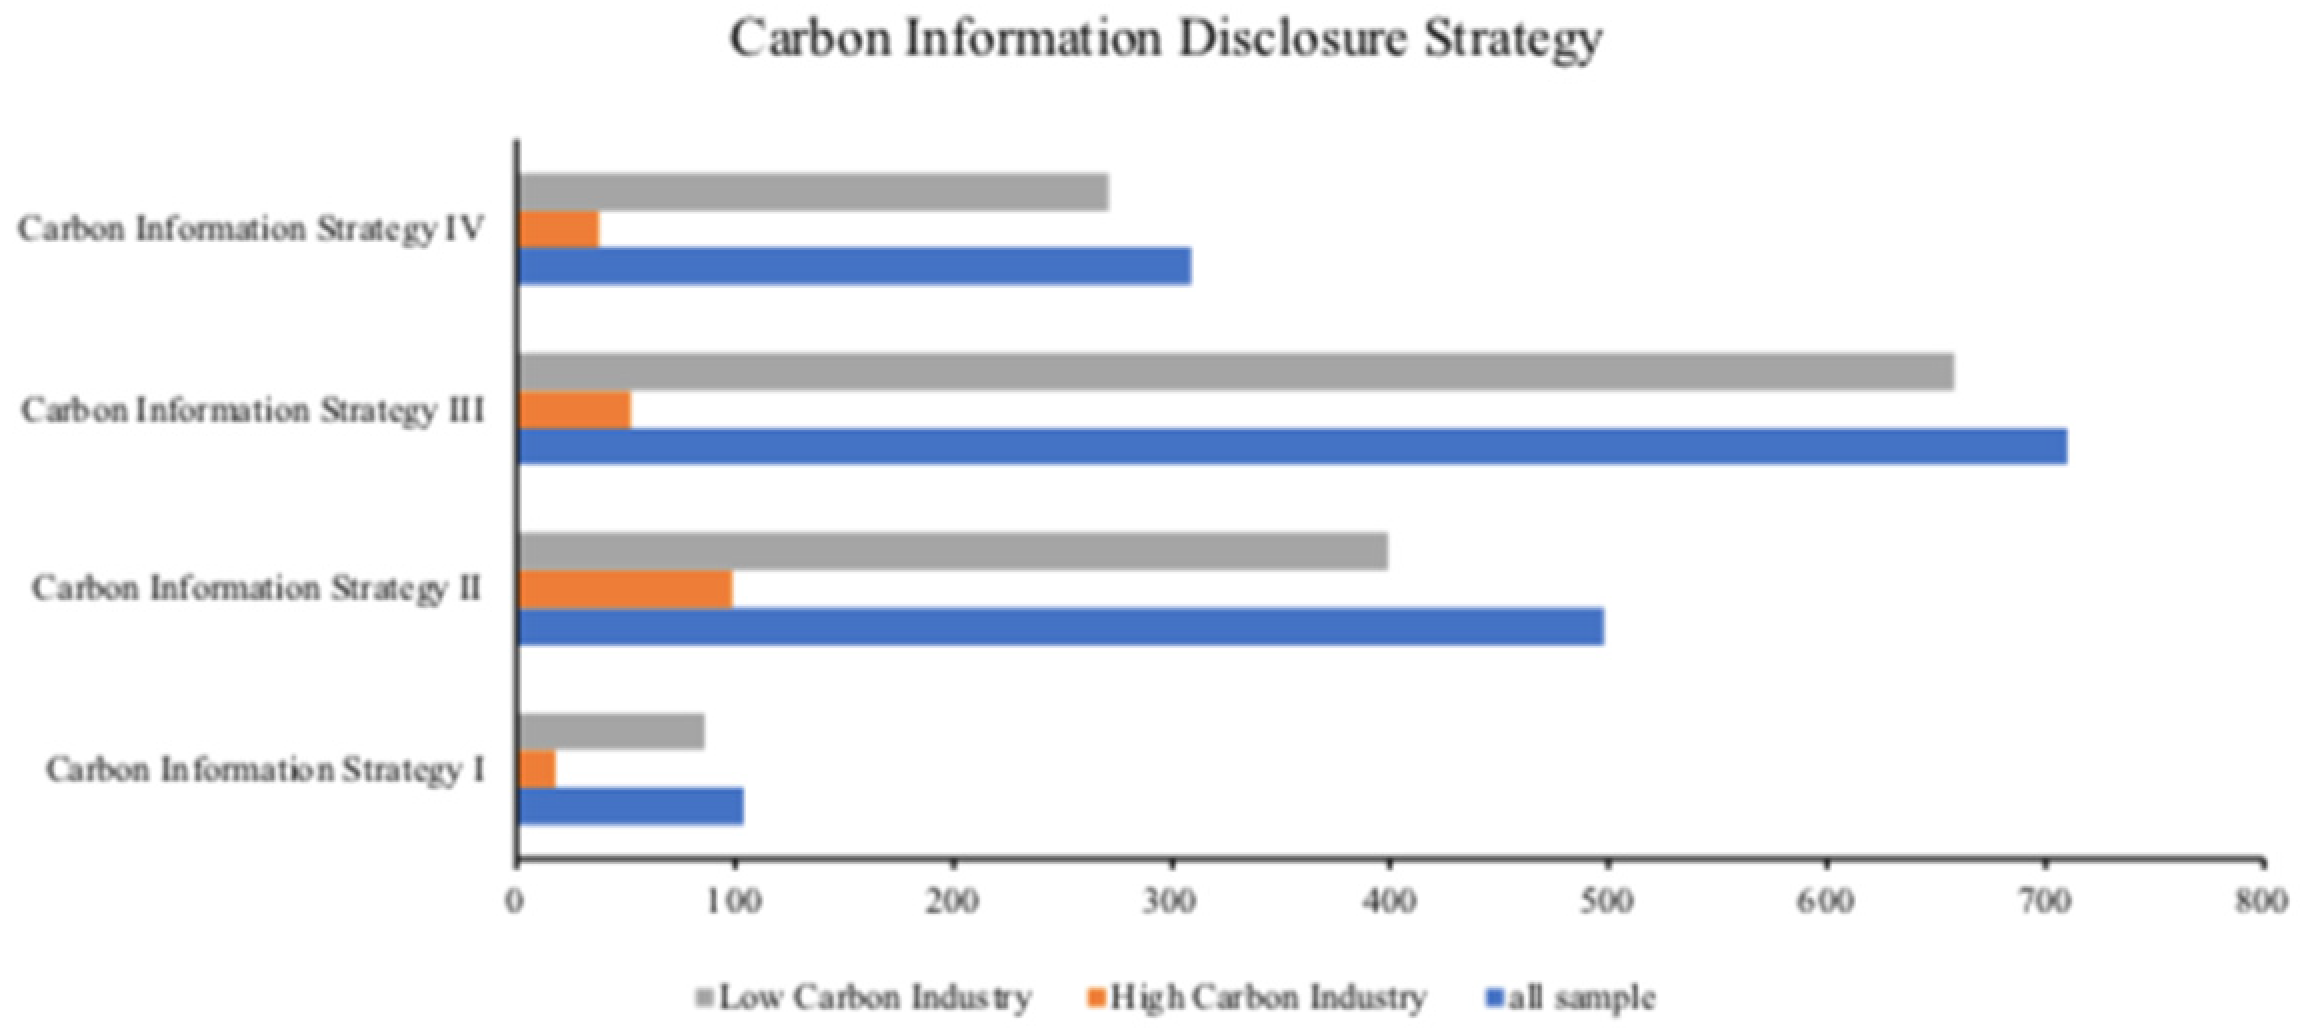
3.1.1. Carbon Information Disclosure Strategy
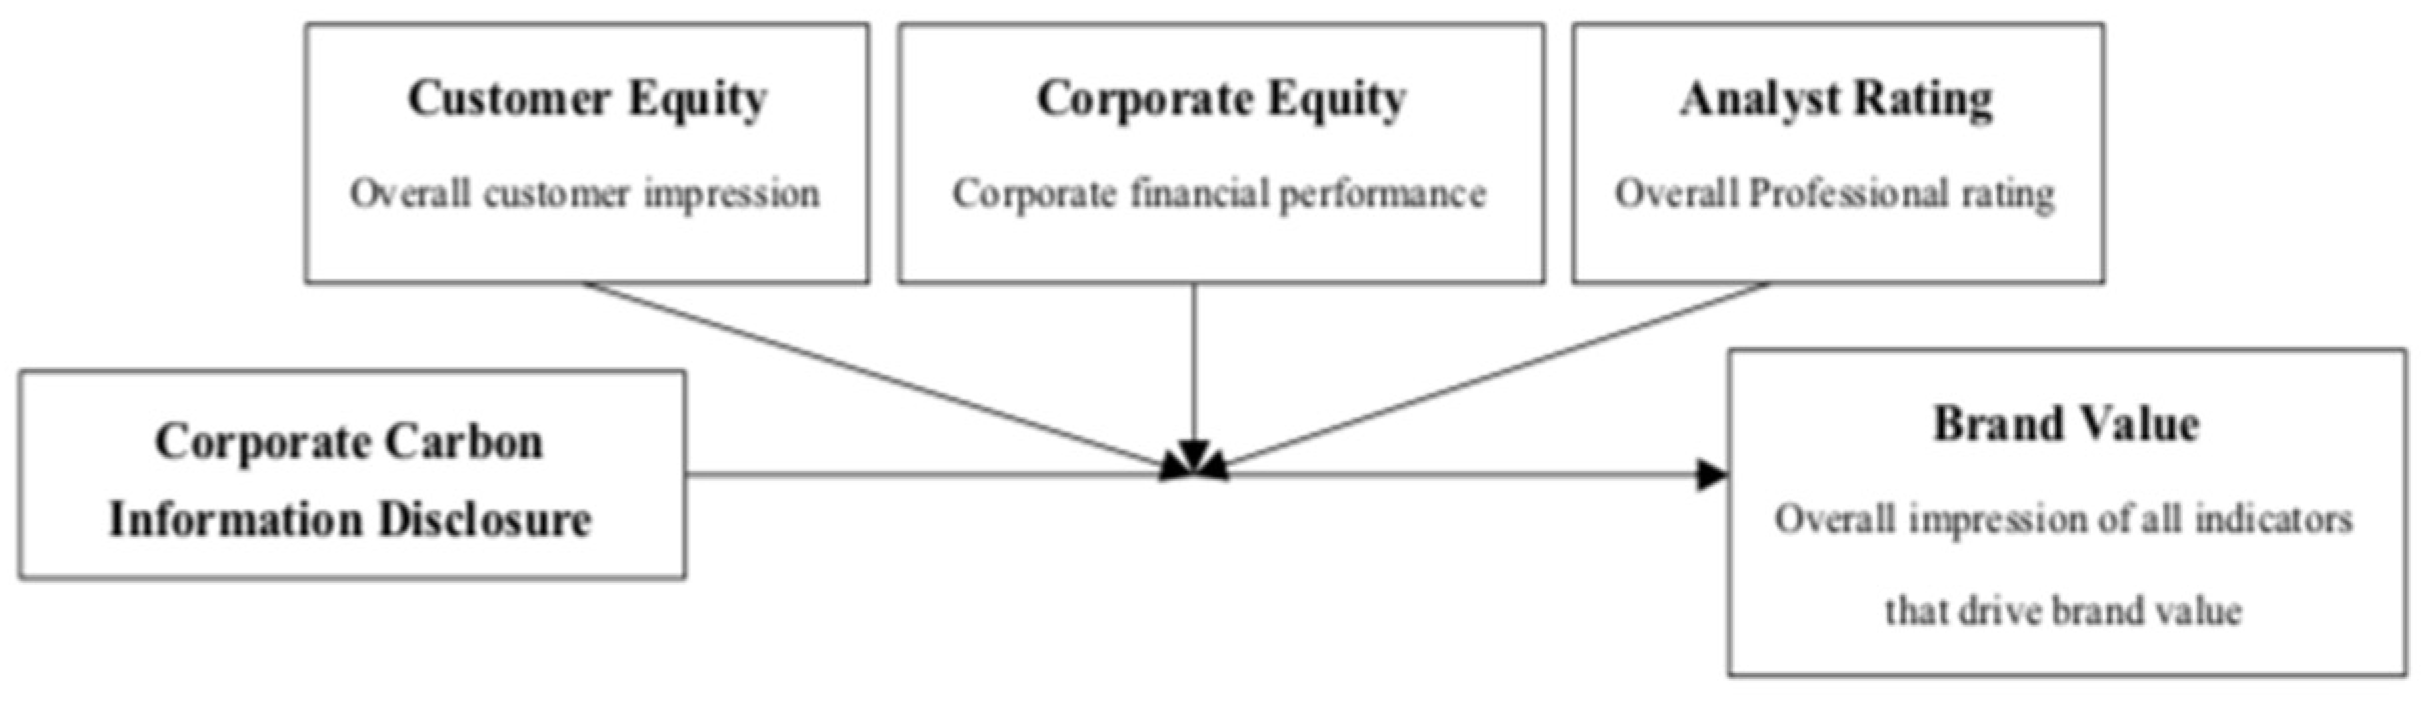
3.1.2. Corporate Brand Value
3.1.3. Other Variables
3.2. Model
4. Results
4.1. Summary Statistics
4.2. The Impact of Carbon Information Disclosure on Corporate Brand Value
4.3. The Impact Mechanism of Carbon Information Disclosure on Corporate Reputation
4.3.1. Carbon Information Disclosure and Analyst Rating
4.3.2. Carbon Information Disclosure and Investor Sentiment
4.3.3. Carbon Information Disclosure and Corporate Performance
5. Robustness
6. Conclusions
7. Discussion
Author Contributions
Funding
Institutional Review Board Statement
Informed Consent Statement
Data Availability Statement
Conflicts of Interest
References
- Ameli, N.; Kothari, S.; Grubb, M. Misplaced expectations from climate disclosure initiatives. Nat. Clim. Chang. 2021, 11, 917–924. [Google Scholar] [CrossRef]
- Matsumura, E.M.; Prakash, R.; Vera-Muñoz, S.C. Firm-Value Effects of Carbon Emissions and Carbon Disclosures. Account. Rev. 2014, 89, 695–724. [Google Scholar] [CrossRef]
- Bahadir, S.C.; Bharadwaj, S.G.; Srivastava, R.K. Financial Value of Brands in Mergers and Acquisitions: Is Value in the Eye of the Beholder? J. Mark. 2008, 72, 49–64. [Google Scholar] [CrossRef]
- Mujica, A.; Villanueva, E.; Lodeiros-Zubiria, M. Micro-learning Platforms Brand Awareness Using Social media Marketing and Customer Brand Engagement. Int. J. Emerg. Technol. Learn. 2021, 16, 19–41. [Google Scholar] [CrossRef]
- Jacob, I.; Khanna, M.; Rai, K.A. Attribution analysis of luxury brands: An investigation into consumer-brand congruence through conspicuous consumption. J. Bus. Res. 2020, 116, 597–607. [Google Scholar] [CrossRef]
- Keller, K.L. Conceptualizing, Measuring, and Managing Customer-Based Brand Equity. J. Mark. 1993, 57, 1–22. [Google Scholar] [CrossRef]
- Saini, N.; Antil, A.; Gunasekaran, A.; Malik, K.; Balakumar, S. Environment-social-governance disclosures nexus between financial performance: A sustainable value chain approach. Resour. Conserv. Recycl. 2022, 186, 106571. [Google Scholar] [CrossRef]
- Aksoy, L.; Buoye, A.J.; Fors, M.; Keiningham, T.L.; Rosengren, S. Environmental, Social and Governance (ESG) metrics do not serve services customers: A missing link between sustainability metrics and customer perceptions of social innovation. J. Serv. Manag. 2022, 33, 565–577. [Google Scholar] [CrossRef]
- Du, S.; Bhattacharya, C.; Sen, S. Reaping Relational Rewards from Corporate Social Responsibility: The Role of Competitive Positioning. Int. J. Res. Mark. 2007, 24, 224–241. [Google Scholar] [CrossRef]
- Raimo, N.; Caragnano, A.; Zito, M.; Vitolla, F.; Mariani, M. Extending the benefits of ESG disclosure: The effect on the cost of debt financing. Corp. Soc. Responsib. Environ. Manag. 2021, 28, 1412–1421. [Google Scholar] [CrossRef]
- Swaminathan, V.; Sorescu, A.; Steenkamp, J.-B.E.M.; O’Guinn, T.C.G.; Schmitt, B. Branding in a Hyperconnected World: Refocusing Theories and Rethinking Boundaries. J. Mark. 2020, 84, 24–46. [Google Scholar] [CrossRef]
- Heinberg, M.; Ozkaya, H.E.; Taube, M. Do Corporate Image and Reputation Drive Brand Equity in India and China?-Similarities and Differences. J. Bus. Res. 2018, 86, 259–268. [Google Scholar] [CrossRef]
- He, J.; Calder, B.J. The experimental evaluation of brand strength and brand value. J. Bus. Res. 2020, 115, 194–202. [Google Scholar] [CrossRef]
- Cao, Z.; Sorescu, A. Wedded Bliss or Tainted Love? Stock Market Reactions to the Introduction of Cobranded Products. Mark. Sci. 2013, 32, 939–959. [Google Scholar] [CrossRef]
- Dutordoir, M.; Verbeeten, F.H.M.; De Beijer, D. Stock Price Reactions to Brand Value Announcements: Magnitude and Moderators. Int. J. Res. Mark. 2015, 32, 34–47. [Google Scholar] [CrossRef]
- Agus Harjoto, M.; Salas, J. Strategic and Institutional Sustainability: Corporate Social Responsibility, Brand Value, and Interbrand Listing. J. Prod. Brand Manag. 2017, 26, 545–558. [Google Scholar] [CrossRef]
- Hsu, L.; Fournier, S.; Srinivasan, S. Brand Architecture Strategy and Firm Value: How Leveraging, Separating, and Distancing the Corporate Brand Affects Risk and Returns. J. Acad. Mark. Sci. 2015, 44, 261–280. [Google Scholar] [CrossRef]
- Muniz, A.M.; O’Guinn, T.C. Brand Community. J. Consum. Res. 2001, 27, 412–432. [Google Scholar] [CrossRef]
- Epp, A.M.; Schau, H.J.; Price, L.L. The Role of Brands and Mediating Technologies in Assembling Long-Distance Family Practices. J. Mark. 2014, 78, 81–101. [Google Scholar] [CrossRef]
- Qing, T.; Haiying, D. How to achieve consumer continuance intention toward branded apps—From the consumer–brand engagement perspective. J. Retail. Consum. Serv. 2021, 60, 102486. [Google Scholar] [CrossRef]
- Keller, K.L.; Lehmann, D.R. Brands and Branding: Research Findings and Future Priorities. Mark. Sci. 2006, 25, 740–759. [Google Scholar] [CrossRef]
- Schmitt, B. The Consumer Psychology of Brands. J. Consum. Psychol. 2011, 22, 7–17. [Google Scholar] [CrossRef]
- Zhou, G.; Huang, J.; Yu, S.X. Buy domestic or foreign brands? The moderating roles of decision focus and product quality. Asia Pac. J. Mark. Logist. 2022, 34, 843–861. [Google Scholar]
- Aaker, D.A. The value of brand equity. J. Bus. Strategy 1992, 13, 27–32. [Google Scholar] [CrossRef]
- Guzman, F. A brand building literature review. ICFAI J. Brand. Manag. 2005, 2, 30–48. [Google Scholar]
- Lee, M.T.; Raschke, R.L.; Krishen, A.S. Signaling Green! Firm Esg Signals in an Interconnected Environment That Promote Brand Valuation. J. Bus. Res. 2022, 138, 1–11. [Google Scholar] [CrossRef]
- González-Mansilla, Ó.; Berenguer-Contrí, G.; Serra-Cantallops, A. The impact of value co-creation on hotel brand equity and customer satisfaction. Tour. Manag. 2019, 75, 51–65. [Google Scholar] [CrossRef]
- France, C.; Grace, D.; Iacono, J.L.; Carlini, J. Exploring the interplay between customer perceived brand value and customer brand co-creation behaviour dimensions. J. Brand Manag. 2020, 27, 466–480. [Google Scholar] [CrossRef]
- Arvidsson, S.; Dumay, J. Corporate ESG reporting quantity, quality and performance: Where to now for environmental policy and practice? Bus. Strategy Environ. 2022, 31, 1091–1110. [Google Scholar] [CrossRef]
- Landrum, S. Millennials driving brands to practice socially responsible marketing. Forbes 2017, 15, 58–75. [Google Scholar]
- Naidoo, C.; Abratt, R. Brands That Do Good: Insight into Social Brand Equity. J. Brand Manag. 2017, 25, 3–13. [Google Scholar] [CrossRef]
- Cowan, K.; Guzman, F. How Csr Reputation, Sustainability Signals, and Country-of-Origin Sustainability Reputation Contribute to Corporate Brand Performance: An Exploratory Study. J. Bus. Res. 2020, 117, 683–693. [Google Scholar] [CrossRef]
- Heinberg, M.; Katsikeas, C.S.; Ozkaya, H.E.; Taube, M. How nostalgic brand positioning shapes brand equity: Differences between emerging and developed markets. J. Acad. Mark. Sci. 2020, 48, 869–890. [Google Scholar] [CrossRef]
- Sierra, V.; Iglesias, O.; Markovic, S.; Singh, J.J. Does Ethical Image Build Equity in Corporate Services Brands? The Influence of Customer Perceived Ethicality on Affect, Perceived Quality, and Equity. J. Bus. Ethics 2015, 144, 661–676. [Google Scholar] [CrossRef]
- Yang, Y.G.; Tsang, A.; Li, O.Z.; Dhaliwal, D.S. Voluntary Nonfinancial Disclosure and the Cost of Equity Capital: The Initiation of Corporate Social Responsibility Reporting. Account. Rev. 2011, 86, 59–100. [Google Scholar]
- Melo, T.; Galan, J.I. Effects of Corporate Social Responsibility on Brand Value. J. Brand Manag. 2011, 18, 423–437. [Google Scholar] [CrossRef]
- Connelly, B.L.; Certo, S.T.; Ireland, R.D.; Reutzel, C.R. Signaling Theory: A Review and Assessment. J. Manag. 2010, 37, 39–67. [Google Scholar] [CrossRef]
- Milgrom, P.R. Good News and Bad News: Representation Theorems and Applications. Bell J. Econ. 1981, 12, 380. [Google Scholar] [CrossRef]
- Burton, J.L.; Mosteller, J.R.; Hale, K.E. Using Linguistics to Inform Influencer Marketing in Services. J. Serv. Mark. 2020, 35, 222–236. [Google Scholar] [CrossRef]
- Baalbaki, S.; Guzmán, F. A Consumer-Perceived Consumer-Based Brand Equity Scale. J. Brand Manag. 2016, 23, 229–251. [Google Scholar] [CrossRef]
- Guzmán, F.; Davis, D. The Impact of Corporate Social Responsibility on Brand Equity: Consumer Responses to Two Types of Fit. J. Prod. Brand Manag. 2017, 26, 435–446. [Google Scholar] [CrossRef]
- Eccles, R.G.; Serafeim, G.; Krzus, M.P. Market Interest in Nonfinancial Information. J. Appl. Corp. Financ. 2011, 23, 113–127. [Google Scholar] [CrossRef]
- Erdem, S. Brand Equity as a Signaling Phenomenon. J. Consum. Psychol. 1998, 72, 131–157. [Google Scholar] [CrossRef]
- Roberts, P.W.; Dowling, G.R. Corporate Reputation and Sustained Superior Financial Performance. Strateg. Manag. J. 2002, 23, 1077–1093. [Google Scholar] [CrossRef]
- Wang, D.H.-M.; Chen, P.-H.; Yu, T.H.-K.; Hsiao, C.-Y. The Effects of Corporate Social Responsibility on Brand Equity and Firm Performance. J. Bus. Res. 2015, 68, 2232–2236. [Google Scholar] [CrossRef]
- Jiang, Y.; Luo, L.; Xu, J.; Shao, X. The value relevance of corporate voluntary carbon disclosure: Evidence from the United States and BRIC countries. J. Contemp. Account. Econ. 2021, 17, 100279. [Google Scholar] [CrossRef]
- Alsaifi, K.; Elnahass, M.; Al-Awadhi, A.M.; Salama, A. Carbon disclosure and firm risk: Evidence from the UK corporate responses to climate change. Euras. Bus. Rev. 2022, 12, 505–526. [Google Scholar] [CrossRef]
- Lang, M.; Lundholm, R. The relation between security returns, firm earnings, and industry earnings. Contem. Account. Res. 1996, 13, 607–629. [Google Scholar] [CrossRef]
- Bushee, B.; Noe, C.; Berger, P.G. Corporate disclosure practices, institutional investors, and stock return volatility. J. Account. Res. 2000, 38, 171–202. [Google Scholar] [CrossRef]
- Larcker, D.F.; Rusticus, T.O. Endogeneity and Empirical Accounting Research. Eur. Account. Rev. 2007, 16, 207–215. [Google Scholar] [CrossRef]
- Simnett, R.; Green, W.; Huggins, A. The Competitive Market for Assurance Engagements on Greenhouse Gas Statements: Is There a Role for Assurers from the Accounting Profession? Curr. Issues Audit. 2011, 5, A1–A12. [Google Scholar]
- Pop, R.-A.; Dabija, D.-C.; Pelău, C.; Dinu, V. Usage Intentions, Attitudes, and Behaviors towards Energy-Efficient Applications during the COVID-19 Pandemic. J. Bus. Econ. Manag. 2022, 23, 668–689. [Google Scholar] [CrossRef]
- Lăzăroiu, G.; Valaskova, K.; Nica, E.; Durana, P.; Kral, P.; Bartoš, P.; Maroušková, A. Techno-Economic Assessment: Food Emulsion Waste Management. Energies 2020, 13, 4922. [Google Scholar] [CrossRef]


| Carbon Information Disclosure | |
|---|---|
| Beijing Gehua Cable Television Network Carbon accounting: According to the work arrangement of the Municipal Development and Reform Commission, the company actively completed the 2017 annual carbon emission data statistics and reporting, and the data verification and submission of the carbon emission gap credit purchase and verification report. Low-carbon culture: All company departments publicized the theme of “energy conservation, thrift, and morality” environmental protection activities through the office and business hall in the form of posters. | China Southern Airlines Carbon reduction qualitative targets: China Southern Airlines is deeply aware that improving efficiency and reducing carbon emissions is essential to achieve sustainable development and enhance its competitiveness. Bear the burden of energy conservation and emission reduction to deal with climate change caused by emissions. Carbon accounting: China Southern Airlines’ carbon dioxide emission in 2017 was 2527.94 w tons. Low-carbon measures: China Southern Airlines attaches great importance to energy management and reduces greenhouse gas emissions during operation by strengthening the control of jet fuel energy consumption and increasing the proportion of clean energy use. China Southern Airlines has begun independent research and development advantages to develop data storage tools that could replace paper boxes to reduce aircraft weight, fuel consumption, and carbon dioxide emissions, and reduce environmental impact. China Southern Airlines has participated in the EU carbon trading of emissions from flights between two points within the EU, according to the relevant regulations of the European Commission and Civil Aviation Administration, and has actively cooperated with the formulation of applicable technical rules of carbon trading in the civil aviation industry of Guangdong Province, achieving an annual reduction in performance costs. |
| Name | Obs. | Mean | S.E. | Min | Max |
|---|---|---|---|---|---|
| BV | 1515 | 1270.625 | 9049.876 | 2.980 | 253.628 |
| CS | 1515 | 12.403 | 15.452 | 0 | 114 |
| CDS1 | 1515 | 0.058 | 0.235 | 0 | 1 |
| CDS2 | 1515 | 0.307 | 0.461 | 0 | 1 |
| CDS3 | 1515 | 0.450 | 0.497 | 0 | 1 |
| CDS4 | 1515 | 0.183 | 0.387 | 0 | 1 |
| INCOME | 1515 | 4.02 × 10¹⁰ | 1.36 × 10¹¹ | −2.28 × 10⁸ | 1.64 × 10¹² |
| COST | 1515 | 3.38 × 10¹⁰ | 1.26 × 10¹¹ | −6.90 × 10⁸ | 1.58 × 10¹² |
| INVESTSENTIMENT | 1515 | 10.077 | 24.508 | 0.000 | 297.3945 |
| ANALYST | 1515 | 4.321 | 0.482 | 1 | 5 |
| NEWS | 1515 | 628.981 | 373.224 | 1 | 1321 |
| SEARCH | 1515 | 13.641 | 1.109 | 10.807 | 17.919 |
| LEV | 1515 | 0.531 | 0.216 | 0.071 | 0.951 |
| ROE | 1515 | 0.058 | 0.059 | −0.492 | 0.345 |
| LNRD | 1515 | 4.993261 | 8.814363 | 0 | 24.920 |
| GROW | 1515 | 758 | 437.487 | 1 | 1515 |
| IFHIGH | 1515 | 0.122 | 0.327 | 0 | 1 |
| INTRADE | 1515 | 0.481 | 0.499 | 0 | 1 |
| SOE | 1515 | 0.570 | 0.495 | 0 | 1 |
| Variables | (1) | (2) | (3) | (4) | (5) | (6) | (7) | (8) | (9) | (10) | (11) | (12) | (13) | (14) | (15) | (16) | (17) | (18) | (19) |
|---|---|---|---|---|---|---|---|---|---|---|---|---|---|---|---|---|---|---|---|
| (1) BV | 1.000 | ||||||||||||||||||
| (2) CS | 0.362 *** | 1.000 | |||||||||||||||||
| (3) CDS1 | 0.030 | −0.115 *** | 1.000 | ||||||||||||||||
| (4) CDS2 | 0.302 *** | 0.720 *** | −0.167 *** | 1.000 | |||||||||||||||
| (5) CDS3 | −0.342 *** | −0.600 *** | −0.226 *** | −0.603 *** | 1.000 | ||||||||||||||
| (6) CDS4 | 0.061 ** | −0.018 | −0.118 *** | −0.316 *** | −0.429 *** | 1.000 | |||||||||||||
| (7) INCOME | 0.368 *** | 0.326 *** | −0.015 | 0.276 *** | −0.294 *** | 0.058 ** | 1.000 | ||||||||||||
| (8) COST | 0.400 *** | 0.345 *** | −0.014 | 0.303 *** | −0.311 *** | 0.047 * | 0.976 *** | 1.000 | |||||||||||
| (9) INVESTSENTIMENT | 0.074 *** | −0.046 * | 0.018 | −0.034 | −0.013 | 0.047 * | −0.146 *** | −0.150 *** | 1.000 | ||||||||||
| (10) ANALYST | 0.126 *** | 0.064 ** | 0.054 ** | 0.087 *** | −0.079 *** | −0.035 | 0.065 ** | 0.094 *** | 0.030 | 1.000 | |||||||||
| (11) NEWS | 0.131 *** | 0.040 | 0.012 | 0.039 | −0.072 *** | 0.038 | 0.057 ** | 0.077 *** | 0.098 *** | 0.057 ** | 1.000 | ||||||||
| (12) SEARCH | 0.401 *** | 0.264 *** | −0.059 ** | 0.156 *** | −0.199 *** | 0.106 *** | 0.515 *** | 0.519 *** | −0.025 | 0.042 * | 0.117 *** | 1.000 | |||||||
| (13) LEV | 0.309 *** | 0.315 *** | −0.078 *** | 0.213 *** | −0.205 *** | 0.057 ** | 0.469 *** | 0.482 *** | −0.028 | −0.035 | −0.095 *** | 0.452 *** | 1.000 | ||||||
| (14) ROE | −0.182 *** | −0.171 *** | 0.041 | −0.110 *** | 0.099 *** | −0.021 | −0.167 *** | −0.172 *** | −0.064 ** | 0.290 *** | 0.062 ** | −0.185 *** | −0.572 *** | 1.000 | |||||
| (15) LNRD | 0.186 *** | 0.174 *** | 0.195 *** | 0.236 *** | −0.249 *** | −0.079 *** | 0.028 | 0.042 * | 0.019 | 0.204 *** | 0.057 ** | −0.164 *** | −0.097 *** | 0.049 * | 1.000 | ||||
| (16) GROW | −0.124 *** | −0.028 | −0.026 | −0.041 * | 0.062 ** | −0.014 | 0.027 | 0.022 | −0.025 | 0.173 *** | −0.127 *** | −0.050 * | 0.080 *** | 0.216 *** | −0.115 *** | 1.000 | |||
| (17) IFHIGH | 0.010 | 0.113 *** | 0.018 | 0.140 *** | −0.135 *** | −0.005 | 0.165 *** | 0.180 *** | −0.034 | −0.031 | 0.028 | −0.040 | −0.013 | −0.123 *** | 0.058 ** | −0.069 *** | 1.000 | ||
| (18) INTRADE | 0.206 *** | 0.142 *** | −0.055 ** | 0.057 ** | −0.054 ** | 0.035 | 0.188 *** | 0.193 *** | −0.077 *** | 0.014 | −0.088 *** | 0.249 *** | 0.259 *** | −0.204 *** | −0.057 ** | 0.025 | 0.052 ** | 1.000 | |
| (19) SOE | 0.204 *** | 0.193 *** | 0.069 *** | 0.188 *** | −0.155 *** | −0.067 *** | 0.232 *** | 0.254 *** | −0.031 | −0.109 *** | 0.091 *** | 0.186 *** | 0.190 *** | −0.200 *** | −0.085 *** | −0.091 *** | 0.128 *** | 0.099 *** | 1.000 |
| Variables | Main | Carbon Disclosure Strategy I | Carbon Disclosure Strategy II | Carbon Disclosure Strategy III | Carbon Disclosure Strategy IV |
|---|---|---|---|---|---|
| CS | 0.088 *** | ||||
| (4.055) | |||||
| Carbon disclosure strategy I | 0.004 (0.212) | ||||
| Carbon disclosure strategy II | 0.066 *** (3.035) | ||||
| Carbon disclosure strategy III | −0.093 *** (−4.266) | ||||
| Carbon disclosure strategy IV | 0.028 (1.469) | ||||
| NEWS | 0.101 *** | 0.105 *** | 0.104 *** | 0.101 *** | 0.104 *** |
| (4.669) | (4.836) | (4.791) | (4.660) | (4.778) | |
| SEARCH | 0.208 *** | 0.212 *** | 0.210 *** | 0.204 *** | 0.210 *** |
| (6.755) | (6.827) | (6.811) | (6.606) | (6.769) | |
| LEV | 0.070 * | 0.084 ** | 0.076 * | 0.073 * | 0.083 ** |
| (1.709) | (2.027) | (1.860) | (1.785) | (2.022) | |
| ROE | −0.071 ** | −0.071 ** | −0.072 ** | −0.069 ** | −0.071 ** |
| (−2.350) | (−2.359) | (−2.387) | (−2.292) | (−2.347) | |
| LNRD | 0.204 *** | 0.222 *** | 0.205 *** | 0.199 *** | 0.226 *** |
| (10.843) | (11.857) | (10.626) | (10.443) | (12.218) | |
| GROWTH | −0.058 *** | −0.059 *** | −0.059 *** | −0.058 *** | −0.058 *** |
| (−3.067) | (−3.087) | (−3.109) | (−3.057) | (−3.036) | |
| SOE | 0.266 *** | 0.291 *** | 0.268 *** | 0.273 *** | 0.300 *** |
| (2.927) | (3.136) | (2.936) | (3.007) | (3.237) | |
| IFHIGH | 0.011 | 0.036 | 0.007 | −0.006 | 0.033 |
| (0.089) | (0.290) | (0.057) | (−0.049) | (0.270) | |
| N | 1515 | 1515 | 1515 | 1515 | 1515 |
| Adjusted R2 | 0.159 | 0.159 | 0.157 | 0.160 | 0.156 |
| Variables | High-Carbon Industry | Low-Carbon Industry | ||||||||
|---|---|---|---|---|---|---|---|---|---|---|
| Main | CDS1 | CDS2 | CDS3 | CDS4 | Main | CDS1 | CDS2 | CDS3 | CDS4 | |
| CS | 0.115 ** | 0.085 *** | ||||||||
| (1.999) | (3.612) | |||||||||
| CDS1 | −0.053 | 0.010 | ||||||||
| (−0.984) | (0.517) | |||||||||
| CDS2 | 0.092 | 0.066 *** | ||||||||
| (1.484) | (2.839) | |||||||||
| CDS3 | −0.113 (−1.378) | −0.092 *** (−4.042) | ||||||||
| CDS4 | 0.021 (0.328) | 0.028 (1.356) | ||||||||
| NEWS | 0.209 *** | 0.211 *** | 0.223 *** | 0.212 *** | 0.210 *** | 0.090 *** | 0.093 *** | 0.091 *** | 0.089 *** | 0.093 *** |
| (3.210) | (3.240) | (3.384) | (3.257) | (3.166) | (3.877) | (4.017) | (3.925) | (3.843) | (3.996) | |
| SEARCH | −0.029 | −0.010 | −0.004 | −0.008 | −0.007 | 0.227 *** | 0.229 *** | 0.227 *** | 0.221 *** | 0.227 *** |
| (−0.256) | (−0.091) | (−0.034) | (−0.074) | (−0.061) | (7.098) | (7.126) | (7.086) | (6.913) | (7.088) | |
| LEV | −0.098 | −0.094 | −0.110 | −0.093 | −0.087 | 0.094 ** | 0.109 ** | 0.102 ** | 0.097 ** | 0.108 ** |
| (−0.727) | (−0.683) | (−0.805) | (−0.679) | (−0.618) | (2.199) | (2.538) | (2.378) | (2.283) | (2.517) | |
| ROE | −0.071 | −0.081 | −0.084 | −0.054 | −0.071 | −0.071 ** | −0.070 ** | −0.071 ** | −0.070 ** | −0.071 ** |
| (−0.748) | (−0.849) | (−0.882) | (−0.552) | (−0.733) | (−2.255) | (−2.218) | (−2.249) | (−2.238) | (−2.246) | |
| LNRD | 0.105 ** | 0.131 ** | 0.103 * | 0.111 ** | 0.134 ** | 0.219 *** | 0.234 *** | 0.220 *** | 0.213 *** | 0.240 *** |
| (1.961) | (2.524) | (1.841) | (2.070) | (2.553) | (10.871) | (11.616) | (10.687) | (10.408) | (12.118) | |
| GROWTH | −0.003 | 0.002 | 0.004 | 0.007 | 0.002 | −0.067 *** | −0.068 *** | −0.068 *** | −0.068 *** | −0.067 *** |
| (−0.046) | (0.039) | (0.072) | (0.111) | (0.026) | (−3.351) | (−3.387) | (−3.423) | (−3.386) | (−3.335) | |
| SOE | 0.607 ** | 0.665 ** | 0.594 ** | 0.664 ** | 0.701 ** | 0.205** | 0.221 ** | 0.206 ** | 0.208 ** | 0.232 ** |
| (2.305) | (2.406) | (2.226) | (2.449) | (2.507) | (2.155) | (2.288) | (2.157) | (2.194) | (2.408) | |
| N | 185 | 185 | 185 | 185 | 185 | 1330 | 1330 | 1330 | 1330 | 1330 |
| Adjusted R2 | 0.129 | 0.120 | 0.118 | 0.123 | 0.118 | 0.170 | 0.167 | 0.169 | 0.173 | 0.167 |
| Variables | Main | High-Carbon Industry | Low-Carbon Industry |
|---|---|---|---|
| CS | −0.299 ** | 0.003 | −0.344 ** |
| (−2.090) | (0.008) | (−2.250) | |
| CS*ANALYST | 0.101 *** (3.182) | 0.045 (0.494) | 0.110 *** (3.257) |
| NEWS | 0.000 *** | 0.001 *** | 0.000 *** |
| (3.655) | (3.131) | (2.852) | |
| SEARCH | 0.262 *** | −0.042 | 0.283 *** |
| (6.360) | (−0.272) | (6.654) | |
| LEV | 0.434 | −0.776 | 0.597 ** |
| (1.582) | (−0.837) | (2.089) | |
| ROE | −2.227 *** | −2.009 | −2.297 *** |
| (−2.714) | (−0.783) | (−2.662) | |
| LNRD | 0.028 *** | 0.015 | 0.030 *** |
| (8.909) | (1.624) | (8.978) | |
| GROWTH | −0.000 *** | −0.000 | −0.000 *** |
| (−2.994) | (−0.026) | (−3.301) | |
| SOE | 0.373 *** | 0.811 ** | 0.291 ** |
| (3.037) | (2.172) | (2.267) | |
| N | 1349 | 172 | 1177 |
| Adjusted R2 | 0.153 | 0.132 | 0.166 |
| Variables | Main | High-Carbon Industry | Low-Carbon Industry |
|---|---|---|---|
| CS | 0.113 *** | 0.179 * | 0.111 *** |
| (3.641) | (1.698) | (3.407) | |
| CS*INVESTMENT | 0.003 *** (5.640) | 0.003 (1.562) | 0.003 *** (5.391) |
| NEWS | 0.000 *** | 0.001 *** | 0.000 *** |
| (3.532) | (2.989) | (2.764) | |
| SEARCH | 0.252 *** | −0.052 | 0.276 *** |
| (6.144) | (−0.342) | (6.524) | |
| LEV | 0.502 * | −0.782 | 0.681 ** |
| (1.838) | (−0.856) | (2.404) | |
| ROE | −1.660 ** | −1.803 | −1.658 ** |
| (−2.081) | (−0.710) | (−1.980) | |
| LNRD | 0.029 *** | 0.017 * | 0.031 *** |
| (9.606) | (1.888) | (9.560) | |
| GROWTH | −0.000 *** | 0.000 | −0.000 *** |
| (−2.736) | (0.101) | (−3.089) | |
| SOE | 0.381 *** | 0.794 ** | 0.301 ** |
| (3.100) | (2.184) | (2.371) | |
| N | 1349 | 172 | 1177 |
| Adjusted R2 | 0.181 | 0.160 | 0.171 |
| Variables | Main | High-Carbon Industry | Low-Carbon Industry |
|---|---|---|---|
| CS | 0.042 | 1.105 | −0.052 |
| (0.213) | (1.555) | (−0.253) | |
| CS*COST | 0.005 (0.534) | −0.040 (−1.293) | 0.009 (0.968) |
| NEWS | 0.000 *** | 0.001 *** | 0.000 *** |
| (3.749) | (3.239) | (2.934) | |
| SEARCH | 0.264 *** | −0.007 | 0.284 *** |
| (6.286) | (−0.045) | (6.553) | |
| LEV | 0.447 | −0.590 | 0.591 ** |
| (1.604) | (−0.632) | (2.037) | |
| ROE | −1.753 ** | −1.686 | −1.775 ** |
| (−2.155) | (−0.664) | (−2.076) | |
| LNRD | 0.030 *** | 0.018 ** | 0.032 *** |
| (9.468) | (1.981) | (9.457) | |
| GROWTH | −0.000 *** | 0.000 | −0.000 *** |
| (−2.618) | (0.216) | (−2.925) | |
| SOE | 0.356 *** | 0.957 ** | 0.277 ** |
| (2.899) | (2.447) | (2.179) | |
| N | 1338 | 172 | 1166 |
| Adjusted R2 | 0.158 | 0.132 | 0.169 |
| Variables | Main | High-Carbon Industry | Low-Carbon Industry |
|---|---|---|---|
| CS | −0.034 | 0.522 | −0.066 |
| (−0.200) | (0.735) | (−0.376) | |
| CS*INCOME | 0.008 (1.133) | −0.014 (−0.448) | 0.009 (1.266) |
| NEWS | 0.000 *** | 0.001 *** | 0.000 *** |
| (3.611) | (3.218) | (2.695) | |
| SEARCH | 0.265 *** | −0.008 | 0.285 *** |
| (6.433) | (−0.051) | (6.668) | |
| LEV | 0.430 | 0.064 | 0.455 |
| (1.559) | (0.069) | (1.570) | |
| ROE | −1.677 ** | −0.868 | −1.896 ** |
| (−2.098) | (−0.338) | (−2.257) | |
| LNRD | 0.030 *** | 0.018 ** | 0.033 *** |
| (9.875) | (1.981) | (9.913) | |
| GROWTH | −0.000 *** | −0.000 | −0.000 *** |
| (−2.592) | (−0.098) | (−2.733) | |
| SOE | 0.327 *** | 0.717 * | 0.274 ** |
| (2.713) | (1.942) | (2.128) | |
| N | 1334 | 171 | 1163 |
| Adjusted R2 | 0.149 | 0.134 | 0.163 |
| Variables | First Stage (Dependent Variable: Carbon Score) | Second Stage (Dependent Variable: Brand Value) | ||||
|---|---|---|---|---|---|---|
| Main | High-Carbon Industry | Low-Carbon Industry | Main | High-Carbon Industry | Low-Carbon Industry | |
| CS | 2.158 * | 9.539 | 2.294 * | |||
| (1.884) | (0.236) | (1.721) | ||||
| IFTRADE | 0.093 ** | 0.039 | 0.089 ** | |||
| (1.900) | (0.230) | (1.730) | ||||
| NEWS | 0.021 | 0.098 | 0.004 | 0.038 | −0.769 | 0.067 |
| (0.890) | (1.130) | (0.190) | (0.679) | (−0.184) | (1.162) | |
| SEARCH | 0.156 *** | 0.079 | 0.170 *** | −0.028 | −0.694 | −0.068 |
| (5.650) | (0.710) | (6.040) | (−0.141) | (−0.194) | (−0.277) | |
| LEV | 0.244 *** | 0.378 *** | 0.236 *** | −0.360 | −3.566 | −0.370 |
| (7.390) | (3.220) | (6.870) | (−1.227) | (−0.234) | (−1.116) | |
| ROE | 0.022 | −0.068 | 0.047 | −0.034 | 0.327 | −0.073 |
| (0.720) | (−0.570) | (1.500) | (−0.500) | (0.116) | (−0.803) | |
| LNRD | 0.234 *** | 0.276 *** | 0.220 *** | −0.252 | −2.468 | −0.238 |
| (9.840) | (3.940) | (8.720) | (−0.919) | (−0.219) | (−0.795) | |
| GROWTH | −0.003 | −0.019 | 0.005 | −0.068 | 0.165 | −0.091 |
| (−0.150) | (−0.240) | (0.220) | (−1.244) | (0.158) | (−1.488) | |
| SOE | 0.272 *** | 0.515 *** | 0.225 *** | −0.358 | −4.872 | −0.273 |
| (5.590) | (2.670) | (4.460) | (−1.073) | (−0.226) | (−0.850) | |
| N | 1515 | 185 | 1330 | 1515 | 185 | 1330 |
| Adjusted R2 | 0.188 | 0.257 | 0.183 | 0.184 | 0.257 | 0.184 |
| Diagnostics for Instrumental Variable | ||||||
| Partial R2 | 0.183 | p = 0.000 | ||||
| Partial F-statistic | Fp = 37.13 | p = 0.000 | ||||
Disclaimer/Publisher’s Note: The statements, opinions and data contained in all publications are solely those of the individual author(s) and contributor(s) and not of MDPI and/or the editor(s). MDPI and/or the editor(s) disclaim responsibility for any injury to people or property resulting from any ideas, methods, instructions or products referred to in the content. |
© 2023 by the authors. Licensee MDPI, Basel, Switzerland. This article is an open access article distributed under the terms and conditions of the Creative Commons Attribution (CC BY) license (https://creativecommons.org/licenses/by/4.0/).
Share and Cite
Ma, D.; Lv, B.; Liu, Y.; Liu, S.; Li, X. Brand Premium and Carbon Information Disclosure Strategy: Evidence from China Listed Companies. Sustainability 2023, 15, 5240. https://doi.org/10.3390/su15065240
Ma D, Lv B, Liu Y, Liu S, Li X. Brand Premium and Carbon Information Disclosure Strategy: Evidence from China Listed Companies. Sustainability. 2023; 15(6):5240. https://doi.org/10.3390/su15065240
Chicago/Turabian StyleMa, Diandian, Benfu Lv, Ying Liu, Shuqin Liu, and Xiuting Li. 2023. "Brand Premium and Carbon Information Disclosure Strategy: Evidence from China Listed Companies" Sustainability 15, no. 6: 5240. https://doi.org/10.3390/su15065240
APA StyleMa, D., Lv, B., Liu, Y., Liu, S., & Li, X. (2023). Brand Premium and Carbon Information Disclosure Strategy: Evidence from China Listed Companies. Sustainability, 15(6), 5240. https://doi.org/10.3390/su15065240