Article

The Effect of Water–Zeolite Amount–Burial Depth on Greenhouse Tomatoes with Drip Irrigation under Mulch

1
College of Water Resource Science and Engineering, Taiyuan University of Technology, Taiyuan 030024, China
2
College of Chemical Engineering and Technology, Taiyuan University of Technology, Taiyuan 030024, China
*
Authors to whom correspondence should be addressed.
Sustainability 2023, 15(6), 5220; https://doi.org/10.3390/su15065220
Submission received: 6 January 2023 / Revised: 28 February 2023 / Accepted: 13 March 2023 / Published: 15 March 2023
(This article belongs to the Special Issue Sustainable Water-Saving Irrigation)

Abstract

:
The water–zeolite amount–burial depth coupling regulation strategy of high-quality and high-yield tomatoes was explored with drip irrigation under mulch. Greenhouse planting experiments were performed to monitor and analyze the tomato growth, physiology, yield, quality, and water use efficiency (WUE). The suitable amounts of the water–zeolite amount–burial depth for the tomato growth were determined through the analytic hierarchy process (AHP). The results showed that the effects of increasing the water of the intercellular CO2 concentration (Ci), nitrate content (NO), vitamin content (VC), and soluble solids (SS), increasing the WUE, increasing the zeolite amount of the NO, and increasing the zeolite burial depth of the Ci and SS, were inhibited. The effects of increasing the zeolite amount of the plant height (Kh), stem thickness (Kt), total root length (Rl), total root volume (Rv), root average diameter (Rd), net photosynthetic rate (Pn), stomatal conductivity (Gs), organic acid (OA), VC, yield (Ay), and WUE, and of increasing the zeolite burial depth of the Kh, OA, dry matter quality (Ad), and WUE, were promoted first and then inhibited. The other indicators showed a positive response to increasing the water, zeolite amount, and burial depth. The influence of the water (W), zeolite amount (Z), and zeolite depth (H) on the Kt, Tr, Rl, and Rd, was W > H > Z, and that of the Kh, Gs, Pn, Ci, Ra, Rv, OA, VC, NO, SS, Ad, Ay, and WUE was W > Z > H. The order of weight of each index, based on the AHP, is as follows: Ay > WUE > NO > OA > Ad > Kh > Kt > VC > SS > Pn > Rv > Rd > Tr. The highest comprehensive score was W70–90Z6H15, and the most suitable water conditions for the tomato planting under drip irrigation were 70–90% field capacity, 6 t/hm2 zeolite, and 15 cm depth of zeolite.

1. Introduction

Tomatoes are one of the most popular vegetables because they are an excellent source of minerals, vitamins, organic acids, and antioxidants that are vital for human health [1,2]. Water is one of the major factors that influences the growth and production of tomatoes [3]. Water stress can inhibit the photosynthesis and biomass growth of tomatoes [4,5,6]. Zeolite can be added to soil to optimize its water retention performance [7] and enhance the ability of crop roots to absorb and use the soil water [8]. The crop yields and nutrient use efficiency can be improved [9]. The efficient utilization of water and fertilizer resources can be achieved with drip irrigation under membrane. Moreover, this mechanism has an evident effect on crop increase [10,11]. This work aims to further enrich the theory of drip irrigation under mulch, tap the potential of agricultural water saving, and promote the efficient use of water resources and the tomato quality growth through the coupling strategy of zeolite improver combined with drip irrigation under mulch.
Previous studies have mainly revealed the effects of zeolite quantity on the plant height and stem diameter [12], nutritional quality [13], yield [14,15], and dry matter [14,16] of tomatoes during their growth period. However, few studies have been carried out on the effect of the zeolite amount on the photosynthetic characteristics, root growth, and water use efficiency (WUE) of tomatoes during their growth period. In addition, predecessors have applied zeolite materials into the soil through tilling, rotary tilling, and hole application, which can effectively improve the water absorption and utilization of crops, and promote the growth and development of seedlings [17,18,19]. However, existing reports have not explicitly clarified whether the depth of the zeolite burial will affect the crop growth. The application of zeolite at various soil depths may influence the spatiotemporal redistribution of the soil water and the physiological stimulation effect of the crop rhizosphere, due to its excellent water absorption and retention characteristics, which, in turn, may affect the crop yield. This area warrants further investigation. Many studies have reported the effects of water on tomato yield [20,21], photosynthesis [22], root growth [23], nutrient quality [24], and WUE [25] during the whole growth period [26,27]. However, the primary and secondary effects of the water, zeolite amount, and burial depth remain obscured. This study can serve as an important basis for tomato planting and water regulation.
The response of the tomato growth physiology, yield, and quality formation to each factor and level is inconsistent [28], and the tomato growth and development are difficult to objectively evaluate based on a single index. A comprehensive tomato growth evaluation system must be established. The analytic hierarchy process (AHP) combines the judgment of intangible qualitative criteria with tangible quantitative measurements [29,30] to systematically, flexibly, and concisely address complex decision making problems. At present, AHP is widely used in agriculture. The irrigation and fertilizer amounts that are suitable for greenhouse tomato planting were determined through an analysis of nutrient quality [31]. The optimal irrigation method and quota that are suitable for greenhouse tomato planting were determined by establishing a yield, quality, and WUE comprehensive evaluation model of greenhouse tomato growth [32]. However, these studies only considered the yield, quality, and WUE, and did not involve an analysis of the tomato root growth and photosynthetic physiology. Photosynthesis is the basis of crop growth and yield formation [33], and the root system is the main plant organ for obtaining underground resources [34], which plays a crucial role in maintaining the crop yield [35]. Therefore, the comprehensive analysis and evaluation results may be more comprehensive, objective, and reasonable if the tomato root growth, photosynthetic physiology, and other indicators are taken into consideration in the comprehensive evaluation model.
This research aims to study the effects of W*Z*H on tomato growth, physiology, yield, quality, and WUE, with drip irrigation under film. A comprehensive evaluation model of tomato growth based on growth–physiology–yield–quality–WUE was constructed. Moreover, the appropriate W, H, and Z for the tomato growth were determined to provide theoretical guidance for tomato planting with drip irrigation under film.

2. Materials and Methods

2.1. Experimental Site

The greenhouse experiment was conducted in Yangqu County, Shanxi Province. The area had a warm temperate zone continental climate with an average altitude of 1240 m, years of average rainfall of about 45.9 cm, an average annual evaporation of 181.27 cm, and an annual average temperature of 7.5 °C. The soil in the test site was loess-like and light brown, with an average bulk density of 1.43 g·cm−3, saturated water content of 0.44 cm3·cm−3, and a field water holding rate of 0.31 cm3·cm−3. Table 1 illustrates the basic nutrients of the soil before colonization. The test irrigation water source was the freshwater well in the base.

2.2. Experimental Design

This experiment studied the growth characteristics of tomato under different water levels (W), zeolite amounts (H), and burial depths (Z) under drip irrigation. The test scheme adopted a three-factor orthogonal test design. Table 2 illustrates the different combination treatment designs. The W was set at three levels, namely, W50–70, W60–80, and W70–90, which were equal to 50–70%, 60–80%, and 70–90% of the field capacities, respectively. The Z was set at three levels, namely, Z3, Z6, and Z9, which were equal to 3, 6, and 9 t·hm−2, respectively. The H was set at three levels, namely, H15, H30, and H45, which were equal to 15, 30, and 45 cm, respectively. Each treatment was repeated three times and separated by a plastic waterproof cloth. The tomato cultivar that was tested was Aoguan No. 8, which was planted in a mulching and ridging mode with a ridge length of 6 m. The same field management was carried out for all the plots, in accordance with the local planting habits. The irrigation method was drip irrigation under mulch. The distance between the drip heads was 40 cm, and the working flow was 1.2 L·h−1. Figure 1 shows the layout of the experimental plot. The water content was regularly observed during the growth period. When the soil moisture content reached the lower irrigation limit, it was replenished in a timely fashion to the upper irrigation limit, in order to ensure that the water content was maintained at the design level.

2.3. Measurement Parameters and Methods

In total, three tomato plants were randomly selected in each treatment for observation. The plant height (cm) and stem diameter (cm) were measured with a tape measure and vernier caliper [6], and the corresponding growth rates, Kh and Kt, could be calculated by using the logistic model [36]. The yield (t·hm−2) and dry matter mass (g) were measured via electronic balance [37]. The root growth parameters included the total root length (cm), total root surface area (cm2), total root volume (cm3), and mean root diameter (mm), which were determined with the WIN RHIZO 2003 root analysis software [38]. The photosynthetic parameters included the net photosynthetic rate (μmol·m−2s−1), stomatal conductivity (mol·m−2s−1), transpiration rate (mmol·m−2s−1), and intercellular CO2 concentration (μmol·mol−1), which were determined with an Li-6400 portable photosynthetic instrument [39]. The quality indexes included the organic acid content (%), vitamin C content (mg·kg−1), nitrate content (mg·kg−1), and soluble solid (SS) content (%). The specific measurement methods can be found in the previous research reports [18,27].

2.4. Data Processing and Statistical Analysis

Microsoft Office 2020 was used for the data calculation, IBM SPSS statistics 25 for the statistical analysis, and Origin 2020 for the drawing.

3. Results and Analysis

3.1. Effects of W*Z*H on the Tomato Growth and Physiological Characteristics

3.1.1. Effects of W*Z*H on the Tomato Plant Height and Stem Diameter

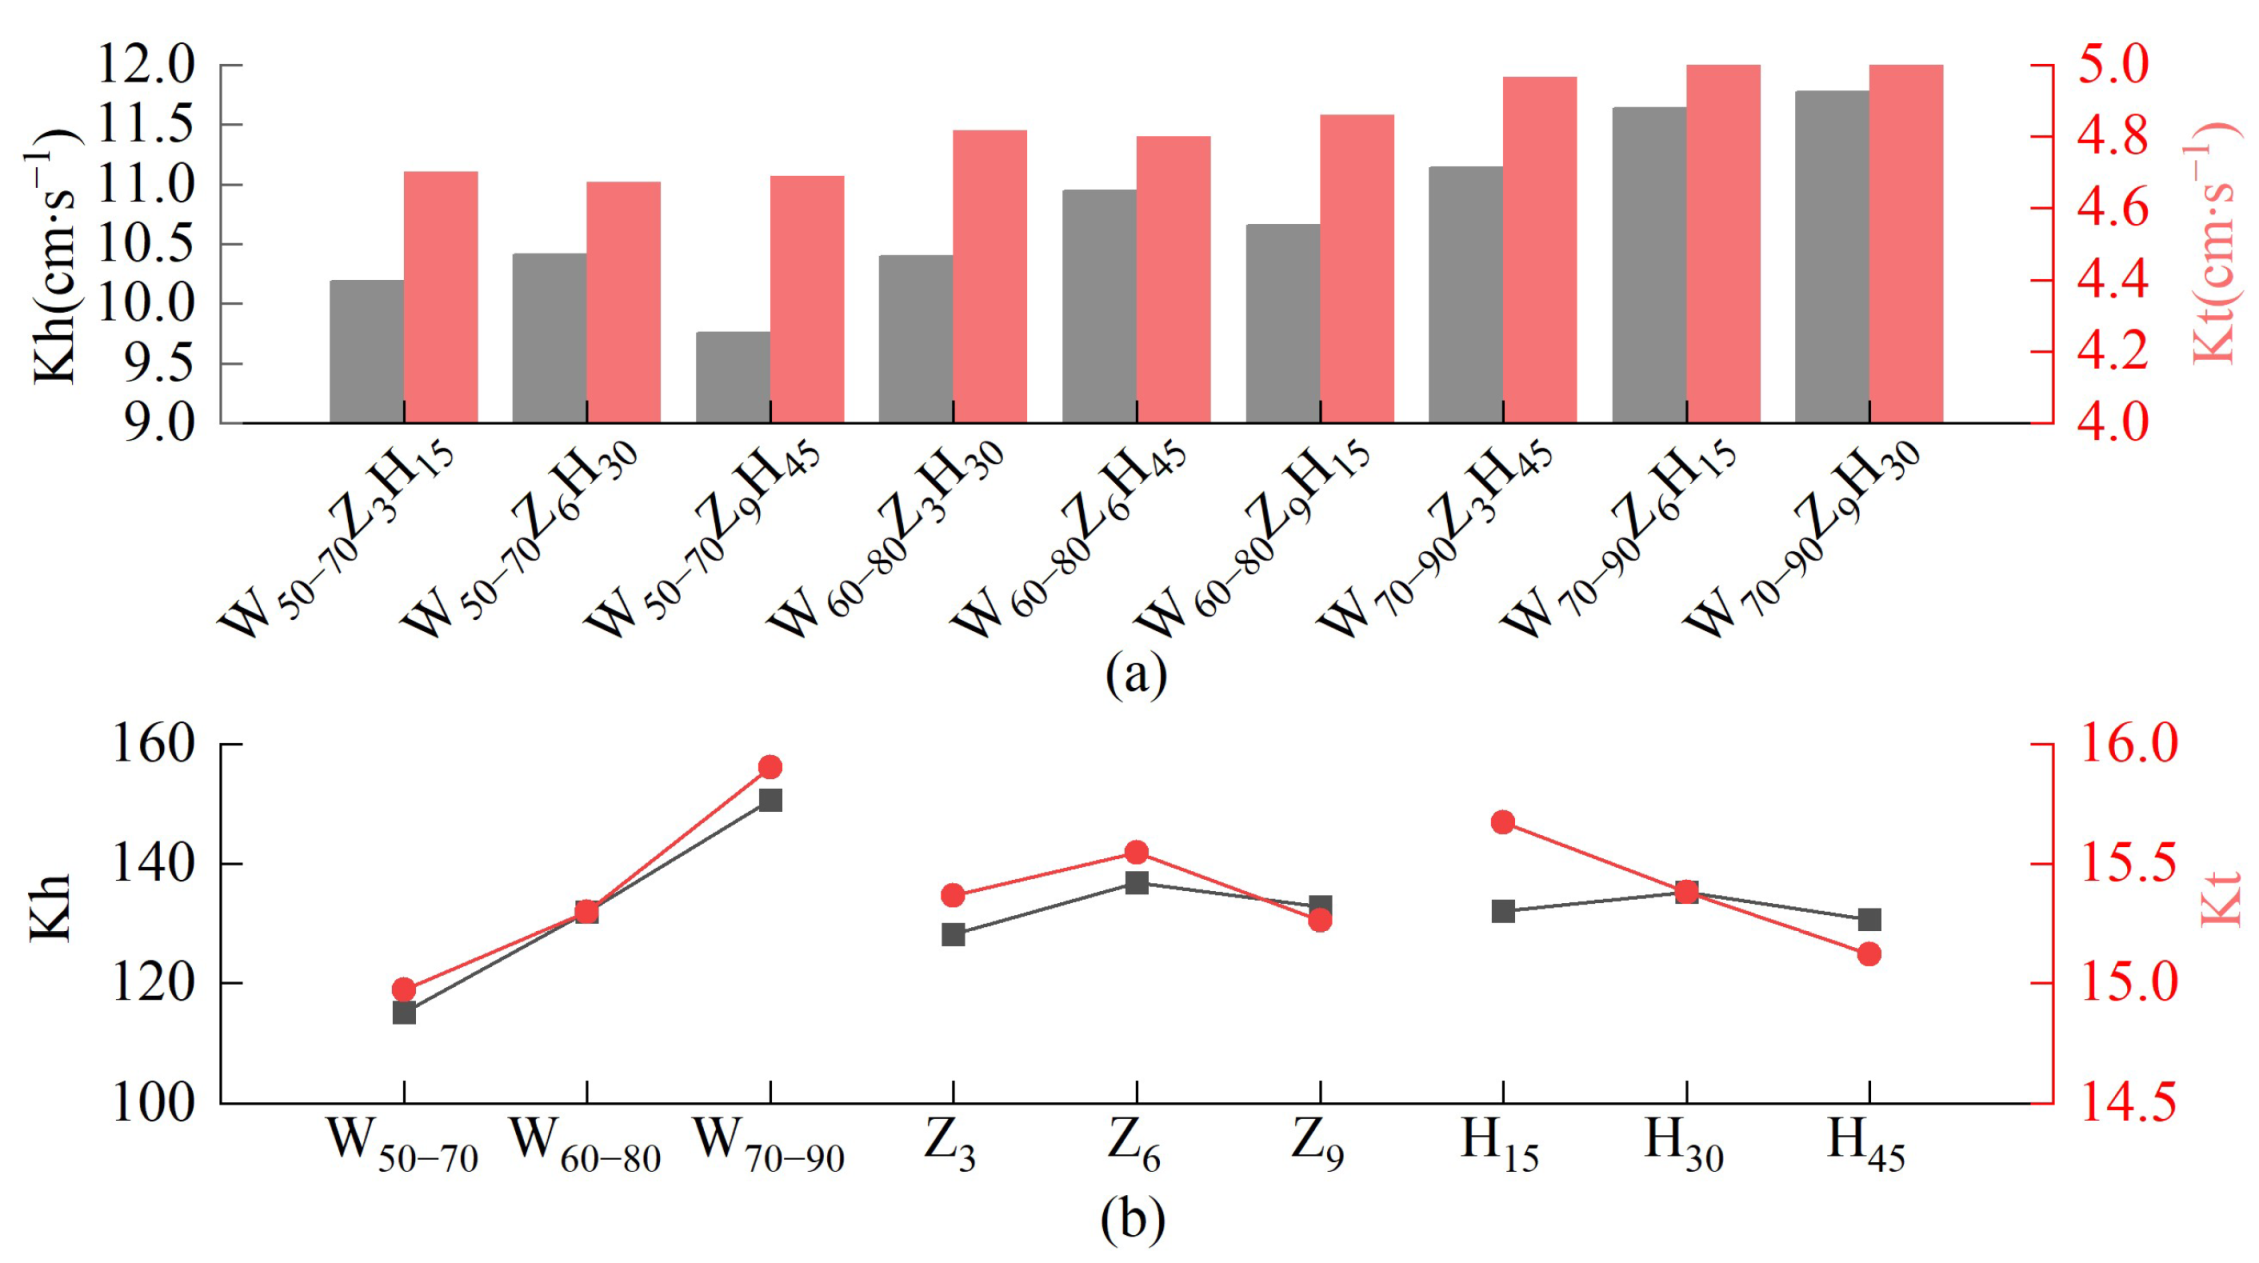
Figure 2 shows the relative growth rate of the tomato plant height and stem diameter under the different treatments. According to Figure 2a, the Kh and Kt under different treatments ranged from 9.7 cm·s−1 to 11.9 cm·s−1 and 4.6 cm·s−1 to 5.2 cm·s−1, with average values of 10.77 and 4.87 cm·s−1. The Kh and Kt reached their maximum in the W70–90Z9H30 treatment and their minimum in the W50–70Z9H45 and W50–70Z6H30 treatments. According to Figure 2b and Table S1, the Kh and Kt increased by 30.02% and 6.21%, respectively, when the W increased from W50–70 to W70–90. Hence, a significant positive correlation exists between the soil moisture and the Kh and Kt (p < 0.05). When the Z increased from Z3 to Z6, the Kh and Kt increased by 6.74% and 1.17%, respectively. When the Z increased from Z6 to Z9, the Kh and Kt decreased by 3% and 1.85%, respectively. These results showed that the effect on the Kh and Kt was promoted first when the Z increased and was then inhibited, but with no significance. When the H increased from H15 to H30, the Kh and Kt increased by 2.42% and decreased by 1.87%. When the H increased from H30 to H45, the Kh and Kt decreased by 3.43% and 1.69%, respectively. These results showed that the effect on the Kh and Kt was promoted first when the H increased and was then inhibited, but with no significance. The influencing sizes of the three factors on the Kh and Kt were W > Z > H and W > H > Z, respectively, based on the comparison of the range value R. The optimal treatment combination of the Kh and Kt was W70–90Z6H30 and W70–90Z6H15. The W played a leading role in the Kh and Kt of the tomatoes.

3.1.2. Effects of W*Z*H on Tomato Photosynthetic Characteristics

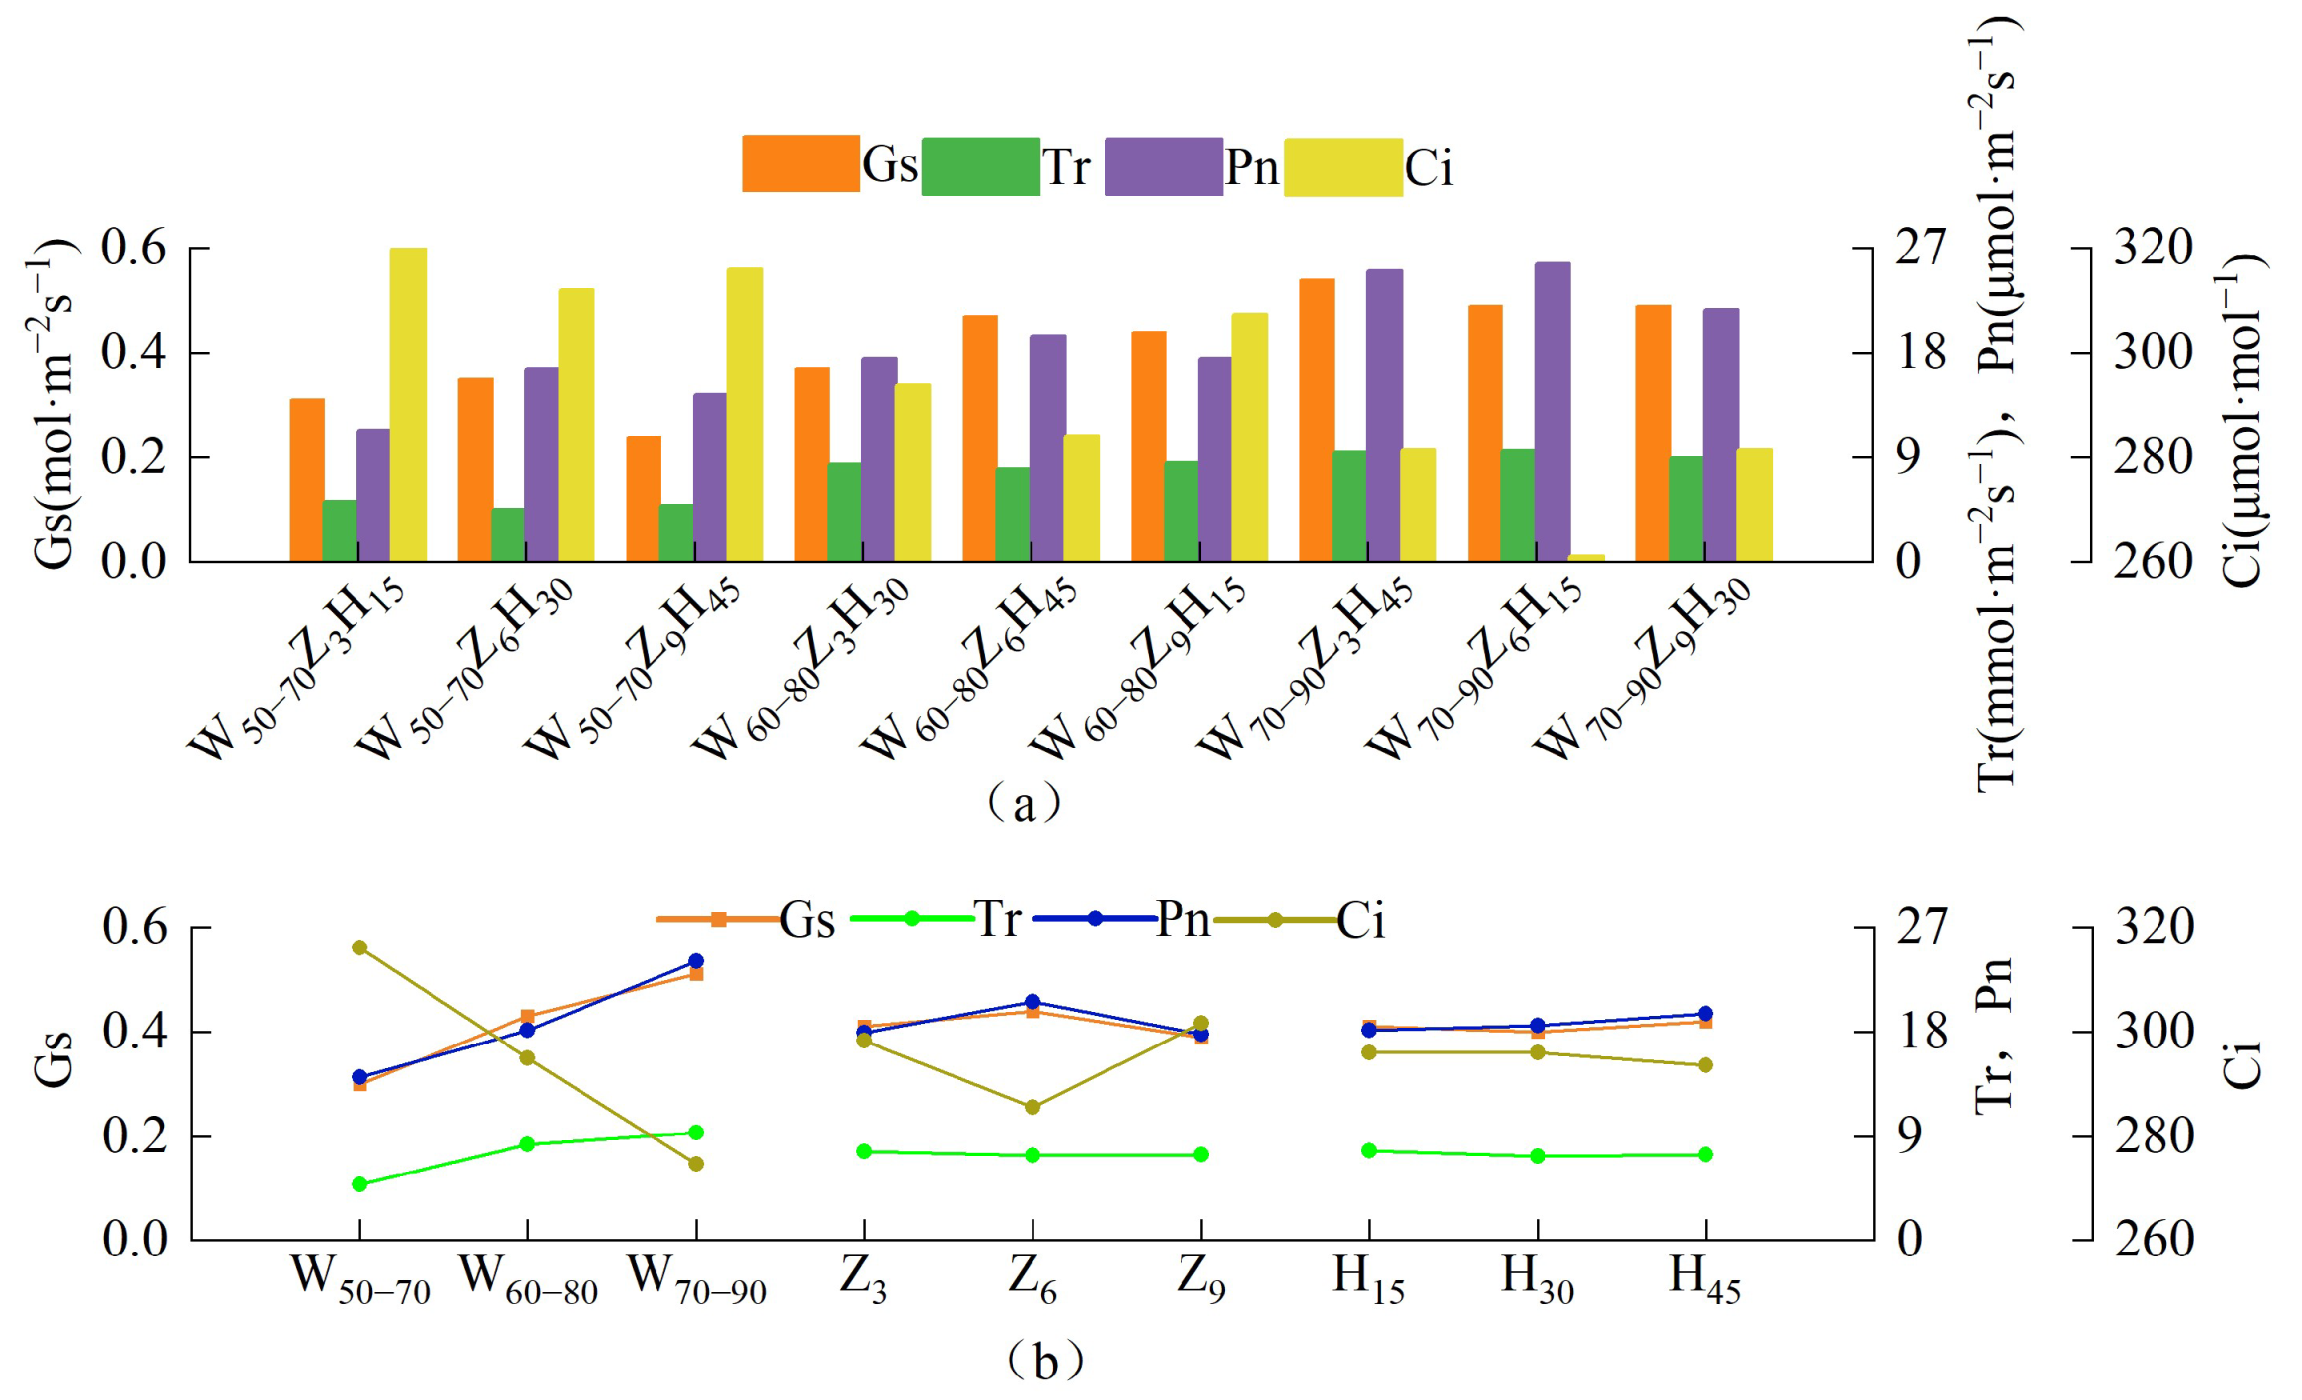
Figure 3 shows the photosynthetic characteristics of the tomatoes under the different treatments. According to Figure 3a, the stomatal conductivity (Gs), the transpiration rate (Tr), the net photosynthetic rate (Pn), and the intercellular CO2 concentration (Ci) were 0.24–0.54 mol·m−2s−1, 4.5–9.63 mmol·m−2s−1, 11.29–25.63 μmol·m−2s−1, and 261–320 μmol·mol−1 under different treatments. W70–90Z3H45, W70–90Z9H30, W70–90Z9H30, and W50–70Z3H15 were treated to the maximum. Figure 3b and Table S2 illustrates that the influence of the W on the Gs, Tr, and Pn was as follows: W50–70 < W60–80 < W70–90, and that the effects on the Ci were as follows: W70–90 < W60–80 < W50–70. These results showed that the effects on the Gs, Tr, and Pn were promoted when the W increased, and the influence on the Ci was inhibited. Moreover, the effect of increasing the W on the promotion of the Gs and Tr was more obvious under high water stress. These results showed that the effects on the Gs and Pn were promoted first when the Z increased, and were then inhibited. Meanwhile, the effects on the Tr and Ci were inhibited first and then promoted. The effects of the different H on the Gs, Tr, Pn, and Ci varied, and the changes were insignificant, which was probably due to the little effect of the H on the tomato photosynthesis. Based on the comparison of the range value R, the influencing size of the three factors on the Gs, Pn, and Ci was W > Z > H, and that on the Tr was W > H > Z. The optimal treatment combinations of the Gs, Pn, Ci, and Tr were W70–90Z3H45, W70–90Z6H45, W50–70Z9H15, and W70–90Z3H15, respectively. The W had significant effects on the Tr (p < 0.01) and Pn (p < 0.05), and played a leading role in the tomato photosynthesis.

3.1.3. Effects of W*Z*H on Tomato Root

Figure 4 shows the root indexes of the tomatoes under the different treatments. As seen in Figure 4a, the total root length (Rl), total root surface area (Ra), root volume (Rv), and average diameter (Rd) of the different treatments ranged from 188.7 dm to 313.3 dm, 363.52 cm2 to 524.83 cm2, 3.45 cm3 to 5.11 cm3, and 0.61 mm to 1.01 mm, respectively. The maximum value was reached at W70–90Z3H45. According to Figure 4b and Table S3, the influence of the W on the Rl, Ra, Rv, and Rd was as follows: W50–70 < W60–80 < W70–90. The water conditions promoted root growth. The influence of the Z and H on the root growth was different. These results showed that the effects on the Rl, Rv, and Rd were promoted first when the Z increased, and were then inhibited. Meanwhile, the effect on the Ra was inhibited. These results showed that the effects on the Rl, Rv, and Rd were promoted when the H increased, and when the effect on the Ra was inhibited. Based on the comparison of the range value R, the influencing size of the three factors on the Rl, Rd, and Ra was W > H > Z, and that on the Rv was W > Z > H. The optimal treatment combination of the Rl, Rv, and Rd was W70–90Z6H45, and that on the Ra was W70–90Z3H15. The W had significant effects on the root growth of tomatoes (p < 0.05) and played a leading role.

3.2. Effects of W*Z*H on the Tomato Nutritional Quality

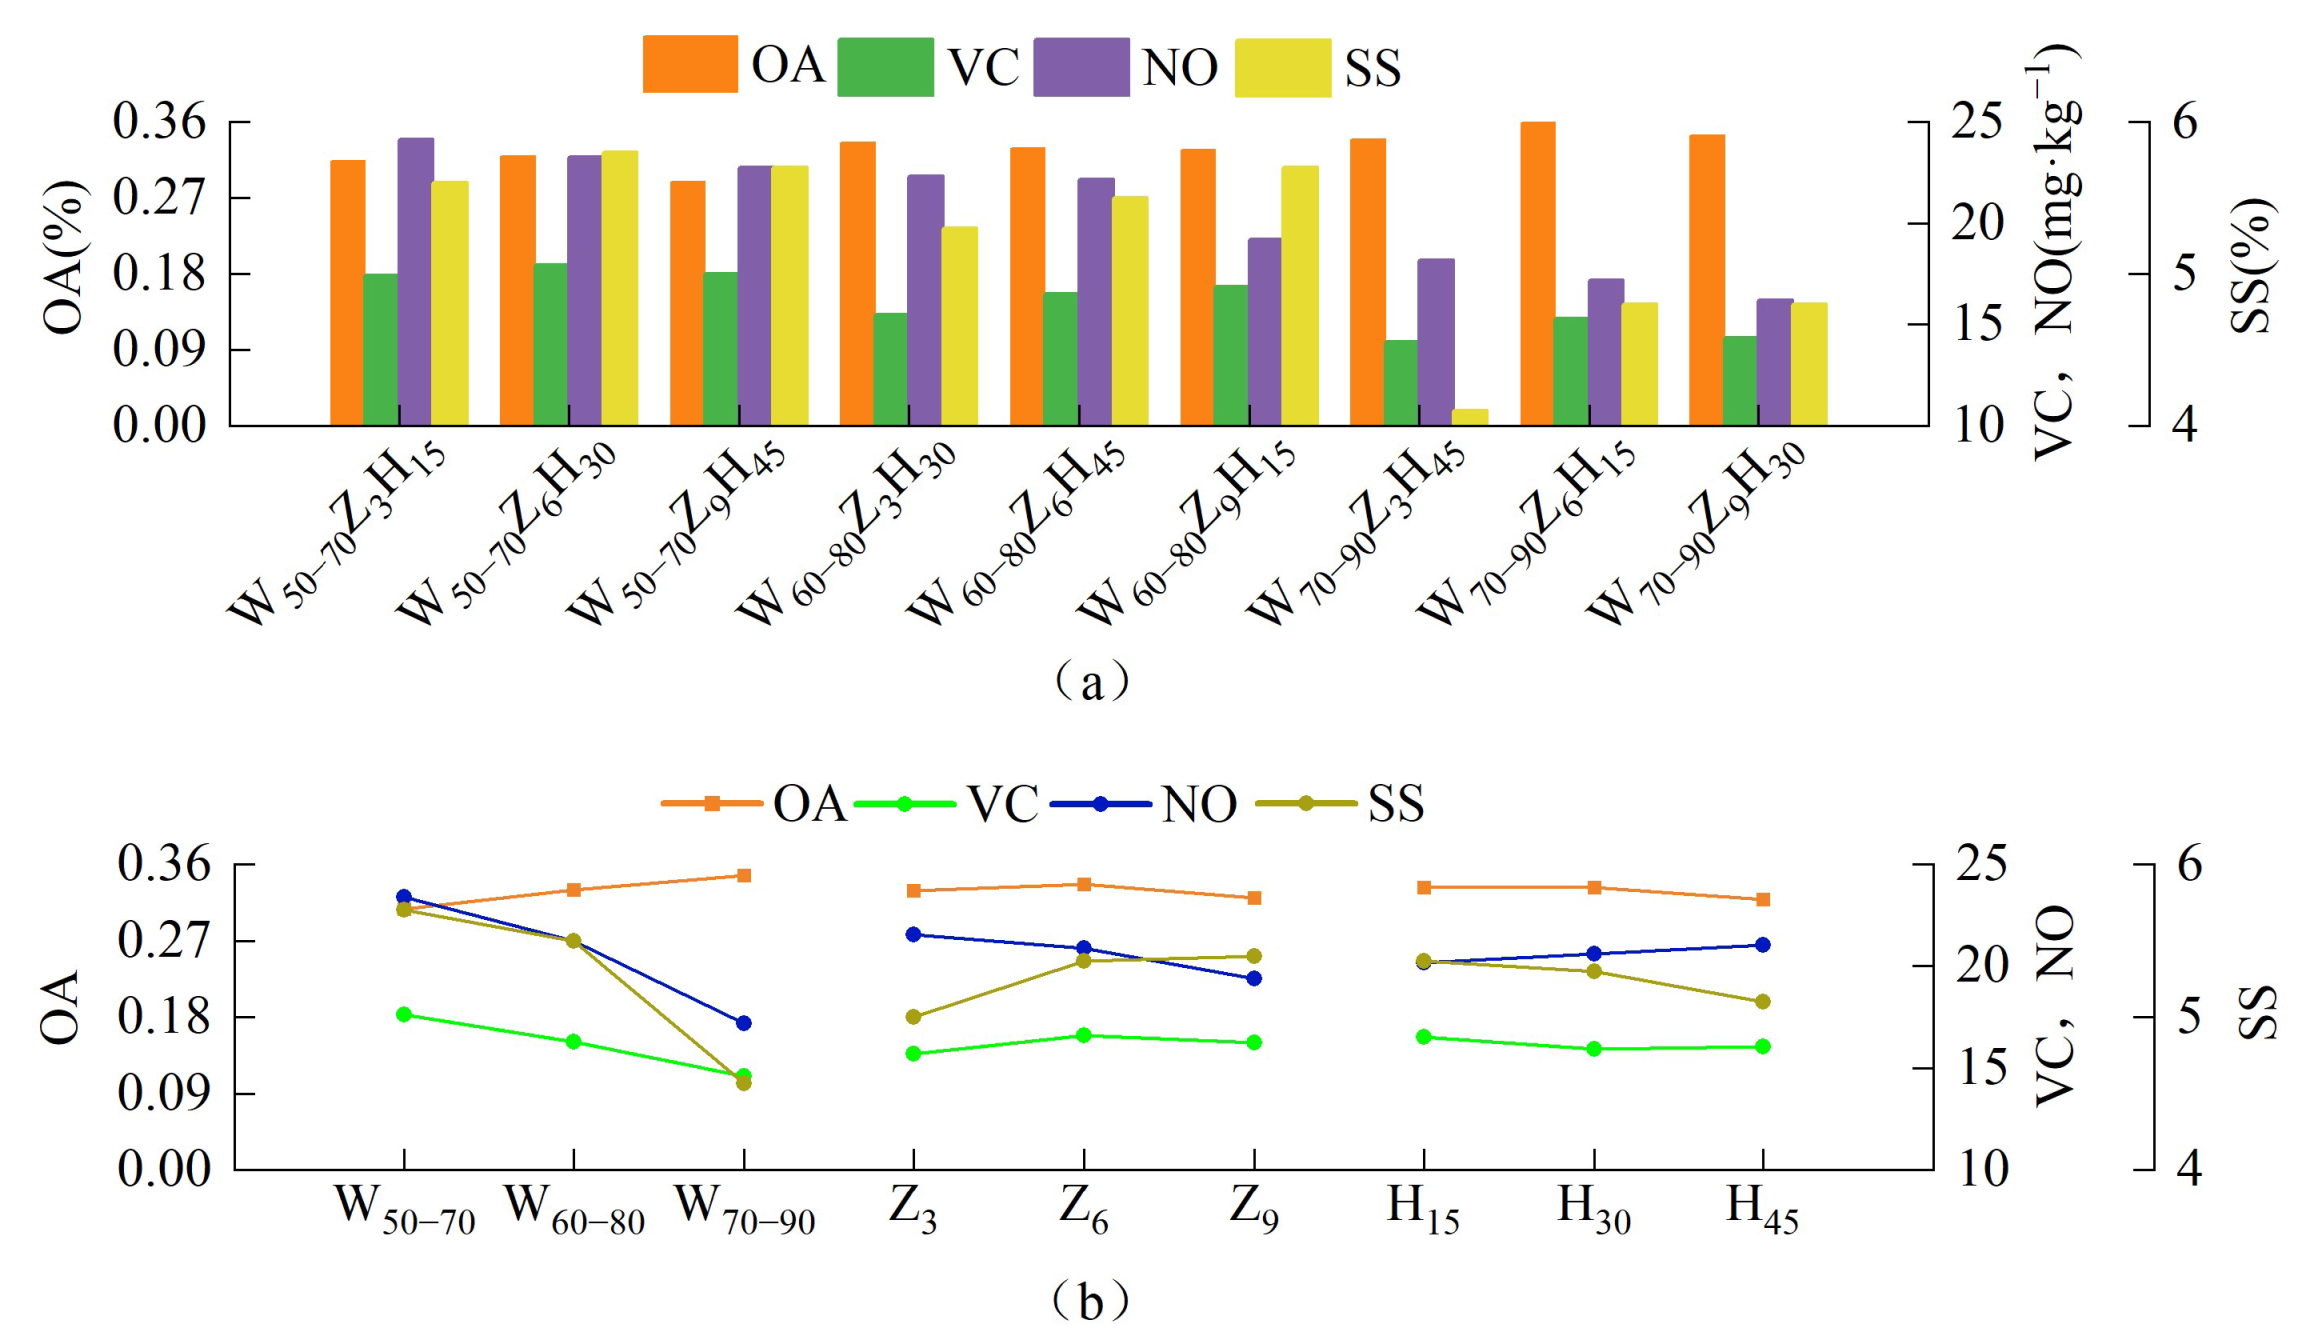
Figure 5 shows the tomato quality indexes under the different treatments. Figure 5a demonstrates certain differences between the organic acid (OA), vitamin (VC), nitrate (NO), and SS under the different treatments. W70–90Z6H15, W50–70Z6H30, W50–70Z3H15, and W50–70Z6H30 were treated to the maximum, and they were 24.22%, 26.87%, 48.86%, and 41.46% higher than the minimum treatments of W50–70Z9H45, W70–90Z3H40, W70–90Z9H30, and W70–90Z3H45, respectively. In Figure 5b and Table S4, the influence of the varying W on the VC, NO, and SS was as follows: W70–90 < W60–80 < W50–70, and that on the OA was as follows: W50–70 < W60–80 < W70–90. These results indicated that higher moisture conditions could inhibit the VC, NO, and SS and promote the OA. The influence of the different Z and H on the OA, VC, NO, and SS varied. The results showed that the effects on the OA and VC were promoted first when the Z increased, and were then inhibited. Meanwhile, the effect on the NO was inhibited, and that on the SS was promoted. These results showed that the effects on the OA, VC, and SS were inhibited when the H increased, and that on the NO were promoted. Based on the comparison of the range value R, the influencing size of the three factors on the nutrient quality was W > Z > H, and the optimal treatment combinations of the OA, VC, NO, and SS were W70–90Z6H15, W50–70Z6H15, W50–70Z3H45, and W50–70Z9H15, respectively. The W had significant effects on the OA and SS (p < 0.01) and the VC and NO (p < 0.05) of the tomatoes, and played a leading role in the nutrient quality. The Z had a significant effect on the OA (p < 0.01) and SS (p < 0.05). Meanwhile, the H had a significant effect on the OA (p < 0.01).

3.3. Effects of W*Z*H on the Dry Matter Quality, Yield, and WUE of Tomatoes

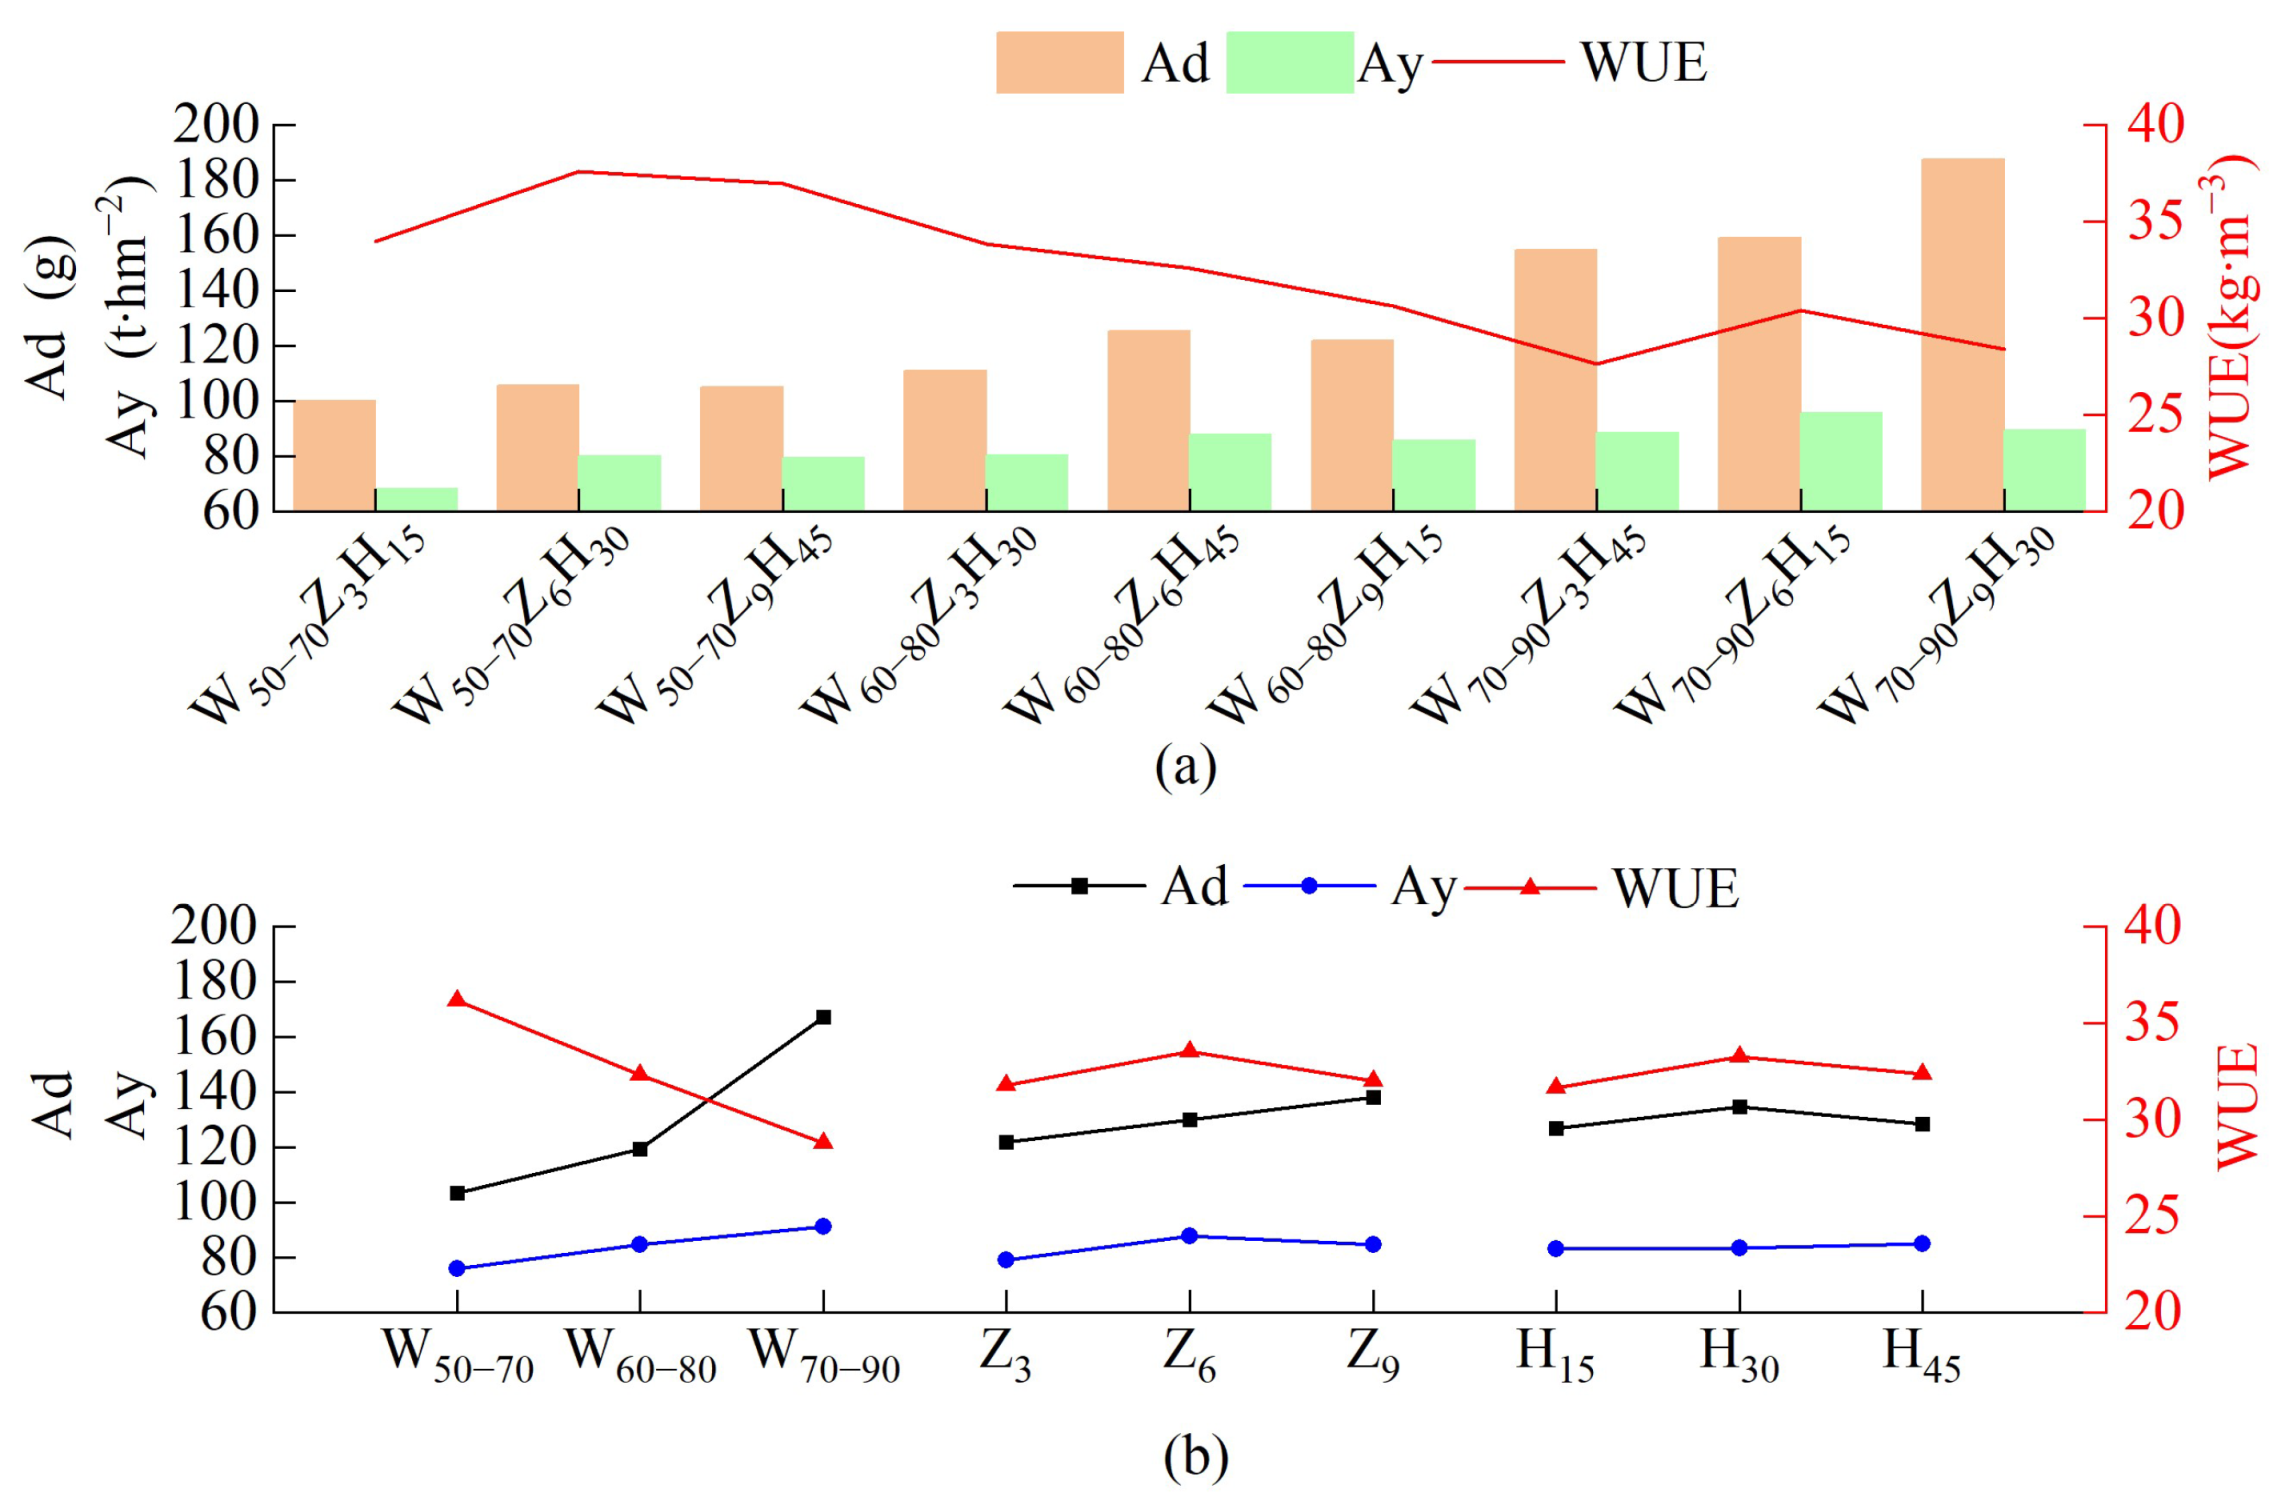
Figure 6 shows the dry matter quality, yield, and WUE of the tomatoes under the different treatments. As seen in Figure 6a, the dry matter quality (Ad), yield (Ay), and WUE of the different treatments ranged from 99.89 g to 187.36 g, 68.18 t∙hm−2 to 95.48 t∙hm−2, and 27.65 kg∙cm3 to 37.61 kg∙cm3. W70–90Z9H30, W70–90Z6H15, and W50–70Z6H30 were treated to the maximum, and they were 87.57%, 40.04%, and 36.02% higher than the minimum treatments of W50–70Z3H15, W50–70Z3H15, and W70–90Z3H45, respectively. As demonstrated in Figure 6b and Table S5, the Ad and Ay increased by 61.4% and 20.1% when the W increased from W50–70 to W70–90, respectively, while the WUE decreased by 20.4%. These results showed that the effects on the Ad and Ay were promoted when the W increased, and those on the WUE were inhibited. The influence of the different Z and H on the Ad, Ay, and WUE varied. When the Z increased, the effect on the Ad was promoted, and that on the Ay and WUE was promoted first and then inhibited. When the H increased, the effects on the Ad and WUE were promoted first and then inhibited, and those on the Ay were promoted. Based on the comparison of the range value R, the influence of the three factors on the Ad, Ay, and WUE was W > Z > H, and the optimal treatment combinations were W70–90Z9H30, W70–90Z6H45, and W50–70Z6H30, respectively. The W played a dominant role in the Ad, Ay, and WUE of the tomatoes.

3.4. Comprehensive Evaluation and Analysis of Tomato Planting

In previous research, the primary and secondary effects of W*Z*H on tomato growth, physiology, quality, Ad, Ay, and WUE, and the primary and secondary orders were preliminarily determined through a study on the influence of different W*Z*H on tomato growth. Accordingly, the optimal treatment under different indexes was obtained. However, the analysis results that were determined based on a single index failed to objectively and comprehensively meet the goals of the high-quality and high-efficiency planting and cultivation of tomatoes. Consequently, 13 evaluation indexes (Kh, Kt, Tr, Pn, Rv, Rd, VC, SS, OA, NO, Ad, Ay, and WUE) were selected to construct a hierarchical analysis structure system (Figure 7). The comprehensive score of the tomato planting under the different treatments was clarified on the basis of this comprehensive evaluation method. Given the limitations of the 1–9 scale method, this study cited the optimized AHP proposed by Zhao [40] and performed a correlation analysis of the 13 evaluation indicators with SPSS software, in order to determine the weight of the factors at each level. The correlation between the factors was used as the criterion to assign values and construct the index comparison matrix. Figure 7 shows the weight calculations of the comprehensive evaluation index of the tomato planting under the different treatments. The consistency ratio of the weights of the comprehensive evaluation index C.R. <0.1 has a satisfactory consistency, indicating that the determination of the comprehensive evaluation weights is reliable. The weight order of each index was as follows: Ay > WUE > NO > OA > Ad > Kh > Kt > VC > SS > Pn > Rv > Rd > Tr.
Table 3 illustrates the membership function values that were obtained by the normalization of each index. The maximum membership function value of each index is one, and the minimum membership function value is zero. The average membership function values of the Kh, Kt, Pn, Tr, Rv, Rd, Ad, Ay, WUE, NO, SS, OA, and VC were 0.476, 0.434, 0.521, 0.586, 0.541, 0.570, 0.346, 0.574, 0.481, 0.447, 0.679, 0.562, and 0.533, respectively. The NO, Ad, and Kh have their maximum values under W70–90Z9H30. The Kt, Ay, Pn, Tr, and OA have their maximum values under W70–90Z6H15. The Rv and Rd have their maximum values under W70–90Z3H45. The WUE, VC, and SS have their maximum values under W50–70Z6H30. These results indicate that the membership function values of each indicator will vary greatly under the different treatments.
The weight of each tomato index was multiplied by its membership function value to obtain the weight score of each index. The total score of the comprehensive evaluation of each variety was obtained by summarizing the results, as shown in Table 4. The results showed that W70–90Z6H15 had the highest score of 0.7949. The tomato planting comprehensive evaluation score under the condition of W70–90Z9H30 came in second (0.7146). Meanwhile, the tomato planting comprehensive evaluation score was the lowest (0.2125) under the condition of W50–70Z3H15. Thus, a planting strategy with a 70–90% field capacity, 6 t·hm−2 zeolite, and 15 cm depth of zeolite must be adopted.

4. Discussion

4.1. Effects of Water Level on Tomato Growth

The experimental results showed that the Kh, Kt, Rl, Ra, Rv, Rd, Pn, Tr, and Gs of the tomatoes showed a positive response to increasing the W, while the Ci demonstrated a negative response to the W increase. Yang [6] found that the effects on the tomato Kh and Kt were promoted when the W increased, while those on the Rl, Ra, and Rd were promoted first and then suppressed. Zhang [39] found that the effects on the tomato Pn, Gs, and Tr were promoted first when the W increased, and were then inhibited, and that those on the Ci were inhibited first and then promoted. The response trend of the tomato root growth and photosynthesis to the W in previous reports was different from the results of this study, which might be caused by the varying degrees of water stress and irrigation methods. The average soil moisture content in Yang’s [6] study was 20.28%, compared with 21.7% in this study. Previous studies had mild water stress, which helped to increase the concentration of abscisic acid in the crops [41], thus accelerating the root growth and promoting the plant growth accumulation [42]. In Zhang’s [39] study, the average soil water content was about 12.1% higher than that of this study by using micro-moist irrigation, which reduced the soil porosity and the oxygen diffusion rate [43]. However, the energy produced by roots under long-term hypoxia stress is not enough to maintain the normal growth of plants [44], resulting in a decrease in plant photosynthesis.
The results also showed that the OA, Ad, and Ay increased by 13.1%, 61.4%, and 20.1% when the W increased, while the NO, VC, SS, and WUE decreased by 26.5%, 17.2%, 19.9%, and 20.4%, respectively. Xia [27] found that the VC, NO, and WUE of tomatoes decreased by 22.43%, 29.16%, and 28.23% when the W increased, while the Ad and Ay increased by 42.85% and 47.93%, respectively. In previous reports, the response degrees of the VC, NO, Ay, and WUE in tomatoes to W were higher than the results of this study. Meanwhile, the response degree of the Ad to the W was lower than the result in this study. This difference may be caused by the varying nutrient contents in the soil. Xia [27] used an organic matter substrate cultivation, which contained 180 kg N/hm2, 119 kg P2O5/hm2, and 3812 kg K2O/hm2. In contrast to the 350 kg N/hm2, 200 kg P2O5/hm2, and 400 kg K2O/hm2 used in this study, the application rate of the potassium fertilizer used in previous studies was significantly increased, which augmented the nutrients required for crop growth to a certain extent, thus promoting crop growth and development and improving the crop yield [45].

4.2. Effects of Zeolite Amount on Tomato Growth

The results showed that the effects on the tomato Kh, Kt, Rl, Rv, Rd, Pn, and Gs were promoted first when the Z increased, and were then inhibited. Meanwhile, the effects on the Ra, Tr, and Ci were inhibited first and then promoted. Zheng [17] found that added zeolite promoted rice Pn, Tr, and Gs and inhibited the Ci. The response trend of crop photosynthesis to Z in previous reports is different from the result of this study, which may be caused by the inconsistency of the experimental conditions, such as the zeolite application amount and the crop type. The experimental crop in Zheng’s [17] study was rice with a zeolite supplemental level of 15 t/hm2, while the experimental crop in this study was tomato with a zeolite supplemental level of 3 to 9 t/hm2. Given the excellent water absorption and retention characteristics of zeolite, its application will influence the redistribution of soil water in time and space, and the physiological stimulation effect of crop rhizosphere, thus affecting the high yield of crops. Previous studies could only reveal the promoting effect of adding more zeolite on rice photosynthesis, but this study can accurately describe the influence of different zeolite content levels on crops from low to high, and that diverse crop types have varying response degrees to zeolite content.
The results showed that the effects on the tomato VC, OA, Ay, and WUE were promoted first when the Z increased, and were then inhibited, those on the NO were inhibited, and those on the SS and Ad were promoted. Petropoulos [46] found that the addition of zeolite promoted the OA and Ay and inhibited the SS in processed tomatoes. The response trend of the OA, SS, Ad, and Ay of tomatoes to Z in previous reports was different from the result of this study, which may be caused by the varying nitrogen application rates. The nitrogen application rate in Petropoulos’s [46] study was 250 kg/hm2, while it was 350 kg/hm2 in this study. Adequate nitrogen fertilizer can effectively and continuously supply nitrogen for crop growth, which will promote crop growth and improve the crop nutrition quality and yield [47].

4.3. Effects of Zeolite Burial Depth on Tomato Growth

The experimental results showed that the effect of the H on the Kh, OA, Ad, and WUE of the tomatoes was first promoted and then inhibited; the effect on the Kt, Ra, Gs, Tr, and VC was first inhibited and then promoted; the effect on the Rl, Rv, Rd, Pn, NO, and Ay was promoted; and the effect on the Ci and SS was inhibited. Zheng [17] studied the effect of zeolite amount on rice photosynthesis by tilling the zeolite to a depth of 5 cm in the soil. Those results showed that the addition of zeolite could promote rice photosynthesis. In Ju’s [18] study on the effect of zeolite amount on tomato growth and development, zeolite caves were applied 30 cm from the surface. Those results showed that the addition of zeolite first promoted and then inhibited the tomato yield. The responses of crops to H in previous reports are different from the results of this study, which may be caused by the different soil quality and irrigation methods. This study utilized loess-like and light brown soil and drip irrigation under film. The average soil water content increased from 20.02% to 21.98% and 24.28%, with the H increasing from H15 to H30 and H45. The soil water held by the zeolite was concentrated at 15, 30, and 45 cm. Zheng [17] used clay loam and continuous flood irrigation, and the average moisture content was 17.33%. The soil water held by the zeolite was concentrated at 5 cm. Ju [18] used clay loam and alternate film drip irrigation, with an average moisture content of 25.25%. The soil water held by the zeolite was concentrated at 30 cm. The depth of the soil water that was held by different zeolite burial depths varied. For tomatoes and rice, about 70% of the total root density in the whole soil layer was concentrated in the ranges of 0–15 and 0~30 cm [48,49]. Therefore, the relative positions of the soil’s moist body and root concentration layer were different in each report, which led to varying degrees of water absorption and utilization by the roots, ultimately resulting in differences in yield and quality [50].

4.4. Comprehensive Evaluation Analysis

The entropy weight method (EWM) was used to establish the growth–Ay–quality–WUE comprehensive evaluation model by Chen [51] (Chen’s model for short). The principal component analysis was used to establish the Ay–quality comprehensive evaluation model by Hao [52] (Hao’s model for short). The comprehensive evaluation results that were obtained by Zhang’s model proposed in this work, Chen’s model [51], and Hao’s model [52], were compared. These results are shown in Table 5. The aforementioned table demonstrates that, under the three comprehensive evaluation models, W70–90Z6H15 was the best treatment, followed by W70–90Z9H30 and W50–70Z3H15. However, the ranking of the intermediate treatments was slightly different. The score ranking of the three following treatments that were calculated by Zhang’s model was W70–90Z3H45 > W60–80Z6H45 > W50–70Z6H30, while that by Chen’s model was W60–80Z6H45 > W50–70Z6H30 > W70–90Z3H45. This result was probably due to the different weight determination methods used in the comprehensive evaluation process. The EWM used by Chen’s model was an objective weighting method [53]. The resulting weight, such as Ay, was only 0.066, the lowest of all the indicator weights, which greatly differs from the actual importance degree. In Zhang’s model, the traditional AHP was optimized, taking into consideration the disadvantages of a single subjective or objective weighting, and the mathematical method was used to process the data, in order to determine the weight. When the subjective and objective methods were combined, the comprehensive evaluation value that was obtained under the different conditions can better show the advantages and disadvantages of each treatment. The score ranking of the three treatments that were calculated by Zhang’s model was W60–80Z6H45 > W60–80Z9H15 > W50–70Z6H30 > W50–70Z9H45, while that by Hao’s model was W60–80Z9H15 > W60–80Z6H45 > W50–70Z9H45 > W50–70Z6H30. This result was probably due to the different selection of the comprehensive evaluation indicators. Hao’s model only took the quality and Ay as its evaluation indexes, while Zhang’s model further comprehensively considered the Kh, Kt, photosynthesis, root growth, quality, Ay, and WUE. The proposed model can more accurately explain the suitable growth conditions and crop response mechanisms of tomato comprehensive growth, by considering the influence of the various indexes on the tomato comprehensive growth.

5. Conclusions

In conclusion, the effects of increasing the W on the Ci, NO, VC, SS, and WUE, the Z on the NO, and the H on the Ci and SS, were inhibited. The effects of increasing the Z on the Kh, Kt, Rl, Rv, Rd, Pn, Gs, OA, VC, Ay, and WUE, and the H on the Kh, OA, Ad, and WUE were promoted first, and then inhibited. The other indicators showed a positive response to increasing the W, Z, and H. The influence of the W, Z, and H on the Kt, Tr, Rl, and Rd was W > H > Z, and that on the Kh, Gs, Pn, Ci, Ra, Rv, OA, VC, NO, SS, Ad, Ay, and WUE was W > Z > H. The order of weight of each index was determined as follows through the AHP: Ay > WUE > NO > OA > Ad > Kh > Kt > VC > SS > Pn > Rv > Rd > Tr. The highest comprehensive score was W7090Z6H15, and the most suitable water conditions for tomato planting under drip irrigation were a 70–90% field capacity, 6 t/hm2 zeolite, and 15 cm depth of zeolite.

Supplementary Materials

The following supporting information can be downloaded at: https://www.mdpi.com/article/10.3390/su15065220/s1, Table S1: ANOVA result of plant height and stem diameter; Table S2: ANOVA result of tomato photosynthetic characteristics; Table S3: ANOVA result of tomato root indexes; Table S4: ANOVA result of tomato quality indexes; Table S5: ANOVA result of tomato dry matter quality, yield, and water use efficiency.

Author Contributions

Conceptualization, M.Z.; methodology, X.G. (Xianghong Guo); software, X.J.; validation, M.Z., T.L. and J.L.; formal analysis, X.G. (Xianghong Guo); investigation, Z.L.; resources, T.L.; data curation, X.G. (Xiaoli Gao); writing—original draft preparation, M.Z.; writing—review and editing, T.L.; data analysis and visualization, Z.L.; supervision, T.L.; project administration, T.L.; funding acquisition, T.L. All authors have read and agreed to the published version of the manuscript.

Funding

This research was funded by the National Natural Science Foundation Program (51909184) and the China Postdoctoral Science Foundation (2020M670693).

Institutional Review Board Statement

Not applicable.

Informed Consent Statement

Not applicable.

Data Availability Statement

Not applicable.

Acknowledgments

We appreciate that postgraduates from the university of the first author investigated and collected data. We are also grateful to the editors and anonymous reviewers for their suggestions and comments.

Conflicts of Interest

The authors declare no conflict of interest.

References

  1. Erba, D.; Casiraghi, M.C.; Ribas-Agusti, A.; Caceres, R.; Marfa, O.; Castellari, M. Nutritional value of tomatoes (Solanum lycopersicum L.) grown in greenhouse by different agronomic techniques. J. Food Compos. Anal. 2013, 31, 245–251. [Google Scholar] [CrossRef]
  2. Toor, R.K.; Savage, G.P.; Heeb, A. Influence of different types of fertilisers on the major antioxidant components of tomatoes. J. Food Compos. Anal. 2006, 19, 20–27. [Google Scholar] [CrossRef]
  3. Chapagain, A.K.; Orr, S. An improved water footprint methodology linking global consumption to local water resources: A case of Spanish tomatoes. J. Environ. Manag. 2009, 90, 1219–1228. [Google Scholar] [CrossRef] [PubMed]
  4. Wang, D.; Duan, H.; Huang, G.; Zhou, J.; Li, W.; Huang, R.; Fan, H. Effects of high temperature and drought stress on growth, nutrient concentration, and nutrient use efficiency of tomato seedlings. Acta Ecol. Sin. 2019, 39, 3199–3209. [Google Scholar]
  5. Xiao, H.-J.; Li, J.-Q.; Wang, J.-Q.; QJ, D. Effects of sub-low temperature and drought stress on water transport and morphological anatomy of tomato plant. J. Appl. Ecol. 2020, 31, 2630–2636. [Google Scholar]
  6. Yang, Z.; Qiu, Y.; Liu, Z.; Chen, Y.; Tan, W. The effects of soil moisture stress on the growth of root and above-ground parts of greenhouse tomato crops. Acta Ecol. Sin. 2016, 36, 748–757. [Google Scholar]
  7. Sepaskhah, A.; Barzegar, M. Yield, water and nitrogen-use response of rice to zeolite and nitrogen fertilization in a semi-arid environment. Agric. Water Manag. 2010, 98, 38–44. [Google Scholar] [CrossRef]
  8. Cui, X.; Song, J.; Qu, M. Effect of soil water potential on hydraulic parameters of Fraxinus mandshurica seedlings. Ying Yong Sheng Tai Xue Bao J. Appl. Ecol. 2004, 15, 2237–2244. [Google Scholar]
  9. Ramesh, K.; Reddy, D.D.; Biswas, A.K.; Rao, A.S. Zeolites and their Potential Uses in Agriculture. Adv. Agron. 2011, 113, 215–236. [Google Scholar]
  10. Amare, D.G. Review on Effect of Different Irrigation Method on Water Use Efficiency, Yield Productivity and Nitrogen Application. J. Biol. Agric. Health 2020, 10, 1–9. [Google Scholar]
  11. Gencoglan, C.; Akinci, I.E.; Akinci, S.; Gencoglan, S.; Ucan, K. Effect of different irrigation methods on yield of red hot pepper and plant mortality caused by Phytophthora capsici Leon. J. Environ. Biol. 2005, 26, 741–746. [Google Scholar]
  12. Lafrenière, C.; Surrage, V.; Dixon, M.; Zheng, Y. Evaluation of zeolite as a component in organic growing substrates for tomato transplant production. In Proceedings of the International Symposium on High Technology for Greenhouse Systems: GreenSys2009 893, Quebec City, QC, Canada, 14–19 June 2009; pp. 1215–1222. [Google Scholar]
  13. Sönmez, İ.; Kaplan, M.; Demir, H.; Yilmaz, E. Effects of zeolite on seedling quality and nutrient contents of tomato plant (Solanum lycopersicon cv. Malike F1) grown in different mixtures of growing media. J. Food Agric. Environ. 2010, 8, 1162–1165. [Google Scholar]
  14. Bernardi, A.C.; de Monte, M.B.M.; Paiva, P.R.P.; Werneck, C.G.; Haim, P.G.; de Barros, F.S. Dry matter production and nutrient accumulation after successive crops of lettuce, tomato, rice, and andropogongrass in a substrate with zeolite. Rev. Bras. Ciência Solo 2010, 34, 435–442. [Google Scholar] [CrossRef]
  15. Urbina-Sanchez, E.; Baca-Castillo, G.A.; Nunez-Escobar, R.; Colinas-Leon, M.T.; Tijerina-Chavez, L.; Tirado-Torres, J.L. Tomato seedlings soilless culture on K+, Ca2+ or Mg2+ loaded zeolite and different granule size. Agrociencia 2006, 40, 419–429. [Google Scholar]
  16. Bernardi, A.C.; Werneck, C.G.; Haim, P.G.; Botrel, N.; Oiano-Neto, J.; de Monte, M.B.M.; Verruma-Bernardi, M.R. Yield and fruit quality of tomato grown in substrate with zeolite. Hortic. Bras. 2007, 25, 306–311. [Google Scholar] [CrossRef] [Green Version]
  17. Zheng, J.L.; Chen, T.T.; Wu, Q.; Yu, J.M.; Chen, W.; Chen, Y.L.; Siddique, K.H.M.; Meng, W.Z.; Chi, D.C.; Xia, G.M. Effect of zeolite application on phenology, grain yield and grain quality in rice under water stress. Agric. Water Manag. 2018, 206, 241–251. [Google Scholar] [CrossRef]
  18. Ju, X.; Lei, T.; Guo, X.; Sun, X.; Ma, J.; Liu, R.; Zhang, M. Evaluation of Suitable Water–Zeolite Coupling Regulation Strategy of Tomatoes with Alternate Drip Irrigation under Mulch. Horticulturae 2022, 8, 536. [Google Scholar] [CrossRef]
  19. Rodrigues, M.Â.; do Torres, L.N.D.; Damo, L.; Raimundo, S.; Sartor, L.; Cassol, L.C.; Arrobas, M. Nitrogen use efficiency and crop yield in four successive crops following application of biochar and zeolites. J. Soil Sci. Plant Nutr. 2021, 21, 1053–1065. [Google Scholar] [CrossRef]
  20. Kurbanov, S.A.; Magomedova, D.S.; Dzhambulatova, A.Z. The influence of soil treatment and irrigation methods on tomato yield and quality in the lowlands of Dagestan. In Proceedings of the International Conference on World Technological Trends in Agribusiness (WTTA), Omsk, Russia, 4–5 July 2020. [Google Scholar]
  21. Rostami Ajirloo, A.; Amiri, E. Responses of tomato cultivars to water-deficit conditions (Case study: Moghan Plain, Iran). Commun. Soil Sci. Plant Anal. 2018, 49, 2267–2283. [Google Scholar] [CrossRef]
  22. Zhang, E.; Yan, W.; Hou, Y.; Zhang, S. Effect of Soil Amendments Used in Sandy Soil on the Photosynthetic Rate of Tomatoes. In Proceedings of the 3rd Conference on Horticulture Science and Technology (CHST 2012), Beijing, China, 24–25 November 2012; pp. 82–86. [Google Scholar]
  23. Niu, W.-Q.; Jia, Z.-X.; Zhang, X.; Shao, H.-B. Effects of Soil Rhizosphere Aeration on the Root Growth and Water Absorption of Tomato. Clean-Soil Air Water 2012, 40, 1364–1371. [Google Scholar] [CrossRef]
  24. Sun, W.H.; Liu, X.Y.; Wang, Y.; Hua, Q.; Song, X.M.; Gu, Z.; Pu, D.Z. Effect of water stress on yield and nutrition quality of tomato plant overexpressing StAPX. Biol. Plant. 2014, 58, 99–104. [Google Scholar] [CrossRef]
  25. Li, Q.; Wei, M.; Li, Y.; Feng, G.; Wang, Y.; Li, S.; Zhang, D. Effects of soil moisture on water transport, photosynthetic carbon gain and water use efficiency in tomato are influenced by evaporative demand. Agric. Water Manag. 2019, 226, 105818. [Google Scholar] [CrossRef]
  26. Aydiner, E.; Tuzel, Y.; Tuzel, I.H.; Tunali, U.; Oztekin, G.B. Effects of irrigation based on different moisture levels of growing medium on soilless grown greenhouse tomatoes. In Proceedings of the 6th Balkan Symposium on Vegetables and Potatoes, Zagreb, Croatia, 29 September–2 October 2014; pp. 93–98. [Google Scholar]
  27. Xia, X.-B.; Yu, X.-C.; Gao, J.-J. Effects of moisture content in organic substrate on the physiological characters, fruit quality and yield of tomato plant. J. Appl. Ecol. 2007, 18, 2710–2714. [Google Scholar]
  28. Jian, Z.; Xingyun, Q.; Cong, S.; Shaohong, Y.; You, W. Tomato Comprehensive Quality Evaluation and Irrigation Mode Optimization with Biogas Slurry Based on the Combined Evaluation Model. Agronomy 2022, 12, 1391. [Google Scholar]
  29. Dağdeviren, M.; Yavuz, S.; Kılınç, E. Weapon selection using the AHP and TOPSIS methods under fuzzy environment. Expert Syst. Appl. 2009, 36, 8143–8151. [Google Scholar] [CrossRef]
  30. Durbach, I.; Lahdelma, R.; Salminen, P. The analytic hierarchy process with stochastic judgements. Eur. J. Oper. Res. 2014, 238, 552–559. [Google Scholar] [CrossRef]
  31. Wu, X.; Wang, K.; Niu, X.; Hu, T. Construction of comprehensive nutritional quality index for tomato and its response to water and fertilizer supply. Trans. Chin. Soc. Agric. Eng. 2014, 30, 119–127. [Google Scholar]
  32. Wang, F.; Kang, S.; Du, T.; Li, F.; Qiu, R. Determination of comprehensive quality index for tomato and its response to different irrigation treatments. Agric. Water Manag. 2011, 98, 1228–1238. [Google Scholar] [CrossRef]
  33. Li, T.; Liu, L.-N.; Jiang, C.-D.; Liu, Y.-J.; Shi, L. Effects of mutual shading on the regulation of photosynthesis in field-grown sorghum. J. Photochem. Photobiol. B Biol. 2014, 137, 31–38. [Google Scholar] [CrossRef] [Green Version]
  34. Ye, Z.-Q.; Wang, J.-M.; Wang, W.-J.; Zhang, T.-H.; Li, J.-W. Effects of root phenotypic changes on the deep rooting of Populus euphratica seedlings under drought stresses. PeerJ 2019, 7, e6513. [Google Scholar] [CrossRef] [Green Version]
  35. Chen, X.; Wu, Q.; Gao, Y.; Zhang, J.; Wang, Y.; Zhang, R.; Zhou, Y.; Xiao, M.; Xu, W.; Huang, R. The Role of Deep Roots in Sorghum Yield Production under Drought Conditions. Agronomy 2020, 10, 611. [Google Scholar] [CrossRef]
  36. Dong, N.; Tang, M.-M.; Zhang, W.-P.; Bao, X.-G.; Wang, Y.; Christie, P.; Li, L. Temporal differentiation of crop growth as one of the drivers of intercropping yield advantage. Sci. Rep. 2018, 8, 3110. [Google Scholar] [CrossRef] [Green Version]
  37. Obregón-Portocarrero, N.; Díaz-Ortiz, J.E.; Daza-Torres, M.C.; Aristizabal-Rodríguez, H.F. Efecto de la aplicación de zeolita en la recuperación de nitrógeno y el rendimiento de maíz. Acta Agron. 2016, 65, 24–30. [Google Scholar] [CrossRef]
  38. Wu, Q.; Chen, T.; Chi, D.; Xia, G.; Sun, Y.; Song, Y. Increasing nitrogen use efficiency with lower nitrogen application frequencies using zeolite in rice paddy fields. Int. Agrophys. 2019, 33, 263–269. [Google Scholar] [CrossRef]
  39. Zhang, M.; Xiao, N.; Li, Y.; Li, Y.; Zhang, D.; Xu, Z.; Zhang, Z. Growth and Fruit Yields of Greenhouse Tomato under the Integrated Water and Fertilizer by Moistube Irrigation. Agronomy 2022, 12, 1630. [Google Scholar] [CrossRef]
  40. Zhao, J.; Hu, J.; Li, S. Selection of Irrigation Quota of Drip Irrigation under Film for Maize Based on Optimized AHP Method. J. Shenyang Agric. Univ. 2021, 52, 40–48. (In Chinese) [Google Scholar]
  41. Hernandez-Espinoza, L.H.; Barrios-Masias, F.H. Physiological and anatomical changes in tomato roots in response to low water stress. Sci. Hortic. 2020, 265, 109208. [Google Scholar] [CrossRef]
  42. Li, W.; Zhang, S.; Ding, S.; Shan, L. Root morphological variation and water use in alfalfa under drought stress. Acta Ecol. Sin. 2010, 30, 5140–5150. [Google Scholar]
  43. Li, Y.; Niu, W.; Cao, X.; Wang, J.; Zhang, M.; Duan, X.; Zhang, Z. Effect of soil aeration on root morphology and photosynthetic characteristics of potted tomato plants (Solanum lycopersicum) at different NaCl salinity levels. BMC Plant Biol. 2019, 19, 331. [Google Scholar] [CrossRef] [Green Version]
  44. Patel, D.; Das, A.; Munda, G.; Ghosh, P.; Bordoloi, J.S.; Kumar, M. Evaluation of yield and physiological attributes of high-yielding rice varieties under aerobic and flood-irrigated management practices in mid-hills ecosystem. Agric. Water Manag. 2010, 97, 1269–1276. [Google Scholar] [CrossRef]
  45. Heckman, J.; Kamprath, E. Potassium accumulation and corn yield related to potassium fertilizer rate and placement. Soil Sci. Soc. Am. J. 1992, 56, 141–148. [Google Scholar] [CrossRef]
  46. Petropoulos, S.A.; Fernandes, Â.; Xyrafis, E.; Polyzos, N.; Antoniadis, V.; Barros, L.; Ferreira, I. The optimization of nitrogen fertilization regulates crop performance and quality of processing tomato (Solanum lycopersicum L. cv. Heinz 3402). Agronomy 2020, 10, 715. [Google Scholar] [CrossRef]
  47. Wang, X.; Fan, J.; Xing, Y.; Xu, G.; Wang, H.; Deng, J.; Wang, Y.; Zhang, F.; Li, P.; Li, Z. The effects of mulch and nitrogen fertilizer on the soil environment of crop plants. Adv. Agron. 2019, 153, 121–173. [Google Scholar]
  48. Asch, F.; Dingkuhn, M.; Sow, A.; Audebert, A. Drought-induced changes in rooting patterns and assimilate partitioning between root and shoot in upland rice. Field Crops Res. 2005, 93, 223–236. [Google Scholar] [CrossRef]
  49. Zotarelli, L.; Scholberg, J.M.; Dukes, M.D.; Muñoz-Carpena, R.; Icerman, J. Tomato yield, biomass accumulation, root distribution and irrigation water use efficiency on a sandy soil, as affected by nitrogen rate and irrigation scheduling. Agric. Water Manag. 2009, 96, 23–34. [Google Scholar] [CrossRef]
  50. Zhang, S.; Wang, H.; Sun, X.; Fan, J.; Zhang, F.; Zheng, J.; Li, Y. Effects of farming practices on yield and crop water productivity of wheat, maize and potato in China: A meta-analysis. Agric. Water Manag. 2021, 243, 106444. [Google Scholar] [CrossRef]
  51. Chen, H.; Shang, Z.-H.; Cai, H.-J.; Zhu, Y. An Optimum Irrigation Schedule with Aeration for Greenhouse Tomato Cultivations Based on Entropy Evaluation Method. Sustainability 2019, 11, 4490. [Google Scholar] [CrossRef] [Green Version]
  52. Hao, S.; Cao, H.; Wang, H.; Pan, X. Effects of water stress at different growth stages on comprehensive fruit quality and yield in different bunches of tomatoes in greenhouses. Int. J. Agric. Biol. Eng. 2019, 12, 67–76. [Google Scholar] [CrossRef]
  53. Yi, F.; Li, C.; Feng, Y. Two precautions of entropy-weighting model in drought-risk assessment. Nat. Hazards 2018, 93, 339–347. [Google Scholar] [CrossRef]
Figure 1. Layout of the experimental plot.
Sustainability 15 05220 g001
Figure 2. Relative growth rates of tomato plant height and stem diameter under different treatments. (a) Relative growth rates of each treatment. (b) Results of the range analysis.
Sustainability 15 05220 g002
Figure 3. Tomato photosynthetic characteristics under different treatments. (a) Photosynthetic value of each treatment. (b) Results of the range analysis.
Sustainability 15 05220 g003
Figure 4. Root indexes of tomatoes under different treatments. (a) Root index value of each treatment. (b) Results of the range analysis.
Sustainability 15 05220 g004
Figure 5. Quality indexes of tomatoes under different treatments. (a) Quality index value of each treatment. (b) Results of the range analysis.
Sustainability 15 05220 g005
Figure 6. Dry matter quality, yield, and WUE of tomatoes under different treatments. (a) Dry matter quality, yield, and WUE value of each treatment. (b) Results of the range analysis.
Sustainability 15 05220 g006
Figure 7. Tomato comprehensive growth evaluation index system and weight distribution.
Sustainability 15 05220 g007
Table 1. Physical and chemical properties of soil.
Organic Matter (g·kg−1)Total Nitrogen (g·kg−1)Available Phosphorus (g·kg−1)Available Potassium (g·kg−1)Available Nitrogen (g·kg−1)PH
15.321.120.022310.120320.052218.43
Table 2. Design of test.
TreatmentSoil Moisture Content (% Field Capacity)Zeolite Amount (t·hm−2)Zeolite Buried Deep (cm)
W50–70Z3H1550–70315
W50–70Z6H3050–70630
W50–70Z9H4550–70945
W60–80Z3H3060–80330
W60–80Z6H4560–80645
W60–80Z9H1560–80915
W70–90Z3H4570–90345
W70–90Z6H1570–90615
W70–90Z9H3070–90930
Table 3. Membership function values of each index of tomatoes under different treatments.
TreatmentsKhKtPnTrRvRdAdAyWUENOSSOAVC
W50–70Z3H150.130.3700.1400000.6300.880.360.87
W50–70Z6H300.250.230.3700.270.200.070.441.000.111.000.431.00
W50–70Z9H45000.210.070.080.250.060.410.940.180.9400.88
W60–80Z3H300.340.390.430.750.590.650.130.450.620.230.710.660.35
W60–80Z6H450.610.340.570.680.700.780.290.710.490.250.820.570.62
W60–80Z9H150.440.410.430.790.520.500.250.640.300.620.940.540.72
W70–90Z3H450.690.500.960.971.001.000.630.7400.7500.710
W70–90Z6H150.821.001.001.000.870.900.681.000.280.880.411.000.31
W70–90Z9H301.000.670.720.870.840.851.000.780.071.000.410.790.05
Table 4. Total score of the comprehensive evaluation of tomatoes under different treatments.
TreatmentsGrowth and PhysiologyYield and QualityTotal Score
KhKtPnTrRvRdAdAyWUENSSOAVC
W50–70Z3H150.020.030.000.000.000.000.000.000.090.000.050.030.040.21
W50–70Z6H300.030.020.010.000.010.010.000.190.140.010.060.040.040.43
W50–70Z9H450.000.000.000.000.000.010.000.180.130.020.050.000.040.35
W60–80Z3H300.040.030.010.020.020.020.010.190.090.030.040.060.010.45
W60–80Z6H450.070.030.010.020.030.030.020.310.070.030.050.050.030.55
W60–80Z9H150.050.030.010.030.020.020.020.270.040.070.050.050.030.53
W70–90Z3H450.080.040.020.030.040.040.040.320.000.080.000.060.000.59
W70–90Z6H150.100.080.020.030.030.030.050.430.040.100.020.090.010.79
W70–90Z9H300.120.060.020.030.030.030.070.340.010.110.020.070.000.71
Table 5. Comparison of the different index analysis methods.
TreatmentsZhang’s Comprehensive Evaluation ModelChen’s Comprehensive Evaluation ModelHao’s Comprehensive Evaluation Model
ScoreRankingScoreRankingScoreRanking
W50–70Z3H150.212590.394892.271469
W50–70Z6H300.43217 0.496044.313868
W50–70Z9H450.352180.408284.409337
W60–80Z3H300.447860.422565.164736
W60–80Z6H450.54994 0.507736.182215
W60–80Z9H150.531450.456256.322044
W70–90Z3H450.587830.412477.853533
W70–90Z6H150.794910.616518.882151
W70–90Z9H300.714620.606728.246332
Disclaimer/Publisher’s Note: The statements, opinions and data contained in all publications are solely those of the individual author(s) and contributor(s) and not of MDPI and/or the editor(s). MDPI and/or the editor(s) disclaim responsibility for any injury to people or property resulting from any ideas, methods, instructions or products referred to in the content.