Review

Ecosystem Services Research in Rural Areas: A Systematic Review Based on Bibliometric Analysis

1
College of Landscape and Horticulture, Southwest Forestry University, Kunming 650224, China
2
College of Landscape and Horticulture, Yunnan Agricultural University, Kunming 650500, China
*
Author to whom correspondence should be addressed.
Sustainability 2023, 15(6), 5082; https://doi.org/10.3390/su15065082
Submission received: 24 January 2023 / Revised: 8 March 2023 / Accepted: 8 March 2023 / Published: 13 March 2023
(This article belongs to the Special Issue Advances in Ecosystem Services and Urban Sustainability)

Abstract

:
As an essential part of ecosystem services, the rural ecosystem service (rES) plays an irreplaceable role in sustainable development. However, research on rESs still needs improvement compared with urban ecosystem services. Aiming at analyzing the research and development trends in rES, three types of bibliometric analysis software, HistCite, VOSviewer, and CiteSpace, are applied to reveal and visualize the research status and the prospect of existing research. The results show that since 2015, there has been a significant increase in the number of countries, papers, and institutions studying rES. There are five main research areas, among which urbanization and nature’s contribution to people (NCP) are ongoing. Moreover, the research content gradually shifted from fundamental studies on the relationship between biodiversity and ecosystem services to the relationships between different stakeholders and rESs against the background of complex social relations and cultural settings in urbanization. However, there is still a lack of leading ancestor literature in the field, and this field still needs to be developed.

1. Introduction

Human wellbeing is closely related to ecosystem services (ESs). Research on ES function and valuation dates back to the mid-1960s to the early 1970s [1]. Environmental or natural services, described as ES, were originally used to describe the advantages humans can obtain from natural ecosystems. In 1997, Constanza R. [2] further subdivided ES and evaluated the value provided by ecosystem services. Millennium ecosystem assessment (MA) [3] classified the ES into cultural services, supporting services, providing services, and regulating services, which promoted the conception worldwide and made it a vital instrument for sustainability research [4,5].
The increase in global population and the intensification of human activities has accelerated resource depletion, environmental pollution, and biodiversity losses [6]. Approximately 40% of the world’s population currently resides in rural areas [7], which serve as the primary agricultural production hub and supply the urban population with the different agricultural goods required for daily life. As an essential part of the ecosystem, the rural ecosystem has a unique value. It provides numerous indispensable ES for urban and rural residents, which include agricultural products, biodiversity conservation, nutrient cycling, climate and gas regulation, water conservation and purification, pollutant control, aesthetic value, and recreation. However, the research progress and concerns regarding rural ES (rES) need to be more evident in academic circles.
As centralized living areas with fast, varying environments and intensive problems due to rapid urbanization and social and economic change, cities are attracting increasing attention regarding their service value for the ecosystem and sustainable development [8]. The value of rES needs to attract more attention. With the increase in urbanization, rural areas are facing a worldwide decline [9]. As a result, more villages are facing severe challenges such as hunger, poverty, land degradation, water shortage, and an aging population [10]. These reduce rural ecosystems’ resilience in coping with environmental changes [11], which will have a direct impact on whether the Sustainable Development Goals can be achieved by 2030. As rES is an essential tool in guiding and constructing the future development model for rural areas, more research in this area is badly needed.
According to the search results of the Web of Science (WOS) core database, almost no reviews on rural ecosystem services have been performed. Jiao YM et al. [12] studied the impact of rural landscapes on biodiversity and ecosystem service functions in Japan, and identified relationships between biodiversity loss, ecosystem services, and human wellbeing. Other scholars summarized the agricultural production value of services provided by rural ecosystems from different perspectives and proposed future agricultural policy-making and research development trends [13,14,15,16,17]. Weninger T. and Acharya R.P. et al. [18,19,20] reviewed the ESs’ value of windbreaks and forests, respectively, in rural areas. They deeply understood the value of such elements in rural ecosystems. In summary, most current reviews focus on a particular type of rES, which primarily provides services including agriculture and some specific element of farmland. Comprehensive reviews of updates in rES developments are still lacking. In addition, most of the current literature reviews involving rES take the data analysis function of WOS as the primary analysis method, and few use different bibliometric software. Based on the WOS core database, this paper attempts to analyze the research and development trends in rES. Combined with three forms of bibliometric software, it reveals the previous development status of rES through an analysis of the time trends, regional trends, and changes in research hotspots; furthermore, it tries to announce the progresses it has achieved and the gap still exists. Based on the above analysis, it is possible to accomplish the following objectives: (1) to reveal the development trend according to publication numbers and subject categories; (2) to outline the distribution patterns according to the activities of countries and organizations; and (3) to look at topical issues and future prospects in the field. Our findings offer thorough details on the development of rES research over the last 30 years, a summary of current trends, and possible areas of further study in this area.

2. Materials and Methods

2.1. Data Collection

This paper focuses on the research progress of rES, and the relevant literature is retrieved and analyzed based on the core set WOS database. In order to ensure the authority and integrity of the data as much as possible, after preliminary retrieval and analysis, the filter criteria of this article are set as follows (Table 1). After that, a total of 3202 pieces of literature were retrieved. Then, the exported literature was imported into CiteSpace to conduct literature cleaning and de-rescreening. Finally, 3000 works from the literature were selected as research objects, and the retrieval time was: 2022.5.16.19:00.

2.2. Analytical Methods

The bibliometric analysis describes, evaluates, and predicts the academic research’s status quo and development trends by quantitatively utilizing mathematical statistics. Applying this method to analyses of the research status quo for rural ecosystem services helps to clarify this field’s research status, hotspots, and development trends. It lays a foundation for later research on rES studies. At present, many kinds of software can process bibliometric analysis, each of which has advantages. HistCite, VOSviewer, and CiteSpace will analyze rESs’ research status and trends in this study.

2.2.1. HistCite

HistCite is a free citation graph analysis software. It can analyze the author, publication year, and other contents and show the sequential relationship between papers in a specific field through topological graphs. This paper will fully use its advantages in analyzing the literature timing to study and organize existing research to explore whether there is groundbreaking literature in this field, thus, to accurately estimate the development state of this field [21].
The parameters of HistCite are set as follows: select by local citation score (LCS), with the count limit of 50.

2.2.2. VOSviewer

VOSviewer is a knowledge mapping software developed by Eck V. and Waltman, at the Science and Technology Research Center of Leiden University in the Netherlands. Its advantage lies in the expression of co-occurrence word clustering and hot-word density. This paper applies VOSviewer to analyze the high frequency word, so as to reveal the hot keywords in rES research [22].
The parameters of VOSviewer are set as follows: the minimum number of keyword occurrences was 30.

2.2.3. CiteSpace

Dr. Chen CM developed CiteSpace from the School of Information Science and Technology of Drexel University in the United States. It has superiority in generating co-citation maps. Therefore, It is used in this review to explore the key literature and conduct a cluster analysis to better reveal the main direction of current studies and the development status of different directions [23].
The version that was used is CiteSpace 5.8.R3, and the parameters of CiteSpace were set as follows: slice length = 1; g = 25.
Although the above software has similar functions, studies have proved that, as long as the database is the same, the results obtained by different types of software can confirm each other. Therefore, these three software will be comprehensively applied to complete this literature review using their respective strengths [24].

2.2.4. Path of Analysis

In this study, the bibliometric analysis method was adopted to discover the trends and prospects of rES studies. First, the key countries that published the literature at different research stages were investigated. Furthermore, HistCite was used to reveal the initial literature at early stages. Then, VOSviewer was applied to demonstrate the high frequency words in the rES field. Finally, CiteSpace was used to analyze the literature further. A total of 578 critical essays were discovered, read, and sorted using the co-citation relationship analysis. The progress in five specific topics was discovered.

3. Results and Discussion

3.1. Evolution of Publications on Rural ES

3.1.1. Temporal Trend

The number of publications can be divided into three stages (Figure 1). Between the years 1991 and 2007, there was stagnation. Then, a slow development stage occurred between 2008 and 2016, during which publications significantly increased and the development speed accelerated compared with the first stage. Furthermore, the third stage entered a phase of rapid development. Since 2015, the number of publications sharply increased, indicating that the popularity of this research field is constantly increasing. In 2005, the widespread use of the Millennium Ecosystem Assessment, which attracted more attention to ES, was the main factor in the first promotion. The Science Policy Platform on Biodiversity and Ecosystem Services (IPBES), established in 2012 by the United Nations Environment Programme (UNEP), took a big step in promoting research on ESs at the global and regional levels, and providing a scientific basis for governments at all levels to carry out ecosystem management. The Transforming Our World: The 2030 Agenda for Sustainable Development, established in 2016, also positively encouraged research on rural ES. Therefore, the investigation of rES was further accelerated and entered a new stage of development.

3.1.2. Nation Distribution

From 1991 to 2007, the top three countries were the USA, Australia, and China, and the USA had a total of 31 research results (Table 2; Figure 2). From 2008 to 2014, the overall research popularity of all countries significantly increased compared with that of the previous stage. England was one of the countries showing burstiness in this stage (burstiness: staged explosive growth), and the top three countries in this stage were the USA, England, and Germany. From 2015 to 2022, China’s research output showed a significant increase and was approaching first place, which was occupied by the USA.
In light of the actual situation, the countries who first put forward the concept of ecosystem services, England and USA, paid more attention to rES than the others. However, since China formally proposed the Rural Revitalization Strategy in 2017, China’s concerns about rES have significantly increased.

3.1.3. Evolution of Publications

In order to reveal the initial literature in the specific field, the top 50 ranked by LCS, were evaluated and visualized by HistCite. Although there were no outstanding papers (high LCS), the map initially presented grouping characteristics, and the characteristics of the academic community gradually emerged (Figure 3). The literature numbered 1–6 are literature with high centrality (Figure 3). The earliest of the top 50 LCS literature was published in 2007, while the earliest prominent representative literature was published in 2008, which complied with the publication popularity stages. Research in the rES field started late and lacked any literature with field leadership. The current research results show prominent grouping characteristics but a weak correlation, which means that the literature in each group is not prominent enough and is still in the preliminary stage of development.

3.2. Research Focus and Trend

3.2.1. Keywords Analysis

The VOSviewer was used to reveal the high frequency keywords. Firstly, the synonyms were replaced and united; then, 23 keywords, such as areas and schemes, were eliminated due to an ambiguous reference of pronouns. Finally, the keywords that appeared at least 30 times were selected to generate the cluster analysis diagram (Figure 4). As can be seen from the table (Table 3), the top five keywords are environmental science and ecology, biodiversity conservation, agriculture and agricultural landscape, and land-use changes. The top five words with the latest average publication year (Table 4) are demand, green infrastructure, cultural ecosystem services, security, and perception. The keywords most discussed are those related to the basic ecologies study, such as environmental sciences and ecology and biodiversity and conservation, or agricultural and forestry, closely related to the providing services of rural areas. The words that emerged recently involve sociology, economics, and other subjects, such as demand, CES, and perception. It can be inferred that the hot topics have undergone a process of multidisciplinary integration based on ecology-related research.

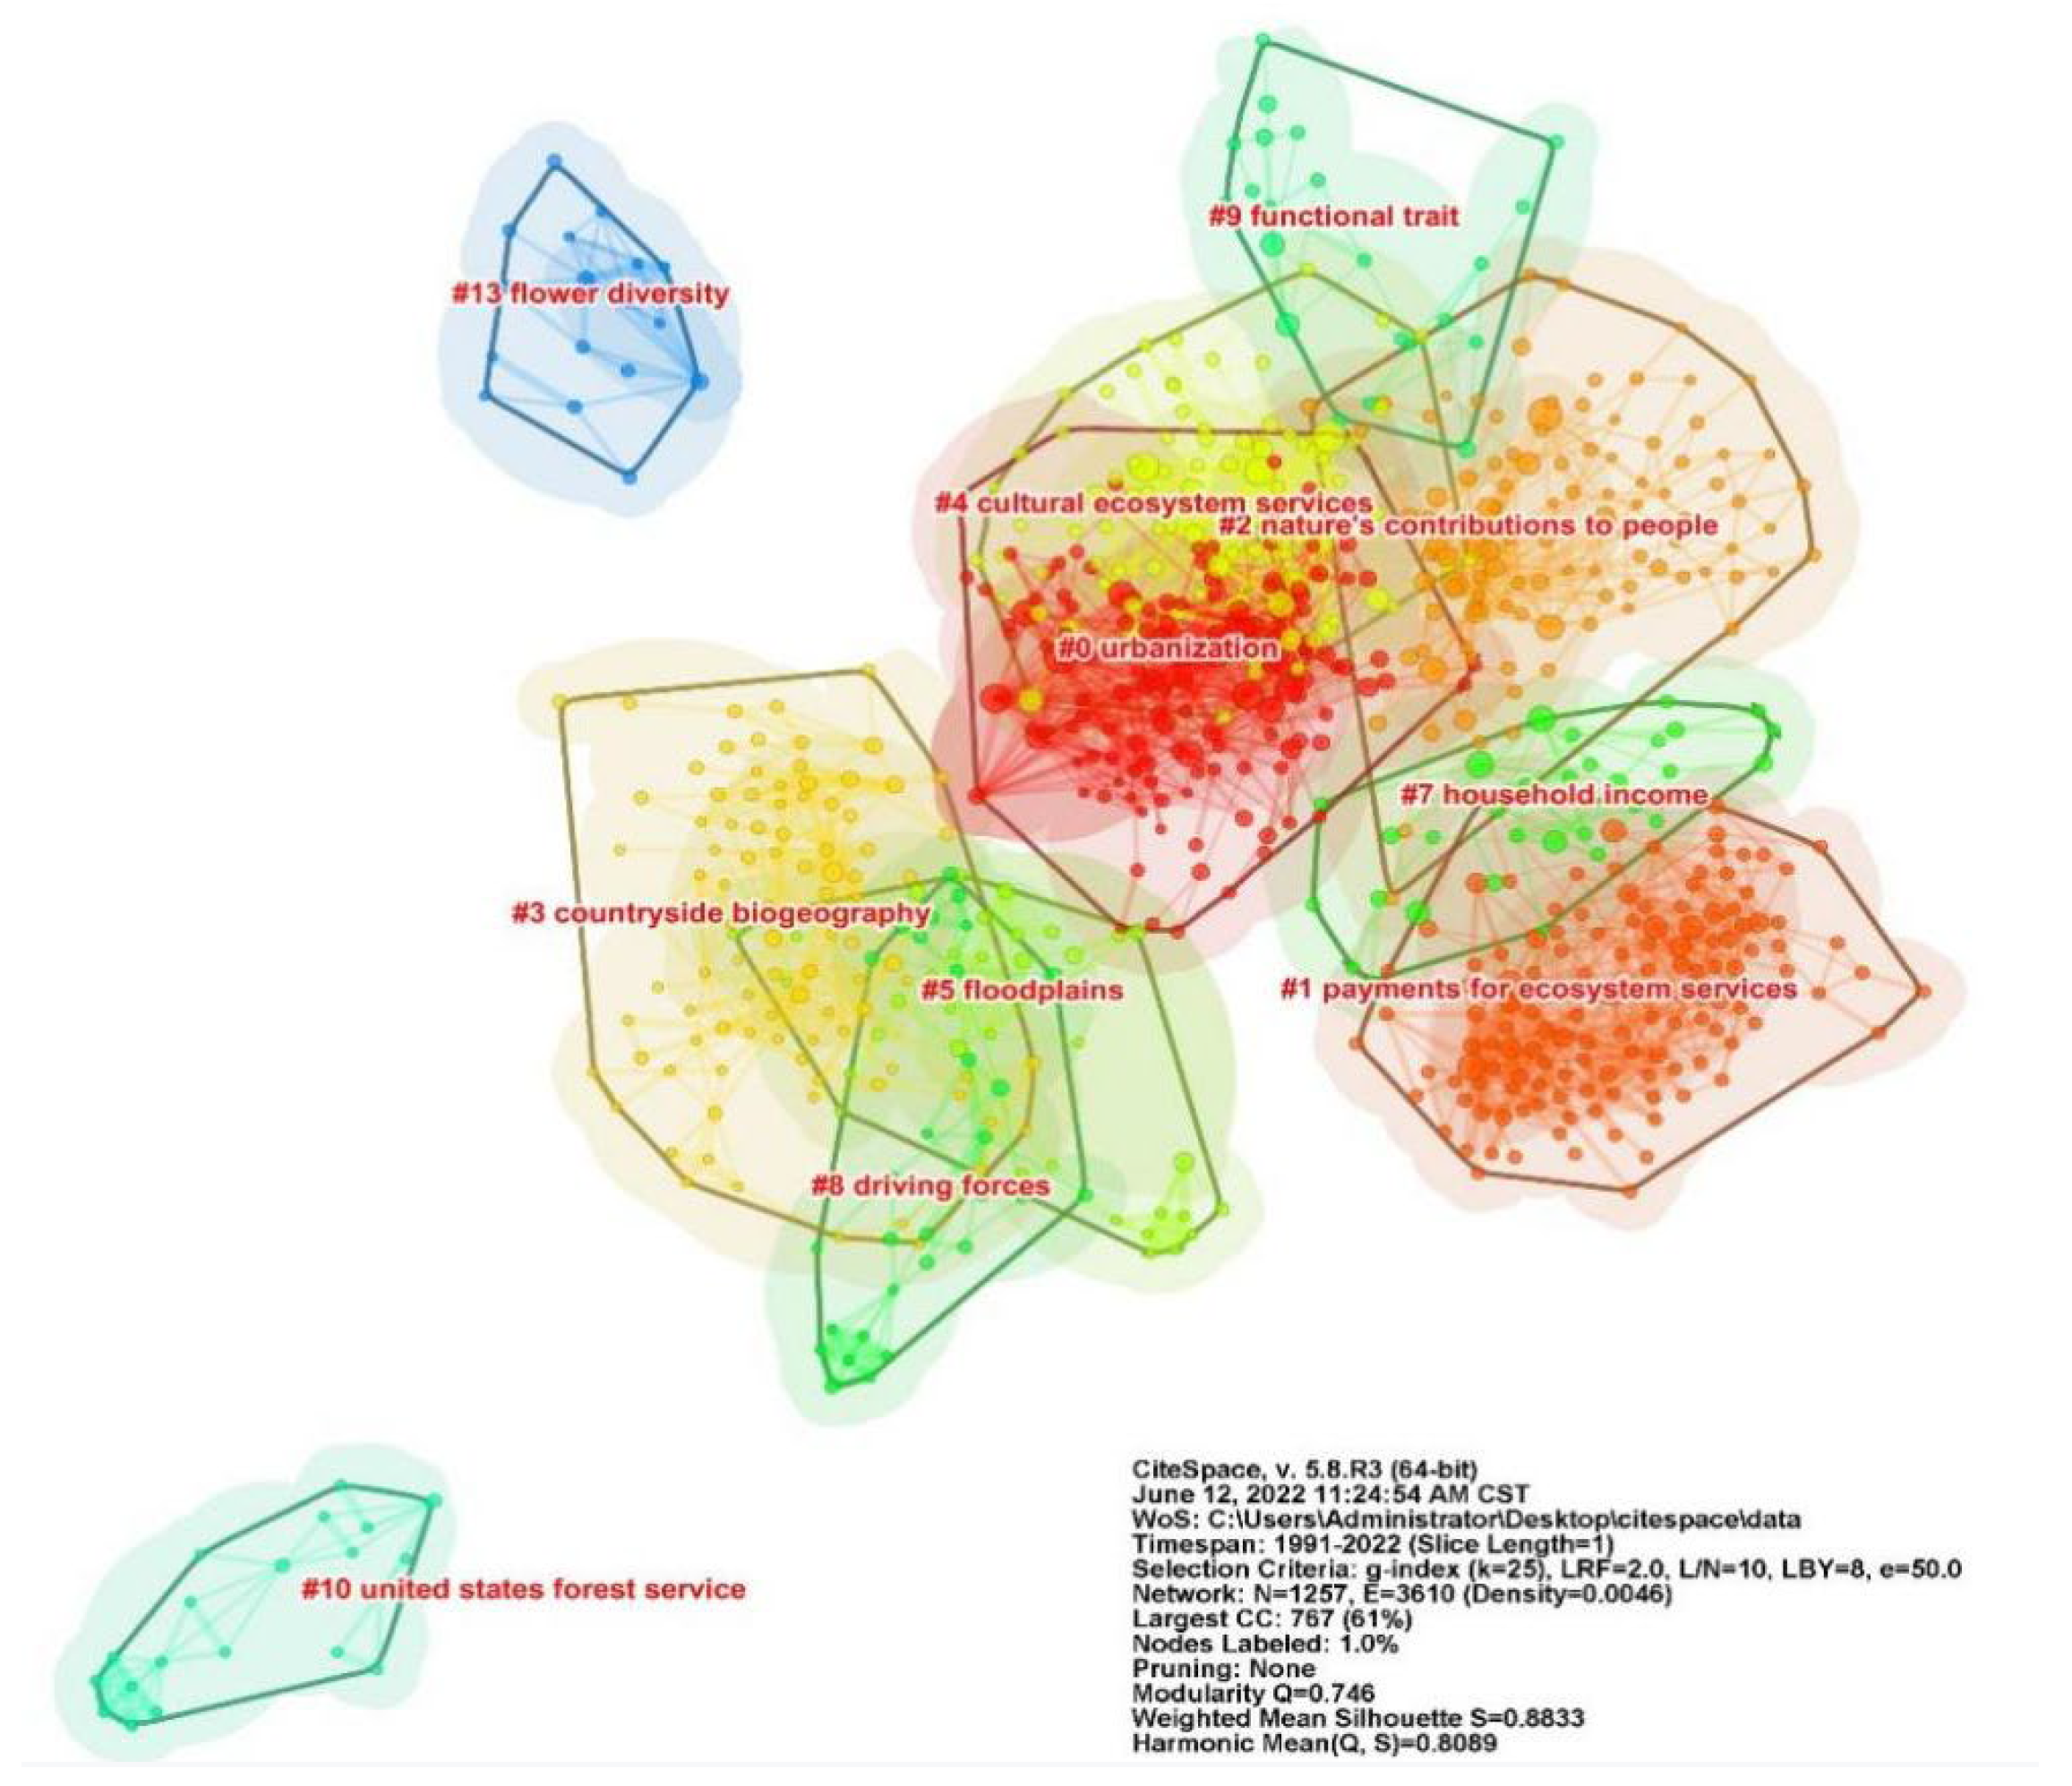
3.2.2. Cluster Analysis of Literature Co-Citation

The literature co-citation relationship diagram and cluster analysis diagram, generated based on the publications from 1991 to 2022 (Figure 5 and Figure 6), are shown in the following. This network contains 1257 reference nodes. A total of 61 cited clusters were obtained using these keywords as classification criteria, among which the most significant five clusters contained 574 nodes, accounting for 46% of all nodes. The modularity of the network is 0.746, and the silhouette is 0.8833, suggesting that the science mapping can clearly show the specialties in the target field. The nodes in each cluster have high unity and high reliability in clustering division [23].
In the co-citation network (Figure 5), the colors ranging from light to dark represent the citation years for the literature, from latest to earliest. The node with red annual rings represents the literature with high centrality (no less than 0.1), which is a crucial hub connecting two fields and the vital literature among the objects of analysis (Table 5). Centrality is used to discover and evaluate the importance of the literature [23].
To illustrate the changes in research topics and progress, the timeline view (Figure 7) was visualized based on the cluster map. From left to right, each horizontal axis shows the time, from latest to earliest. The three references with the most citations within a given year are marked below the time axis, and the most cited references are labeled in the lowest position. The most significant five clusters (Table 6 and Table 7) represent 46% of all nodes. Subject #3, countryside biogeography, was the first subject that appeared, and lasted from 1999 to 2015. Then came #1, payments for ecosystem services (PES), and #4, cultural ecosystem services, with a duration from 2002 to 2020 and from 2003 to 2019, respectively, indicating that interest has gradually shifted from rural ecosystem protection to derivative rES research, such as rES value and cultural ecosystem services. The last one is #2, nature’s contributions to people (NCP), which benefited from the introduction and establishment of IPBES. In the above clusters, #0 and #2 constantly remain, representing the fields that still attract attention. This paper will center around the largest five clusters.

3.3. Research Progress in Major Specialties

Next, this paper will elaborate on the research progress of the five maximum clusters obtained from the analysis that is co-cited in the final section (Table 7).

3.3.1. Urbanization

In rapid urbanization, ES trade-offs are the direct inducement of environmental problems. In a high-providing services area, the loss of regulating and cultural services may undermine the sustainability of rES. Although the transformation of rural land-use type from wildness to single-function agricultural land can result in short-term economic benefits to particular groups, this will sacrifice the long-term wellbeing of most people. Therefore, it is necessary to thoroughly evaluate the relationship between ecosystem management and the provision of ESs, as well as the relationship between different management statuses regarding ecosystem services and the possible threshold [33], when making land-use-function planning decisions.
Nelson E. [35] proposed a model of spatial dominance based on the ecological production function and economic valuation method, which provided an essential theory for evaluating and realizing ecosystem service values. Based on GIS, a commonly used ES mapping method, two new methods, place-based mapping (PPGIS) and participatory mapping of ecosystem services (PGIS), were developed [36]. Subsequently, GIS was applied as a coupled study with ecosystem assessment models such as InVEST [37,38], Ca-Markov [39,40,41], CLUE-S [42,43], cellular automata (CA) [44], etc., to study and map urban-rural ES trade-offs. Now that various indicators are applied in studies, problems such as poor comparability, low accuracy, and the incomplete single-indicator system still need improvement [45,46]. Therefore, coupling multiple models and ES mapping can improve the spatiotemporal dynamic evolution and simulation prediction of rES, which is of great significance for the collaborative management of ecological security and sustainable social and economic development [47,48]. In addition, the developed areas attract more attention in existing studies, leading to a certain lag in resolving spatial conflicts during urbanization. So, the concern of the area to be developed can better guide the formulation of future urban and rural development policies.

3.3.2. Payments for Ecosystem Services

PES theory believes that market failure is the root cause of ecosystem destruction. Based on the balance between users and defenders of the environment, PES projects achieve a win-win situation of ecological protection and poverty reduction.
As potential providers of ecosystem services, low-income groups in rural areas are vital in promoting sustainable development and the rational utilization of ESs. In some programs, “pro-poor filters” were introduced to improve the equity in poverty reduction [49], which includes the application of a cap on land-registered acreage as a poverty criterion in prioritization models [50], a decrease of payments as the registered area increases [51,52], or by changing the payment method to promote the implementation of the PES project. Studies have proven that the PES projects at regional and community scales can better achieve the expected effect, as communities can better identify with actors and intermediaries, and costs and benefits can be jointly monitored [53,54]. PES projects with in-kind donations have a higher success rate than projects paid only in cash or with a combination of cash and goods donations [55]. Programs paid for by resource users tend to be more successful than those paid for by governments.
While widely sought after, only 16% of PES projects have achieved both environmental protection and poverty reduction goals. Firstly, a lack of an effective feedback path leads to the failure of timely project adjustment [56]. Secondly, besides the land use methods, many impacts such as the environment and climate change will have unpredictable impacts on the results [57]. Thirdly, different regional backgrounds and diverse stakeholders make PES valuation difficult [58]. Finally, it is not easy to ensure that the effects can be sustained after the end of a project [59]. Therefore, the subsequent research will focus more on the topics above [60].

3.3.3. Nature’s Contribution to People

The NCP framework describes the social and economic system’s characteristics better than the initial ES framework [61]. It illustrates how humans and nature work together and highlights the relevance of their socio-cultural relationship, which has both positive and destructive impacts [62]. As a result, NCP is linked to relational values derived through our interactions with and obligations to nature but does not directly derive from nature [63]. Currently, many resource-based rural communities are enduring substantial outmigration, and the existence of previous social relations will continuously promote the rural environment’s protection [64]. The rural poor, who live directly on rES, are always highly vulnerable to natural or contrived variations that affect their livelihood and resources, or the ESs’ ability to monitor the livability of settlements [65]. A traditional production activity is not just a job but a unique lifestyle and social identity for farmers [66,67,68]. Hence, it is unhelpful to admonish or pressure them to abandon their traditional mode of production. Wellbeing losses add challenges to their lifestyle and lead to a sense of injustice, resulting in conservation policy failure [68]. In these circumstances, considering heterogeneity in living habits is essential. However, this cannot be addressed by referring to scientific evidence but by permitting or enabling open negotiation processes between the value systems [65].
To reveal the relationship between rES and human wellbeing, socio-cultural mapping and photo voice method are used to get more stakeholders involved. To ensure the evaluation method is in line with the value systems of all stakeholders, their preferences, interests, perceptions of nature, and ideas for future generations’ heritage should be taken into account. Multiple valuations should also be applied to construct NCP evaluation frameworks with different cultural backgrounds [61]. Besides, the multiple values of NCP need to be quantified further and monitored systematically. The existing method is mainly conducted from the perspective of biophysical values. However, the socio-cultural perspective can help the evaluation of spatial synergies, trade-offs, and ES bundling to improve the evaluation index system of NCP [69,70,71]. Though the foundation of NCP evaluation has been laid on abundant research of rES, improving the framework and basic principles of NCP still requires sufficient scenario simulation research. In addition, NCP has provided a new perspective for other directions in this field.

3.3.4. Countryside Biogeography

Whether and how rural biodiversity has an impact on rES is critical on this topic at the early stage. Combined with rural biogeography, many scholars have investigated these topics from the perspectives of different species [72,73,74,75]. Studies have shown that tillage patterns are related to the decline in farmland biodiversity, and agricultural intensification is the main reason for biodiversity losses [73,76]. Thus, the key to improving biodiversity is to increase farmland heterogeneity.
As the basis of rES, scholars define the balance between agriculture and biodiversity as the trade-off between different agricultural models. Some researchers argued that land-saving farming allows for higher yields in smaller areas, thereby preserving nearby species-richness. Wildlife-friendly farmland tends to have lower yields per unit area and wastes land instead [72,77,78]. Then, Letourneau D.K. and Oerke E.C. et al. [78,79] provided evidence that varied agroecosystems have more natural enemies, fewer herbivores, and less insect damage than diversified cropping systems. Eco-agriculture has more non-provisioning ES than traditional agriculture [80,81]. High natural value farmland is widely practiced in Europe because it helps maintain habitats and populations of wildlife species with the highest conservation value [82,83]. The debate on the advantages and disadvantages of different agricultural models will continue. Although a high level of biodiversity is good for the sustainability of rES, finding a general approach to improve farmland ecosystem services and preserve biodiversity simultaneously is difficult. First, the connectivity-based threshold of various habitats at different scales needs more research; secondly, the emphasis on rESs varies between different groups due to their varied understanding of beneficial ESs [84]. In addition, it will be a challenge to quantify the overlapping space of different agricultural types. Perhaps the trade-offs and synergies between ES and disservices can better reveal the impact of different types on rES [85].

3.3.5. Cultural Ecosystem Services

Aesthetics has always been mentioned as a part of cultural ecosystem services (CES) [86]. During urbanization, the aesthetic value of nature becomes more and more prominent, while the importance of functional representation rapidly declines. At the same time, agriculture’s physical and economic importance is declining, while the value of the leisure industry is increasing [87]. Studies on landscape aesthetics looked at landscape contexts from the perspective of varied cultural and stakeholder groups, including urban, agricultural, and even wilderness environments. Individuals, demographics, nationalities, and other groups have different aesthetic preferences, particularly in environments with strong cultural influences [26,88,89]. Compared with urban residents, the rural population has a more comprehensive and direct understanding of ESs because their wellbeing is more closely related to ESs. In contrast, the urban population perceives CES better (tourism, aesthetics, environmental education, etc.) than other ESs [90]. Moreover, a number of studies have revealed that individuals generally favor heterogeneous landscapes, underscoring the significance of spatial patterns in sociocultural values [91,92,93].
Benefiting from the demand increase of urban residents for outdoor recreation, rural tourism, and environmental education [94,95], the tertiary industry was pushed as a form of revenue diversification in underdeveloped areas [96]. One way to assess CES for agriculture is to evaluate the payments for recreational activities, such as wildlife viewing, hunting, and fishing [97]. The socio-cultural valuation is a commonly used evaluation technique with high sensitivity in detecting the cognitive preferences of stakeholder groups [98]. Many research studies show that the farming lifestyle represents more than just economic value, but also shapes cultural heritage, identity, and sense of place, becoming an essential part of CES [61,99]. Therefore, CES should be evaluated from the regional perspective because the demand and comprehension of CES varies from place to place, and the way of measuring the entertainment revenues is not applicable to all places [100]. With the advent of the big data era, research based on remote sensing and social network has provided a new path with relatively high precision for CES supply-demand assessment and land management [101]. In the future, the evaluation research based on supply (service potential), demand (social demand), and flow (actual use of service beneficiaries) will become the focus. The post-pandemic era will likely create greater demand for cultural services, especially in natural and remote areas [102]. To avoid conflicts with other types of ES, reinforcing the connection between different stakeholders is essential [103].

4. Conclusions

The research on rES has entered a relatively rapid development stage; however, the lacking of a leading literature represents that research has not reached the mature stage, and further research and practices are urgently needed. Countryside biogeography provides the foundation for the development of other hot fields (Figure 8). Based on this, the subject has developed from natural science to a multi-disciplinary integration. Furthermore, the research field has changed from macro-biodiversity conservation to more detailed aspects, such as agriculture, poverty reduction, and CES. As an innovative method of economic intervention, PES is the hub and bridge of urbanization and NCP (Figure 8), which can reduce or offset the loss of global biodiversity and ecosystem functions in rural development and provide an effective method for measuring and evaluating the value of rES. As a relatively new topic, NCP will provide a new perspective for other research fields.
In the future, the coupling of multiple models and ES mapping can improve the spatiotemporal dynamic evolution and simulation prediction of rES, which is of great significance for the collaborative management of ecological security and sustainable social and economic development. However, the model constraints need to be optimized based on the status of social and economic development to promote the disclosure of the internal mechanism and interaction between different types of rES trade-offs, both between urban and rural areas and among rural areas. Strengthening the research on the relationship between rES stakeholders and supply-demand relationships will promote the formulation of PES project prediction, feedback, and implementation mechanism more effectively. As a new concept proposed by IPBES, the current NCP research is still at the macro-level. Due to the need for a better understanding of the rural indigenous and local knowledge, and the lack of comprehensive scenario simulation studies, the multiple values of rural NCP need to be further quantified and comprehensively monitored. The driving factor of the constant change of the rES system lies in the balance and game between different kinds of ES. The concern on a particular type of ES is periodical, and the ultimate goal is to clarify the relationship between different ES and achieve coordinated development. The reintegration of multiple disciplines will become the final destination of this field. Future in-depth research on rES should be conducted based on the above research to obtain more fruitful achievements.

Author Contributions

Conceptualization, Y.S. and B.G.; methodology, B.G.; software, B.G. and C.W.; validation, Y.S., B.G. and C.W.; formal analysis, Y.S.; investigation, B.G.; resources, B.G. and C.W.; data curation, B.G.; writing—original draft preparation, B.G. and C.W.; writing—review and editing, Y.S. and B.G.; visualization, B.G. and C.W.; supervision, Y.S. and B.G.; project administration, Y.S.; funding acquisition, Y.S. All authors have read and agreed to the published version of the manuscript.

Funding

This research was funded by the Yunnan Provincial High Level Talent Training and Support Plan, ‘Industrial Technology Leading Talent Project’, grant number YNWR-CYJS-2020-022; the Scientific and Technological Innovation Team of Yunnan Colleges and Universities for Ethnic Landscape and Beautiful Countryside; and the National Natural Science Foundation of China, grant number 51968064.

Institutional Review Board Statement

Not applicable.

Informed Consent Statement

Not applicable.

Data Availability Statement

The data presented in this study are available on request from the corresponding author.

Acknowledgments

The authors would like to acknowledge all colleagues and friends who have voluntarily reviewed the translation of the survey and the manuscript of this study.

Conflicts of Interest

The authors declare no conflict of interest.

References

  1. De Groot, R.S.; Wilson, M.A.; Boumans, R.M.J. A typology for the classification, description and valuation of ecosystem functions, goods and services. Ecol. Econ. 2002, 41, 393–408. [Google Scholar] [CrossRef] [Green Version]
  2. Costanza, R.; d’Arge, R.; De Groot, R.; Farber, S.; Grasso, M.; Hannon, B.; Van Den Belt, M. The value of the world’s ecosystem services and natural capital. Nature 1997, 387, 253–260. [Google Scholar] [CrossRef]
  3. Leemans, R.; De Groot, R.S. Millennium Ecosystem Assessment Ecosystems and Human Well-Being, Synthesis: A Report of the Millennium Ecosystem Assessment; Island Press: Washington, DC, USA, 2005. [Google Scholar]
  4. Kumar, P. The Economics of Ecosystems and Biodiversity: Ecological and Economic Foundations; Routledge: London, UK, 2011. [Google Scholar]
  5. Wu, J. Urban ecology and sustainability: The state-of-the-science and future directions. Landsc. Urban Plan. 2014, 125, 209–221. [Google Scholar] [CrossRef]
  6. William, T.L. The earth as transformed by human action: Global and regional changes in the biosphere over the past 300 years. Glob. Environ. Change 1992, 2, 71–72. [Google Scholar]
  7. United Nations, Department of International Economic and Social Affairs. World Urbanization Prospects The 2018 Revision; United Nations, Department of International Economic and Social Affairs: New York, NY, USA, 2019. [Google Scholar]
  8. Munoz, A.M.M.; Freitas, S.R. Importance of ecosystem services in cities: Review of publications from 2003 to 2015. Rev. Gest. Ambient. Sustentabilidade Geas 2017, 6, 89–104. [Google Scholar]
  9. Liu, Y.S.; Li, Y.H. Revitalize the world’s countryside. Nature 2017, 548, 275–277. [Google Scholar] [CrossRef] [Green Version]
  10. Burholt, V.; Dobbs, C. Research on rural ageing: Where have we got to and where are we going in Europe? J. Rural Stud. 2012, 28, 432–446. [Google Scholar] [CrossRef] [Green Version]
  11. Li, Y.; Yan, J.; Liu, Y. The cognition and path analysis of rural revitalization theory based on rural resilience. Acta Geogr.Sin. 2019, 74, 2001–2010. [Google Scholar]
  12. Jiao, Y.; Ding, Y.; Zha, Z.; Okuro, T. Crises of Biodiversity and Ecosystem Services in Satoyama Landscape of Japan: A Review on the Role of Management. Sustainability 2019, 11, 454. [Google Scholar] [CrossRef] [Green Version]
  13. Torralba, M.; Fagerholm, N.; Burgess, P.J.; Moreno, G.; Plieninger, T. Do European agroforestry systems enhance biodiversity and ecosystem services? A meta-analysis. Agric. Ecosyst. Environ. 2016, 230, 150–161. [Google Scholar] [CrossRef] [Green Version]
  14. Nieto-Romero, M.; Oteros-Rozas, E.; González, J.A.; Martín-López, B. Exploring the knowledge landscape of ecosystem services assessments in Mediterranean agroecosystems: Insights for future research. Environ. Sci. Policy 2014, 37, 121–133. [Google Scholar] [CrossRef]
  15. Awasthi, A.; Singh, K.; Singh, R.P. A concept of diverse perennial cropping systems for integrated bioenergy production and ecological restoration of marginal lands in India. Ecol. Eng. 2017, 105, 58–65. [Google Scholar] [CrossRef]
  16. Maier, C.; Hebermehl, W.; Grossmann, C.M.; Loft, L.; Mann, C.; Hernández-Morcillo, M. Innovations for securing forest ecosystem service provision in Europe—A systematic literature review. Ecosyst. Serv. 2021, 52, 101374. [Google Scholar] [CrossRef]
  17. Singh, S.P.; Singh, V. Addressing rural decline by valuing agricultural ecosystem services and treating food production as a social contribution. Trop.Ecol. 2016, 57, 381–392. [Google Scholar]
  18. Weninger, T.; Scheper, S.; Lackóová, L.; Kitzler, B.; Gartner, K.; King, N.W.; Cornelis, W.M.; Strauss, P.; Michel, K. Ecosystem services of tree windbreaks in rural landscapes—A systematic review. Environ. Res. Lett. 2021, 16, 103002. [Google Scholar] [CrossRef]
  19. Acharya, R.P.; Maraseni, T.; Cockfield, G. Global trend of forest ecosystem services valuation—An analysis of publications. Ecosyst. Serv. 2019, 39. [Google Scholar] [CrossRef]
  20. Adams, C.; Rodrigues, S.T.; Calmon, M.; Kumar, C. Impacts of large-scale forest restoration on socioeconomic status and local livelihoods: What we know and do not know. Biotropica 2016, 48, 731–744. [Google Scholar] [CrossRef]
  21. Zhang, Y. HistCite: A Brand New Tool for Scientific Document AnalysisHistCite. Chin. J. Sci. Tech. Period. 2007, 18, 1096. [Google Scholar]
  22. Van Eck, N.J.; Waltman, L. Software survey: VOSviewer, a computer program for bibliometric mapping. Scientometrics 2010, 84, 523–538. [Google Scholar] [CrossRef] [Green Version]
  23. Chen, C. Science Mapping: A Systematic Review of the Literature. J. Data Inf. Sci. 2017, 2, 1–40. [Google Scholar] [CrossRef] [Green Version]
  24. Wang, Y.; Ma, L.; Liu, Y. Progress and trend analysis of urbanization research: Visualized quantitative study based on CiteSpace and HistCite. Prog. Geogr. 2018, 37, 239–254. [Google Scholar]
  25. Raudsepp-Hearne, C.; Peterson, G.; Bennett, E. Ecosystem service bundles for analyzing tradeoffs in diverse landscapes. Proc. Natl. Acad. Sci. USA 2010, 107, 5242–5247. [Google Scholar] [CrossRef] [PubMed] [Green Version]
  26. Martín-López, B.; Iniesta-Arandia, I.; García-Llorente, M.; Palomo, I.; Casado-Arzuaga, I.; Amo, D.G.D.; Gómez-Baggethun, E.; Oteros-Rozas, E.; Palacios-Agundez, I.; Willaarts, B.; et al. Uncovering Ecosystem Service Bundles through Social Preferences. PLoS ONE 2012, 7, 11. [Google Scholar] [CrossRef] [PubMed] [Green Version]
  27. Plieninger, T.; Dijks, S.; Oteros-Rozas, E.; Bieling, C. Assessing, mapping, and quantifying cultural ecosystem services at community level. Land Use Policy 2013, 33, 118–129. [Google Scholar] [CrossRef] [Green Version]
  28. Daniel, T.C.; Muhar, A.; Arnberger, A.; Aznar, O.; Boyd, J.W.; Chan, K.M.; Costanza, R.; Elmqvist, T.; Flint, C.G.; Gobster, P.H.; et al. Contributions of cultural services to the ecosystem services agenda. Proc. Natl. Acad. Sci. USA 2012, 109, 8812–8819. [Google Scholar] [CrossRef] [Green Version]
  29. Muradian, R.; Corbera, E.; Pascual, U.; Kosoy, N.; May, P.H. Reconciling theory and practice: An alternative conceptual framework for understanding payments for environmental services. Ecol. Econ. 2010, 69, 1202–1208. [Google Scholar] [CrossRef]
  30. Fagerholm, N.; Käyhkö, N.; Ndumbaro, F.; Khamis, M. Community stakeholders’ knowledge in landscape assessments-Mapping indicators for landscape services. Ecol. Indicat. 2012, 18, 421–433. [Google Scholar] [CrossRef]
  31. Fisher, B.; Turner, R.; Morling, P. Defining and classifying ecosystem services for decision making. Ecol. Econ. 2009, 68, 643–653. [Google Scholar] [CrossRef] [Green Version]
  32. Milcu, A.I.; Hanspach, J.; Abson, D.; Fischer, J. Cultural Ecosystem Services: A Literature Review and Prospects for Future Research. Ecol. Soc. 2013, 18, 34. [Google Scholar] [CrossRef] [Green Version]
  33. De Groot, R.S.; Alkemade, R.; Braat, L.; Hein, L.; Willemen, L. Challenges in integrating the concept of ecosystem services and values in landscape planning, management and decision making. Ecol. Complex. 2010, 7, 260–272. [Google Scholar] [CrossRef]
  34. Chan, K.M.; Guerry, A.D.; Balvanera, P.; Klain, S.; Satterfield, T.; Basurto, X.; Bostrom, A.; Chuenpagdee, R.; Gould, R.; Halpern, B.S.; et al. Where are Cultural and Social in Ecosystem Services? A Framework for Constructive Engagement. Bioscience 2012, 62, 744–756. [Google Scholar]
  35. Nelson, E.; Mendoza, G.; Regetz, J.; Polasky, S.; Tallis, H.; Cameron, D.; Shaw, M. Modeling multiple ecosystem services, biodiversity conservation, commodity production, and tradeoffs at landscape scales. Front. Ecol. Environ. 2009, 7, 4–11. [Google Scholar] [CrossRef]
  36. Brown, G.; Fagerholm, N. Empirical PPGIS/PGIS mapping of ecosystem services: A review and evaluation. Ecosyst. Serv. 2015, 13, 119–133. [Google Scholar] [CrossRef]
  37. Wich, S.A.; Gaveau, D.; Abram, N.; Ancrenaz, M.; Baccini, A.; Brend, S.; Meijaard, E. Understanding the Impacts of Land-Use Policies on a Threatened Species: Is There a Future for the Bornean Orangutan? PloS ONE 2012, 7, 10. [Google Scholar] [CrossRef] [PubMed] [Green Version]
  38. Li, X.; Zhang, H.; Zhang, Z.; Feng, J.; Liu, K.; Hua, Y.; Pang, Q. Spatiotemporal Changes in Ecosystem Services along a Urban-Rural-Natural Gradient: A Case Study of Xi’an, China. Sustainability 2020, 12, 1133. [Google Scholar] [CrossRef] [Green Version]
  39. Aksoy, H.; Kaptan, S. Monitoring of land use/land cover changes using GIS and CA-Markov modeling techniques: A study in Northern Turkey. Environ. Monit. Assess. 2021, 193, 1–21. [Google Scholar] [CrossRef] [PubMed]
  40. Hoque, M.Z.; Cui, S.; Islam, I.; Xu, L.; Tang, J. Future Impact of Land Use/Land Cover Changes on Ecosystem Services in the Lower Meghna River Estuary, Bangladesh. Sustainability 2020, 12, 2112. [Google Scholar] [CrossRef] [Green Version]
  41. Ren, W.; Zhang, X.; Shi, Y. Evaluation of Ecological Environment Effect of Villages Land Use and Cover Change: A Case Study of Some Villages in Yudian Town, Guangshui City, Hubei Province. Land 2021, 10, 251. [Google Scholar] [CrossRef]
  42. Mamanis, G.; Vrahnakis, M.; Chouvardas, D.; Nasiakou, S.; Kleftoyanni, V. Land Use Demands for the CLUE-S Spatiotemporal Model in an Agroforestry Perspective. Land 2021, 10, 1097. [Google Scholar] [CrossRef]
  43. Liao, G.; He, P.; Gao, X.; Lin, Z.; Huang, C.; Zhou, W.; Deng, L. Land use optimization of rural production-living-ecological space at different scales based on the BP-ANN and CLUE-S models. Ecol.Indic. 2022, 137, 15. [Google Scholar] [CrossRef]
  44. Sun, X.; Crittenden, J.C.; Li, F.; Lu, Z.; Dou, X. Urban expansion simulation and the spatio-temporal changes of ecosystem services, a case study in Atlanta Metropolitan area, USA. Sci. Total. Environ. 2017, 622-623, 974–987. [Google Scholar] [CrossRef] [PubMed]
  45. Burkhard, B.; Kroll, F.; Nedkov, S.; Müller, F. Mapping ecosystem service supply, demand and budgets. Ecol. Indic. 2012, 21, 17–29. [Google Scholar] [CrossRef]
  46. Chen, J.; Jiang, B.; Bai, Y.; Xu, X.; Alatalo, J.M. Quantifying ecosystem services supply and demand shortfalls and mismatches for management optimisation. Sci. Total. Environ. 2019, 650, 1426–1439. [Google Scholar] [CrossRef] [PubMed]
  47. Zhang, P.; Liu, L.; Yang, L.; Zhao, J.; Li, Y.; Qi, Y.; Ma, X.; Cao, L. Exploring the response of ecosystem service value to land use changes under multiple scenarios coupling a mixed-cell cellular automata model and system dynamics model in Xi’an, China. Ecol. Indic. 2023, 147, 110009. [Google Scholar] [CrossRef]
  48. Hou, L.; Wu, F.; Xie, X. The spatial characteristics and relationships between landscape pattern and ecosystem service value along an urban-rural gradient in Xi’an city, China. Ecol. Indic. 2020, 108, 105720. [Google Scholar] [CrossRef]
  49. Wunder, S. Payments for environmental services and the poor: Concepts and preliminary evidence. Environ. Dev. Econ. 2008, 13, 279–297. [Google Scholar] [CrossRef]
  50. Luck, G.W.; Chan, K.M.A.; Fay, J.P. Protecting ecosystem services and biodiversity in the world’s watersheds. Conserv. Lett. 2009, 2, 179–188. [Google Scholar] [CrossRef]
  51. De Koning, F.; Aguiñaga, M.; Bravo, M.; Chiu, M.; Lascano, M.; Lozada, T.; Suarez, L. Bridging the gap between forest conservation and poverty alleviation: The Ecuadorian Socio Bosque program. Environ. Sci. Policy 2011, 14, 531–542. [Google Scholar] [CrossRef]
  52. Farley, K.A.; Anderson, W.G.; Bremer, L.L.; Harden, C.P. Compensation for ecosystem services: An evaluation of efforts to achieve conservation and development in Ecuadorian páramo grasslands. Environ. Conserv. 2011, 38, 393–405. [Google Scholar] [CrossRef] [Green Version]
  53. Ina, P. Payments for Environmental Services: Lessons from the Costa Rican PES Programme; University Library of Munich: Munich, Germany, 2013. [Google Scholar]
  54. Grolleau, G.; McCann, L.M. Designing watershed programs to pay farmers for water quality services: Case studies of Munich and New York City. Ecol. Econ. 2012, 76, 87–94. [Google Scholar] [CrossRef]
  55. Clements, T.; John, A.; Nielsen, K.; An, D.; Tan, S.; Milner-Gulland, E. Payments for biodiversity conservation in the context of weak institutions: Comparison of three programs from Cambodia. Ecol. Econ. 2010, 69, 1283–1291. [Google Scholar] [CrossRef]
  56. Bell, A.R.; Benton, T.G.; Droppelmann, K.; Mapemba, L.; Pierson, O.; Ward, P.S. Transformative change through Payments for Ecosystem Services (PES): A conceptual framework and application to conservation agriculture in Malawi. Glob. Sustain. 2018, 1, 8. [Google Scholar] [CrossRef] [Green Version]
  57. Felardo, J.; Lippitt, C.D. Spatial forest valuation: The role of location in determining attitudes toward payment for ecosystem services policies. For. Policy Econ. 2016, 62, 158–167. [Google Scholar] [CrossRef]
  58. Molden, O.; Abrams, J.; Davis, E.J.; Moseley, C. Beyond localism: The micropolitics of local legitimacy in a community-based organization. J. Rural. Stud. 2017, 50, 60–69. [Google Scholar] [CrossRef] [Green Version]
  59. Howell, A. Socio-economic impacts of scaling back a massive payments for ecosystem services programme in China. Nat. Hum. Behav. 2022, 6, 1218–1225. [Google Scholar] [CrossRef] [PubMed]
  60. Qi, Y.; Zhang, T.; Cao, J.; Jin, C.; Chen, T.; Su, Y.; Su, C.; Sannigrahi, S.; Maiti, A.; Tao, S.; et al. Heterogeneity Impacts of Farmers’ Participation in Payment for Ecosystem Services Based on the Collective Action Framework. Land 2022, 11, 2007. [Google Scholar] [CrossRef]
  61. Díaz, S.; Demissew, S.; Carabias, J.; Joly, C.; Lonsdale, M.; Ash, N.; Larigauderie, A.; Adhikari, J.R.; Arico, S.; Báldi, A.; et al. The IPBES Conceptual Framework—connecting nature and people. Curr. Opin. Environ. Sustain. 2014, 14, 1–16. [Google Scholar] [CrossRef] [Green Version]
  62. Díaz, S.; Pascual, U.; Stenseke, M.; Martín-López, B.; Watson, R.T.; Molnár, Z.; Shirayama, Y. Assessing nature’s contributions to people. Science 2018, 359, 270–272. [Google Scholar] [CrossRef] [Green Version]
  63. Pascual, U.; Phelps, J.; Garmendia, E.; Brown, K.; Corbera, E.; Martin, A.; Gomez-Baggethun, E.; Muradian, R. Social Equity Matters in Payments for Ecosystem Services. Bioscience 2014, 64, 1027–1036. [Google Scholar] [CrossRef] [Green Version]
  64. Chan, K.M.; Balvanera, P.; Benessaiah, K.; Chapman, M.; Díaz, S.; Gómez-Baggethun, E.; Turner, N. Why protect nature? Rethinking values and the environment. Proc. Natl. Acad. Sci. USA 2016, 113, 1462–1465. [Google Scholar] [CrossRef] [Green Version]
  65. Coulthard, S.; Johnson, D.; McGregor, J.A. Poverty, sustainability and human wellbeing: A social wellbeing approach to the global fisheries crisis. Glob. Environ. Change 2011, 21, 453–463. [Google Scholar] [CrossRef]
  66. Pollnac, R.B.; Crawford, B.R.; Gorospe, M.L. Discovering factors that influence the success of community-based marine protected areas in the Visayas, Philippines. Ocean Coast. Manag. 2001, 44, 683–710. [Google Scholar] [CrossRef]
  67. Pollnac, R.B.; Poggie, J.J. Happiness, well-being, and psychocultural adaptation to the stresses associated with marine fishing. Hum. Ecol.Rev. 2008, 15, 194–200. [Google Scholar]
  68. Sievanen, L.; Crawford, B.; Pollnac, R.; Lowe, C. Weeding through assumptions of livelihood approaches in ICM: Seaweed farming in the Philippines and Indonesia. Ocean Coast. Manag. 2005, 48, 297–313. [Google Scholar] [CrossRef]
  69. Martín-López, B.; Palomo, I.; García-Llorente, M.; Iniesta-Arandia, I.; Castro, A.J.; Del Amo, D.G.; Gómez-Baggethun, E.; Montes, C. Delineating boundaries of social-ecological systems for landscape planning: A comprehensive spatial approach. Land Use Policy 2017, 66, 90–104. [Google Scholar] [CrossRef]
  70. Plieninger, T.; Torralba, M.; Hartel, T.; Fagerholm, N. Perceived ecosystem services synergies, trade-offs, and bundles in European high nature value farming landscapes. Landsc. Ecol. 2019, 34, 1565–1581. [Google Scholar] [CrossRef]
  71. Green, R.E.; Cornell, S.J.; Scharlemann, J.P.W.; Balmford, A. Farming and the Fate of Wild Nature. Science 2005, 307, 550–555. [Google Scholar] [CrossRef] [Green Version]
  72. Kremen, C.; Williams, N.M.; Bugg, R.L.; Fay, J.P.; Thorp, R.W. The area requirements of an ecosystem service: Crop pollination by native bee communities in California. Ecol. Lett. 2004, 7, 1109–1119. [Google Scholar] [CrossRef]
  73. Tscharntke, T.; Klein, A.M.; Kruess, A.; Steffan-Dewenter, I.; Thies, C. Landscape perspectives on agricultural intensification and biodiversity—Ecosystem service management. Ecol. Lett. 2005, 8, 857–874. [Google Scholar] [CrossRef]
  74. Westphal, C.; Steffan-Dewenter, I.; Tscharntke, T. Mass flowering crops enhance pollinator densities at a landscape scale. Ecol. Lett. 2003, 6, 961–965. [Google Scholar] [CrossRef]
  75. Matson, P.A.; Parton, W.J.; Power, A.G.; Swift, M.J. Agricultural Intensification and Ecosystem Properties. Science 1997, 277, 504–509. [Google Scholar] [CrossRef] [PubMed] [Green Version]
  76. Swift, M.J.; Izac, A.M.N.; van Noordwijk, M. Biodiversity and ecosystem services in agricultural landscapes—Are we asking the right questions? Agric. Ecosyst.Environ. 2004, 104, 113–134. [Google Scholar] [CrossRef]
  77. Eggleton, P.; Vanbergen, A.J.; Jones, D.T.; Lambert, M.C.; Rockett, C.; Hammond, P.M.; Beccaloni, J.; Marriott, D.; Ross, E.; Giusti, A. Assemblages of soil macrofauna across a Scottish land-use intensification gradient: Influences of habitat quality, heterogeneity and area. J. Appl. Ecol. 2005, 42, 1153–1164. [Google Scholar] [CrossRef]
  78. Perfecto, I.; Vandermeer, J.; Mas, A.; Pinto, L.S. Biodiversity, yield, and shade coffee certification. Ecol. Econ. 2005, 54, 435–446. [Google Scholar] [CrossRef]
  79. Tscharntke, T.; Clough, Y.; Wanger, T.C.; Jackson, L.; Motzke, I.; Perfecto, I.; Vandermeer, J.; Whitbread, A. Global food security, biodiversity conservation and the future of agricultural intensification. Biol. Conserv. 2012, 151, 53–59. [Google Scholar] [CrossRef]
  80. Stavi, I.; Bel, G.; Zaady, E. Soil functions and ecosystem services in conventional, conservation, and integrated agricultural systems. A review. Agron. Sustain. Dev. 2016, 36, 32. [Google Scholar] [CrossRef] [Green Version]
  81. Palomo-Campesino, S.; González, J.A.; García-Llorente, M. Exploring the Connections between Agroecological Practices and Ecosystem Services: A Systematic Literature Review. Sustainability 2018, 10, 4339. [Google Scholar] [CrossRef] [Green Version]
  82. Henle, K.; Alard, D.; Clitherow, J.; Cobb, P.; Firbank, L.; Kull, T.; McCracken, D.; Moritz, R.F.A.; Niemelä, J.; Rebane, M.; et al. Identifying and managing the conflicts between agriculture and biodiversity conservation in Europe—A review. Agric. Ecosyst. Environ. 2008, 124, 60–71. [Google Scholar] [CrossRef]
  83. Plieninger, T.; Bieling, C. Resilience-Based Perspectives to Guiding High-Nature-Value Farmland through Socioeconomic Change. Ecol. Soc. 2013, 18, 15. [Google Scholar] [CrossRef] [Green Version]
  84. Tiedje, J.M.; Asuming-Brempong, S.; Nüsslein, K.; Marsh, T.L.; Flynn, S.J. Opening the black box of soil microbial diversity. Appl. Soil Ecol. 1999, 13, 109–122. [Google Scholar] [CrossRef]
  85. Therond, O.; Duru, M.; Roger-Estrade, J.; Richard, G. A new analytical framework of farming system and agriculture model diversities. A review. Agron. Sustain. Dev. 2017, 37, 21. [Google Scholar] [CrossRef]
  86. Buijs, A.E.; Pedroli, B.; Luginbühl, Y. From Hiking Through Farmland to Farming in a Leisure Landscape: Changing Social Perceptions of the European Landscape. Landsc. Ecol. 2006, 21, 375–389. [Google Scholar] [CrossRef]
  87. Chan, K.M.; Goldstein, J.; Satterfield, T.; Hannahs, N.; Kikiloi, K.; Naidoo, R.; Woodside, U. Cultural services and non-use values. Nat.Cap. Theory Pract. Mapp. Ecosyst. Serv. 2011, 206–228. [Google Scholar]
  88. Gobster, P.H.; Nassauer, J.I.; Daniel, T.C.; Fry, G. The shared landscape: What does aesthetics have to do with ecology? Landsc. Ecol. 2007, 22, 959–972. [Google Scholar] [CrossRef]
  89. Nassauer, J.I. Culture and changing landscape structure. Landsc. Ecol. 1995, 10, 229–237. [Google Scholar] [CrossRef]
  90. Van Berkel, D.B.; Verburg, P.H. Spatial quantification and valuation of cultural ecosystem services in an agricultural landscape. Ecol. Indic. 2014, 37, 163–174. [Google Scholar] [CrossRef]
  91. Van Zanten, B.T.; Verburg, P.H.; Koetse, M.J.; van Beukering, P.J. Preferences for European agrarian landscapes: A meta-analysis of case studies. Landsc. Urban Plan. 2014, 132, 89–101. [Google Scholar] [CrossRef] [Green Version]
  92. Scholte, S.S.K.; van Teeffelen, A.J.A.; Verburg, P.H. Integrating socio-cultural perspectives into ecosystem service valuation: A review of concepts and methods. Ecol. Econ. 2015, 114, 67–78. [Google Scholar] [CrossRef]
  93. Caraveli, H. A comparative analysis on intensification and extensification in mediterranean agriculture: Dilemmas for LFAs policy. J. Rural. Stud. 2000, 16, 231–242. [Google Scholar] [CrossRef]
  94. Schneiders, A.; Van Daele, T.; Van Landuyt, W.; Van Reeth, W. Biodiversity and ecosystem services: Complementary approaches for ecosystem management? Ecol. Indic. 2012, 21, 123–133. [Google Scholar] [CrossRef]
  95. Oteros-Rozas, E.; Martín-López, B.; González, J.A.; Plieninger, T.; López, C.A.; Montes, C. Socio-cultural valuation of ecosystem services in a transhumance social-ecological network. Reg. Environ. Change 2014, 14, 1269–1289. [Google Scholar] [CrossRef]
  96. Harrison, P.A.; Vandewalle, M.; Sykes, M.T.; Berry, P.M.; Bugter, R.; De Bello, F.; Feld, C.K.; Grandin, U.; Harrington, R.; Haslett, J.R.; et al. Identifying and prioritising services in European terrestrial and freshwater ecosystems. Biodivers. Conserv. 2010, 19, 2791–2821. [Google Scholar] [CrossRef] [Green Version]
  97. Gatzweiler, F.W.; Hagedorn, K. Biodiversity and Cultural Ecosystem Services, in Encyclopedia of Biodiversity, 2nd ed.; Levin, S.A., Ed.; Academic Press: Waltham, MA, USA, 2013; pp. 332–340. [Google Scholar] [CrossRef]
  98. Iniesta-Arandia, I.; García-Llorente, M.; Aguilera, P.A.; Montes, C.; Martín-López, B. Socio-cultural valuation of ecosystem services: Uncovering the links between values, drivers of change, and human well-being. Ecol. Econ. 2014, 108, 36–48. [Google Scholar] [CrossRef]
  99. Fish, R.; Church, A.; Winter, M. Conceptualising cultural ecosystem services: A novel framework for research and critical engagement. Ecosyst. Serv. 2016, 21, 208–217. [Google Scholar] [CrossRef] [Green Version]
  100. Pascua, P.; McMillen, H.; Ticktin, T.; Vaughan, M.; Winter, K.B. Beyond services: A process and framework to incorporate cultural, genealogical, place-based, and indigenous relationships in ecosystem service assessments. Ecosyst. Serv. 2017, 26, 465–475. [Google Scholar] [CrossRef]
  101. Karasov, O.; Heremans, S.; Külvik, M.; Domnich, A.; Burdun, I.; Kull, A.; Helm, A.; Uuemaa, E. Beyond land cover: How integrated remote sensing and social media data analysis facilitates assessment of cultural ecosystem services. Ecosyst. Serv. 2021, 53, 101391. [Google Scholar] [CrossRef]
  102. Sumanapala, D.; Wolf, I.D. Recreational Ecology: A Review of Research and Gap Analysis. Environments 2019, 6, 81. [Google Scholar] [CrossRef] [Green Version]
  103. Winter, T.; Kim, S. Exploring the relationship between tourism and poverty using the capability approach. J. Sustain. Tour. 2020, 29, 1655–1673. [Google Scholar] [CrossRef]
Figure 1. Numbers of publications by year.
Sustainability 15 05082 g001
Figure 2. Geographic distribution of publications at different stages.
Sustainability 15 05082 g002
Figure 3. The top 50 LCS directly cited references’ temporal network by HistCite. (1–6: six high-centrality literature; A–D: four prominent groups).
Sustainability 15 05082 g003
Figure 4. Keywords cluster analysis by VOSviewer.
Sustainability 15 05082 g004
Figure 5. A landscape view of the co-citation network between 1991 and 2022. (LRF = 2, LBY = 8, and e = 50) [23].
Sustainability 15 05082 g005
Figure 6. A landscape view of the co-citation clusters between 1991 and 2022. (LRF = 2, LBY = 8, and e = 50) [23].
Sustainability 15 05082 g006
Figure 7. A timeline view of the largest 11 clusters [23].
Sustainability 15 05082 g007
Figure 8. Relationship flow between five main topics.
Sustainability 15 05082 g008
Table 1. Data retrieval condition applied in WoS.
ItermsFilter Criteria
Topic“ecosystem services “AND” rural”
“ecosystem services “AND” village”
“ecosystem services “AND “countryside”
LanguageEnglish
Literature Type“article “AND” early access”
Table 2. Top 10 most productive countries in rural ES (rES) research, ranked in descending order of publications over three decades.
1991–2007 2008–2014 2015–2022
CountryPublicationsCountryPublicationsCountryPublications
USA31USA159USA454
Australia5England *82China434
China4Germany46England244
England4Australia42Germany219
Sweden4Netherlands38Spain185
South Africa3China38Italy165
Italy3Spain35Australia160
Canada2Canada28Netherlands125
Turkey2France27France120
England2Sweden20Brazil104
Note: * means the country’s publications show a burst at different stages.
Table 3. Top 5 keywords of the highest frequency.
Serial NumberKeywordsTotal Link StrengthOccurrencesAverage Publication Year
1environmental sciences and ecology11,90019832017.1645
2ecosystem services915214652017.6821
3biodiversity and conservation817112742016.9976
4agricultural and agricultural landscape35365522016.9088
5forestry32435262017.124
Table 4. Top 5 keywords of the latest publication year.
Serial NumberKeywordsTotal Link StrengthOccurrencesAverage Publication Year
1demand293372019
2green infrastructure276422018.9762
3cultural ecosystem services603862018.9176
4security230332018.9091
5perception305402018.6667
Table 5. Top 10 references of the highest centrality.
Serial Number CentralityCluster IDReferencesTopic
1570Raudsepp-Hearne C., 2010 [25].Ecosystem service bundles
2544Martin-Lopez B., 2012 [26].Bundling ecosystem services through social preferences
3484Plieninger T., 2013 [27].Assessing, mapping, and quantifying cultural ecosystem services
4444Daniel T.C., 2012 [28].Cultural ecosystem services
5431Muradian R., 2010 [29].Payments for ecosystem services
6430Fagerholm N., 2012 [30].Participatory mapping of culture ecosystem services
7390Fisher B., 2009 [31].Classification of ecosystem services
8394Milcu A.I., 2013 [32].Cultural ecosystem services
9380de Groot R.S., 2010 [33].Valuation of ecosystem services
10384Chan K.M.A., 2012 [34].Cultural ecosystem services and valuation
Table 6. Temporal properties of major clusters.
Cluster IDFromToDurationMedianActivenessTheme
020042020162012+Urbanization
120022018162010Payments for ecosystem services
220092020112014+Nature’s contributions to people
319992015162007Countryside biogeography
420032019162011Culture ecosystem services
51999200892003Floodplains
720052019142012Household income
82003201182007Driving forces
920102020102015+Functional trait
101995200161998United States forest services
132004201282008Flower diversity
Table 7. Detailed information of the largest five clusters.
Cluster IDSizeMean (Year)SilhouetteTop 5 Core Noun Terms in the Cluster
014220120.774urbanization; participatory mapping; mapping; payments for ecosystem services; landscape metrics
113220110.907payments for ecosystem services; payments for ecosystem services; payments for environmental services; pes; ecosystem services
210420150.864nature’s contributions to people; relational values; payments for ecosystem services; ecosystem services; rural landscape
39820050.921countryside biogeography; biodiversity; land-sparing; sustainable intensification; wildlife-friendly farming
49820130.861cultural ecosystem services; aesthetics; social perception; landscape preferences; landscape values
Disclaimer/Publisher’s Note: The statements, opinions and data contained in all publications are solely those of the individual author(s) and contributor(s) and not of MDPI and/or the editor(s). MDPI and/or the editor(s) disclaim responsibility for any injury to people or property resulting from any ideas, methods, instructions or products referred to in the content.

