Assessing the Built Environment’s Reflectivity, Flexibility, Resourcefulness, and Rapidity Resilience Qualities against Climate Change Impacts from the Perspective of Different Stakeholders


Abstract
1. Introduction
1.1. Disaster Preparedness
1.2. Quantifying Resilience
1.3. Resilience Qualities (RQs)
1.4. Objectives
2. Methods and Procedures
2.1. Questionnaire Design


| Question # | Question Type | Issues Tackled/Investigated |
|---|---|---|
| Q 1 | Consent question | General questions to enable the participant to quit participation in the study. |
| Q 5–10 | Demographic questions | These questions enable providing demographic information about the audience. |
| Q 11–12 | Notes | General notes for the participants to understand how questions are designed and linked. |
| Q 13–65 | Group 1 questions | Questions about the four RQs designed for group 1. |
| Q 66–117 | Group 2 questions | Questions about the four RQs designed for group 2. |
| Q 118–167 | Group 3 questions | Questions about the four RQs designed for group 3. |
| Questions, Respondent | Audience and Responses Boundaries | Questions Subject and Indicators Covered |
|---|---|---|
| Q 1–12, All Respondents: Multiple Choice | All respondents. Mandatory questions and notes. | Demographic information to better understand the background characteristics and identity of the participants. Education background, the industry where they work, represented entity, role, and experience; geographical exposure of experience. |
| RQ1 | The respondents’ collective understanding, views, and opinions about leveraging reflectivity (Rf) in the built environment systems and the effort to improve the resilience of urban climate change and natural hazards and foster the coping and adaptation capacities in urban systems and communities from the following audience: | Leveraging reflectivity (Rf) by entities, organizations, institutions, and the public through reacting to disturbances and sharing their views and feedback, they learned from pasts to leverage them to decision-making. The main reflectivity indicators are:
|
| Q 13–30, All Respondents: Multiple Choice |
| |
| Q 66–84, All Respondents: Multiple Choice |
| |
| Q 118–132, All Respondents: Multiple Choice |
| |
| RQ4 | The respondents’ collective understanding, views, and opinions about enhancing the flexibility of built environment systems and the ability to adopt alternative strategies to a climate change crisis and natural hazards. | Enhancing any system’s flexibility (Fx) means adaptability to environmental variations. It significantly connects to adaptability and refers to the capacity for change through emergency planning and preparation in the aftershock of disturbances. The main flexibility indicators are:
|
| Q 31–40, All Respondents: Multiple Choice |
| |
| Q 85–94, All Respondents: Multiple Choice |
| |
| Q 133–143, All Respondents: Multiple Choice |
| |
| RQ5 | The respondents’ collective understanding, views, and opinions about encouraging resourcefulness (Rs) to identify problems, establish priorities, and allocate and mobilize resources. | Resourcefulness (Rs) is the capacity to identify problems; allocate and mobilize resources before, during, and after an event; and establish priorities considering human factors. The main resourcefulness indicators are:
|
| Q 41–55, All Respondents: Multiple Choice |
| |
| Q 95–107, All Respondents: Multiple Choice |
| |
| Q 144–157, All Respondents: Multiple Choice |
| |
| RQ6 | The respondents’ collective understanding, views, and opinions about improving the rapidity of the system to recover from the encountered crisis in a short time, even with some losses. | Rapidity (Rp) is the system’s capacity to bounce back from a crisis, even with some losses. It refers to how quickly responsiveness, adaptation, and recovery activities enable the affected system or facility to recover to its full operational function. The main resourcefulness indicators are:
|
| Q 56–65, All Respondents:Multiple Choice |
| |
| Q 108–117, All Respondents: Multiple Choice |
| |
| Q 158–167, All Respondents: Multiple Choice |
|
| Questions, Respondent, and Type of Statistical Test | Respondent Role | Subjects |
|---|---|---|
| Q 13–65, Decision makers and Planners (mainly Governmental Authorities): Ranking and Multiple Choices. Statistical Test: Relative Importance Index (RII), Pearson’s Chi-Squared, | Group 1: Decision makers and planners understand linking coping and adaptation strategies and actions to climate impacts, integrating climate into existing planning, and adopting forward-looking climate-informed goals. | Description and climate change adaptation arrangement, resilience performance attributes such as the awareness of resilience quality definition and ranking of climate change impacts consequences. Additionally, a description of the influence of decision-making towards improving built environment capacity. Learn from the past to inform future decisions and better recognize changing circumstances. Additionally, how to manage change and not be limited to persistence. The effort being made or to be made to advance the built environment to be more resilient and the level of preparedness in different sectors, including the construction industry. Description of utilizing existing learning from the past strategies and tools and adapting and deploying new methodologies beyond the day-to-day business and the level of awareness of the climate change impacts and risks. They use existing management tools differently and adopt new practices to cope with climate change. Type of management and sustainability plans that are pursued, determining if climate change adaptation plans are integrated into the overall management plan, a potential reflection of the past problems in the new plans. Furthermore, understanding the preparedness of the construction industry for climate change. Additionally, the complexity level in measuring the quality of corrective actions that could occur as a response to a climate change event. The preparedness of the construction industry for climate change and natural hazards. Type and quality of sustainable development actions, determining the role played and influence on the plans toward reduction of climate change impacts and risks. Research description, the complexity level in quantifying climate change impacts, identifying characteristics of resilient urban communities, and increasing climate change preparedness. |
| Q 66–117, Sustainability Professionals and Practitioners, Environmental Managers, Sustainability Engineers, Sustainability Experts, and Senior Sustainability Managers: Ranking and Multiple Choice Statistical Test: Pearson’s Chi-Squared, Relative Importance Index (RII), Cronbach’s Alpha (α), Mann–Whitney U-test. | Group 2: Engineering and sustainability experts and senior managers utilize the sustainable existing management practices and tools and adopt new best practices in different ways to cope with climate changes (short-term) and adapt (long-term). Engineering managers, experts, and professionals are required to ensure resilience traits are prioritized in their work field, specifically in construction projects. The questions reveal the role played in adhering to the minimum requirements that directly contribute to reducing the potential climate change impacts. Additionally, they lead in coordinating processes for the multiple components of BESs, understanding the climate change resilience policy and procedures and statutory requirements, and facilitating the best resilience plan implementation. | |
| Q 118–167, Climate Change Experts, Scientists, Graduate Students, Professors, Scholars, Researchers, etc. Representatives of Society Development Organizations, Sustainability Programs, and Voluntary Firms: Ranking, Likert, and Multiple Choice Statistical Test: Pearson’s Chi-Squared, Relative Importance Index (RII), Cronbach’s Alpha (α), Mann–Whitney U-test. | Group 3: Incorporating climate change responsibility practice within the context of a developing city/system influences firms to increase ecological disclosure and improve systems performance, influence through engagement to further react to the damages caused by climate change and natural hazards and unsustainable practices as well as the collaboration with governmental organizations and other stakeholders [90]. Pursuing research on climate change and built environment resilience and determining the potential incorporation of required regulations and standards towards advancing resilience strategies. |
2.2. Questionnaire Distribution Process
2.3. Questionnaire Reliability and Validity
3. Results and Discussion
3.1. Awareness of the Respondents about Resilience of the Built Environment
3.2. Ranking Resilience Qualities
3.3. Leveraging Reflectivity (Rf)
3.4. Flexibility and Resourcefulness: Relationship and Performance
3.5. Improving Rapidity (Rp)
3.6. Complexity in Evaluating Some Resilience Characteristics
4. Conclusions
Supplementary Materials
Author Contributions
Funding
Institutional Review Board Statement
Informed Consent Statement
Data Availability Statement
Conflicts of Interest
References
- Campbell-Lendrum, D.; Corvalán, C. Climate Change and Developing-Country Cities: Implications For Environmental Health and Equity. J. Urban Health 2007, 84, 109–117. [Google Scholar] [CrossRef] [PubMed]
- Wilby, R.L. A Review of Climate Change Impacts on the Built Environment. In Planning for Climate Change; Routledge: Abingdon-on-Thames, UK, 2018; pp. 34–41. [Google Scholar]
- Balk, D.; Montgomery, M.; McGranahan, G.; Kim, D.; Mara, V.; Todd, M.; Buettner, T.; Dorelien, A. Mapping Urban Settlements and the Risks of Climate Change in Africa, Asia and South America. In Population Dynamics and Climate Change; UNFPA: New York, NY, USA, 2009; pp. 80–103. [Google Scholar]
- Tyler, S.; Moench, M. A Framework for Urban Climate Resilience. Clim. Dev. 2012, 4, 311–326. [Google Scholar] [CrossRef]
- UN-Habitat. Cities and Climate Change: Global Report on Human Settlements 2011; United Nations Human Settlements Program: Nairobi, Kenya, 2013. [Google Scholar]
- Al-Humaiqani, M.M.; Al-Ghamdi, S.G. The Built Environment Resilience Qualities to Climate Change Impact: Concepts, Frameworks, and Directions for Future Research. Sustain. Cities Soc. 2022, 80, 103797. [Google Scholar] [CrossRef]
- Tahir, F.; Al-Ghamdi, S.G. Climatic Change Impacts on the Energy Requirements for the Built Environment Sector. Energy Rep. 2023, 9, 670–676. [Google Scholar] [CrossRef]
- Ritchie, H.; Rosado, P.; Roser, M. Natural Disasters—Our World in Data. Available online: https://ourworldindata.org/natural-disasters (accessed on 28 February 2023).
- Dilley, M.; Chen, R.S.; Deichmann, U.; Lerner-Lam, A.L.; Arnold, M.; Agwe, J.; Buys, P.; Kjekstad, O.; Lyon, B.; Yetman, G. Natural Disaster Hotspots: A Global Risk Analysis; World Bank Publications: Washington, DC, USA, 2005. [Google Scholar]
- De Sherbinin, A.; Schiller, A.; Pulsipher, A. The Vulnerability of Global Cities to Climate Hazards. Environ. Urban. 2019, 19, 39–64. [Google Scholar] [CrossRef]
- Gu, D. Exposure and Vulnerability to Natural Disasters for World’s Cities; UN DESA Publications: New York, NY, USA, 2019. [Google Scholar]
- Burton, I.; Kates, R.W.; White, G.F. The Environment as Hazard, 2nd ed.; The Guilford Press: New York, NY, USA, 1993; ISBN 978-0898621594. [Google Scholar]
- Hochrainer-Stigler, S.; Mechler, R.; Pflug, G.; Williges, K. Funding Public Adaptation to Climate-Related Disasters. Estimates for a Global Fund. Glob. Environ. Chang. 2014, 25, 87–96. [Google Scholar] [CrossRef]
- Feofilovs, M.; Romagnoli, F. Dynamic Assessment of Urban Resilience to Natural Hazards. Int. J. Disaster Risk Reduct. 2021, 62, 102328. [Google Scholar] [CrossRef]
- U.S. Department of State—Bureau of Consular Affairs Non-Natural Disasters. Available online: https://travel.state.gov/content/travel/en/international-travel/before-you-go/crisis-abroad--be-ready/manmade-disasters.html (accessed on 28 February 2023).
- European Commission Natural and Man-Made Hazards. Available online: https://joint-research-centre.ec.europa.eu/scientific-activities-z/natural-and-man-made-hazards_en (accessed on 28 February 2023).
- Mohanty, A.; Hussain, M.; Mishra, M.; Kattel, D.B.; Pal, I. Exploring Community Resilience and Early Warning Solution for Flash Floods, Debris Flow and Landslides in Conflict Prone Villages of Badakhshan, Afghanistan. Int. J. Disaster Risk Reduct. 2019, 33, 5–15. [Google Scholar] [CrossRef]
- Farahi-Ashtiani, I.; Jahangiri, K.; Sohrabizadeh, S.; Gholamnia, R.; Rasouli, M.R. Explaining of the Experts’ Points of View about the Types and Importance of Man-Made Hazards in Iran’s Process Industries: A Qualitative Study. Heliyon 2023, 9, e13472. [Google Scholar] [CrossRef]
- Nivolianitou, Z.; Konstandinidou, M.; Michalis, C. Statistical Analysis of Major Accidents in Petrochemical Industry Notified to the Major Accident Reporting System (MARS). J. Hazard. Mater. 2006, 137, 1–7. [Google Scholar] [CrossRef]
- Kourniotis, S.P.; Kiranoudis, C.T.; Markatos, N.C. Statistical Analysis of Domino Chemical Accidents. J. Hazard. Mater. 2000, 71, 239–252. [Google Scholar] [CrossRef]
- Kidam, K.; Hurme, M. Statistical Analysis of Contributors to Chemical Process Accidents. Chem. Eng. Technol. 2013, 36, 167–176. [Google Scholar] [CrossRef]
- Badina, S.; Babkin, R.; Bereznyatsky, A.; Bobrovskiy, R. Spatial Aspects of Urban Population Vulnerability to Natural and Man-Made Hazards. City Environ. Interact. 2022, 15, 100082. [Google Scholar] [CrossRef]
- Hunt, A.; Watkiss, P. Climate Change Impacts and Adaptation in Cities: A Review of the Literature. Clim. Chang. 2010, 104, 13–49. [Google Scholar] [CrossRef]
- Tahir, F.; Ajjur, S.B.; Serdar, M.Z.; Al-Humaiqani, M.; Kim, D.; Al-Thani, S.K.; Al-Ghamdi, S.G. Qatar Climate Change Conference 2021: A Platform for Addressing Key Climate Change Topics Facing Qatar and the World; Hamad Bin Khalifa University Press: Doha, Qatar, 2021; p. 44. [Google Scholar]
- Wamsler, C.; Brink, E.; Rivera, C. Planning for Climate Change in Urban Areas: From Theory to Practice. J. Clean. Prod. 2013, 50, 68–81. [Google Scholar] [CrossRef]
- Wardekker, J.A.; de Jong, A.; Knoop, J.; Sluijs, J.P. van der Operationalising a Resilience Approach to Adapting an Urban Delta to Uncertain Climate Changes: An Assessment of Vulnerability. Technol. Forecast. Soc. Chang. 2010, 77, 987–998. [Google Scholar] [CrossRef]
- Hassler, U.; Kohler, N. Resilience in the Built Environment. Build. Res. Inf. 2014, 42, 119–129. [Google Scholar] [CrossRef]
- Alexander, K. Facilities Management: Theory and Practice; Routledge Taylor & Francies Group: Abingdon, UK, 1996; ISBN 9780419205807. [Google Scholar]
- Carpenter, S.; Walker, B.; Anderies, J.M.; Abel, N. From Metaphor to Measurement: Resilience of What to What? Ecosystems 2014, 4, 765–781. [Google Scholar] [CrossRef]
- Mafimisebi, O.; Nkwunonwo, U. Environmental Risk: Exploring Organisational Resilience and Robustness. Int. J. Sci. Eng. Res. 2015, 6, 1103–1115. [Google Scholar]
- Norris, F.H.; Stevens, S.P.; Pfefferbaum, B.; Wyche, K.F.; Pfefferbaum, R.L. Community Resilience as a Metaphor, Theory, Set of Capacities, and Strategy for Disaster Readiness. Am. J. Community Psychol. 2008, 41, 127–150. [Google Scholar] [CrossRef]
- Park, J.; Seager, T.P.; Rao, P.S.C.; Convertino, M.; Linkov, I. Integrating Risk and Resilience Approaches to Catastrophe Management in Engineering Systems. Risk Anal. 2013, 33, 356–367. [Google Scholar] [CrossRef]
- Rus, K.; Kilar, V.; Koren, D. Resilience Assessment of Complex Urban Systems to Natural Disasters: A New Literature Review. Int. J. Disaster Risk Reduct. 2018, 31, 311–330. [Google Scholar] [CrossRef]
- Marasco, S.; Kammouh, O.; Cimellaro, G.P. Disaster Resilience Quantification of Communities: A Risk-Based Approach. Int. J. Disaster Risk Reduct. 2022, 70, 102778. [Google Scholar] [CrossRef]
- Meerow, S.; Newell, J.P.; Stults, M. Defining Urban Resilience: A Review. Landsc. Urban Plan. 2016, 147, 38–49. [Google Scholar] [CrossRef]
- Cimellaro, G.P. Urban Resilience for Emergency Response and Recovery: Fundamental Concepts and Applications; Geotechnical, Geological and Earthquake Engineering; Springer International Publishing: Cham, Switzerland, 2016; ISBN 978-3-319-30655-1. [Google Scholar]
- National Academies of Sciences, Engineering, and Medicine. Building and Measuring Community Resilience: Actions for Communities and the Gulf Research Program; The National Academies Press: Washington, DC, USA, 2019. [Google Scholar]
- AlQahtany, A.M.; Abubakar, I.R. Public Perception and Attitudes to Disaster Risks in a Coastal Metropolis of Saudi Arabia. Int. J. Disaster Risk Reduct. 2020, 44, 101422. [Google Scholar] [CrossRef]
- Samsuddin, N.M.; Takim, R.; Nawawi, A.H.; Syed Alwee, S.N.A. Disaster Preparedness Attributes and Hospital’s Resilience in Malaysia. Procedia Eng. 2018, 212, 371–378. [Google Scholar] [CrossRef]
- UN/ISDR; UN/OCHA. Disaster Preparedness for Effective Response: Guidance and Indicator Package for Implementing Priority Five of the Hyogo Framework; UN: New York, NY, USA; Geneva, Switzerland, 2008. [Google Scholar]
- Kopke, K.; O’Mahony, C. Preparedness of Key Coastal and Marine Sectors in Ireland to Adapt to Climate Change. Mar. Policy 2011, 35, 800–809. [Google Scholar] [CrossRef]
- Serdar, M.Z.; Al-Ghamdi, S.G. Preparing for the Unpredicted: A Resiliency Approach in Energy System Assessment. In Undefined; Springer Science and Business Media: Berlin, Germany, 2021; pp. 183–201. [Google Scholar]
- The International Federation of Red Cross and Red Crescent Cooperation Societies PREPAREDNESS FOR CLIMATE CHANGE: A Study to Assess the Future Impact of Climatic Changes upon the Frequency and Severity of Disasters and the Implications for Humanitarian Response and Preparedness. In Proceedings of the 28th International Conference of the Red Cross and Red Crescent, Geneva, Switzerland, 2–6 December 2003; p. 15.
- Hosseini, S.; Barker, K.; Ramirez-Marquez, J.E. A Review of Definitions and Measures of System Resilience. Reliab. Eng. Syst. Saf. 2016, 145, 47–61. [Google Scholar] [CrossRef]
- Cutter, S.L.; Ash, K.D.; Emrich, C.T. The Geographies of Community Disaster Resilience. Glob. Environ. Chang. 2014, 29, 65–77. [Google Scholar] [CrossRef]
- Minsker, B.; Baldwin, L.; Crittenden, J.; Kabbes, K.; Karamouz, M.; Lansey, K.; Malinowski, P.; Nzewi, E.; Pandit, A.; Parker, J.; et al. Progress and Recommendations for Advancing Performance-Based Sustainable and Resilient Infrastructure Design. J. Water Resour. Plan. Manag. 2015, 141, A4015006. [Google Scholar] [CrossRef]
- Huang, G.; Li, D.; Zhu, X.; Zhu, J. Influencing Factors and Their Influencing Mechanisms on Urban Resilience in China. Sustain. Cities Soc. 2021, 74, 103210. [Google Scholar] [CrossRef]
- Rios, V.; Gianmoena, L. The Link between Quality of Government and Regional Resilience in Europe. J. Policy Model. 2020, 42, 1064–1084. [Google Scholar] [CrossRef]
- Salem, S.; Siam, A.; El-Dakhakhni, W.; Tait, M. Probabilistic Resilience-Guided Infrastructure Risk Management. J. Manag. Eng. 2020, 36, 04020073. [Google Scholar] [CrossRef]
- Bruneau, M.; Chang, S.E.; Eguchi, R.T.; Lee, G.C.; O’Rourke, T.D.; Reinhorn, A.M.; Shinozuka, M.; Tierney, K.; Wallace, W.A.; Von Winterfeldt, D. A Framework to Quantitatively Assess and Enhance the Seismic Resilience of Communities. Earthq. Spectra 2003, 19, 733–752. [Google Scholar] [CrossRef]
- Schipper, L.; Pelling, M. Disaster Risk, Climate Change and International Development: Scope for, and Challenges to, Integration. Disasters 2006, 30, 19–38. [Google Scholar] [CrossRef]
- Lin, S.; Shaw, D.; Ho, M.-C. Why Are Flood and Landslide Victims Less Willing to Take Mitigation Measures than the Public? Nat. Hazards 2008, 44, 305–314. [Google Scholar] [CrossRef]
- Malik, K.; Rahman, S.M.; Khondaker, A.N.; Abubakar, I.R.; Aina, Y.A.; Hasan, M.A. Renewable Energy Utilization to Promote Sustainability in GCC Countries: Policies, Drivers, and Barriers. Environ. Sci. Pollut. Res. 2019, 26, 20798–20814. [Google Scholar] [CrossRef]
- Li, D.H.W.; Yang, L.; Lam, J.C. Impact of Climate Change on Energy Use in the Built Environment in Different Climate Zones—A Review. Energy 2012, 42, 103–112. [Google Scholar] [CrossRef]
- Hürlimann, A.C.; Nielsen, J.; Moosavi, S.; Bush, J.; Warren-Myers, G.; March, A. Climate Change Preparedness across Sectors of the Built Environment—A Review of Literature. Environ. Sci. Policy 2022, 128, 277–289. [Google Scholar] [CrossRef]
- Wollschlaeger, S.; Sadhu, A.; Ebrahimi, G.; Woo, A. Investigation of Climate Change Impacts on Long-Term Care Facility Occupants. City Environ. Interact. 2022, 13, 100077. [Google Scholar] [CrossRef]
- Larsson Ivanov, O.; Bärring, L.; Wilcke, R.A.I. Climate Change Impact on Snow Loads in Northern Europe. Struct. Saf. 2022, 97, 102231. [Google Scholar] [CrossRef]
- Halder, B.; Bandyopadhyay, J. Evaluating the Impact of Climate Change on Urban Environment Using Geospatial Technologies in the Planning Area of Bilaspur, India. Environ. Chall. 2021, 5, 100286. [Google Scholar] [CrossRef]
- Alec Tzannes, A.M. Matthaios Santamouris: Minimising Energy Consumption, Energy Poverty and Global and Local Climate Change in the Built Environment: Innovating to Zero: Casualties and Impacts in a Zero Concept World. J. Wind Eng. Ind. Aerodyn. 2019, 193, 103952. [Google Scholar] [CrossRef]
- Bamdad, K.; Matour, S.; Izadyar, N.; Omrani, S. Impact of Climate Change on Energy Saving Potentials of Natural Ventilation and Ceiling Fans in Mixed-Mode Buildings. Build. Environ. 2022, 209, 108662. [Google Scholar] [CrossRef]
- Mayo, T.L.; Lin, N. Climate Change Impacts to the Coastal Flood Hazard in the Northeastern United States. Weather Clim. Extrem. 2022, 36, 100453. [Google Scholar] [CrossRef]
- Andrić, I.; Koc, M.; Al-Ghamdi, S.G. A Review of Climate Change Implications for Built Environment: Impacts, Mitigation Measures and Associated Challenges in Developed and Developing Countries. J. Clean. Prod. 2019, 211, 83–102. [Google Scholar] [CrossRef]
- Blekking, J.; Giroux, S.; Waldman, K.; Battersby, J.; Tuholske, C.; Robeson, S.M.; Siame, G. The Impacts of Climate Change and Urbanization on Food Retailers in Urban Sub-Saharan Africa. Curr. Opin. Environ. Sustain. 2022, 55, 101169. [Google Scholar] [CrossRef]
- Hidalgo-Galvez, M.D.; Barkaoui, K.; Volaire, F.; Matías, L.; Cambrollé, J.; Fernández-Rebollo, P.; Carbonero, M.D.; Pérez-Ramos, I.M. Can Trees Buffer the Impact of Climate Change on Pasture Production and Digestibility of Mediterranean Dehesas? Sci. Total Environ. 2022, 835, 155535. [Google Scholar] [CrossRef]
- Wang, H.; Zhang, Q.; Liu, R.; Sun, Y.; Xiao, J.; Gao, L.; Gao, X.; Wang, H. Impacts of Changing Climate on the Distribution of Solenopsis Invicta Buren in Mainland China: Exposed Urban Population Distribution and Suitable Habitat Change. Ecol. Indic. 2022, 139, 108944. [Google Scholar] [CrossRef]
- Auffhammer, M. Climate Adaptive Response Estimation: Short and Long Run Impacts of Climate Change on Residential Electricity and Natural Gas Consumption. J. Environ. Econ. Manag. 2022, 114, 102669. [Google Scholar] [CrossRef]
- Sato, S. Climate Change, the Built Environment and Triple-Helix Innovation. Energy Procedia 2017, 143, 843–850. [Google Scholar] [CrossRef]
- Alyami, S.H.; Abd El Aal, A.K.; Alqahtany, A.; Aldossary, N.A.; Jamil, R.; Almohassen, A.; Alzanifeer, B.M.; Kamh, H.M.; Fenais, A.S.; Alsalem, A.H. Developing a Holistic Resilience Framework for Critical Infrastructure Networks of Buildings and Communities in Saudi Arabia. Buildings 2023, 13, 179. [Google Scholar] [CrossRef]
- Koc, M.; Acar, A. Investigation of Urban Climates and Built Environment Relations by Using Machine Learning. Urban Clim. 2021, 37, 100820. [Google Scholar] [CrossRef]
- Gür, H. The Future Impact of Climate and Land-Use Changes on Anatolian Ground Squirrels under Different Scenarios. Ecol. Inform. 2022, 70, 101693. [Google Scholar] [CrossRef]
- Mallen, E.; Bakin, J.; Stone, B.; Sivakumar, R.; Lanza, K. Thermal Impacts of Built and Vegetated Environments on Local Microclimates in an Urban University Campus. Urban Clim. 2020, 32, 100640. [Google Scholar] [CrossRef]
- Mattauch, L.; Hepburn, C.; Spuler, F.; Stern, N. The Economics of Climate Change with Endogenous Preferences. Resour. Energy Econ. 2022, 69, 101312. [Google Scholar] [CrossRef]
- Saranko, O.; Fortelius, C.; Jylhä, K.; Ruosteenoja, K.; Brattich, E.; Di Sabatino, S.; Nurmi, V. Impacts of Town Characteristics on the Changing Urban Climate in Vantaa. Sci. Total Environ. 2020, 727, 138471. [Google Scholar] [CrossRef]
- Gallego-Schmid, A.; Chen, H.-M.; Sharmina, M.; Mendoza, J.M.F. Links between Circular Economy and Climate Change Mitigation in the Built Environment. J. Clean. Prod. 2020, 260, 121115. [Google Scholar] [CrossRef]
- Hiruta, Y.; Ishizaki, N.N.; Ashina, S.; Takahashi, K. Regional and Temporal Variations in the Impacts of Future Climate Change on Japanese Electricity Demand: Simultaneous Interactions among Multiple Factors Considered. Energy Convers. Manag. X 2022, 14, 100172. [Google Scholar] [CrossRef]
- Caby, J.; Ziane, Y.; Lamarque, E. The Impact of Climate Change Management on Banks Profitability. J. Bus. Res. 2022, 142, 412–422. [Google Scholar] [CrossRef]
- Murshed, S.; Griffin, A.L.; Islam, M.A.; Wang, X.H.; Paull, D. Assessing Multi-Climate-Hazard Threat in the Coastal Region of Bangladesh by Combining Influential Environmental and Anthropogenic Factors. Prog. Disaster Sci. 2022, 16, 100261. [Google Scholar] [CrossRef]
- Sovacool, B.K.; Baum, C.; Low, S. The next Climate War? Statecraft, Security, and Weaponization in the Geopolitics of a Low-Carbon Future. Energy Strateg. Rev. 2023, 45, 101031. [Google Scholar] [CrossRef]
- Khavarian-Garmsir, A.R.; Pourahmad, A.; Hataminejad, H.; Farhoodi, R. Climate Change and Environmental Degradation and the Drivers of Migration in the Context of Shrinking Cities: A Case Study of Khuzestan Province, Iran. Sustain. Cities Soc. 2019, 47, 101480. [Google Scholar] [CrossRef]
- Barnes, M.L.; Datta, A.; Morris, S.; Zethoven, I. Navigating Climate Crises in the Great Barrier Reef. Glob. Environ. Chang. 2022, 74, 102494. [Google Scholar] [CrossRef]
- Forzieri, G.; Bianchi, A.; Silva, F.B.e.; Marin Herrera, M.A.; Leblois, A.; Lavalle, C.; Aerts, J.C.J.H.; Feyen, L. Escalating Impacts of Climate Extremes on Critical Infrastructures in Europe. Glob. Environ. Chang. 2018, 48, 97–107. [Google Scholar] [CrossRef] [PubMed]
- Manes, S.; Vale, M.M.; Malecha, A.; Pires, A.P.F. Nature-Based Solutions Promote Climate Change Adaptation Safeguarding Ecosystem Services. Ecosyst. Serv. 2022, 55, 101439. [Google Scholar] [CrossRef]
- Carter, T.R.; Benzie, M.; Campiglio, E.; Carlsen, H.; Fronzek, S.; Hildén, M.; Reyer, C.P.O.; West, C. A Conceptual Framework for Cross-Border Impacts of Climate Change. Glob. Environ. Chang. 2021, 69, 102307. [Google Scholar] [CrossRef]
- Cohen, L.; Manion, L.; Morrison, K. Research Methods in Education; Taylor & Francis Group, Ed.; Routledge: New York, NY, USA, 2018; ISBN 9781138209862. [Google Scholar]
- Creative Research Systems Sample Size Calculator. Available online: https://www.surveysystem.com/sscalc.htm (accessed on 18 July 2022).
- Research, M. Sample Size Calculator for Market Research Surveys. Available online: https://www.macorr.com/sample-size-calculator.htm (accessed on 15 January 2023).
- Raosoft Sample Size Calculator by Raosoft, Inc. Available online: http://www.raosoft.com/samplesize.html (accessed on 18 July 2022).
- SurveyMonkey Sample Size Calculator: Understanding Sample Sizes. Available online: https://www.surveymonkey.com/mp/sample-size-calculator/?ut_source=help_center&ut_source2=en%2Fsolutions%2Fcalculating-respondents&ut_source3=inline (accessed on 18 July 2022).
- Qualtrics Sample Size Calculator & Complete Guide in 2022. Available online: https://www.qualtrics.com/blog/calculating-sample-size/ (accessed on 18 July 2022).
- Asfaw, T.S.; Botes, V.; Mengesha, L.G. The Role of NGOs in Corporate Environmental Responsibility Practice: Evidence from Ethiopia. Int. J. Corp. Soc. Responsib. 2017, 2, 2. [Google Scholar] [CrossRef]
- Ngin, C.; Chhom, C.; Neef, A. Climate Change Impacts and Disaster Resilience among Micro Businesses in the Tourism and Hospitality Sector: The Case of Kratie, Cambodia. Environ. Res. 2020, 186, 109557. [Google Scholar] [CrossRef] [PubMed]
- The Rockefeller Foundation & Arup. City Resilience Framework; The Rockefeller Foundation & Arup: New York, NY, USA, 2015; p. 24. [Google Scholar]
- Wardekker, A.; Wilk, B.; Brown, V. Assessing Urban Resilience in Rotterdam Using Resilience Principles: Workshop Report; Utrecht University: Utrecht, The Netherlands, 2017; Volume 5. [Google Scholar]
- Nik, V.M.; Moazami, A. Using Collective Intelligence to Enhance Demand Flexibility and Climate Resilience in Urban Areas. Appl. Energy 2021, 281, 116106. [Google Scholar] [CrossRef]
- Faturechi, R.; Miller-Hooks, E. Measuring the Performance of Transportation Infrastructure Systems in Disasters: A Comprehensive Review. J. Infrastruct. Syst. 2015, 21, 04014025. [Google Scholar] [CrossRef]
- Godschalk, D.R. Urban Hazard Mitigation: Creating Resilient Cities. Nat. Hazards Rev. 2003, 4, 136–143. [Google Scholar] [CrossRef]
- Deshkar, S.; Adane, V. Community Resilience Approach for Prioritizing Infrastructure Development in Urban Areas. Urban Disasters Resil. Asia 2016, 245–267. [Google Scholar] [CrossRef]
- Ouyang, M. A Mathematical Framework to Optimize Resilience of Interdependent Critical Infrastructure Systems under Spatially Localized Attacks. Eur. J. Oper. Res. 2017, 262, 1072–1084. [Google Scholar] [CrossRef]
- Ayyub, B.M. Climate-Resilient Infrastructure: Adaptive Design and Risk Management; American Society of Civil Engineers (ASCE): Reston, VA, USA, 2018. [Google Scholar]
- Chalmers, P. Climate Change: Implications for Buildings. Key Findings from the Intergovernmental Panel on Climate Change (IPCC) Fifth Assessment Report (AR5) on Buildings; University of Cambridge’s Judge Business School: Cambridge, UK, 2014; pp. 1–20. [Google Scholar]
- Climate Change Adaptation Climate Change Impact on Buildings and Constructions. Available online: https://en.klimatilpasning.dk/sectors/buildings/climate-change-impact-on-buildings/ (accessed on 24 January 2023).
- Castaño-Rosa, R.; Pelsmakers, S.; Järventausta, H.; Poutanen, J.; Tähtinen, L.; Rashidfarokhi, A.; Toivonen, S. Resilience in the Built Environment: Key Characteristics for Solutions to Multiple Crises. Sustain. Cities Soc. 2022, 87, 104259. [Google Scholar] [CrossRef]
- Rockefeller and Arup City Resilience Index. Available online: https://www.cityresilienceindex.org/#/ (accessed on 8 August 2021).
- Asian Development Bank. Climate Proofing: A Risk-Based Approach to Adaptation; Asian Development Bank: Mandaluyong, Philippines, 2005. [Google Scholar]
- Zona, A.; Kammouh, O.; Cimellaro, G.P. Resourcefulness Quantification Approach for Resilient Communities and Countries. Int. J. Disaster Risk Reduct. 2020, 46, 101509. [Google Scholar] [CrossRef]
- MacKinnon, D.; Derickson, K.D. From Resilience to Resourcefulness: A Critique of Resilience Policy and Activism. Prog. Hum. Geogr. 2013, 37, 253–270. [Google Scholar] [CrossRef]
- Funk, C.; Kennedy, B. The Politics of Climate: Polarized View about Climate Issues Stretch from the Causes and Cures for Climate Change to Trust in Climate Scientists and Their Research; Pew Research Center: Washington, DC, USA, 2016; p. 114. [Google Scholar]
- Salimi, M.; Al-Ghamdi, S.G. Climate Change Impacts on Critical Urban Infrastructure and Urban Resiliency Strategies for the Middle East. Sustain. Cities Soc. 2020, 54, 101948. [Google Scholar] [CrossRef]


| # | Resilience Quality (RQ)/Indicator | Scope/Definition | Reference |
|---|---|---|---|
| 1.0 | Leveraging Reflectivity (Rf) | The needed reaction of the institutions, organizations, and entities to disturbances and sharing views and feedback from previous experiences to inform future decision-making. | [92,93] |
| 1.1 | Learning from the past | ||
| 1.2 | Active participation of professional stakeholders and experienced actors | ||
| 1.3 | Planning for future | ||
| 1.4 | Preparation for disasters | ||
| 1.5 | Decision-making facilitating | ||
| 1.6 | Reflective environment systems | ||
| 4.0 | Enhancing Flexibility (Fx) | The ability of the system to adopt alternative strategies to a climate change crisis and natural hazards and adaptability to environmental variations. Additionally, it is about the capacity to accept changes in the aftershock of disturbances through emergency planning. | [94,95,96] |
| 4.1 | Identifying, quantifying, and controlling the flexibility | ||
| 4.2 | Adopting alternative strategies to the crisis | ||
| 4.3 | Adaptation and inherent capacity | ||
| 4.4 | Climate adaptation policies and processes | ||
| 4.5 | Incorporating traditional knowledge and practices | ||
| 4.6 | Efforts to mitigate climate change impacts | ||
| 5.0 | Encouraging Resourcefulness (Rs) | The capacity to identify problems and priorities and allocate and mobilize resources before, during, and after a disastrous event considering human factors. | [46,97] |
| 5.1 | Disaster preparedness. | ||
| 5.2 | Emergency management | ||
| 5.3 | Resources utilization | ||
| 5.4 | Mitigating the losses by the community | ||
| 5.5 | Visualize and act | ||
| 5.6 | Identify problems and establish priorities | ||
| 6.0 | Improving Rapidity (Rp) | The ability of the system to quickly recover from the encountered crisis. The concept is about how the features of responsiveness, adaptation, and recovery activities enable the affected system to recover to its full operational function quickly. | [39,98,99] |
| 6.1 | Responsiveness and restorative capacity | ||
| 6.2 | Adaptation | ||
| 6.3 | Rapid recovery | ||
| 6.4 | Recovery activities (resource allocation) |
| Statement Subject | Group 1 | Group 2 | Group 3 | Overall | ||||
|---|---|---|---|---|---|---|---|---|
| RII | Rank | RII | Rank | RII | Rank | RII | Rank | |
| Shelter systems (i.e., buildings) | 0.6065 | 4 | 0.6846 | 4 | 0.6121 | 4 | 0.6507 | 4 |
| Life support systems (i.e., energy and water supply systems, etc.) | 0.7226 | 3 | 0.7256 | 3 | 0.6667 | 2 | 0.7113 | 3 |
| Movement systems (i.e., transportation infrastructure (roads, bridges, etc.)) | 0.7290 | 2 | 0.7410 | 1 | 0.6485 | 3 | 0.7169 | 2 |
| Open space systems (i.e., the utility for park and recreation purposes) | 0.7355 | 1 | 0.7385 | 2 | 0.6788 | 1 | 0.7239 | 1 |
| Statement Subject | Group 1 | Group 2 | Group 3 | |||
|---|---|---|---|---|---|---|
| RII | Rank | RII | Rank | RII | Rank | |
| Seeking permanent solutions based on the current status of the built environment systems | 0.6581 | 1 | 0.6658 | 1 | 0.6121 | 2 |
| Modifying standards, norms, and regulations based on collected information | 0.6258 | 3 | 0.6430 | 2 | 0.6364 | 1 |
| Emerging evidence from climate change stress and shocks experienced | 0.6387 | 2 | 0.5949 | 3 | 0.5758 | 3 |
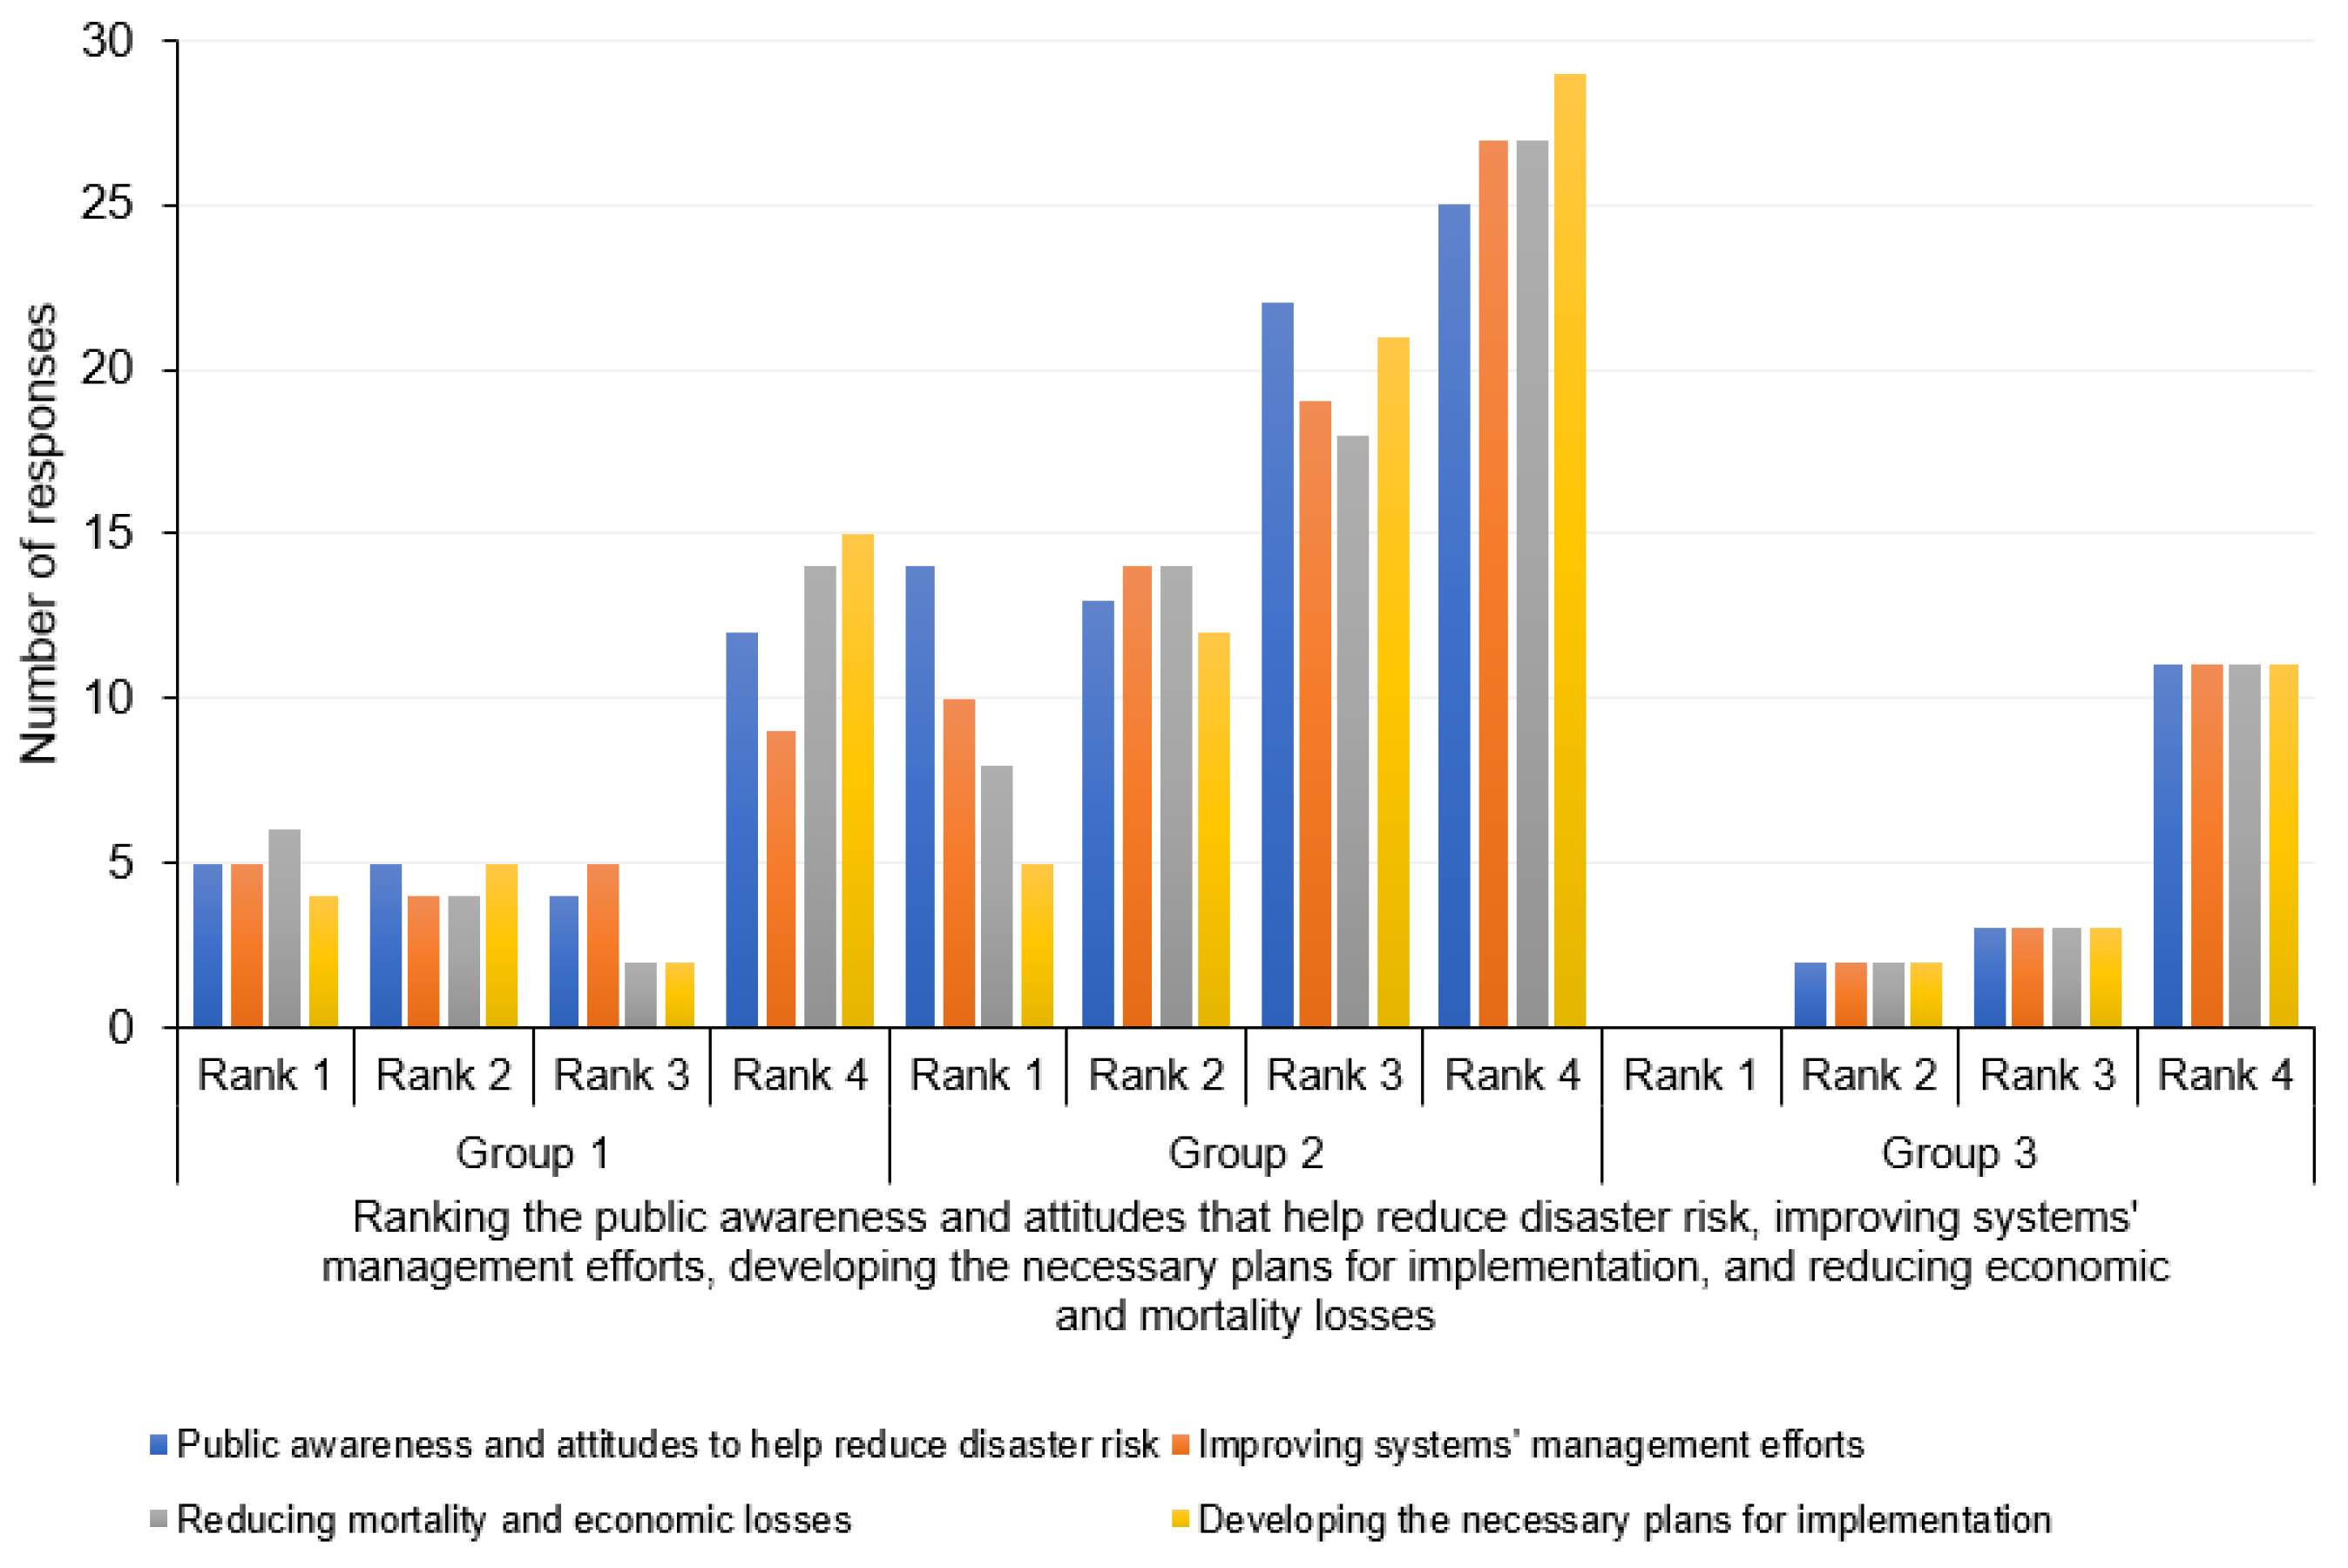
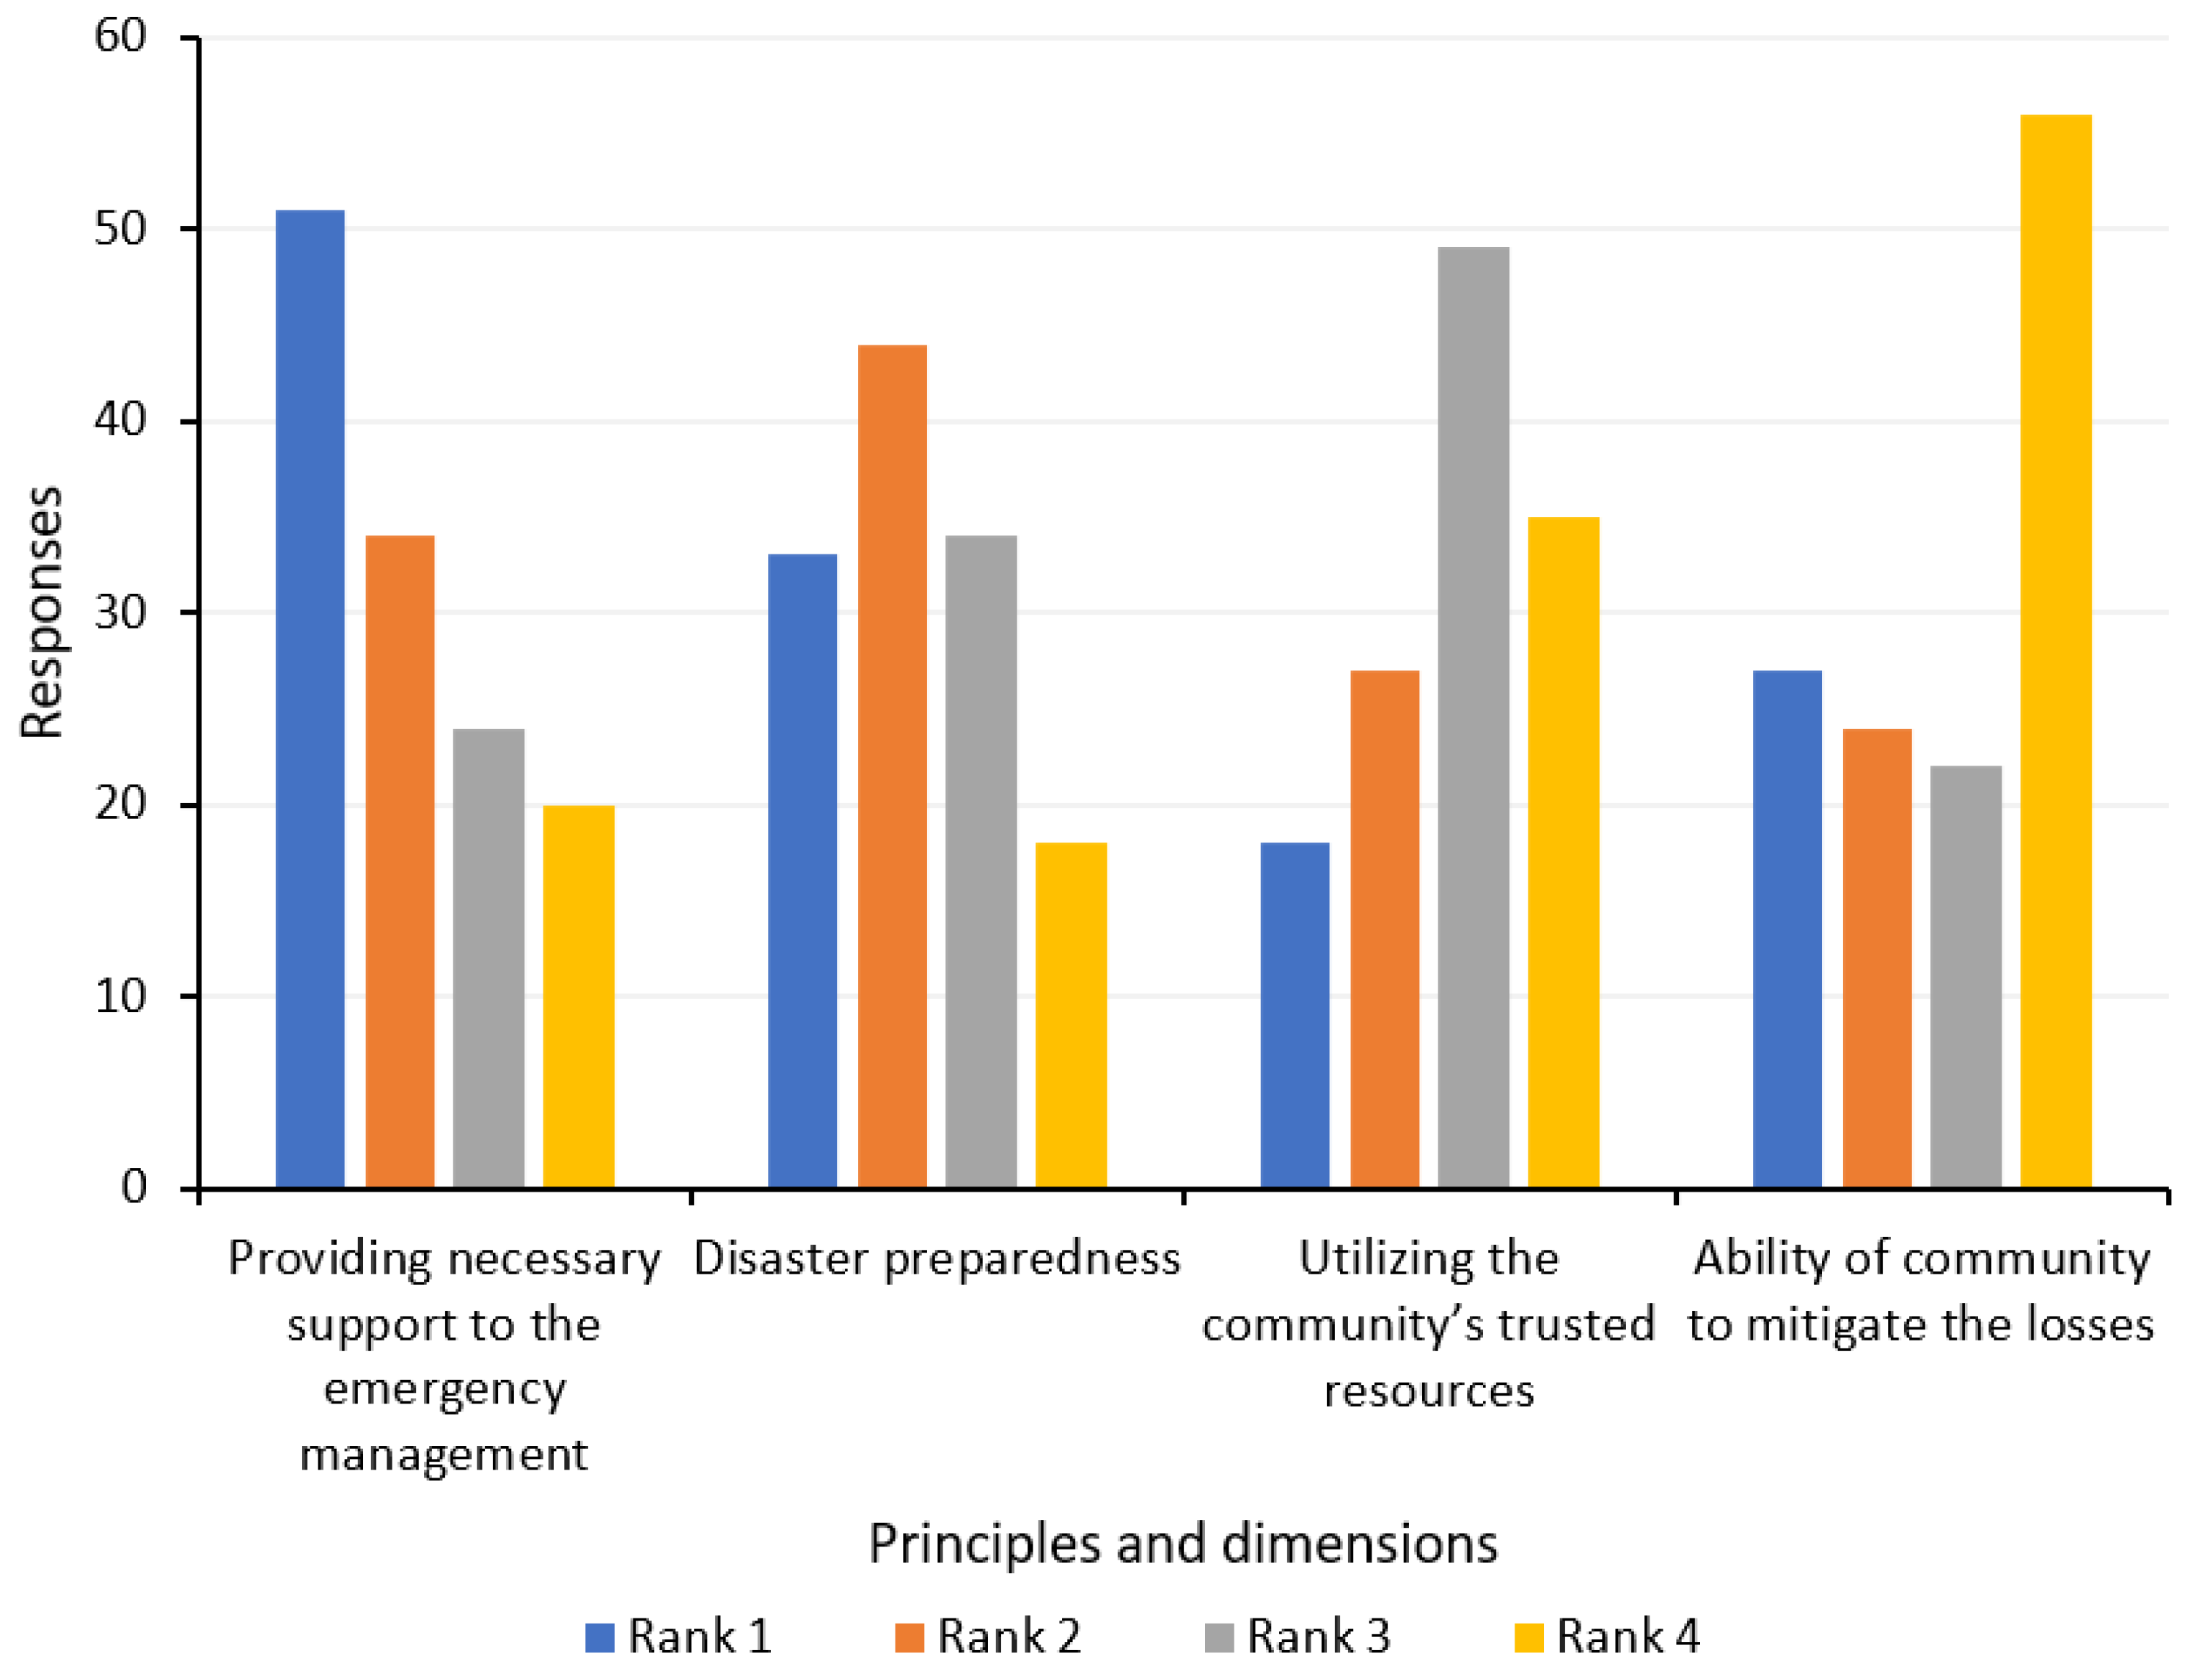
| Statement Subject | Group 1 | Group 2 | Group 3 | |||
|---|---|---|---|---|---|---|
| RII | Rank | RII | Rank | RII | Rank | |
| Providing necessary support to the emergency management system through the political and economic structure | 0.5446 | 4 | 0.5036 | 4 | 0.5703 | 3 |
| Disaster preparedness through preparing the residents and the whole community | 0.5982 | 3 | 0.5616 | 3 | 0.5547 | 4 |
| Utilizing the community’s trusted resources to allow the community to cope with the climate change hazards | 0.6339 | 2 | 0.7319 | 1 | 0.6719 | 2 |
| The ability of the community to mitigate the losses through making smart decisions | 0.7232 | 1 | 0.7029 | 2 | 0.7031 | 1 |
| Flexibility Principles and Dimensions Ranked in Terms of Groups’ Influence | Mann–Whitney U-Test Results | ||
|---|---|---|---|
| Test 1 | Test 2 | Test 3 | |
| G1 and G2 | G1 and G3 | G2 and G3 | |
| Providing necessary support to the emergency management system by the political and economic structure | 0.5521 | 0.8591 | 0.3866 |
| Disaster preparedness through preparing the residents and the whole community | 0.5398 | 0.6722 | 0.9181 |
| Utilizing the community’s trusted resources to allow the community to cope with the climate change hazards | 0.0402 | 0.4388 | 0.3372 |
| The ability of the community to mitigate the losses through making smart decisions | 0.6572 | 0.6262 | 0.9390 |
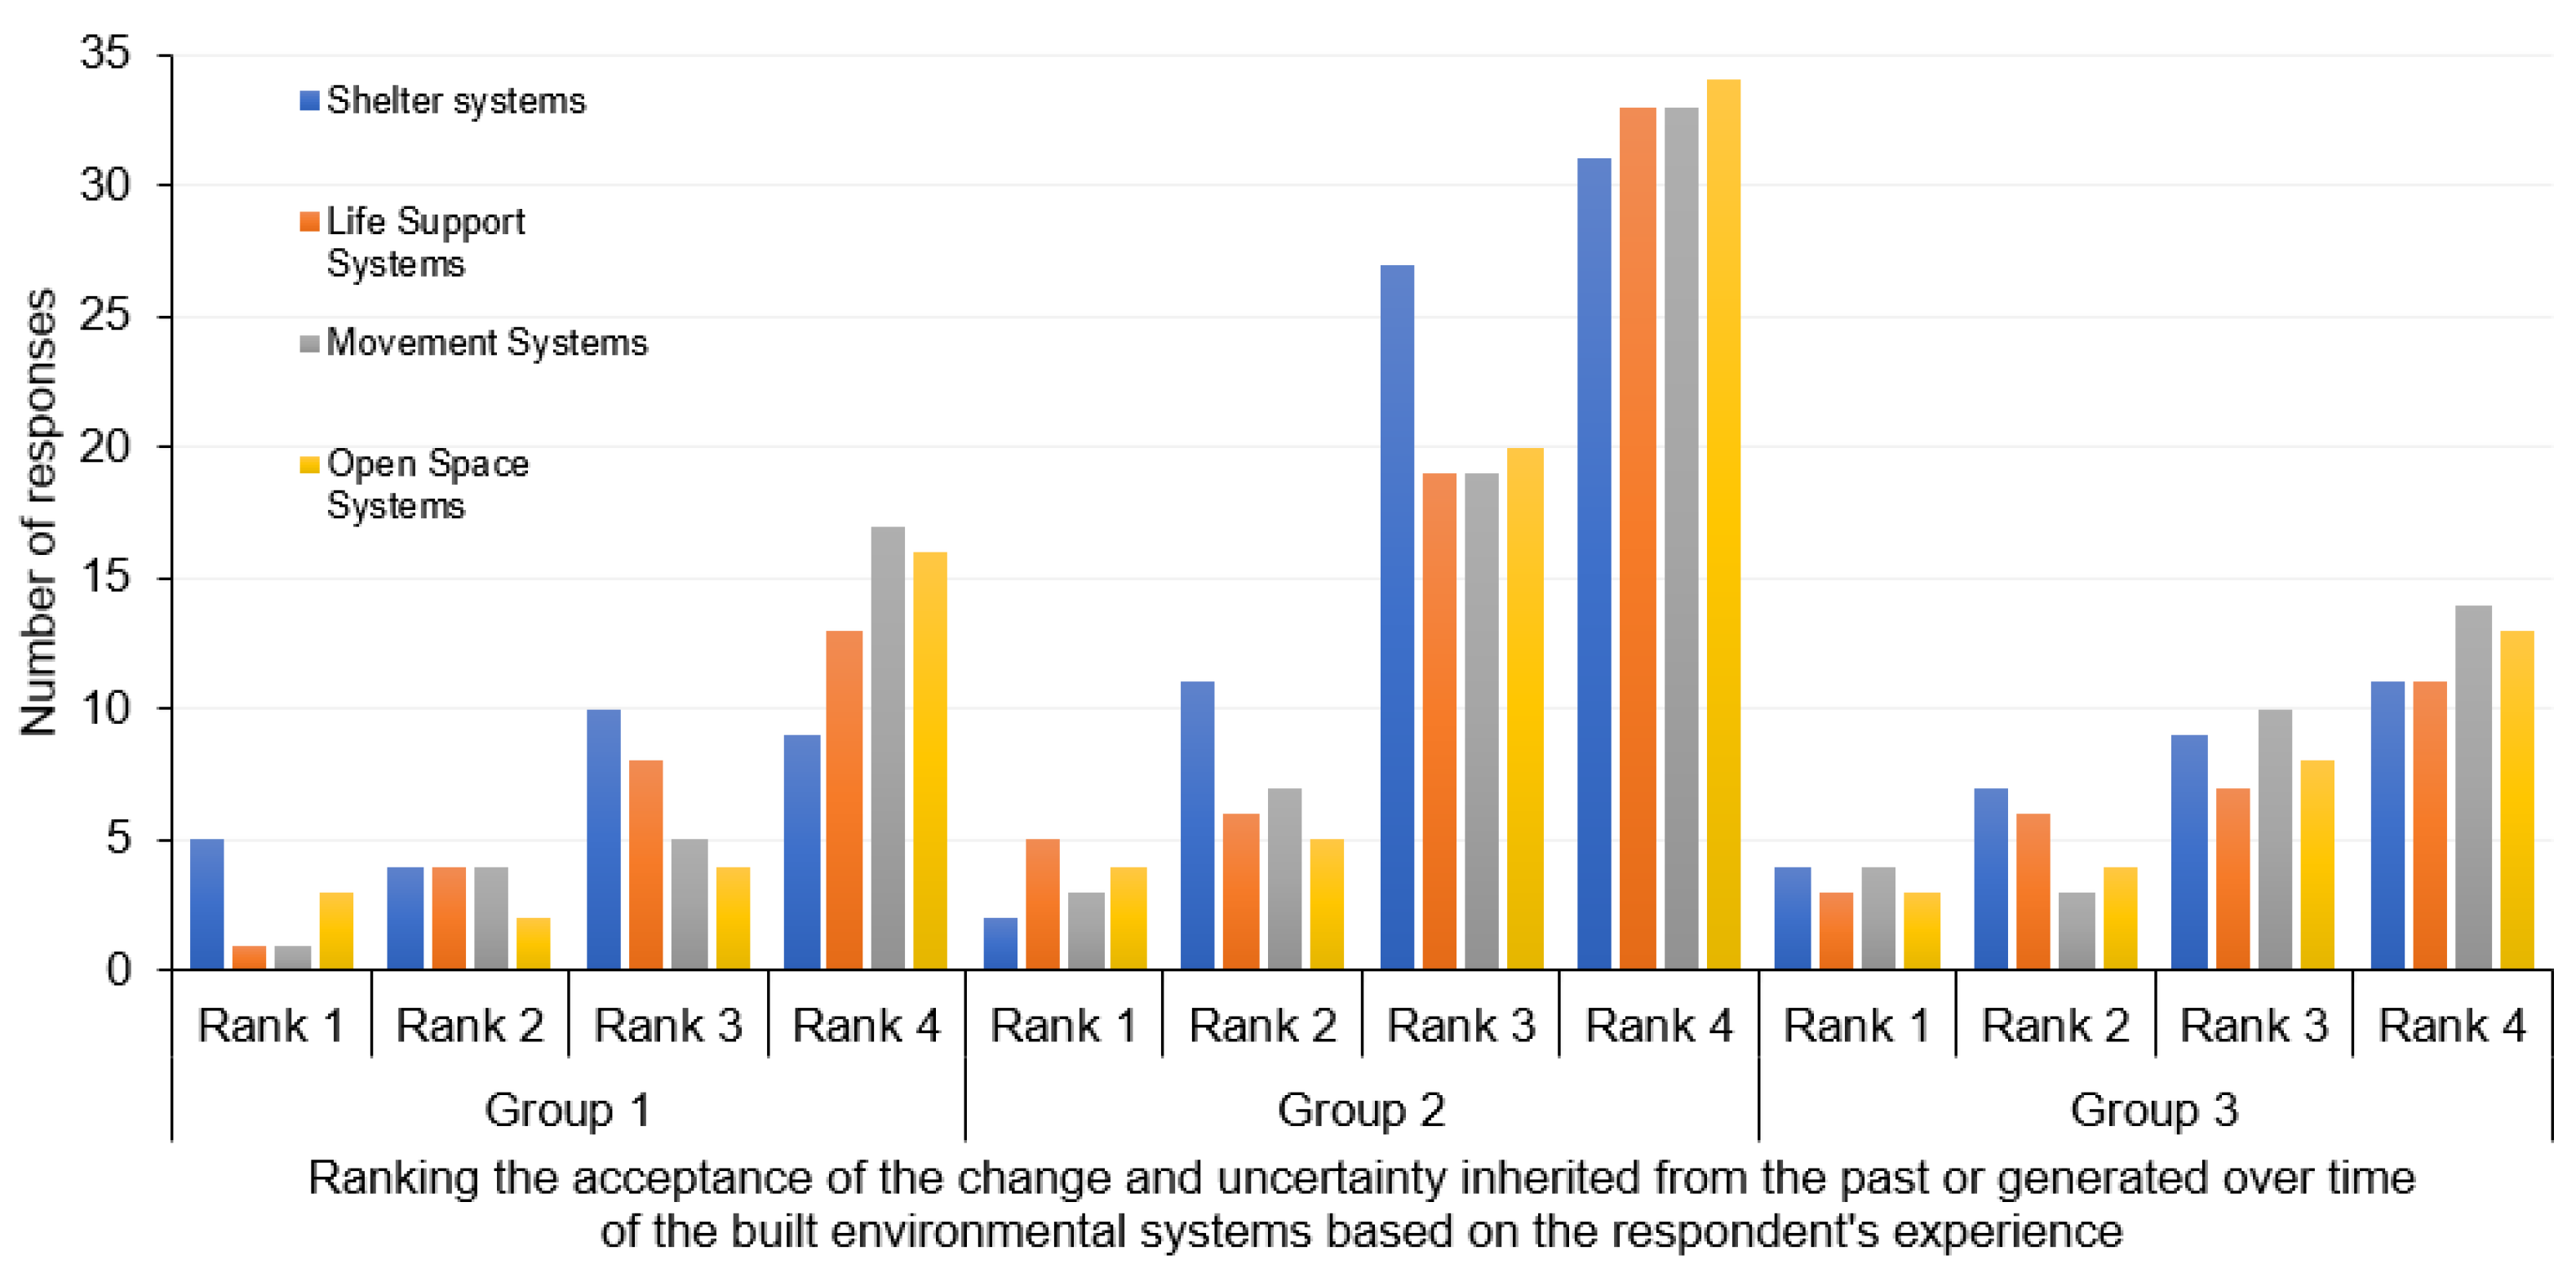
| Statement Subject | Group 1 | Group 2 | Group 3 | |||
|---|---|---|---|---|---|---|
| RII | Rank | RII | Rank | RII | Rank | |
| Shelter systems (i.e., buildings) | 0.7000 | 4 | 0.6700 | 2 | 0.6414 | 4 |
| Life Support Systems (i.e., energy and water supply systems, etc.) | 0.7667 | 2 | 0.6667 | 3 | 0.6966 | 1 |
| Movement Systems (i.e., transportation infrastructure (roads, bridges, etc.)) | 0.7750 | 1 | 0.6400 | 4 | 0.6690 | 2 |
| Open Space Systems (i.e., the utility for park and recreation purposes) | 0.7417 | 3 | 0.6800 | 1 | 0.6966 | 1 |
Disclaimer/Publisher’s Note: The statements, opinions and data contained in all publications are solely those of the individual author(s) and contributor(s) and not of MDPI and/or the editor(s). MDPI and/or the editor(s) disclaim responsibility for any injury to people or property resulting from any ideas, methods, instructions or products referred to in the content. |
© 2023 by the authors. Licensee MDPI, Basel, Switzerland. This article is an open access article distributed under the terms and conditions of the Creative Commons Attribution (CC BY) license (https://creativecommons.org/licenses/by/4.0/).
Share and Cite
Al-Humaiqani, M.M.; Al-Ghamdi, S.G. Assessing the Built Environment’s Reflectivity, Flexibility, Resourcefulness, and Rapidity Resilience Qualities against Climate Change Impacts from the Perspective of Different Stakeholders. Sustainability 2023, 15, 5055. https://doi.org/10.3390/su15065055
Al-Humaiqani MM, Al-Ghamdi SG. Assessing the Built Environment’s Reflectivity, Flexibility, Resourcefulness, and Rapidity Resilience Qualities against Climate Change Impacts from the Perspective of Different Stakeholders. Sustainability. 2023; 15(6):5055. https://doi.org/10.3390/su15065055
Chicago/Turabian StyleAl-Humaiqani, Mohammed M., and Sami G. Al-Ghamdi. 2023. "Assessing the Built Environment’s Reflectivity, Flexibility, Resourcefulness, and Rapidity Resilience Qualities against Climate Change Impacts from the Perspective of Different Stakeholders" Sustainability 15, no. 6: 5055. https://doi.org/10.3390/su15065055
APA StyleAl-Humaiqani, M. M., & Al-Ghamdi, S. G. (2023). Assessing the Built Environment’s Reflectivity, Flexibility, Resourcefulness, and Rapidity Resilience Qualities against Climate Change Impacts from the Perspective of Different Stakeholders. Sustainability, 15(6), 5055. https://doi.org/10.3390/su15065055