Article

The Relationship between Search Engines and Entrepreneurship Development: A Granger-VECM Approach

by
Michael Olumekor
1,
Hossam Haddad
2 and
Nidal Mahmoud Al-Ramahi
2,*
1
Graduate School of Economics and Management, Ural Federal University, 620014 Yekaterinburg, Russia
2
Accounting Department, Business Faculty, Zarqa University, Zarqa 13133, Jordan
*
Author to whom correspondence should be addressed.
Sustainability 2023, 15(6), 5053; https://doi.org/10.3390/su15065053
Submission received: 5 February 2023 / Revised: 17 February 2023 / Accepted: 6 March 2023 / Published: 13 March 2023

Abstract

:
The decision to set-up a business as a sole proprietor—also individual entrepreneur or sole trader—is a consequential one for every nascent entrepreneur. Sole proprietorship businesses have remained the most popular business structure in many countries, including the United States, the United Kingdom, and Russia, and are vital to the sustainable development of countries and regions. In this research, we developed a model to investigate if increased online interest in sole proprietorships led to the creation of new sole proprietorship businesses in four regions of Russia. Search engine data were retrieved from Russia’s most popular search engine, Yandex, whereas data on newly registered individual entrepreneurship businesses were retrieved from Russia’s Federal Tax Service. Our model was comprised of a range of statistical methods, including the augmented Dickey–Fuller unit root test, the Johansen cointegration test, the Granger causality Wald test, and the vector error correction model. The results revealed a unidirectional causal relationship between search engine data and newly established individual entrepreneurship businesses. This means that interest in individual entrepreneurship, measured through search engine data, influenced the creation of new individual entrepreneurship businesses. This research provides a pioneering empirical investigation of the topic in post-Soviet states, and its main contribution includes introducing search engine data as a key tool for assessing entrepreneurial intention.

1. Introduction

The study of entrepreneurship has come a long way since Sexton [1] famously asked if the field was actually growing or just getting bigger. Since then, numerous studies have attempted to define who an entrepreneur is and the roles they play in society [2,3,4]. Entrepreneurship has also become crucial to the sustainable growth of local and regional economies around the world. It has become an important driver of sustainable regional economic development [5,6,7] and job creation [7,8,9].
The influence of entrepreneurship on the economy of regions has been extensively studied from different directions, including entrepreneurial ecosystems [10,11,12], the influence of the Internet and digital technologies [13,14], the impact of government and institutional policies [15,16,17], innovation in public sector institutions [18], entrepreneurial culture [19], determinants of regional entrepreneurship [16,20,21], and the behaviour of regional entrepreneurs [22,23]. This article is more specifically focused on sole proprietorship—also frequently referred to as individual entrepreneurship in this article—in the regional economies of Russia. The United States Small Business Administration defines a sole proprietorship as “an unincorporated business owned and run by one individual with no distinction between the business and you, the owner” [24]. A sole proprietorship is a legal structure which entitles the owner to all the profits from a business but also all the losses. They are very often micro or small businesses [25,26], and the ease of starting them means they are often the first businesses created by entrepreneurs. Additionally, sole proprietorships have continued to represent a significant proportion of entrepreneurial and business activity around the world. They represent 56% of all businesses in the United Kingdom, 73.1% in the United States, and 60.5% of all small- and medium-sized businesses (SMEs) in Russia, among others [27,28,29].
This research recognises the considerable body of prior work on sole proprietorships. However, the overwhelming majority of them have simply focused on taxation, legal issues, access to credit and finance, or gender. For example, in a study looking at access to bank credit for sole proprietorships in Italy, Cesaroni and Sentuti [30] found gender did not play a major role in determining success. In a similar study on gender issues, Collins-Dodd et al. [26] found significant differences in the financial performance of male and female sole proprietorships, but concluded it was as a result of other variables, not gender directly. Further studies on gender issues include studies on work–family balance among men and women sole proprietors [31], on the role gender plays in the survival of sole proprietorships [32], and on whether gender influences management styles in the face of an economic recession [33]. On taxation, Carroll et al. [34] found a connection between higher taxes and hiring decisions among sole proprietors, Power and Rider [35] concluded that taxes influenced their retirement savings plans, while McKerchar et al. [36] looked into the factors motivating tax compliance among sole proprietorships. On legal issues, scholars have looked into the financial implications [37] and other legal perspectives [38,39].
Furthermore, there have been studies looking into the role of family on sole proprietorship and vice versa. A study found the use of family resources is most frequent in sole proprietorships [40], while another found less family involvement in a sole proprietorship [41]. Other studies looked at the use of ICT [25] decision making in hiring [42], mortality rates and safety issues [43], risk-taking attitudes and behaviour [44], the influence of ethnicity in decision making [45], and the opportunities a sole proprietorship could bring for people with disabilities [46]. However, because a sole proprietorship is primarily a legal status, most prior studies on micro/small businesses and entrepreneurship have simply examined them as a collective unit and avoided looking into the several entrepreneurial structures within the units.
While this research does not provide all the answers, it is carried out from an empirically grounded belief that entrepreneurs choose to set up as sole proprietorships for several reasons, including the ease to set it up [47], taxation [35], and the nature of the business [25,46,47]. Moreover, due to the amount of time we all, including entrepreneurs, currently spend online, Internet data and search engine data in particular, can be excellent aggregators of our intention [48]. As a result, using data from Russia’s most popular search engine service, Yandex, this research sought to examine if increased online interest in sole proprietorships corresponded with an increased interest in setting up a new sole proprietorship business in the Sverdlovsk region, Novosibirsk region, Chelyabinsk region, and Krasnoyarsk krai in Russia. Data on newly formed sole proprietorships was obtained from the database of Russia’s tax revenue service [27].
This research seeks to increase our understanding of the motivations behind setting up a business as a sole proprietorship and is a significant addition to contemporary literature on the topic. It differs from other prior studies in a number of ways. First, it extends the range of debate on this very popular entrepreneurship structure. Additionally, to our knowledge, this is the first study to utilise the quantitative approach we used. This is also the first study of its kind on any post-Soviet state. Furthermore, this research advances the use of search engine data to analyse the attention, intention, and motivations of entrepreneurs. It examines all of these in the context of the regional economy. Finally, it provides actionable suggestions on how these regions can foster entrepreneurship by making the Internet a vital part of entrepreneurial ecosystems, particularly in the studied regions.
The article is structured in the following way: the next section contains a literature review followed by the methodology, results, discussions, and conclusions.

2. Materials and Methods

2.1. Using Search Engine Data to Measure Intention and Attention

An increasing body of evidence suggests data from search engines can be accurately used to measure or predict attention, intention, and habit. They have also long been used to analyse socio-economic phenomena and improve forecasting accuracy. For example, in a study using machine learning to forecast sales in the publishing industry, researchers developed a more accurate model when Google search data were incorporated into a traditional model [49]. This was buttressed by the findings of Wachter et al. [50] who combined search data from Google with real-world sales data of automobiles to improve prediction accuracy by up to 27% and reduce sample error by 5%. Furthermore, a deep learning analysis, which included Google search data in its model, performed better than other competing models without it [51], and a Nowcasting analysis of four countries in South-West Europe found a forecasting analysis of unemployment and car sales yielded better results with Google search data [52]. Moreover, many studies have found positive relationships between real-world events, sales/prices of products, and search engine data. Li et al. [53] found an increase in searches for crude oil prices significantly impacted the prices of crude oil when the price surges and when it collapses. Another study found Google search query volumes could accurately predict tourism demand in Switzerland [54], and Höpken et al. [55] concluded data from Google searches can help to accurately predict tourist arrivals at a mountain resort in Sweden. Other studies found strong positive relationships between the search queries and sexual behaviour [56], suicidal behaviour [57] and COVID-19, obesity, Ebola, epilepsy, and other health issues [58,59,60].
Additionally, there has been an exponential rise in the number of recent research finding a positive relationship between Internet search results and the prices, trading volume, turnover, and volatility of stocks, securities, and other commodities. In an empirical analysis examining data from Google searches, Wikipedia, and Amazon Mechanical Turk, Curme et al. [61] found a correlation between an increase in search volume and a fall in the stock market. Other research include a study of Taiwan’s top 50 firms which found a significant correlation between Google search volume and stock turnover [62], a study of Japan’s stock market which found a strong positive correlation between Google search intensity and trading volume [63], a study of seven countries which found a positive relationship between search volume and stock market liquidity [64], a study in France which found Google search volume mirrored the attention of investors, which in turn influenced the stock market [65], and a study in Germany which found search volumes to be a good proxy for stock market and investor behaviour [66]. There have also been well-established studies on the stock markets in India [67], the United States [68], Brazil [69], Norway [70], Vietnam [71], and other countries [72].
As a result, the following was hypothesised:
H1. 
There is a causal relationship between the number of Internet searches for sole proprietorship and the number of newly established sole proprietorship businesses in the four regions.

2.2. Data Collection and Analysis

The Federal Tax Service of Russia keeps a very detailed database on the number of SMEs in the Russian Federation [27]. This database includes the publicly available data on newly created sole proprietorship—individual entrepreneur—businesses which was used for this research. For search engine data, the two leading search engines in Russia are Yandex and Google. However, Yandex was selected because it is far more popularly used. Moreover, Yandex also makes search engine data publicly available through its Yandex Wordstat program, similar to what Google does with Google Trends. To retrieve the search engine results, a keyword search was conducted on Yandex Wordstat for the words ‘sole proprietorship’. The search results included several variants of the word such as ‘how to set up a sole proprietorship’, ‘what is a sole proprietorship’, and ‘benefits of a sole proprietorship’, among others. Keywords that were deemed irrelevant were excluded. For example, search results for how to retrieve missing passwords on the government portal for individual entrepreneurs were excluded.
Therefore, this study used panel data from December 2019 to December 2021. Panel data are often balanced, reliable, and a more accurate reflection of reality [73]. The variables considered are the number of newly established sole proprietorship businesses in the Sverdlovsk region, Novosibirsk region, Chelyabinsk region, and Krasnoyarsk krai, and the number of Internet searches on sole proprietorship in the same regions. While the former is the dependent variable, the latter is the independent one, and the goal of the analysis is to examine if Internet searches for sole proprietorship led to the creation of new sole proprietorship businesses in these regions. A range of analyses were used for this research. A break-down of the research approach and a full explanation of the models are provided below.
To begin the analysis, a time-series trend was first conducted for the data, then a mean analysis was carried out to simplify the analytical process. All further analyses were based on the results of the mean. Additionally, a unit root test and the AUDF test were carried out to determine stationarity. Then, a co-integration test was used to determine if there is a relationship between the two variables. Afterwards, the Granger causality Wald test was used to determine the direction of causality before a VECM model was fitted to determine if the causal relationship exists in the long run. Finally, stability and diagnostics tests were conducted to analyse robustness. A full explanation of the methodological process is provided in the following sections.

2.2.1. Unit Root Test (URT)

Unit roots are processes which are nonstationary autoregressive (AR) or autoregressive moving-average (ARMA) time-series processes. Extensive research has been done to advance, improve, and critique unit roots from a wide range of statistical approaches [74,75,76,77]. Unit roots have been dominant in several fields, such as statistics, economics, energy, finance, and other fields, which make use of time-series data [75,78]. They are primarily used to test if the null hypothesis is non-stationary [74,76].
A process that is integrated in an order, n , that is, I n , is a process that needs to be differentiated n times to become weakly stationary. A weakly stationary process is referred to as an I 0 process. An A R M A p , q model is defined in terms of its lagged values xt and its current and past innovations ε t as:
x t = i = 1 p i x t i + i = 1 q i ε t i + ε t
It is commonly assumed the innovations are independently and identically distributed ( i . i . d . ) Gaussian white noise series ε t ~   N 0 ,   σ 2 , though this is not a requirement.
Equation (1) can be rewritten as:
x t i = 1 p i x t i = ε t + i = 1 q i ε t i
Additionally, using the back-shift operator, it can be further expressed as:
    L x t = θ L ε t
where θ L is the characteristic polynomial of the A R p part:
z = 1 1 z p z p
where x t is stationary only if the roots of L = 0 all lie outside of the unit circle.
Unit root is defined as an A R or A R M A process that has one as a valid root of the characteristic polynomial equation [79]. Time series with unit roots are nonstationary processes [77]. In the case of an A R 1 process, if ϕ 1 = 1 , there will be a unit root; however, the focus is usually on ϕ 1 = 1 when ϕ 1 = 1 . Even if the variance is not constant, the process will exhibit an oscillatory behaviour as the sign is reversed in every step, which we would argue is a less pathological case than when ϕ 1 = 1 . Consider the unit root x t = x t 1 + ε t ; this is an integrated I 1 process which can be turned into a stationary process via first differences: Δ x t = ε t . If the A R p process has all its characteristic polynomial roots with an absolute value greater than one, such a process is taken to be causal and will also be stationary [79].
Unless otherwise noted, the null hypothesis is defined as an A R 1 model x t = ϕ 1 x t 1 + ε t where ϕ 1 = 1. This corresponds to a nonstationary I 1 process. This is not very usual in statistics where the multiplier is typically considered to be 0 under the null hypothesis—as in a t-test—for the coefficient of a linear regression model.

2.2.2. Augmented Dickey–Fuller Unit Root Test (ADF URT)

This is an extension of the Dickey–Fuller unit root test for A R M A models [80,81].
The model for a Dickey–Fuller unit root test is expressed as:
  y t = ϕ 1 y t 1 + ε t ;           ε t ~ i . i . d .   N 0 , 1 ;     y t = 0   ,
While the model for Augmented Dickey Fuller unit root test is expressed as:
Δ y t = α + δ t + β y t 1 + i = 1 n y i Δ y t i + ε t
where Δ is the difference operator and ε t represent 0 mean.
Hypothesis y t is considered to be I 1 , which is equivalent to Δ y t being I ( 0 ) in which case β would be zero. The test statistic is the standard regression t-statistic t β = β s . e . β   . A normalized bias test statistic can be used as well. The critical values for these test statistics were derived from a nonstandard distribution. They are the same as the standard Dickey–Fuller critical values which depend on the form of the deterministic components [80,81]. The lagged differences allow correcting for serial correlation in the innovations. The ADF URT is sensitive to the choice of the number of l a g s   n . Therefore, Ng and Perron [82] proposed an iterative method to determine the lag length based on choosing the largest lag where the t -ratio of γ i is still significant. The results of this analysis are presented in the table below.

2.2.3. Cointegration Test

Linear relationships involving integrated nonstationary time series are meaningful only if the time series are cointegrated. While there are various definitions of cointegration, Engle and Granger [83] defined a cointegrating relationship between two or more time-series variables with unit roots I 1   I 1 to exist if there is a linear combination that is stationary, i.e., I 0 . Therefore, two time-series variables, x t and y t , are cointegrated when there exists a number, α 1 , in the linear equation y t = α 1 x t + ν t such that ν t is a stationary process. In an analysis with two variables, this approach can be implemented using the two-step Engle Granger procedure, where the first step consists of using least squares to derive a linear relationship between the two variables, and the second step consists of using a URT on the residuals of the first step’s regression [83].
When there are more than two time series to check for cointegration, there are multiple possible cointegrating relationships, and the Engle Granger two step methodology is not sufficiently flexible. In this case, the most commonly used approach is the Johansen cointegration test [78,84], which is based on the estimation of a pth-order VAR in the k variables. The VAR in the k–vector y is:
  y t = Π 1 y t 1 + Π 2 y t 2 + + Π p y t p + Ψ D t + ε t
where D t is a d-vector of deterministic terms, such as a constant, time trend, and seasonal dummies if necessary. The estimation of the rank of the following matrix Π will approximate the number of possible cointegrating relationships if any as follows:
Π = I Π 1 Π 2 Π p
No assumption is made about the rank of Π . In the decomposition Π = α β , α and β are k   x   k matrices. The goal is to determine whether any columns of β are statistically indistinguishable from zero vectors. The existence of r cointegrating vectors reduces the rank of Π by k r ; that is, if there were r cointegrating relationships between the given variables, then there would be r non-zero eigenvalues in the dynamic system, and k r zero eigenvalues [78]. The methodology is based on canonical correlation analysis.

2.2.4. Granger Causality Test

However, the goal of this research is to not just establish if there is a long-run relationship between the number of Internet searches for sole proprietorship and the number of newly established sole proprietorship businesses but to also establish causality. The goal is to see if changes in one of the two variables influences changes in the other and to also establish the direction of this causation. This means the intention is to establish if there is a unidirectional causality, or a bidirectional one, or none.
Applying the Granger [85] rationale for testing the causality involves implementing F-tests to investigate whether lagged values of a variable Y provide any statistically significant information relative to variable X in the existence of lagged X values. Accordingly, if it does not, then “Y does not Granger-cause X”. Additionally, causality can be separated into long-run and short-run causality [85]. Long-run causality is investigated by error correction models, and the short-run is determined using a Wald test. A vector error correction model (VECM) is applied to confirm the correlation between the variables. However, if there is no cointegration, causality can be examined in the vector autoregressive (VAR) model specified in the first difference [75,86].
To test if X granger causes Y, we need to determine if any lags are statistically significant in our model. We can do this using a Wald test for linear restrictions [87]. The Wald test is based on the fairly simple premise that we wish to compare the performance of a restricted model for Y, which excludes X, against an unrestricted model for Y, which includes X.
When testing for Granger causality, we test the null hypothesis of non-causality,
H 0 : β 2 , 1 = β 2 , 2 = β 2 , 3 = = β 2 , p = 0  
The Wald test statistic follows a ꭓ2 distribution.
The Wald test statistic is mathematically given as:
  W = β ^ β 0 2 v a r β ^
We are more likely to reject the null hypothesis of non-causality as the test statistic gets larger.
We should test both directions, X Y and Y X .
The table below shows the results for the Granger causality Wald test.

2.2.5. Vector Error Correction Model (VECM)

It can be understood that cointegration indicates the presence of causality among two time series, but it does not detect the direction of the causal relationship. According to Engle and Granger [83], the presence of cointegration among the variables show a unidirectional or bi-directional Granger causality among the variables. Further, they demonstrate the cointegration variables can be specified by an error correction mechanism (ECM) that can be estimated by applying standard methods and diagnostic tests. The VECM regression equation can be expressed as follows:
Δ y t = α 1 + p 1 e c m 1 t 1 + i = 0 n β i Δ y t i + i = 0 n δ i Δ x t i + i = 0 n γ i Δ z t i + ε 1 t  
Δ x t = α 2 + p 2 e c m 2 t 1 + i = 0 n β i Δ y t i + i = 0 n δ i Δ x t i + i = 0 n γ i Δ z t i + ε 2 t
where β i , δ i , and γ i are the short-run coefficients, Δ is the symbol of difference operator, p is the lag order, e c m 1 t 1 and e c m 2 t 1 are the error correction term (ECT), and ε 1 t and ε 2 t are the residuals. Further, the e c m 1 t 1 is the lagged value of the residuals derived from the cointegrating regression of y on x (Equation (11)), whereas the e c m 2 t 1 is the lagged value of the residuals derived from the cointegrating regression of x on y (Equation (12)).

3. Results

3.1. Trends and Mean

Figure 1 above shows the trend patterns of newly established sole proprietorship businesses for all the four regions under study. The pattern of variation for the individual series are very similar to each other. It shows that for the period under review, the trend for all four regions is similar.
The mean result for newly established sole proprietorship businesses in the Chelyabinsk region was 15,460.33, while the mean results were 12,675.42, 16,380.13, and 20,174.33 for the Krasnoyarsk, Novosibirsk and Sverdlovsk regions, respectively.
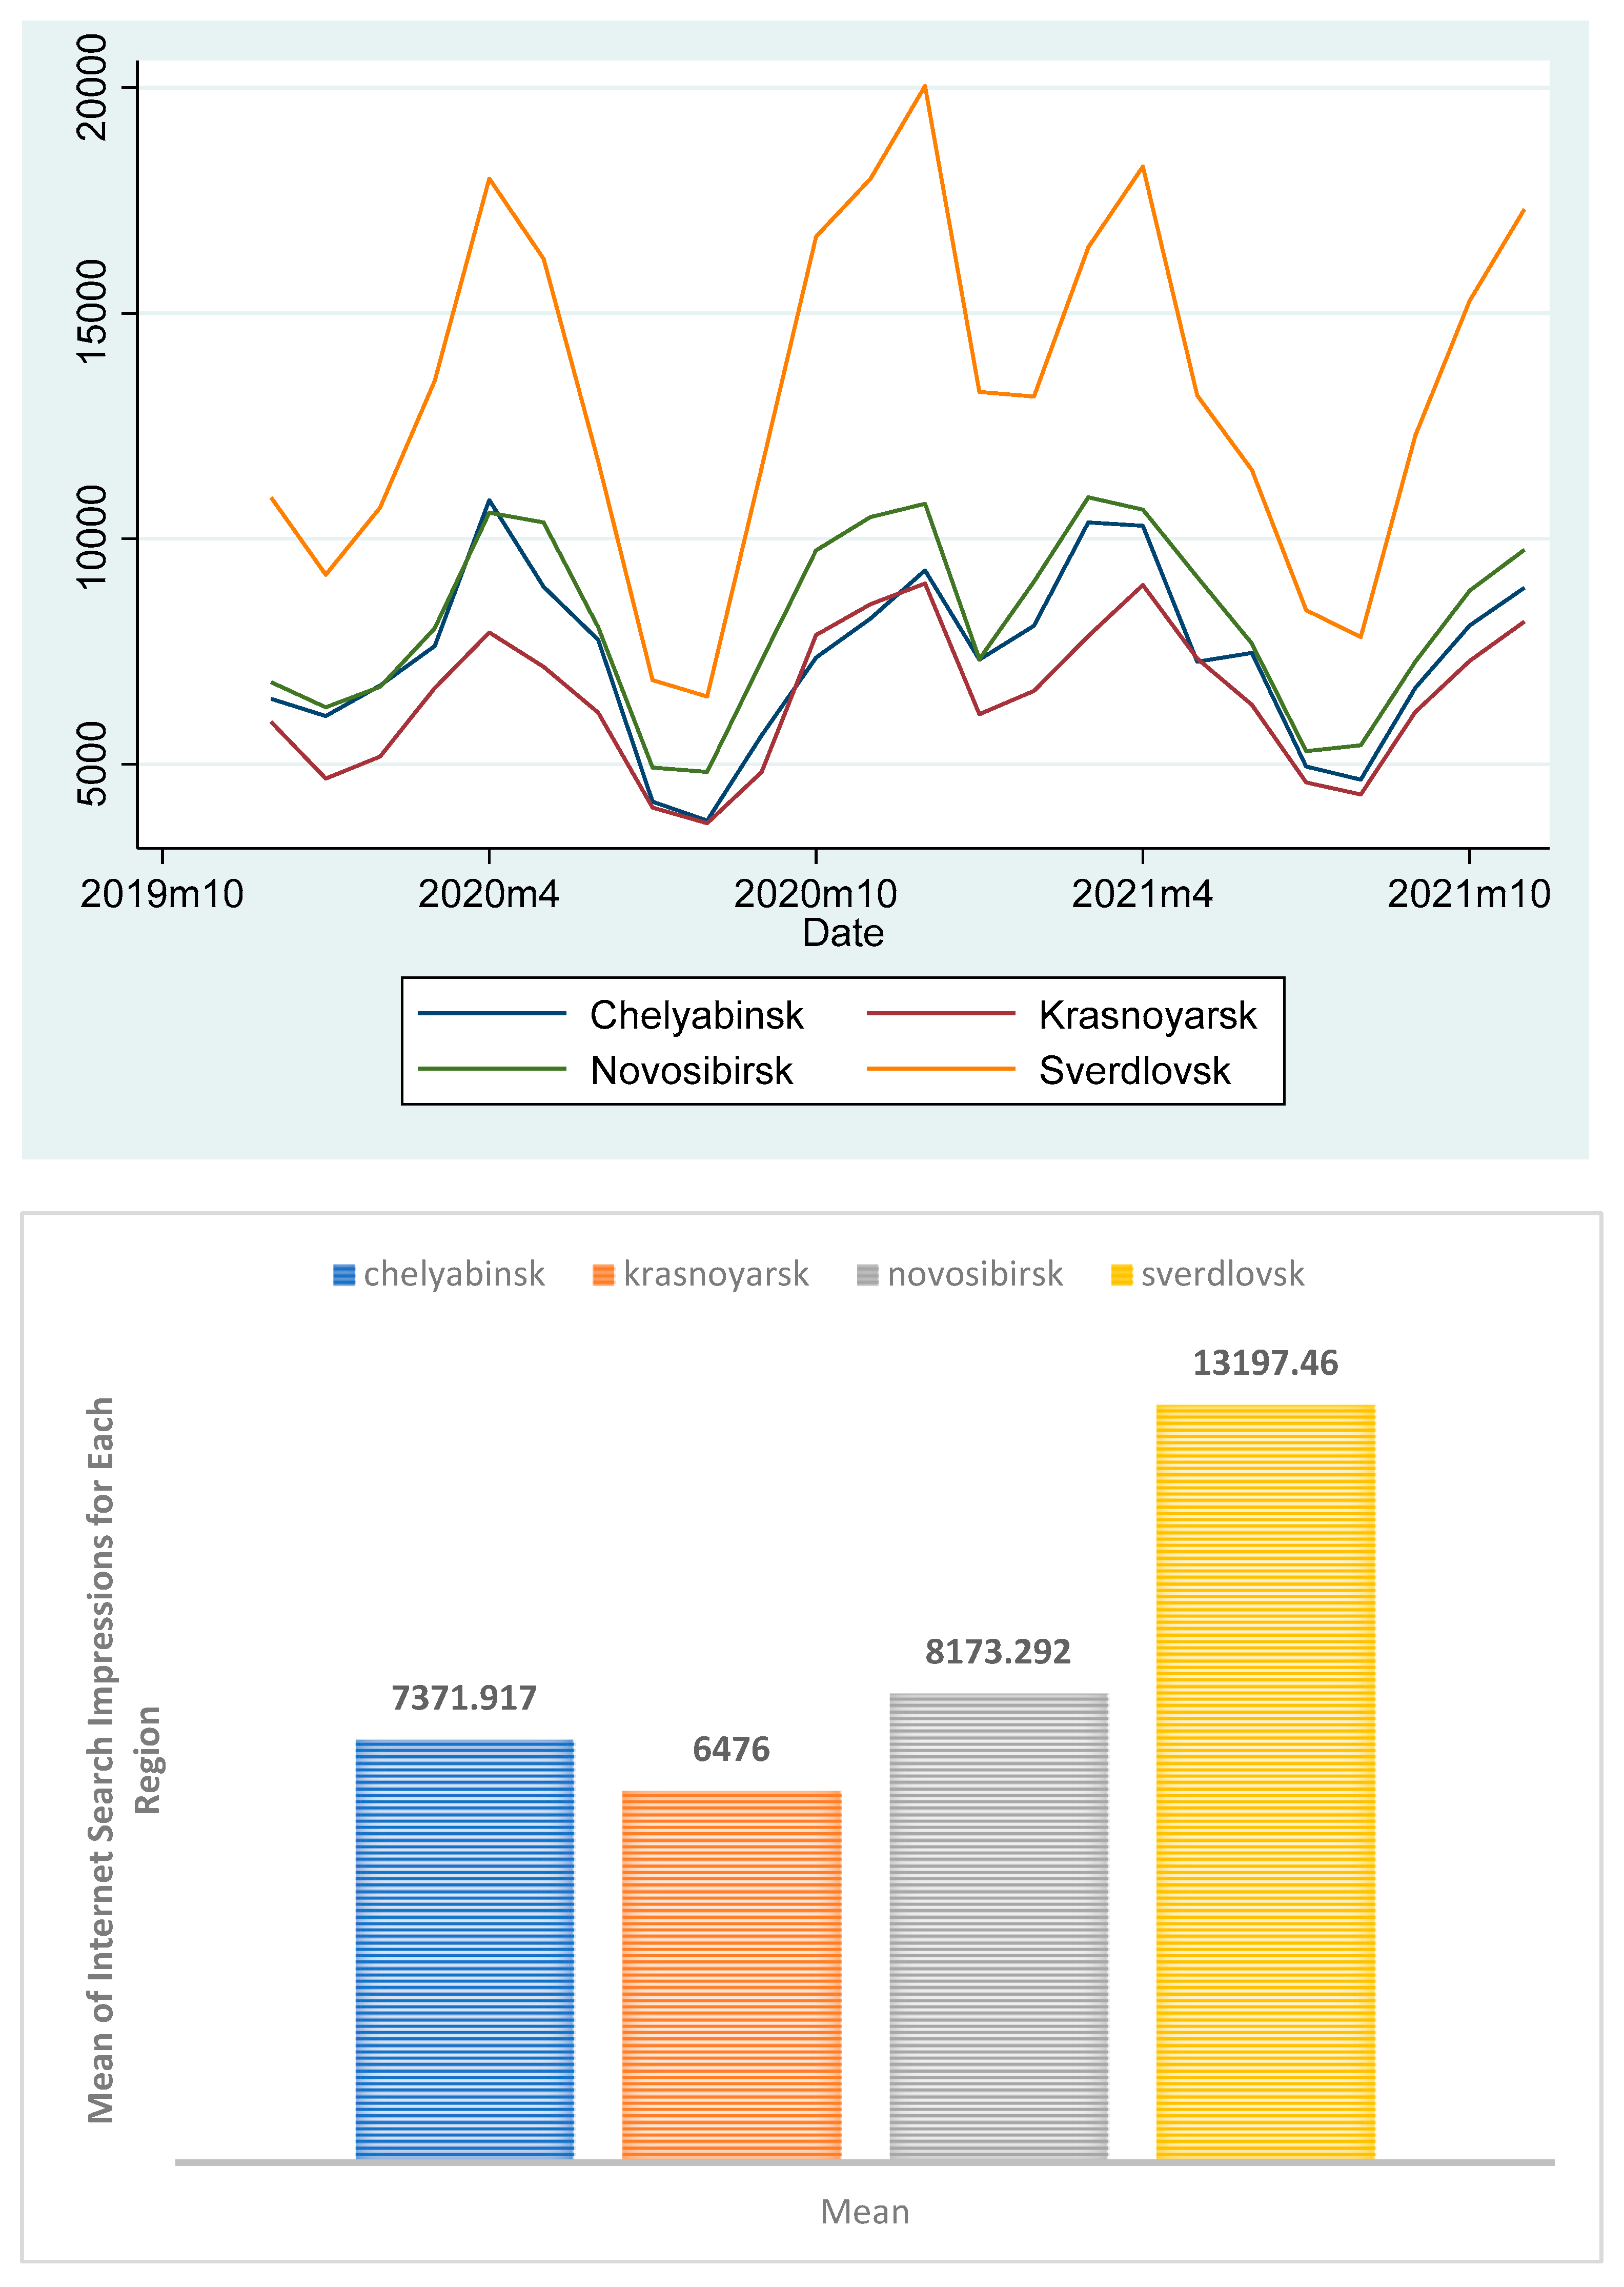
Figure 2 above shows that while the number of Internet searches are quite higher for the Sverdlovsk region, the trends for all four regions are fairly similar.
We also analysed the mean results for Internet searches on the words ‘sole proprietorships’ in all four regions. The results show a mean of 7371.917 for the Chelyabinsk region, 6476 for Krasnoyarsk krai, 8173.292 for the Novosibirsk region, and 13,197.46 for the Sverdlovsk region.

3.2. Unit Root Results

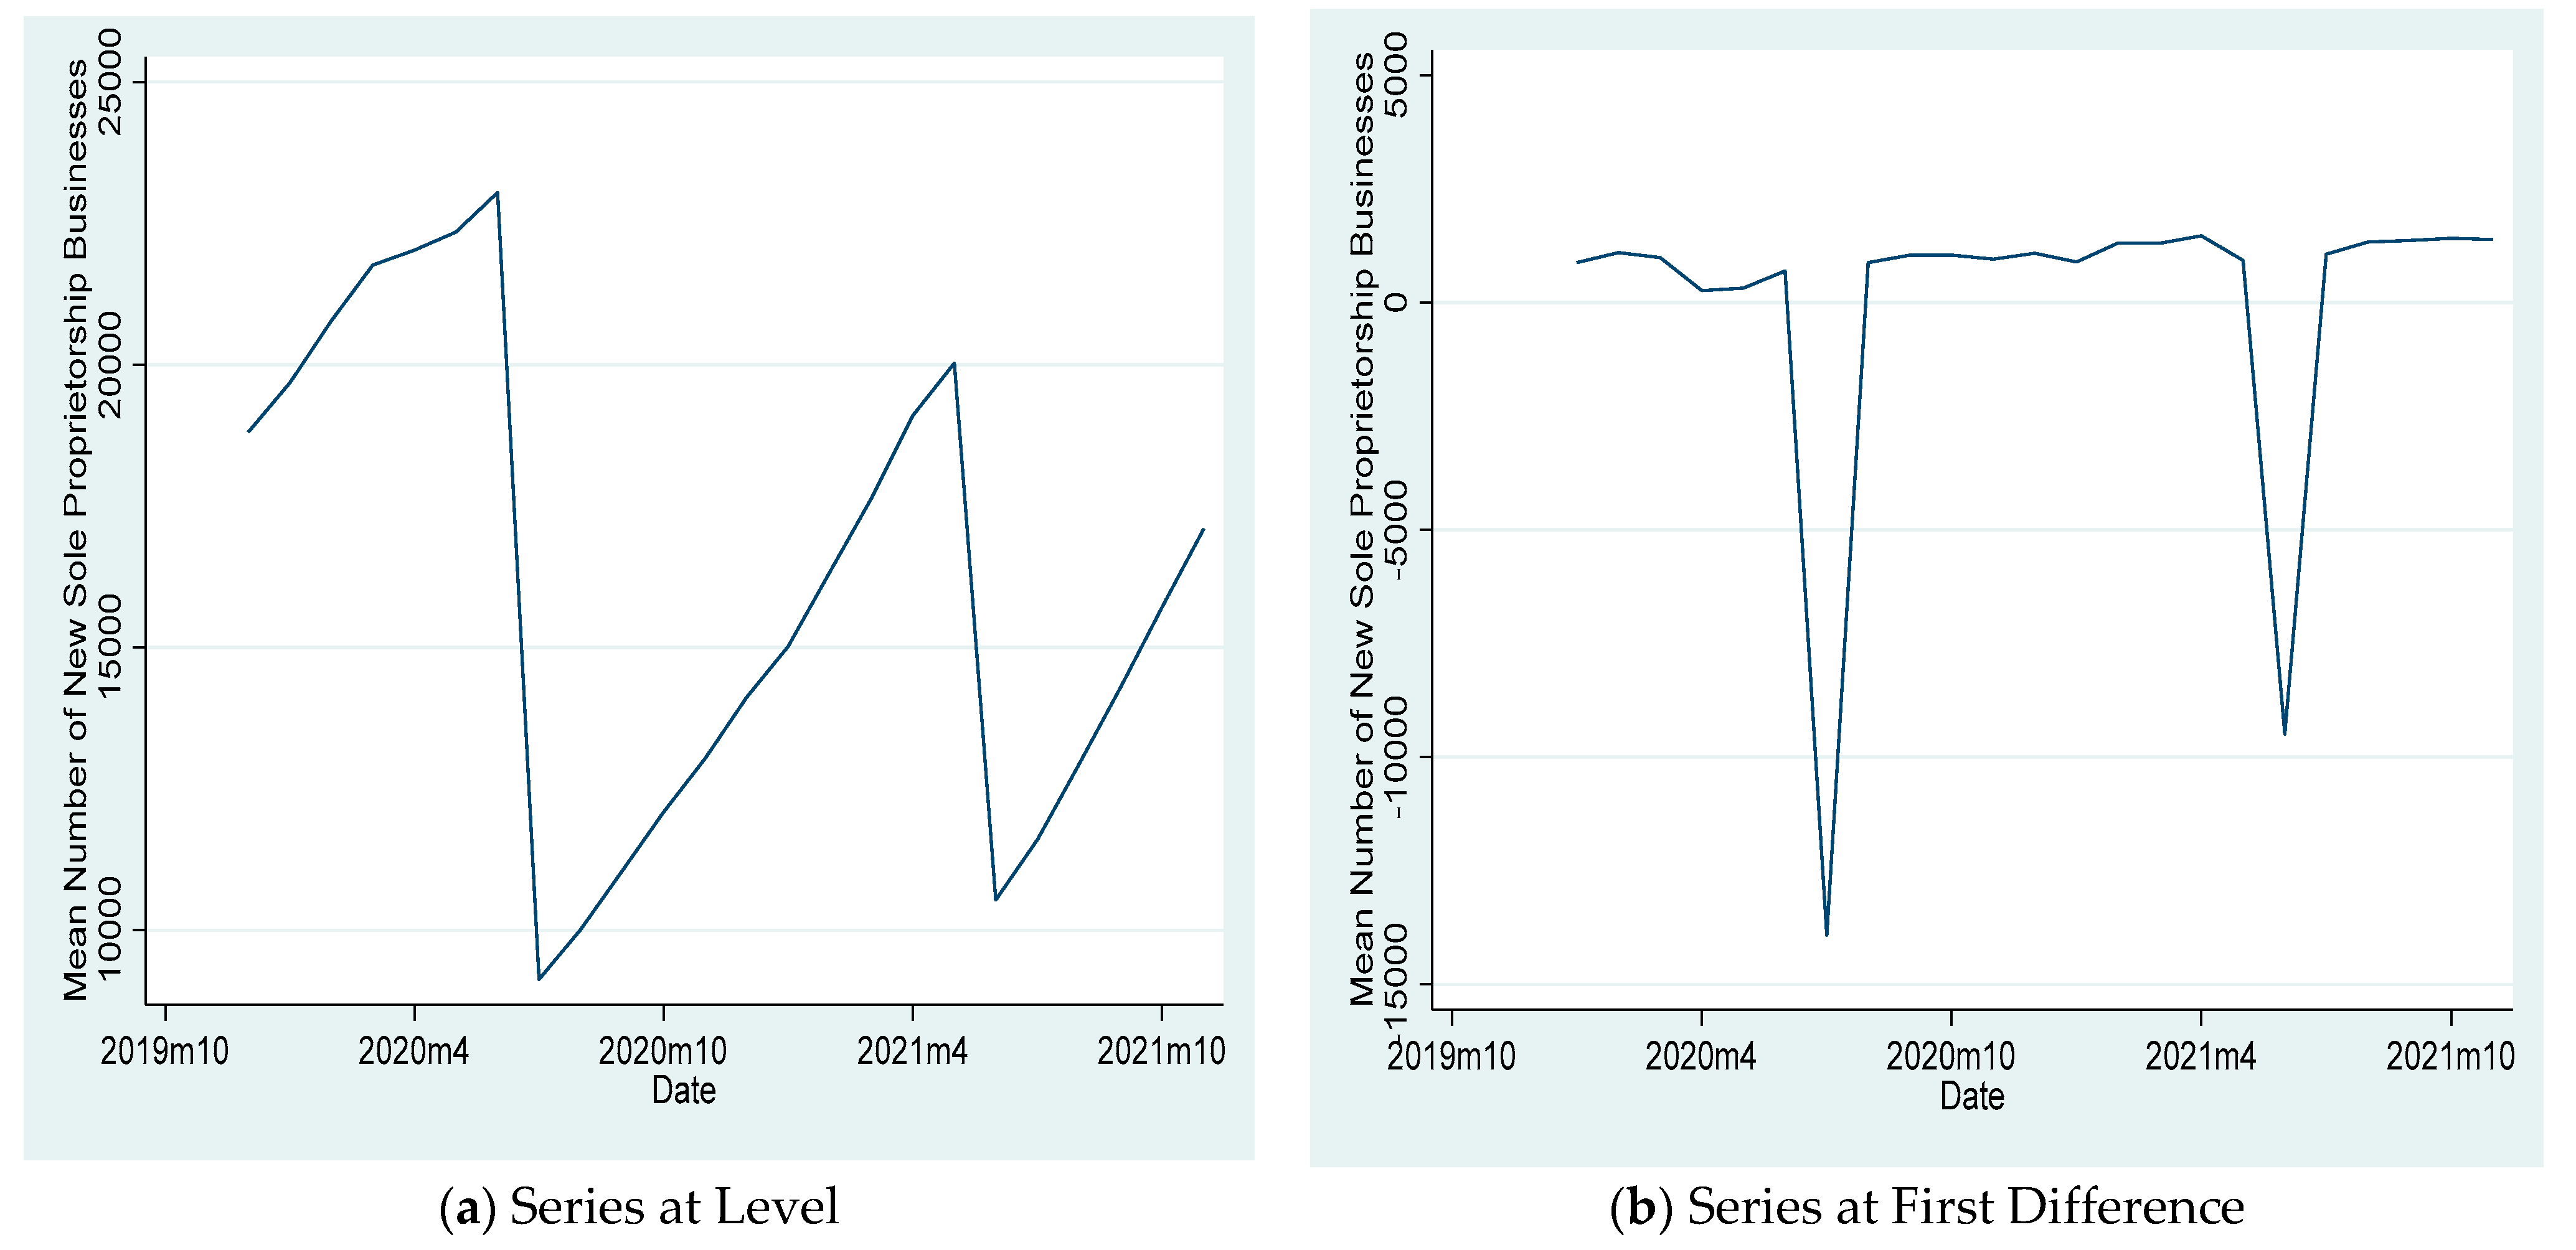
Figure 3a,b show the pattern of the number of newly established sole proprietorship businesses at level and at first difference. There is a slight downward trend at level which makes the series non-stationary as evident in the unit root test in Table 1. The graph of the first difference shows the series is stationary after the first difference.
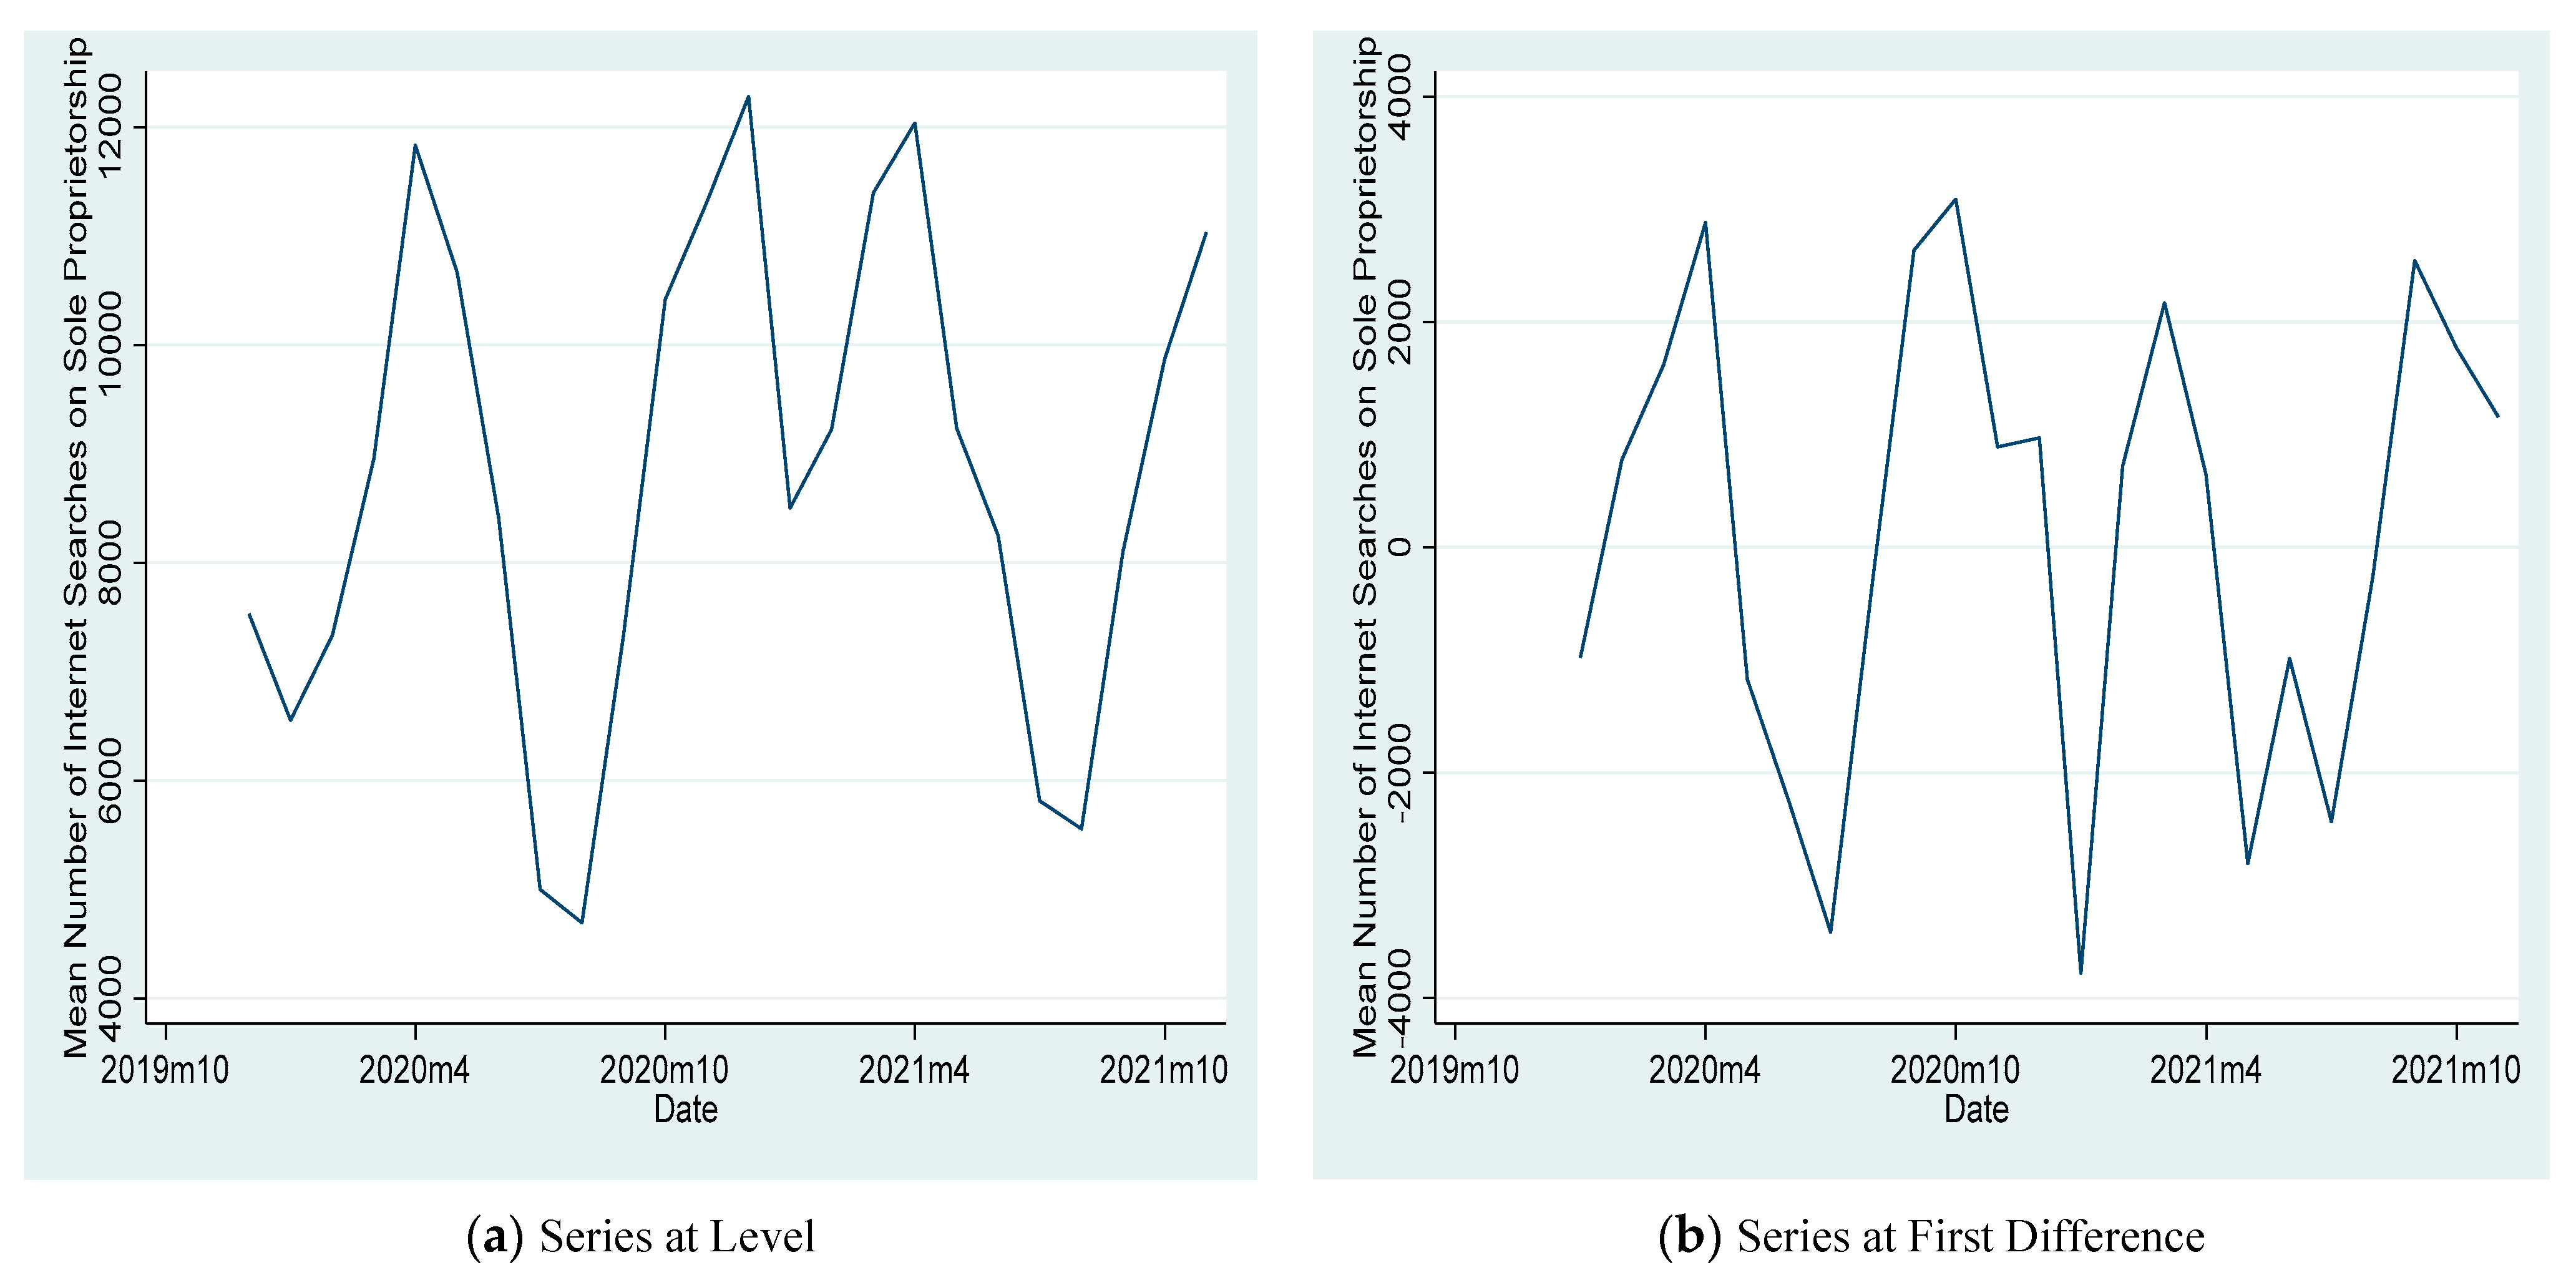
Figure 4a,b show the pattern of the number of Internet searches on sole proprietorship at the level series and at the first difference. Though the trend in the graph of the series at level is not obvious, the series is non-stationary as evident in the unit root test in Table 1. The graph of the first difference shows the series is stationary after the first difference.
From Table 1, both variables were found to be non-stationary at level (p > 0.05). At first difference, both variables were found to be stationary (p < 0.05).

3.3. Results for Cointegration and Causality

The statements in Table 2 and Table 3 are the null hypotheses statements of the tests. The results in Table 2 show a long-run relationship exists between the two variables at p < 0.005. The first p-value of 0.562 is greater than the 0.05 significance level (p > 0.05), indicating we should fail to reject the corresponding null hypothesis. In contrast, the second p-value of 0.021 is less than 0.05 (p < 0.05), making us reject the corresponding null hypothesis. Therefore, we can conclude the causality is unidirectional, meaning the mean of Internet searches for sole proprietorship Granger causes the mean of newly established sole proprietorship businesses in the four regions under study, not the other way around.
Having established a causal relationship between the mean for Internet searches and the mean for individual entrepreneurs as a unidirectional relationship from the former to the latter (Table 3), we proceeded to state the fitted VECM model. The results show this causal relationship is a long-run relationship (Table 4). Though interpreting a VECM equation is not always encouraged, it can still be said that for every unit change in the Internet searches for sole proprietorship, there is a −1.516 response in the number of newly established sole proprietorship businesses.
A number of tests were conducted on the robustness, sensitivity, and stability of the results. They include an orthogonalized impulse response function (Figure S1), a Lagrange multiplier test (Table S1), a stability test (Figure S2), and a forecast (Figure S3); all are included as a Supplementary File.

4. Discussion

The dominance of the Internet in our lives means we are currently living in the most data-rich period in history [88]. In particular, the global use of search engines to obtain information have made them some of the most important repositories of data in the world. For example, for COVID-19, Google search data has been accurately used to predict outbreaks, analyse population concerns, monitor sanitation practices, and investigate well-being, among others [89,90,91]. Nevertheless, while there has been an increase in the use of search engine data to predict and investigate attention, intention, and behaviour in business, economics, and finance [61,62,66], there have been very little on entrepreneurship and almost none on sole proprietorships. This research aspired to fill this gap. The paper began by examining the trends in the four regions of Sverdlovsk, Novosibirsk, Chelyabinsk, and Krasnoyarsk krai for both the number of newly registered sole proprietorship businesses and the number of Internet searches for sole proprietorship. The results (Figure 1 and Figure 2) showed a similar trend for all four regions, although the Sverdlovsk region had a higher number. Therefore, to simplify the analytical process, the mean of all four regions was used for all further analyses. Furthermore, due to the nature of this research, a unit root test (Figure 3 and Figure 4)—which is frequently used for research of this kind—was carried out [76,84,86] and included the augmented Dickey–Fuller test [80,81]. The results were non-stationary at level and stationary at first difference for both the number of Internet searches and the number of newly registered sole proprietorship businesses (Table 1). Additionally, the co-integration test (Table 2) revealed a long-run relationship between the two variables of Internet searches and the number of newly registered sole proprietorship businesses. This is in contrast with a similar study in Vietnam which found no long-run relationship between Google keywords and its influence on entrepreneurs [92]. The results of the Granger Wald test [85,87] and the VECM [83] confirmed the central hypothesis of this research, revealing a unidirectional relationship between Internet search data and newly created sole proprietorship businesses. This means that Internet searches on sole proprietorships lead to the creation of new sole proprietorship businesses in the four regions, and this causal relationship exists in the long run (Table 3 and Table 4).
The implications of these are immense. The results show Internet search data as an excellent aggregator of the attention and intention of entrepreneurs. This can be somewhat explained by the extraordinary amount of time most people spend online. Moreover, the result confirms prior studies which found search engine data can lead to real-world entrepreneurial, financial, and economic action [61,62,66]. For future academic research, we recommend including search engine data as a tool for measuring and analysing entrepreneurial activity. It can be used to enrich existing panel data and for developing more accurate forecasts of future entrepreneurial activity. In addition, search engine data can also provide an important resource for policy formulation, especially because search engine data can be retrieved well in advance of official data. It can be used to complement existing data and can be particularly helpful for examining the pulse of newly introduced polices before official data are released. This enhances dynamism in the policy formulation process. Using search engine data can provide quicker feedbacks and empower policy makers to tweak poorly performing entrepreneurship policies or intensify highly performing ones well in advance of official data. Finally, search engine data can also be included in any future strategies for developing modern entrepreneurial ecosystems.

5. Conclusions

We presented an empirical assessment of how search engine data can be used to accurately measure the attention and intention of nascent entrepreneurs. This was done using data obtained from the Yandex search engine and the Federal Tax Service of Russia. Our research provides a robust quantitative assessment to guarantee the accuracy of our results. First, to navigate research as complex as this, we took the mean of both the dependent and independent variables and proceeded to more advanced analyses, including the augmented Dickey–Fuller unit root test, the Johansen cointegration test, the Granger causality Wald test, and the vector error correction model (VECM) model. Our analyses revealed a unidirectional causal relationship between search engine data and newly created sole proprietorship/individual entrepreneurship businesses. This revealed that searching for information on individual entrepreneurship on search engines eventually led to the creation of new individual entrepreneurship businesses in the four regions under study. We hope this research would encourage further studies on the topic in other parts of the world.
This study is not without limitations. First, this research is experimental and should be considered a baseline for future studies. The results should be carefully interpreted to reflect this. Additionally, it is limited to regions in Russia and might not be directly generalizable to other parts of the world. Furthermore, the data used for this research only cover the period between December 2019 and December 2021. Therefore, further studies in other regions and countries and those examining a longer and more recent timeframe are strongly encouraged. Additional control variables may be needed to provide definitive conclusions to the results.

Supplementary Materials

The following supporting information can be downloaded at: https://www.mdpi.com/article/10.3390/su15065053/s1, Figure S1: Orthogonalized Impulse Response Function; Table S1: Lagrange multiplier test; Figure S2: Stability test; Figure S3: Forecast.

Author Contributions

Conceptualization, M.O.; methodology, M.O.; software, M.O.; validation, M.O., H.H. and N.M.A.-R.; formal analysis, M.O.; investigation, M.O.; resources, H.H. and N.M.A.-R.; data curation, M.O.; writing—original draft preparation, M.O.; writing—review and editing, M.O.; visualization, M.O., H.H. and N.M.A.-R.; supervision, H.H. and N.M.A.-R.; project administration, M.O., H.H. and N.M.A.-R.; funding acquisition, H.H. and N.M.A.-R. All authors have read and agreed to the published version of the manuscript.

Funding

The authors are grateful to Zarqa University, Zarqa, Jordan for the financial support granted to cover the publication fee of this article. Additionally, author M.O. acknowledges funding from the Ministry of Science and Higher Education of the Russian Federation (Ural Federal University project within the Priority-2030 program).

Institutional Review Board Statement

Not applicable.

Informed Consent Statement

Not applicable.

Data Availability Statement

All research materials can be downloaded at the Open Science Framework: https://osf.io/hcv9g/?view_only=beba8392358a4ee7b5e55288c05245a0 accessed on 20 September 2022.

Acknowledgments

The authors are grateful for the constructive feedback from two anonymous reviewers.

Conflicts of Interest

The authors declare no conflict of interest.

References

  1. Sexton, D.L. The Field of Entrepreneurship: Is It Growing or Just Getting Bigger? J. Small Bus. Manag. 1988, 26, 4–8. [Google Scholar]
  2. Shane, S. Prior Knowledge and the Discovery of Entrepreneurial Opportunities. Organ. Sci. 2000, 11, 448–469. [Google Scholar] [CrossRef]
  3. Habert, R.F.; Link, A.N. In Search of the Meaning of Entrepreneurship. Small Bus. Econ. 1989, 1, 39–49. [Google Scholar] [CrossRef]
  4. Bhave, M.P. A Process Model of Entrepreneurial Venture Creation. J. Bus. Ventur. 1994, 9, 223–242. [Google Scholar] [CrossRef]
  5. Fritsch, M.; Mueller, P. Effects of New Business Formation on Regional Development over Time. Reg. Stud. 2004, 38, 961–975. [Google Scholar] [CrossRef] [Green Version]
  6. Fritsch, M.; Wyrwich, M. The Effect of Entrepreneurship on Economic Development—An Empirical Analysis Using Regional Entrepreneurship Culture. J. Econ. Geogr. 2017, 17, 157–189. [Google Scholar] [CrossRef]
  7. Baptista, R.; Escária, V.; Madruga, P. Entrepreneurship, Regional Development and Job Creation: The Case of Portugal. Small Bus. Econ. 2007, 30, 49–58. [Google Scholar] [CrossRef] [Green Version]
  8. van Stel, A.; Storey, D. The Link between Firm Births and Job Creation: Is There a Upas Tree Effect? Reg. Stud. 2004, 38, 893–909. [Google Scholar] [CrossRef]
  9. Malchow-Møller, N.; Schjerning, B.; Sørensen, A. Entrepreneurship, Job Creation and Wage Growth. Small Bus. Econ. 2011, 36, 15–32. [Google Scholar] [CrossRef]
  10. Roundy, P.T.; Fayard, D. Dynamic Capabilities and Entrepreneurial Ecosystems: The Micro-Foundations of Regional Entrepreneurship. J. Entrep. 2019, 28, 94–120. [Google Scholar] [CrossRef]
  11. Rogalska, E. Multiple-Criteria Analysis of Regional Entrepreneurship Conditions in Poland. Equilibrium 2018, 13, 707–723. [Google Scholar] [CrossRef] [Green Version]
  12. Content, J.; Frenken, K.; Jordaan, J.A. Does Related Variety Foster Regional Entrepreneurship? Evidence from European Regions. Reg. Stud. 2019, 53, 1531–1543. [Google Scholar] [CrossRef] [Green Version]
  13. Cumming, D.; Johan, S. The Differential Impact of the Internet on Spurring Regional Entrepreneurship. Entrep. Theory Pract. 2010, 34, 857–884. [Google Scholar] [CrossRef]
  14. Vlasov, M.; Polbitsyn, S.N.; Olumekor, M.; Oke, A. The Influence of Socio-Cultural Factors on Knowledge-Based Innovation and the Digital Economy. J. Open Innov. Technol. Mark. Complex. 2022, 8, 194. [Google Scholar] [CrossRef]
  15. Xing, Y.; Liu, Y.; Cooper, S.C.L. Local Government as Institutional Entrepreneur: Public–Private Collaborative Partnerships in Fostering Regional Entrepreneurship. Br. J. Manag. 2018, 29, 670–690. [Google Scholar] [CrossRef]
  16. Sternberg, R. Do EU Regional Policies Favour Regional Entrepreneurship? Empirical Evidence from Spain and Germany. Eur. Plan. Stud. 2012, 20, 583–608. [Google Scholar] [CrossRef]
  17. Huggins, R.; Morgan, B.; Williams, N. Regional Entrepreneurship and the Evolution of Public Policy and Governance. J. Small Bus. Enterp. Dev. 2015, 22, 473–511. [Google Scholar] [CrossRef]
  18. Olumekor, M. Public Sector Entrepreneurship: Scientific Mapping and Research Agenda. Organizacija 2022, 55, 259–271. [Google Scholar] [CrossRef]
  19. Fritsch, M.; Wyrwich, M. The Long Persistence of Regional Entrepreneurship Culture: Germany 1925–2005. SSRN Electron. J. 2012, 1224. [Google Scholar] [CrossRef] [Green Version]
  20. Tamásy, C. Determinants of Regional Entrepreneurship Dynamics in Contemporary Germany: A Conceptual and Empirical Analysis. Reg Stud. 2006, 40, 365–384. [Google Scholar] [CrossRef]
  21. Kim, Y.; Kim, W.; Yang, T. The Effect of the Triple Helix System and Habitat on Regional Entrepreneurship: Empirical Evidence from the U.S. Res. Policy 2012, 41, 154–166. [Google Scholar] [CrossRef]
  22. Olumekor, M.; Polbitsyn, S. Online Consumer Behaviour: Opportunities and Challenges for the Elderly. In Proceedings of the European Conference on Innovation and Entrepreneurship 2021, Virtual, 16–17 September 2021; pp. 1190–1195. [Google Scholar]
  23. Wagner, J. Nascent and Infant Entrepreneurs in Germany: Evidence from the Regional Entrepreneurship Monitor (Rem). SSRN Electron. J. 2005, 684007. [Google Scholar] [CrossRef]
  24. SBA. SBA Sole Proprietorship 2015; SBA: Washington, DC, USA, 2015.
  25. Jones, P.; Simmons, G.; Packham, G.; Beynon-Davies, P.; Pickernell, D. An Exploration of the Attitudes and Strategic Responses of Sole-Proprietor Micro-Enterprises in Adopting Information and Communication Technology. Int. Small Bus. J. Res. Entrep. 2014, 32, 285–306. [Google Scholar] [CrossRef]
  26. Collins-Dodd, C.; Gordon, I.M.; Smart, C. Further Evidence on the Role of Gender in Financial Performance. J. Small Bus. Manag. 2004, 42, 395–417. [Google Scholar] [CrossRef]
  27. Federal Tax Service Unified Register of Small and Medium-Sized Businesses 2021. Available online: https://ofd.nalog.ru/ (accessed on 15 January 2022).
  28. Department for Business, Energy & Induatrial Strategy. Business Population Estimates for the UK and Regions 2021: Statistical Release (HTML) 2021; Department for Business, Energy & Induatrial Strategy: London, UK, 2021.
  29. Pomerleau, K. An Overview of Pass-through Businesses in the United States; Tax Foundation: Washington, DC, USA, 2015. [Google Scholar]
  30. Cesaroni, F.M.; Sentuti, A. Access to Bank Credit during the Economic Crisis: A Comparison between Italian Male and Female Entrepreneurs. In Proceedings of the European Conference on Innovation and Entrepreneurship, Genoa, Italy, 17–18 September 2015; Volume 2015, pp. 121–129. [Google Scholar]
  31. Cesaroni, F.M.; Pediconi, M.G.; Sentuti, A. It’s Always a Women’s Problem! Micro-Entrepreneurs, Work-Family Balance and Economic Crisis. Adm. Sci. 2018, 8, 74. [Google Scholar] [CrossRef] [Green Version]
  32. Boden, R.J., Jr.; Nucci, A.R. On the Survival Prospects of Men’s and Women’s New Business Ventures. J. Bus. Ventur. 2000, 15, 347–362. [Google Scholar] [CrossRef]
  33. Cesaroni, F.M.; Sentuti, A.; Buratti, A. Same Crisis, Different Strategies? Italian Men and Women Entrepreneurs in Front of the Economic Recession. J. Res. Gend. Stud. 2015, 5, 205–231. [Google Scholar]
  34. Carroll, R.; Holtz-Eakin, D.; Rider, M.; Rosen, H.S. Income Taxes and Entrepreneurs’ Use of Labor. J. Labor Econ. 2000, 18, 324–351. [Google Scholar] [CrossRef]
  35. Power, L.; Rider, M. The Effect of Tax-Based Savings Incentives on the Self-Employed. J. Public Econ. 2002, 85, 33–52. [Google Scholar] [CrossRef]
  36. McKerchar, M.; Bloomquist, K.; Pope, J. Indicators of Tax Morale: An Exploratory Study. Ejournal Tax Res. 2013, 11, 5–22. [Google Scholar]
  37. Storey, D.J. The Role of Legal Status in Influencing Bank Financing and New Firm Growth. Appl. Econ. 1994, 26, 129–136. [Google Scholar] [CrossRef]
  38. Leibowitz, A.; Tollison, R. Free Riding, Shirking, and Team Production in Legal Partnerships. Econ. Inq. 1980, 18, 380–394. [Google Scholar] [CrossRef]
  39. Crusto, M.F. Extending the Veil to Solo Entrepreneurs: A Limited Liability Sole Proprietorship Act (LLSP). Columbia Bus. Law Rev. 2001, 2001, 381. [Google Scholar]
  40. Haynes, G.W.; Walker, R.; Rowe, B.R.; Hong, G.-S. The Intermingling of Business and Family Finances in Family-Owned Businesses. Fam. Bus. Rev. 1999, 12, 225–239. [Google Scholar] [CrossRef]
  41. Fiegener, M.K. Locus of Ownership and Family Involvement in Small Private Firms. J. Manag. Stud. 2010, 47, 296–321. [Google Scholar] [CrossRef]
  42. Stewart, S.A.; Hoell, R.C. Hire Someone like Me, or Hire Someone I Need: Entrepreneur Identity and Early-Stage Hiring in Small Firms. J. Small Bus. Entrep. 2016, 28, 187–201. [Google Scholar] [CrossRef]
  43. Toivanen, S.; Griep, R.H.; Mellner, C.; Vinberg, S.; Eloranta, S. Mortality Differences between Self-Employed and Paid Employees: A 5-Year Follow-up Study of the Working Population in Sweden. Occup. Environ. Med. 2016, 73, 627–636. [Google Scholar] [CrossRef]
  44. Xiao, J.J.; Alhabeeb, M.J.; Hong, G.-S.; Haynes, G.W. Attitude toward Risk and Risk-Taking Behavior of Business-Owning Families. J. Consum. Aff. 2001, 35, 307–325. [Google Scholar] [CrossRef] [Green Version]
  45. Vincent, V.C. Decision-Making Policies among Mexican-American Small Business Entrepreneurs. J. Small Bus. Manag. 1996, 34, 1. [Google Scholar]
  46. Ostrow, L.; Nemec, P.B.; Smith, C. Self-Employment for People with Psychiatric Disabilities: Advantages and Strategies. J. Behav. Health Serv. Res. 2019, 46, 686–696. [Google Scholar] [CrossRef]
  47. Baik, Y.-S.; Lee, S.-H.; Lee, C. Entrepreneurial Firms’ Choice of Ownership Forms. Int. Entrep. Manag. J. 2015, 11, 453–471. [Google Scholar] [CrossRef]
  48. Li, T.; Li, Y.; Hoque, M.A.; Xia, T.; Tarkoma, S.; Hui, P. To What Extent We Repeat Ourselves? Discovering Daily Activity Patterns Across Mobile App Usage. IEEE Trans Mob Comput. 2022, 21, 1492–1507. [Google Scholar] [CrossRef]
  49. Omar, H.; Hoang, V.H.; Liu, D.-R. A Hybrid Neural Network Model for Sales Forecasting Based on ARIMA and Search Popularity of Article Titles. Comput. Intell. Neurosci. 2016, 2016. [Google Scholar] [CrossRef] [PubMed] [Green Version]
  50. Wachter, P.; Widmer, T.; Klein, A. Predicting Automotive Sales Using Pre-Purchase Online Search Data. In Proceedings of the 2019 Federated Conference on Computer Science and Information Systems, Leipzig, Germany, 1–4 September 2019; pp. 569–577. [Google Scholar]
  51. Yuan, F.-C.; Lee, C.-H. Intelligent Sales Volume Forecasting Using Google Search Engine Data. Soft Comput. 2020, 24, 2033–2047. [Google Scholar] [CrossRef]
  52. Barreira, N.; Godinho, P.; Melo, P. Nowcasting Unemployment Rate and New Car Sales in South-Western Europe with Google Trends. NETNOMICS Econ. Res. Electron. Netw. 2013, 14, 129–165. [Google Scholar] [CrossRef]
  53. Li, X.; Zhang, X.; Wang, S.; Ma, J. Attention Matters: An Exploration of Relationship Between Google Search Behaviors and Crude Oil Prices. J. Syst. Sci. Complex. 2019, 32, 1438–1459. [Google Scholar] [CrossRef]
  54. Siliverstovs, B.; Wochner, D.S. Google Trends and Reality: Do the Proportions Match?: Appraising the Informational Value of Online Search Behavior: Evidence from Swiss Tourism Regions. J. Econ. Behav. Organ. 2018, 145, 1–23. [Google Scholar] [CrossRef]
  55. Höpken, W.; Eberle, T.; Fuchs, M.; Lexhagen, M. Google Trends Data for Analysing Tourists’ Online Search Behaviour and Improving Demand Forecasting: The Case of Åre, Sweden. Inf. Technol. Tour. 2019, 21, 45–62. [Google Scholar] [CrossRef]
  56. Markey, P.M.; Markey, C.N. Seasonal Variation in Internet Keyword Searches: A Proxy Assessment of Sex Mating Behaviors. Arch. Sex. Behav. 2013, 42, 515–521. [Google Scholar] [CrossRef]
  57. Gunn III, J.F.; Lester, D. Using Google Searches on the Internet to Monitor Suicidal Behavior. J. Affect. Disord. 2013, 148, 411–412. [Google Scholar] [CrossRef]
  58. Lippi, G.; Mattiuzzi, C.; Cervellin, G. Google Search Volume Predicts the Emergence of COVID-19 Outbreaks. Acta Biomed. 2020, 91, e2020006. [Google Scholar] [CrossRef] [PubMed]
  59. Abbas, M.; Morland, T.B.; Hall, E.S.; EL-Manzalawy, Y. Associations between Google Search Trends for Symptoms and COVID-19 Confirmed and Death Cases in the United States. Int. J. Environ. Res. Public Health 2021, 18, 4560. [Google Scholar] [CrossRef]
  60. Wang, H.-W.; Chen, D.-R. Economic Recession and Obesity-Related Internet Search Behavior in Taiwan: Analysis of Google Trends Data. JMIR Public Health Surveill 2018, 4, e7314. [Google Scholar] [CrossRef] [PubMed]
  61. Curme, C.; Preis, T.; Stanley, H.E.; Moat, H.S. Quantifying the Semantics of Search Behavior before Stock Market Moves. Proc. Natl. Acad Sci. USA 2014, 111, 11600–11605. [Google Scholar] [CrossRef] [Green Version]
  62. Chen, H.-Y.; Lo, T.-C. Online Search Activities and Investor Attention on Financial Markets. Asia Pac. Manag. Rev. 2019, 24, 21–26. [Google Scholar] [CrossRef]
  63. Takeda, F.; Wakao, T. Google Search Intensity and Its Relationship with Returns and Trading Volume of Japanese Stocks. Pac. Basin Financ. J. 2014, 27, 1–18. [Google Scholar] [CrossRef]
  64. Aouadi, A.; Arouri, M.; Roubaud, D. Information Demand and Stock Market Liquidity: International Evidence. Econ. Model. 2018, 70, 194–202. [Google Scholar] [CrossRef]
  65. Aouadi, A.; Arouri, M.; Teulon, F. Investor Attention and Stock Market Activity: Evidence from France. Econ. Model. 2013, 35, 674–681. [Google Scholar] [CrossRef]
  66. Bank, M.; Larch, M.; Peter, G. Google Search Volume and Its Influence on Liquidity and Returns of German Stocks. Financ. Mark. Portf. Manag. 2011, 25, 239–264. [Google Scholar] [CrossRef]
  67. Swamy, V.; Dharani, M.; Takeda, F. Investor Attention and Google Search Volume Index: Evidence from an Emerging Market Using Quantile Regression Analysis. Res. Int. Bus. Financ. 2019, 50, 1–17. [Google Scholar] [CrossRef]
  68. Tang, W.; Zhu, L. How Security Prices Respond to a Surge in Investor Attention: Evidence from Google Search of ADRs. Glob. Financ. J. 2017, 33, 38–50. [Google Scholar] [CrossRef]
  69. Ramos, H.P.; Ribeiro, K.K.M.; Perlin, M.S. The Forecasting Power of internet search queries in the brazilian financial market. Ram. Rev. De Adm. Mackenzie 2017, 18, 184–210. [Google Scholar] [CrossRef] [Green Version]
  70. Kim, N.; Lučivjanská, K.; Molnár, P.; Villa, R. Google Searches and Stock Market Activity: Evidence from Norway. Financ. Res. Lett. 2019, 28, 208–220. [Google Scholar] [CrossRef]
  71. Nguyen, D.D.; Pham, M.C. Search-Based Sentiment and Stock Market Reactions: An Empirical Evidence in Vietnam. J. Asian Financ. Econ. Bus. 2018, 5, 45–56. [Google Scholar] [CrossRef]
  72. Perlin, M.S.; Caldeira, J.F.; Santos, A.A.P.; Pontuschka, M. Can We Predict the Financial Markets Based on Google’s Search Queries? J. Forecast. 2017, 36, 454–467. [Google Scholar] [CrossRef]
  73. Olumekor, M.O.; Polo, F. Counterfactual Econometric Analysis on the Admission of Poland to the Eurozone. In Lecture Notes in Networks and Systems; Springer International Publishing: Cham, Switzerland, 2021; Volume 2, pp. 803–815. [Google Scholar]
  74. Choi, I. Unit Root Tests for Panel Data. J. Int. Money Financ. 2001, 20, 249–272. [Google Scholar] [CrossRef]
  75. Maddala, G.S.; Wu, S. A Comparative Study of Unit Root Tests with Panel Data and a New Simple Test. Oxf. Bull. Econ. Stat. 1999, 61, 631–652. [Google Scholar] [CrossRef]
  76. Levin, A.; Lin, C.-F.; James Chu, C.-S. Unit Root Tests in Panel Data: Asymptotic and Finite-Sample Properties. J. Econom. 2002, 108, 1–24. [Google Scholar] [CrossRef]
  77. Im, K.S.; Pesaran, M.H.; Shin, Y. Testing for Unit Roots in Heterogeneous Panels. J. Econom. 2003, 115, 53–74. [Google Scholar] [CrossRef]
  78. Johansen, S.; Juselius, K. Maximum likelihood estimation and inference on cointegration-with applications to the demand for money. Oxf. Bull. Econ. Stat. 2009, 52, 169–210. [Google Scholar] [CrossRef]
  79. Chan, N.H. Time Series: Applications to Finance with R and S-Plus®, 2nd ed.; John Wiley & Sons: Hoboken, NJ, USA, 2011; ISBN 9781118032466. [Google Scholar]
  80. Dickey, D.A.; Fuller, W.A. Distribution of the Estimators for Autoregressive Time Series With a Unit Root. J. Am. Stat. Assoc. 1979, 74, 427. [Google Scholar] [CrossRef]
  81. Dickey, D.A.; Fuller, W.A. Likelihood Ratio Statistics for Autoregressive Time Series with a Unit Root. Econometrica 1981, 49, 1057. [Google Scholar] [CrossRef]
  82. Ng, S.; Perron, P. Unit Root Tests in ARMA Models with Data-Dependent Methods for the Selection of the Truncation Lag. J. Am. Stat. Assoc. 1995, 90, 268–281. [Google Scholar] [CrossRef]
  83. Engle, R.F.; Granger, C.W.J. Co-Integration and Error Correction: Representation, Estimation, and Testing. Econometrica 1987, 55, 251. [Google Scholar] [CrossRef]
  84. Johansen, S. Statistical Analysis of Cointegration Vectors. J. Econ. Dyn. Control. 1988, 12, 231–254. [Google Scholar] [CrossRef]
  85. Granger, C.W.J. Investigating Causal Relations by Econometric Models and Cross-Spectral Methods. Econometrica 1969, 37, 424. [Google Scholar] [CrossRef]
  86. Maddala, G.S.; Kim, I.-M. Unit Roots, Cointegration, and Structural Change; Cambridge University Press: Cambridge, UK, 1999; ISBN 9780521582575. [Google Scholar]
  87. Wald, A. Tests of Statistical Hypotheses Concerning Several Parameters When the Number of Observations Is Large. Trans. Am. Math. Soc. 1943, 54, 426. [Google Scholar] [CrossRef]
  88. Prüfer, J.; Prüfer, P. Data Science for Entrepreneurship Research: Studying Demand Dynamics for Entrepreneurial Skills in the Netherlands. Small Bus. Econ. 2020, 55, 651–672. [Google Scholar] [CrossRef] [Green Version]
  89. Ortiz-Martínez, Y.; Garcia-Robledo, J.E.; Vásquez-Castañeda, D.L.; Bonilla-Aldana, D.K.; Rodriguez-Morales, A.J. Can Google® Trends Predict COVID-19 Incidence and Help Preparedness? The Situation in Colombia. Travel. Med. Infect. Dis. 2020, 37, 101703. [Google Scholar] [CrossRef]
  90. Walker, A.; Hopkins, C.; Surda, P. Use of Google Trends to Investigate Loss-of-smell-related Searches during the COVID-19 Outbreak. Int. Forum Allergy Rhinol. 2020, 10, 839–847. [Google Scholar] [CrossRef] [Green Version]
  91. Brodeur, A.; Clark, A.E.; Fleche, S.; Powdthavee, N. COVID-19, Lockdowns and Well-Being: Evidence from Google Trends. J. Public Econ. 2021, 193, 104346. [Google Scholar] [CrossRef] [PubMed]
  92. Huynh, T.L.D. Which Google Keywords Influence Entrepreneurs? Empirical Evidence from Vietnam. Asia Pac. J. Innov. Entrep. 2019, 13, 214–230. [Google Scholar] [CrossRef]
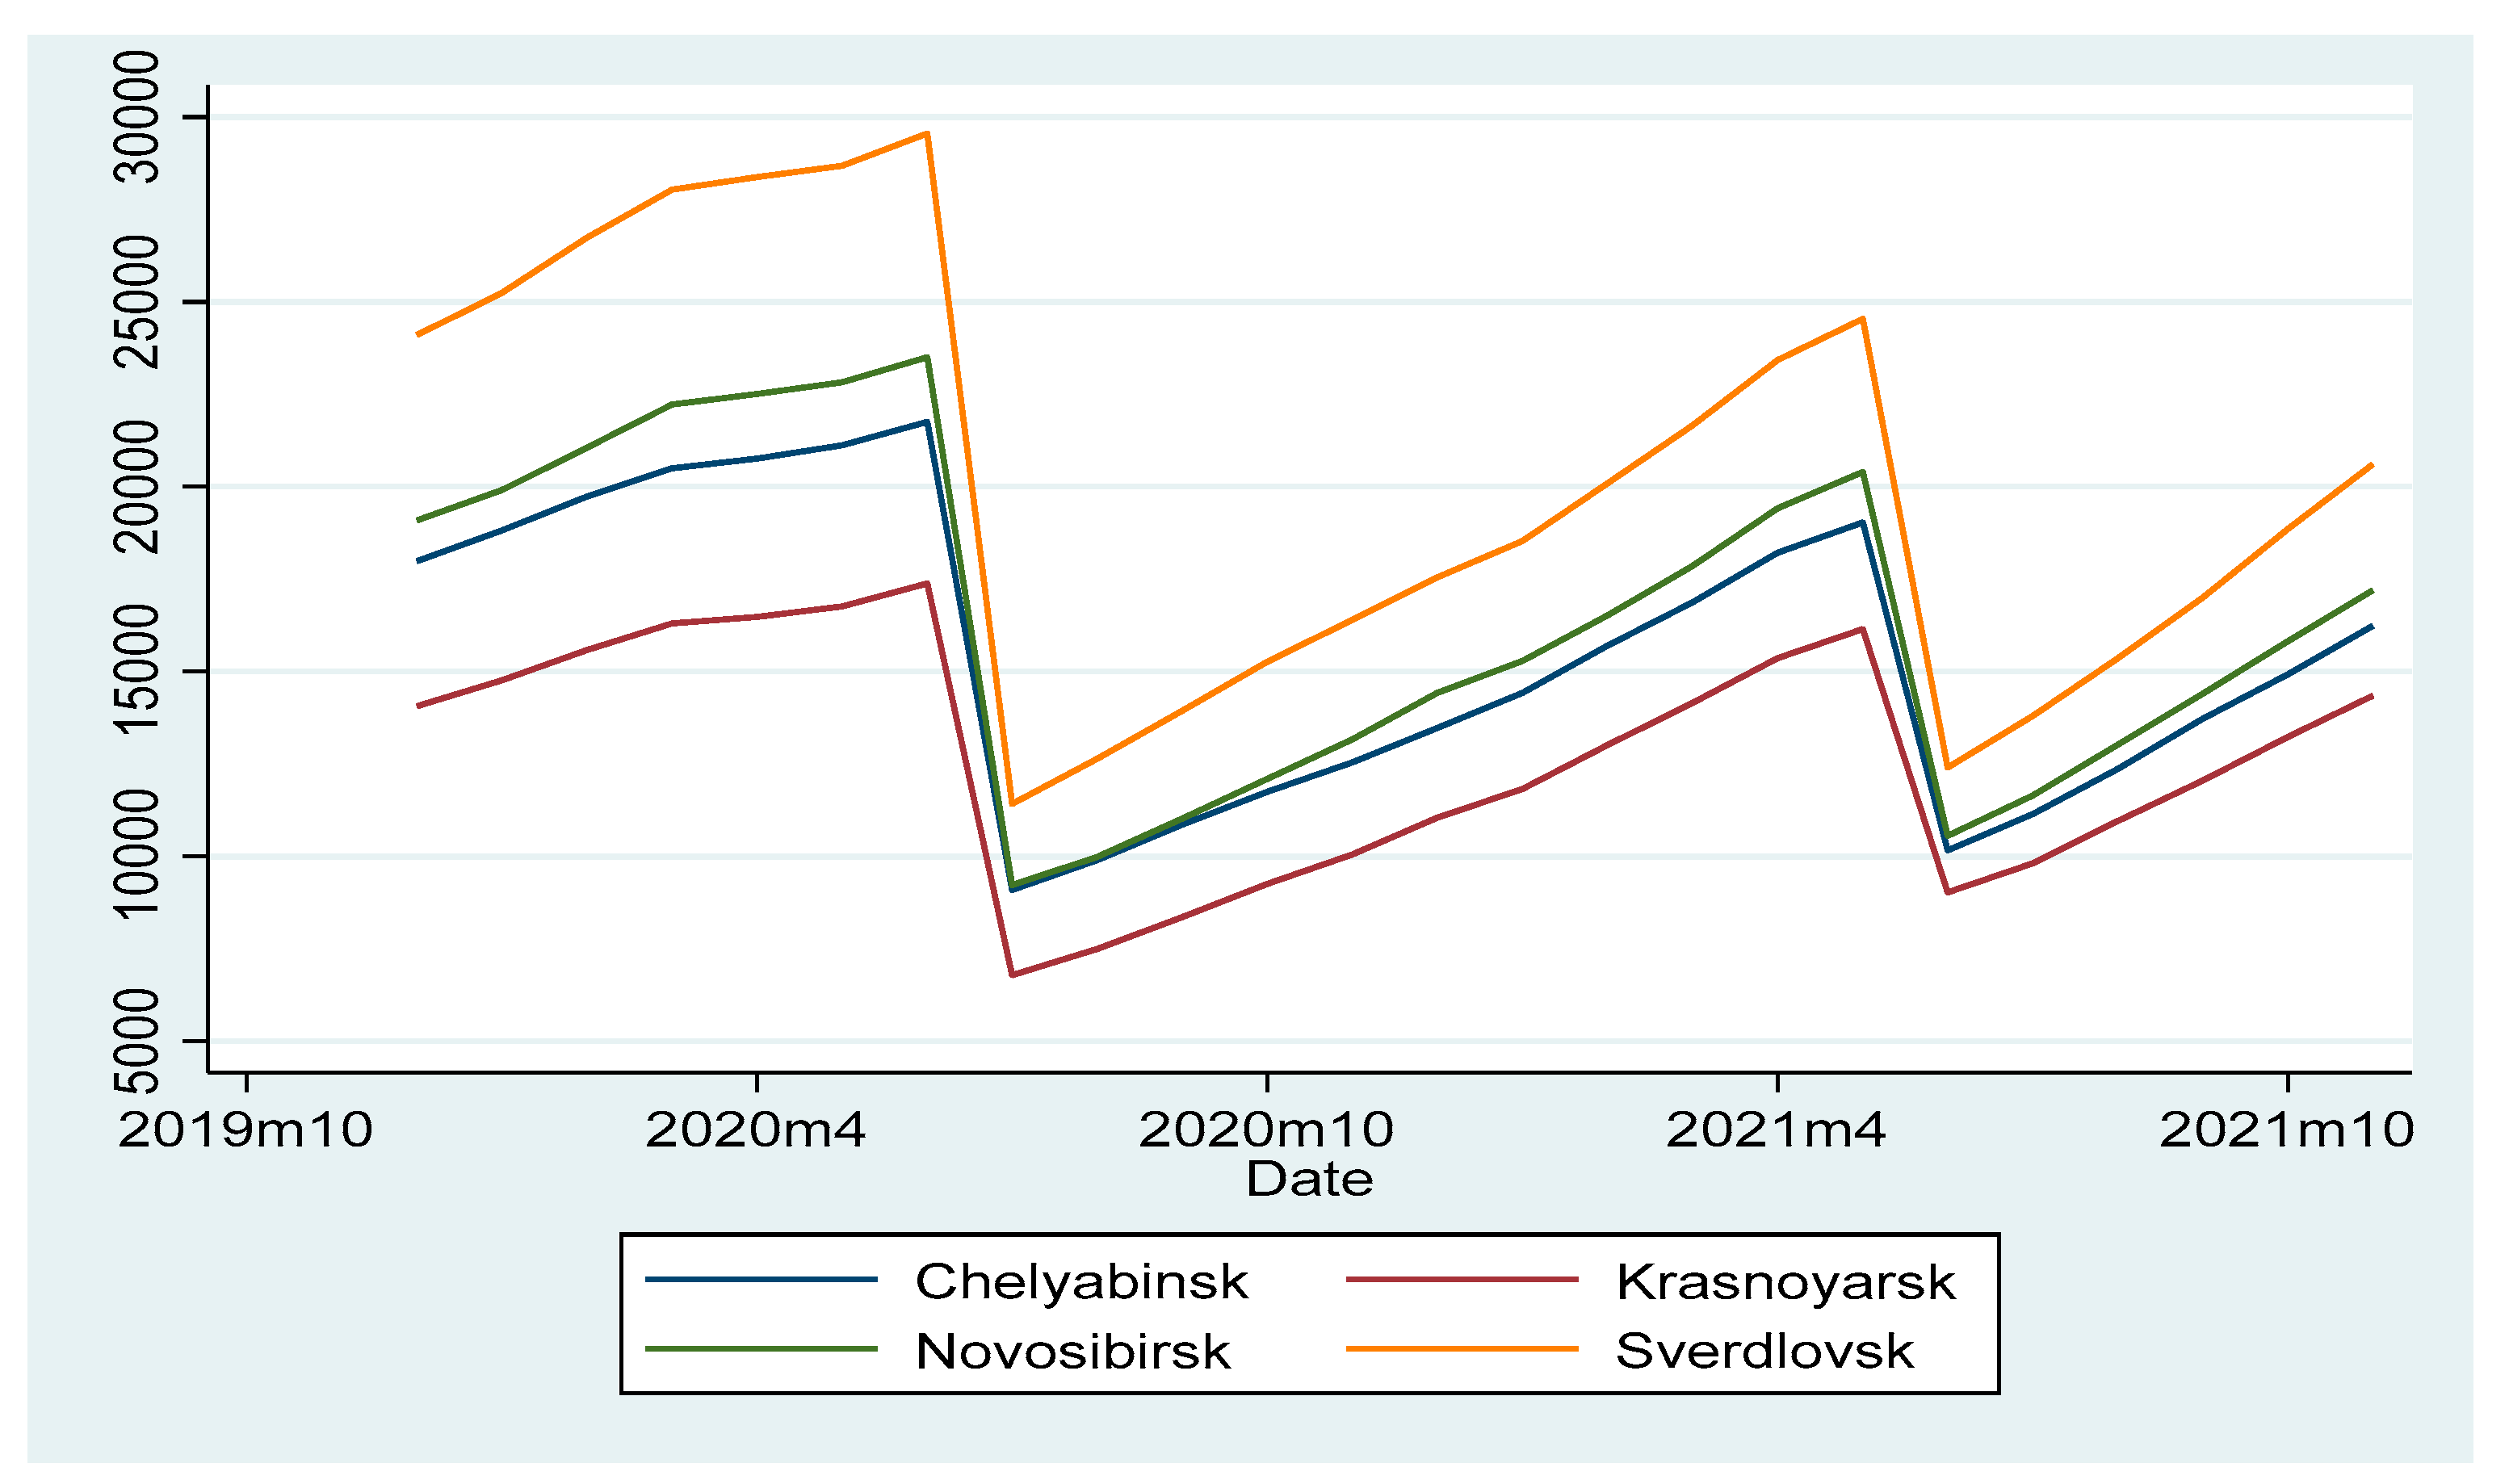
Figure 1. Trend of newly established sole proprietorship businesses for the four regions under study.
Sustainability 15 05053 g001
Figure 2. Trend for Internet searches for sole proprietorship.
Sustainability 15 05053 g002
Figure 3. Results for unit root test graphical examination.
Sustainability 15 05053 g003
Figure 4. Results for unit root test graphical examination for Internet search.
Sustainability 15 05053 g004
Table 1. The augmented Dickey–Fuller test result.
VariableLevel (p-Value)First Difference (p-Value)
New sole proprietorship businesses0.13590.0001
Internet searches0.17810.0199
Note: Using the mean of the two variables (newly established sole proprietorship businesses and Internet searches), Table 1 shows the results of the augmented Dickey–Fuller test at level and at first difference. Column 1 contains results for the number of newly established sole proprietorship businesses, while Column 2 contains results for Internet search engine data.
Table 2. Cointegration test result.
Cointegrating Equations2p-Value
134.062440.0000
Note: Using the mean of both variables, the cointegration test was used to test for a long-run relationship between newly established sole proprietorship businesses and Internet searches (the two variables).
Table 3. Granger causality Wald test results.
p-Value
New sole proprietorship businesses do not Granger cause Internet search for sole proprietorship0.562
Internet searches for sole proprietorship do not Granger cause new sole proprietorship businesses 0.021
Note: The analysis used the mean figures of both variables. In trying to examine the direction of causality, column 1 contains a null hypothesis showing the direction of causality from new sole proprietorships to Internet searches. Column 2 expresses a null hypothesis, showing the direction of causality from Internet searches to new sole proprietorship businesses.
Table 4. Vector Error Correction Model for Long-Run Relationship.
Vector Error Correction ModelCoef.Std. Err.zp-Value95% C.I.
Newly established sole proprietorships1
Internet searches for sole proprietorships−1.5160.260−5.840.000(−2.025, 1.007)
Note: The results in Table 4 show the Johansen normalization restriction-imposed model as the coefficient of the causal variable was exactly identified. Column 1 shows the results for newly established sole proprietorships, while column 2 shows the results for Internet searches of sole proprietorships.
Disclaimer/Publisher’s Note: The statements, opinions and data contained in all publications are solely those of the individual author(s) and contributor(s) and not of MDPI and/or the editor(s). MDPI and/or the editor(s) disclaim responsibility for any injury to people or property resulting from any ideas, methods, instructions or products referred to in the content.