Article

Exploring the Adoption of Cyber (Digital) Technology for Sustainable Construction: A Structural Equation Modeling of Critical Success Factors

1
Department of Civil Engineering, College of Engineering in Al-Kharj, Prince Sattam Bin Abdulaziz University, Al-Kharj 11942, Saudi Arabia
2
Department of Civil Engineering, Canadian International College (CIC), Zayed Campus, Giza 12577, Egypt
3
Department of Quantity Surveying, Federal University of Technology Akure, Akure 340110, Nigeria
4
CIDB Centre of Excellence, Faculty of Engineering and Built Environment, University of Johannesburg, Johannesburg 2092, South Africa
5
School of Social Sciences, Universiti Sains Malaysia, Penang 11800, Malaysia
6
Institute for Resilient Infrastructure Systems, College of Engineering, University of Georgia, Athens, GA 30602, USA
7
Construction and Building Engineering Department, College of Engineering and Technology, Arab Academy for Science, Technology and Maritime Transport (AASTMT), B 2401 Smart Village, Giza 12577, Egypt
*
Author to whom correspondence should be addressed.
Sustainability 2023, 15(6), 5043; https://doi.org/10.3390/su15065043
Submission received: 6 January 2023 / Revised: 3 February 2023 / Accepted: 22 February 2023 / Published: 13 March 2023

Abstract

:
The concepts of sustainability should be incorporated at every level of the decision-making process during the construction of residential building projects. It will ensure maximum cost savings without compromising the residential buildings’ services. To understand these sustainability principles, this study was conducted to identify and investigate the critical success factors (CSFs) required for implementing cyber technology in residential building projects. These CSFs were obtained from existing studies that were contextually explored via a questionnaire survey involving construction experts in the Nigerian building industry. Based on the Exploratory Factor Analysis (EFA) results, cyber technology CSFs were grouped into five distinct constructs: Governmental, Customer satisfaction, Time, Social safety, and Marketability of the construction product. Partial Least Square Structural Equation Modeling (PLS-SEM) was adopted to develop the model for the CSFs. The study showed that the Governmental component possessed the highest effect on the model, further underlining this construct as a crucial CSF in implementing cyber/digital technology. The findings from this study will facilitate cyber/digital technology introduction in the Nigerian construction industry. It will aid decision-makers and construction professionals in seeking viable ways of reducing costs and improving sustainability. Thus, this study has developed a CSF model to showcase the adoption of cyber/digital technology, with other implications for facilitating the goal of achieving sustainable residential building projects.

1. Introduction

As suggested by the phrase, “one of the most critical community circumstances that frequently defines the quality of life and general well-being of inhabitants of any country is bridging the gap between affordable and sustainable housing,” the idea of a residential building is one of the most important aspects of community development and requires critical success criteria (CSC) [1]. Residential buildings across developed and emerging nations account for over 40% of the global energy annually and generate about one-third of the global Greenhouse Gas (GHG) emissions [2]. As the world continues to experience significant changes in urbanization and industrialization, resulting in technological advancements, the residential allocation has failed to address the pressing demands for residential housing [3]. Likewise, the rapid rate of urbanization, particularly in low-income countries, has many people struggling to access affordable housing [4]. Estimates have revealed that 828 million people reportedly live in substandard homes and slums in developing countries. These figures were projected to rise to 1.4 billion by 2020 [3,5,6].
The construction industry in these nations still adopts traditional labor-intensive practices, often resulting in high operational costs, environmental pollution, high energy consumption, poor safety conditions, and low productivity in project delivery [7]. Additionally, these countries have experienced significant socioeconomic and political transformations and technological advancements. These transformations have led to modifications concerning residential building construction aimed at improving the standard of living [8]. Consequently, governments worldwide have established several residential initiatives and policies prioritizing residential housing affordability [1].
Notwithstanding these interventions, there are some unresolved controversies concerning the affordability of these residential buildings for low-income earners [3]. Dimakis et al. [9] argued that at least 30% of construction costs are lost due to many reasons that cause delays, e.g., design errors, changes to design models, inefficiencies, mistakes, and poor communication among building participants. Unless these issues are communicated to the site professionals in real time, there is an increased risk of cost and time overruns [10,11]. Therefore, project managers have to make timely and appropriate decisions if they gain access to crucial design information and changes in real time. These site changes must be integrated into the as-built model for the building’s lifecycle management (LCM). However, in developing countries, the as-built models are typically updated manually after completing the building process. It can lead to inaccuracies, since not all changes are captured effectively, and some modifications may be missed altogether.
The existing literature has highlighted the need to construct “sustainable buildings” that are not harmful to the environment and make optimum use of resources [12]. Achieving this goal requires adopting cyber (digital) technology that can facilitate the realization of sustainable construction. Construction industry 4.0 and sustainability is an enabling framework for realizing the critical success factors (CSFs). Adopting Industry 4.0 technologies in the building can resolve some of these challenges [13]. This could be used to develop a new framework/model capable of guiding policy proscriptions and support mechanisms to facilitate the adoption of digital technologies while tackling the consequences of sustainability and environmental-related effects. These frameworks/models could have the potential for universal adoption and application among countries and sectoral contexts [13].
Although it is difficult to estimate the impact of sustainability/environmental influences on buildings, as they accumulate through construction, the advent of Virtual Models (VM) has further simplified these processes [14]. Even though their application is restricted to the preconstruction period, VM enables the proper recording of information about the existing structure. Additionally, VM allows project team collaborations and visualization of the construction progress [15]. Some notable examples of VM, such as Building Information Modeling (BIM) and Computer-Aided Design (CAD), have been widely employed in the construction, operation, and maintenance stages of a project’s lifecycle. Shen et al. [16] argued that the interaction between VMs and the physical construction could increase the knowledge and information activities across the entire construction process. Thus, it enhances the control of the building process.
There were many attempts to establish a nexus between cyber (digital) technologies and physical construction by using different data-capturing technologies, e.g., digital cameras, drones, and laser scanners [15,16,17]. However, the existing approaches are limited by a lack of communication or two-way integration (important for enhancing feedback or gaining control of the construction process) between the VMs and physical construction. Consequently, Akanmu et al. [17] attempted to describe bidirectional coordination as a two-way interaction between the VMs and physical construction, such that any changes observed in one are instantly reflected in the other. Specific computational resources are required to maintain this bidirectional coordination, termed a cyber-physical systems (CPS) approach. In this study, CPS describe the firm connection and coordination between VMs and the physical construction. You and Wu [18] argued that, by using sensors, CPS connect the cyber world (communication, data, and intelligence) to the physical world.
Therefore, the CPS approach will result in as-built documentation, enhanced construction process control, improved progress monitoring, and sustainable building practices. As a consequence, emerging technologies such as Artificial Intelligence (AI), big data, cloud computing, Internet of Services (IoS), and several others have been regarded as practical tools that can change the construction industry concerning efficient design, performance evaluation, project delivery, risk monitoring, and GHG emissions reductions [19,20]. However, in developing countries, adopting these technologies is still embryonic. The construction industry is often labeled as slow in digital adoption/transformation [21]. Presently, digital technologies have only been slightly adopted in some industries, especially in developing countries. Thus, very few studies have delved into their integration into construction industry activities. For instance, Ebekozien and Samsurijan [22] argued that digital technology adoption is incentivized in developing countries. Organizational management of the adoption of digital technologies and economic mechanisms of construction to increase the impact on the national economy are needed to facilitate the sustainable construction of residential buildings [23]. Hence, exploring the challenges concerning the transformation of the building industry and the digital divide is needed to bridge the gap [24]. It will enable the identification and analysis of the critical success factors (CSFs) required to implement cyber (digital) technology concerning the sustainability of residential building projects.
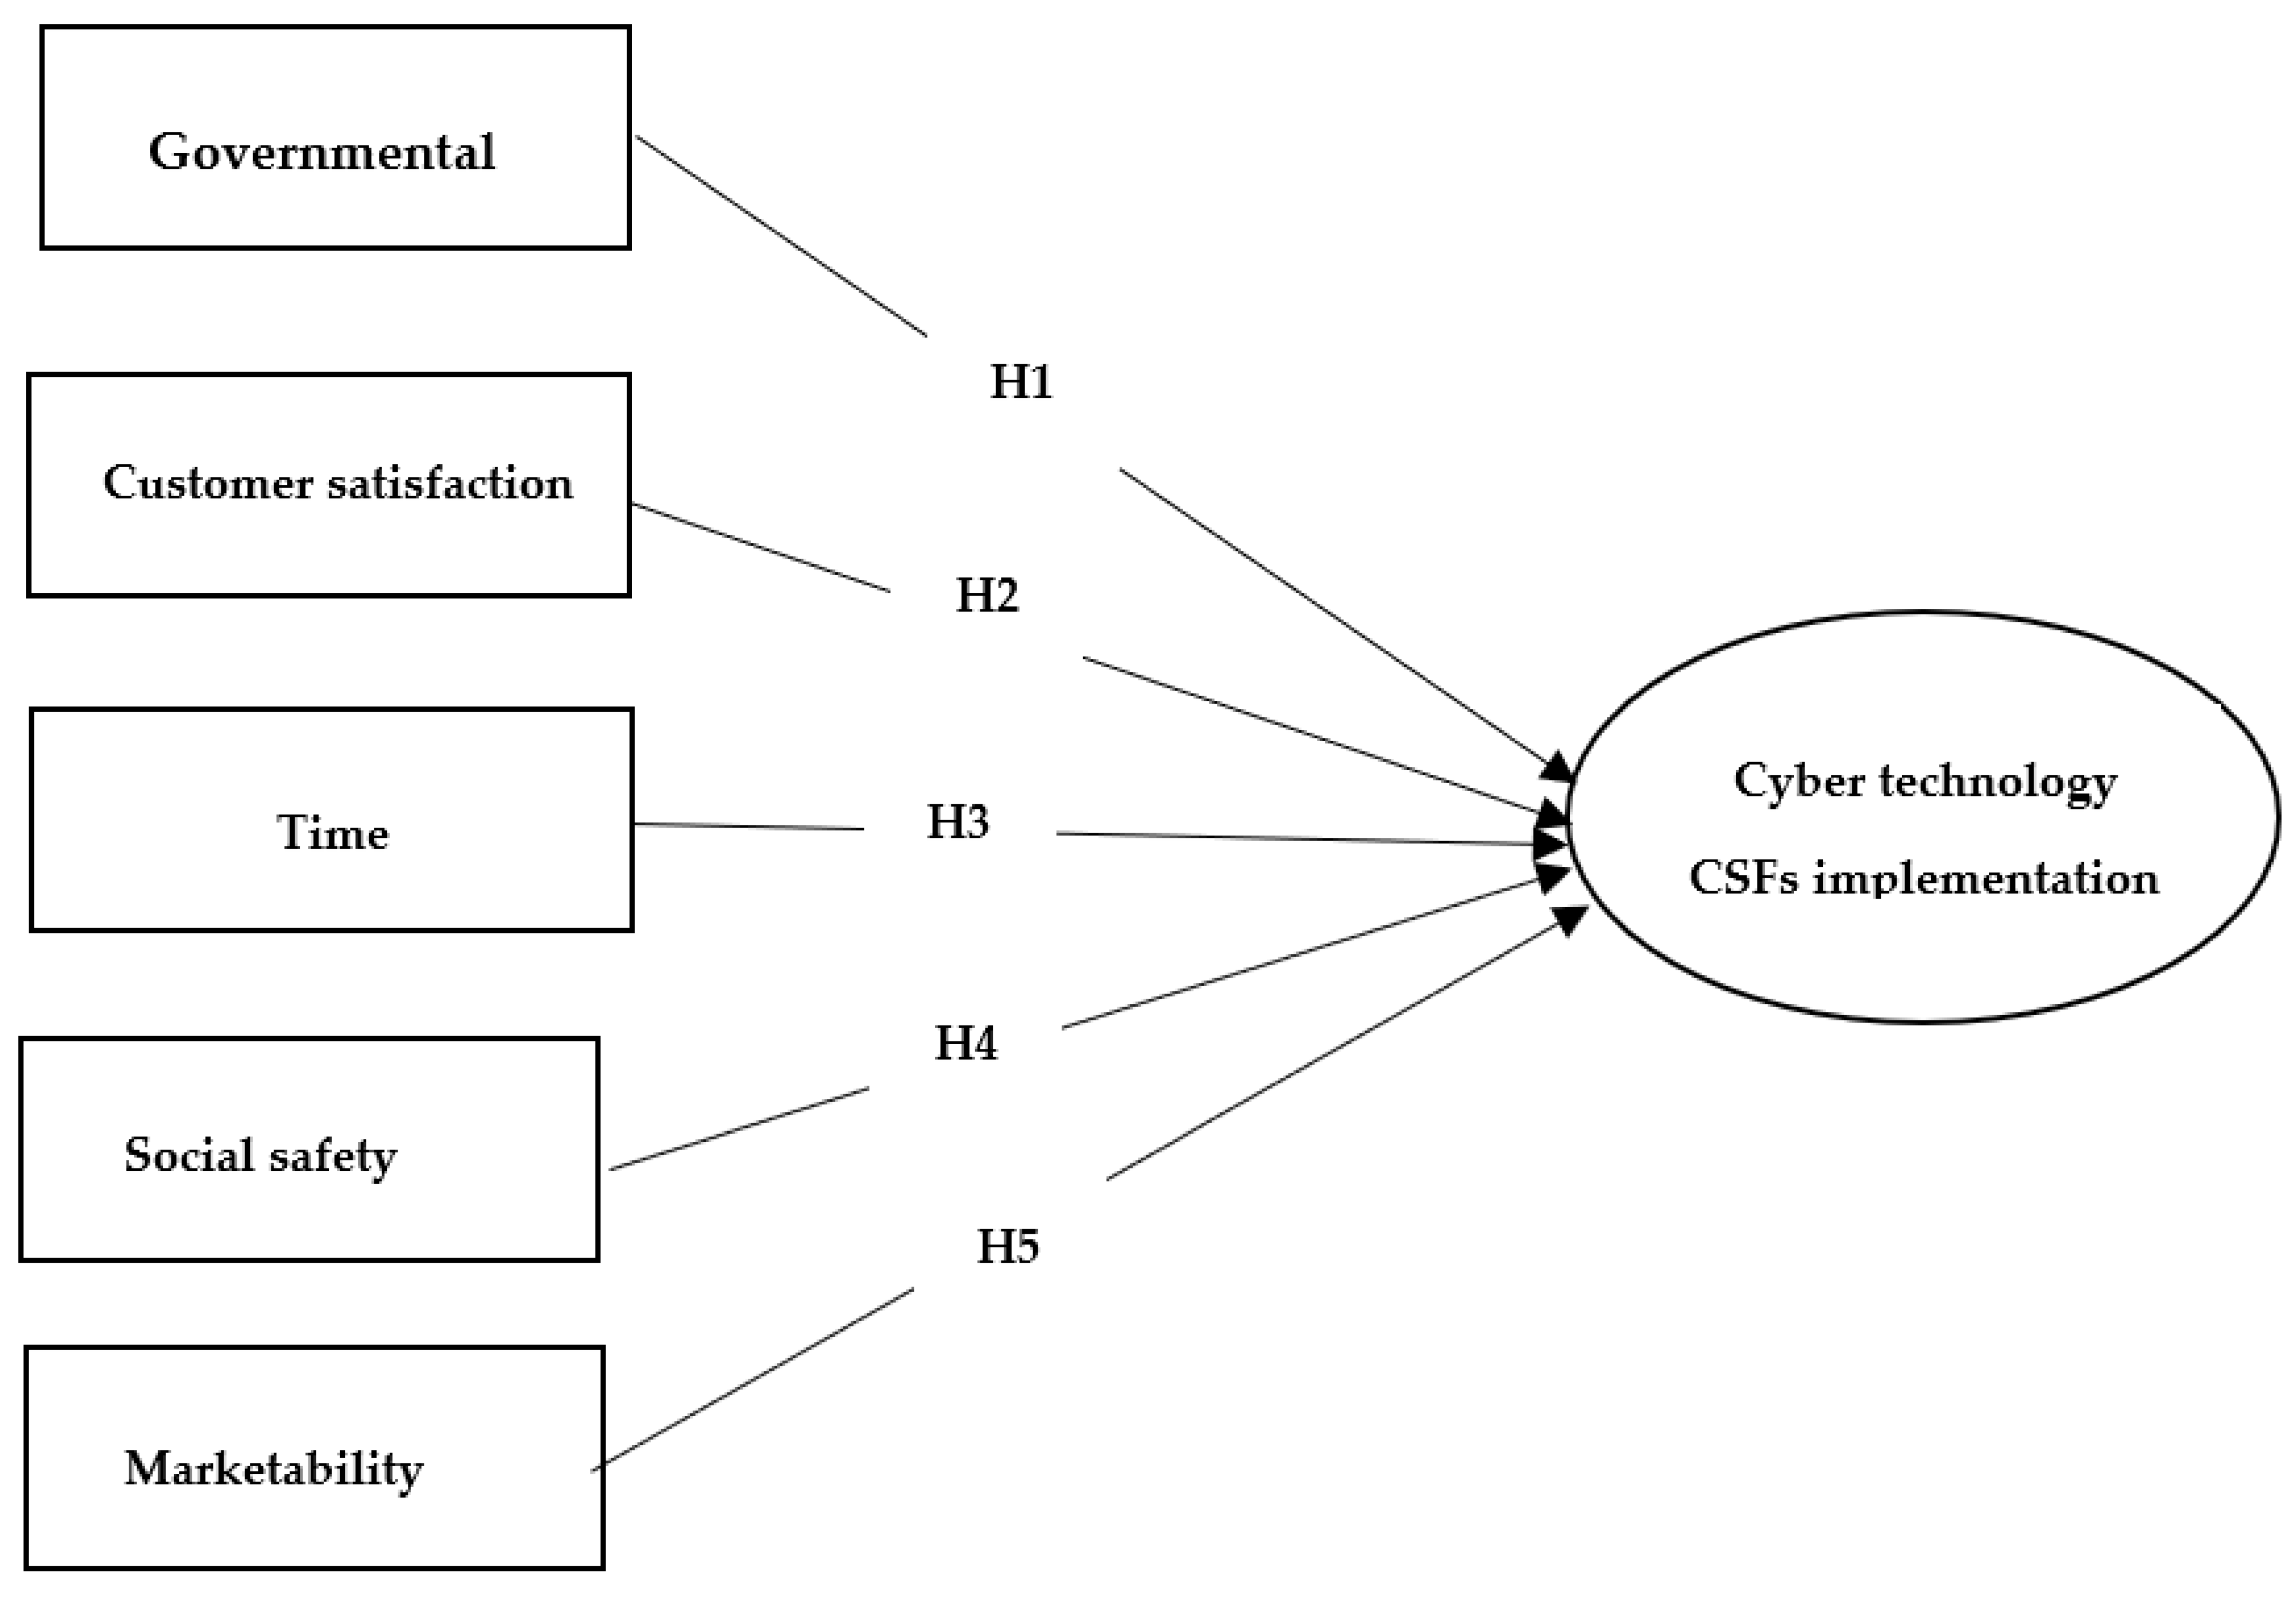
This study seeks to answer the fundamental research question guiding this study: What requirements are needed to implement cyber technology in the construction industry? These requirements can be achieved by Analyzing CSF’s various cyber (digital) technologies [25]. CSFs are “areas where, if satisfactory, the results will ensure the organization’s competitive success” [26]. Likewise, CSFs are action fields, and critical management preparation that can lead to success [27]. Moreover, the cyber (or digital) technology CSFs offer the support and participation of active customers through decision-makers [25,28]. Therefore, this research seeks to determine and investigate cyber (digital) technology CSFs using Structural Equation Modeling (SEM). The model will help to facilitate the implementation of cyber technology in the building sector in Nigeria in a bid to achieve sustainability in residential buildings.

2. Research Background

For instance, digital technology adoption over different phases in building projects was explored in South Africa by Ikuabe et al. [29]. The study discovered that digital technologies, the Internet of Things (IoT), and sensors are widely adopted in building processes. However, there was generally low adoption of digital technologies for building projects. Correspondingly, there was a high awareness and usage of digital technologies during the planning/design phase. Hence, the need for digital technology adoption is emphasized during all phases of building projects, since the potential benefits can be immense.
Similarly, Gurgun et al. [30] explored the technology adoption against delays in building projects. The results revealed that many tools, including imaging, planning, the collection of geospatial data, optimization, and machine learning, were broadly adopted to address particular causes of delays. However, the strategies for addressing different causes of delays across the project lifecycle were poorly addressed in the existing literature. Thus, further explorations on digital technology adoption will contribute to the trends and technological advances to increase the sustainability of residential building projects by addressing project delays with the resultant cost savings.
The adoption of distributed ledger technology for the sustainable building industry was explored using the Ordinal Priority Approach to assessing the barriers [31]. The study inferred that digital technology adoption is vital to resolving high-ranked challenges that are significant to construction sustainability concerning procurement and supply chain management, anticorruption, transparency, anticounterfeiting, honest competition, and proper operation. All these aspects are central to residential building sustainability. Exploring the adoption of cyber (digital) technology for sustainable construction can be possible using sustainable supplies and blockchain technology. It will enable the theoretical exploration of adoption barriers. The technological and supply chain barriers remain the most significant among industry experts and academia. Therefore, a series of research directions and propositions culminated from these studies, which justified exploring the adoption of cyber (digital) technology for sustainable construction, employing the Structural Equation Modeling (SEM) of critical success factors. The SEM approach has been widely used for exploring the factors affecting waste reduction in construction projects [32], the evaluation of sustainable and green supply chain management [33], the performance of construction projects [34], and the assessment of critical success factors (CSFs) for integrated building projects. Understanding CSFs is essential for sustainable construction projects, since the CSFs enable the development of decision support systems and predict project success [35]. Consequently, this study attempted to develop a checklist and a CSF conceptual model that will improve and guide the successful implementation of sustainable residential housing projects through the increased adoption of cyber (digital) technology.

2.1. The Concept of Cyber (or Digital) Technology in Construction

The bidirectional coordination in cyber technology systems is described as a two-way connection between the Virtual Models (VMs) and physical construction, such that any changes observed in one are instantly reflected in the other [36]. Concerning the construction industry, this also includes the active control and monitoring of activities and processes, such that, as various components of the building are erected, the corresponding VM is kept updated to reflect the progress of the components. On the other hand, when updates are made to VMs, relevant updates are sent in real time to the physical components [31]. It is noteworthy that VMs such as BIM have been deployed in the construction industry to visualize the activities and processes and how they correspond to the construction site’s physical components. As the lifecycle of a facility moves from the design phase to the facility management phase, the virtual image can be modified to reflect changes in the physical components in real time. Thus, this information provides an integrated database of the project information that the construction team can utilize in the various stages of the facility’s construction [37]. Sørensen [38] argued that integrating VMs with physical components through cyber/digital technology could lead to better information flow, timely accessibility to real-time information, and enhanced communication among members of the design and construction teams, resulting in project delays being reduced. Therefore, it is vital to understand the next generation’s cyber-physical systems and digital technologies for sustainable building [39]. The possible scenarios of the next-generation digital technologies and cyber-physical systems would enhance the workforce’s productivity, safety, health-building system’s lifecycle management, and competency of the workforce. Similarly, understanding cyber threats and factors confronting building projects’ sustainability is required to address issues relating to the cyber security of digital assets [40].

2.2. Benefits of Cyber/Digital Technology in Construction

The adoption of cyber/digital technology by construction industry activities and processes (planning and forecasting) has been recognized for the time and cost reductions that prevent project delays [41]. As for the efficiency of the construction budget, the application of digital technologies enables accurate estimates due to the use of technological devices and models such as iPads, sensors, and digital trackers. Thus, precise quantities of work/tasks are derived from the design stage. Overestimation of the cost is quelled to the barest minimum, while the process is kept within the commensurate budget [42]. Golovina et al. [43] argued that Radio Frequency Identification (RFID) and the Global Positioning System (GPS) are examples of sensing technology and related image-based technologies that can be useful in obtaining valuable data from multiple construction sites [43]. The data obtained can help in formulating a generalized model to produce reliable site layout plans that are critical in the planning phase of the construction project [44]. The prototype systems have been accepted by evaluators and compared to the present manual technique of delivering status information if the prototype enhances the progress operation and monitoring [36]. Some evaluators have called for more research on how to tell when the installed components are genuinely in place rather than merely being in the proper spot, and several sensors can be used to track several placement situations. Hence, it may be more viable to adopt placement sensors, since they will determine when components are placed next to each other. However, these types of sensors track a single parameter [45]. Therefore, it has limited applications due to the numerous stakeholders involved in the construction process [46]. Cyber/digital technologies can also improve the traditional means of construction activities and products [36]. The integration of innovative technologies into construction activities and the process can lead to better decision making between project team members, enhanced communication flow, improved efficiency in operations, timely delivery, and increased productivity of the workforce [42,43,44,47].
The aim of incorporating technology in construction is to increase the accuracy and effectiveness [48]. Cyber/digital technologies contribute a lot to achieving this objective by streamlining the construction processes to well-defined protocols. This reduces the errors usually encountered in the process [45]. Technologies also help to reduce cost wastage resulting from construction [7]. Al-Rakhami et al. [48] opined that incorporating technologies into construction activities and processes can help the project to be completed within the required cost and time stipulated. Thus, it reduces wastage and increases revenue generation. In addition, Fan et al. [49] stated that cyber technologies could help improve progress monitoring, as-built documentation, and sustainable building practices. In the same vein, Akanmu et al. [36] argued that the output, which is the realization of the design through practical construction and maintenance, can be fully actualized.
Moreover, using cyber technologies encourages healthy competition among construction professionals. Thus, it gives them a professional advantage over their contemporaries [50,51]. There is an undeniable need for efficiency in managing the construction process, and emerging technologies such as cyber technologies offers the best opportunities to improve the construction process through better integration and transparency [36]. This makes it a worthwhile addition to construction procedures [50]. Construction activities before now made information sharing among construction professionals very hectic [36]. With the adoption of cyber/digital technologies, information sharing and documentation are made much easier for professionals because of the inherent features of these technologies [52,53]. An evaluation of international benefits and divides concerning cybersecurity capacity building revealed the formative, low status of the cybersecurity capacity among the studied countries. However, comparatively high maturity levels could translate into excellent results for nations [54]. Therefore, exploring the adoption of cyber (digital) technology for sustainable construction through modeling CSFs will provide experiential support to global efforts aimed at establishing a cybersecurity capacity, resulting in benefits for sustainable building projects [54].

2.3. Critical Success Factors for Implementing Cyber/Digital Technology

Activities related to construction project management are classified as a forward flow (design and planning) and a feedback flow of information, enhancing the need for cyber/digital technology [35]. The fundamental driving force behind the forward progression of the design intent is derived from the Virtual Models (VMs), while the feedback flow of the information is obtained from monitored activities [55]. Some of the conditions that need to be addressed by the Nigerian construction industry can adopt cyber technology.

2.3.1. Availability of Enabling Technologies

Some of the key enabling technologies that can enhance the cyber technology integration of Virtual Models (VMs) and their physical components are:

Sensors

Information gathering and dissemination is the responsibility of the devices known as wireless sensors, which serve as a link between conventional and modern construction methods [56]. The construction site helps to obtain information about the activities, the many procedures, and sources of aid that went into the building project. Similarly, sensors monitor the current state of infrastructure systems throughout their service lives [57]. Cameras, laser scanners, and radio frequency identification devices are all types of sensors employed in construction processes. These sensors give users access to the data they require for specific cyber applications. These sensors also ensure bidirectional coordination, since sensors link the component of its matching virtual representation that is physical in nature.

Communication Networks

Communication permits the transmission of information between fixed devices, mobile devices, and sensors. Therefore, the communication network is one of the most powerful technologies for improving the bidirectional coordination between the Virtual Model (VM) and the physical construction [58]. Some examples of communication networks used in the construction industry are the internet, wireless local area network (WLAN), wireless personal area network (WPAN), and Wi-Fi. Through these communication networks, data can be shared between project team members at the construction site. Thus, it improves collaboration and real-time communication among the project team. Several factors can affect the choice of communication networks, such as cost, network topology, and strength of the network [16].

Virtual Models

Virtual Models (VMs) often serve as a platform that visualizes and embeds information about the project’s lifecycle. The VMs can store embedded information that can be utilized throughout the project lifecycle. These are often referred to as Building Information Models, containing virtual representations of physical components that can monitor the status of construction activities and processes [36]. Autodesk Revit, Bentley Architecture, Navisworks, and Vico are some software packages that can create and navigate these models [22].

Mobile Devices

These portable devices can access information, establish communication between team members, and coordinate on-site and off-site construction activities. These small and handy devices help provide accurate communication, monitor the progress of construction activities, and provide instant updates on the job done on-site [59]. According to [16], mobile devices help construction teams to wirelessly address concerns about specific aspects of the building processes, update design changes, and obtain instant feedback when necessary. In some cases, mobile devices possess barcode scanners that can help scan tags to access embedded or coded information.

Real-Time Location Sensing (RTLS) System

This RTLS comprises real-time location sensing tags used to locate an asset, resource, or a person’s location. They include satellite nodes, servers, transponders, infrared tags, Bluetooth beacons, and several other devices. An RTLS-based technique for cyber-physical systems integration in design and construction offers essential opportunities for improving real-time building consistency evaluations. It will also aid effective control and decision making [60]. The improved precision of real-time location tracking for building workforces showed the effectiveness and applicability of the RTLS under various building environments. The experimental results also revealed the system’s strong prospect for enhancing the building performance [61]. Data fusion of the RTLS and physiological status monitoring (PSM) for the ergonomics analysis of building workers enables the monitoring of construction workers for improved project delivery [62].
(i)
Q350 RTLS Tags
The RTLS tags have location-sensing capabilities and the capacity to store data (32 KB of read/write memory). These tags have a very extended communication range of up to 500 m (1600 feet) and enable the automatic identification, tracking, and tracing of assets and people in areas as vast as steel construction work without the participation of a human being [36].
(ii)
SAT 300 RTLS
These operate as one of the numerous reference points (RP) for the identity and positioning of the RTLS tags. When connected with the i-Q350 RTLS, reference generation can allow localization to occur within a few feet. With a constant power supply, they are fully functional and allow communication even with fast-moving tags [36].
(iii)
PORT RTLS Reader
These function as a blend between satellite nodes (which are capable of around 400 localizations per minute) and an RTLS reader (which is capable of up to a 500 m read/write range). These serve as reference nodes and interrogators to obtain real-time location-sensing data from the tags [36]. In cases where building components or materials are labeled with RTLS tags, the tags regulate the communications fed to the i-SAT nodes, which provide position information to the RTLS reader [49].
  • (iv) Share Positioning Software
This server application filters data and contains supported features such as position calculations and sensor data. The server regulates the system’s status and exposes tag communication to business applications [36]. It is noteworthy that the interfaces are web services designed to encourage system integration and reduce problems such as serialization. The i-Share positioning software is also where the location information that the RTLS reader captures is located [36]. The positioning software can be integrated with BIM and other project management applications for as-built documentation and for visualizing progress information.

2.3.2. Availability of Cyber Technology Architecture for Construction

As a framework for bidirectional coordination between VMs and physical construction, the system architecture combines the major enabling technologies (such as communication networks, mobile devices, and wireless sensors). The architecture is based on a couple of layers, as discussed next below:

Sensing, Device, and Communication Layers

Chen et al. [63] argued that the sensing layer consists of sensors that monitor different aspects of the construction process/constructed facility, e.g., the temperature sensor (for monitoring the temperature of a space), RFID tags, and readers (for identifying and storing information about components), and real-time location sensing sensors (for tracking the location and placement of critical components). Depending on the type of sensor used, this layer can also provide the construction personnel with access to control the construction process [64]. The device layer consists of the client devices such as personal digital assistants (PDAs), tablet PCs, iPads, and smartphones) through which the end user (e.g., construction personnel on-site) can interact with the system. This layer serves two purposes: (i) it provides access to sensed data from the sensing layer, and (ii) it enables the entry of information through the user interface.
The communication layer comprises internet connections and wireless communication networks such as local area networks (LAN), wireless personal area networks (WPAN), wide area networks (WAN), and so on [50]. In conjunction with mobile devices, information can be transmitted through the internet in the communication layer. Table 1 shows the various research centers of the drivers for adopting cyber technology in construction.

Virtual Models

Apart from storing embedding project lifecycle information, Virtual Models (VMs) are helpful, since they serve as a platform upon which construction activities can be visualized [53]. The information acquired from wireless sensors (such as a tagged component) is shown in VMs and sometimes saved in the corresponding virtual components. In seeking access to embedded information or to embed information, project stakeholders can query the virtual components [36,52]. Likewise, VMs can serve as a platform for remotely operating physical components of the construction project, such as regulating the electrical or mechanical systems during the operations and maintenance (O&M) phase of a project.
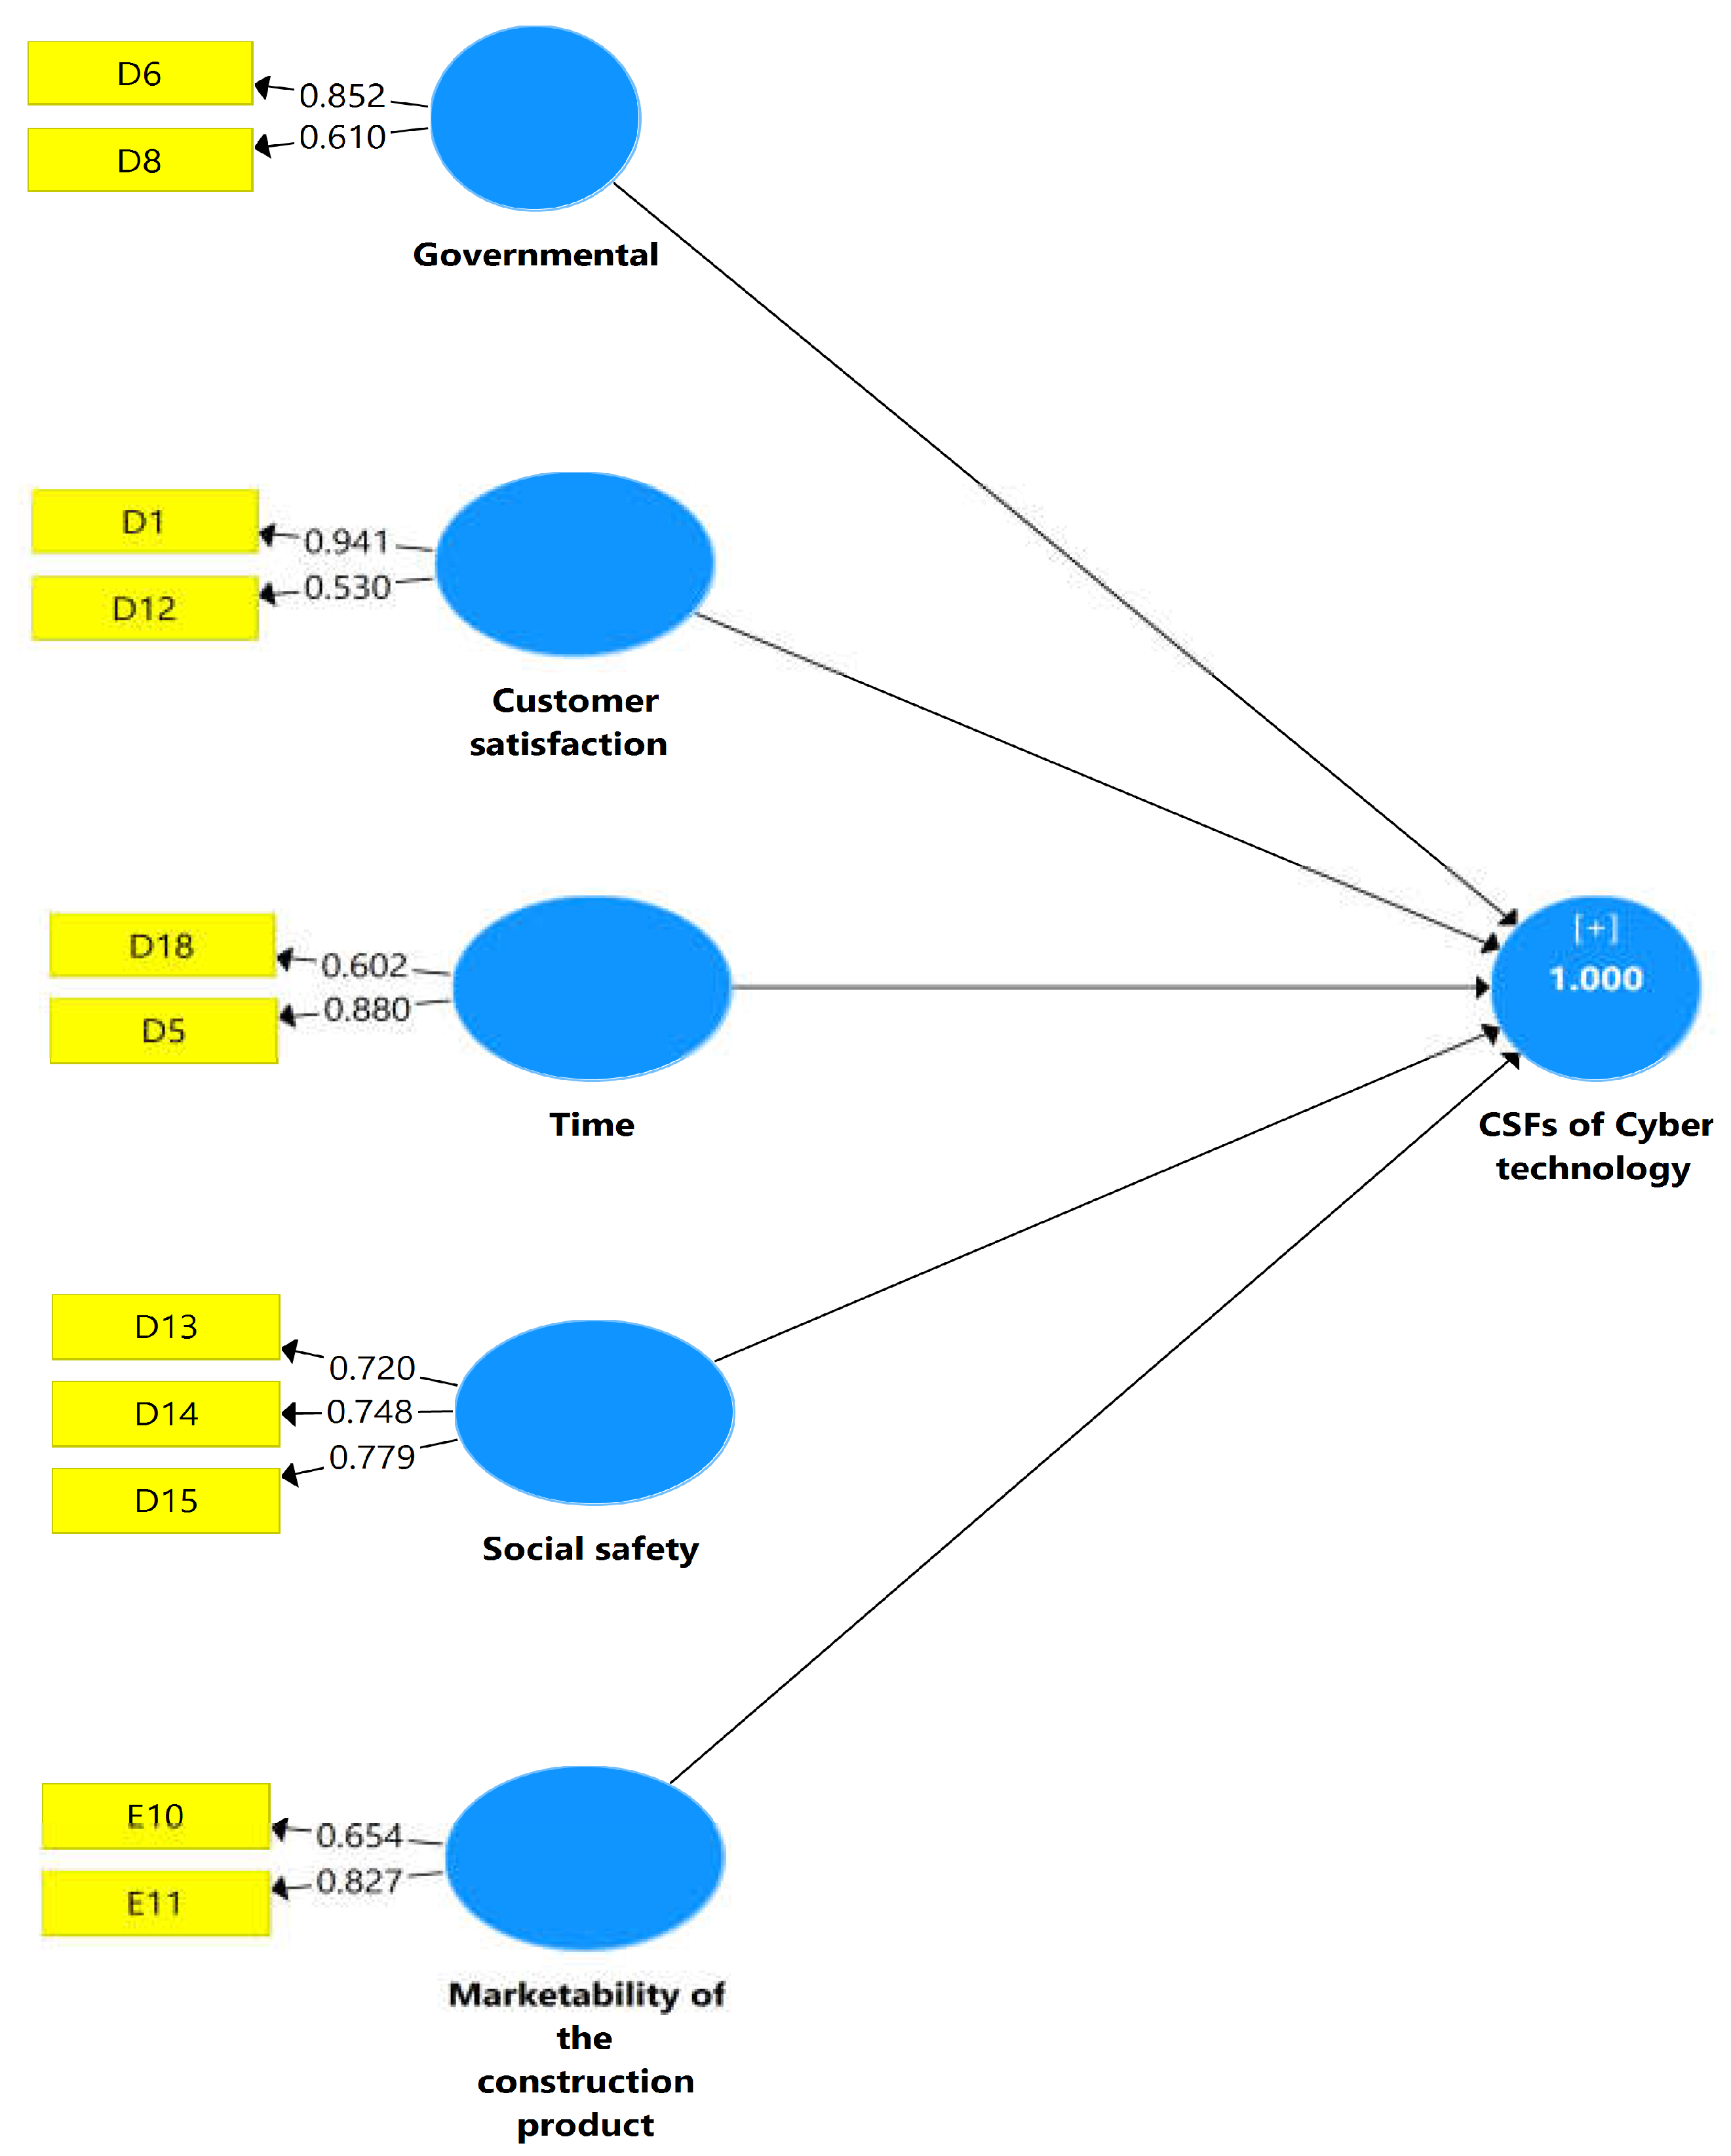
3. Research Method and Model Development

Table 1 above presents a set of 18 Critical Success factors (CSFs) obtained from existing studies suitable for implementing cyber technology. As illustrated in Figure 1, this study adopted a quantitative research approach through a well-structured questionnaire sent to residential building professionals with relevant industry experience. Subsequently, the data obtained were subjected to the Exploratory Factor Analysis (EFA) using Statistical Package for the Social Sciences (SPSS, version 2.0).

3.1. Model Development

Partial Least Square Structural Equation Modeling (PLS-SEM) has gained wide attention across various fields, including the social sciences [66], sciences [67], and engineering [68], due to its capacity to function with non-normal data and its ability to model latent variables despite smaller samples [69]. Likewise, research adopting the PLS-SEM approach has been widely published in high-quality Social Sciences Citation Index (SSCI) journals [70,71,72]. SMART-PLS 3.3.9, the latest software edition, was deployed to evaluate the data collected to conduct an inferential analysis. Inferential analyses of the CSFs were conducted to examine the cause–effect relationships between the exogenous variables (independent) and the endogenous (dependent) variables [73]. The statistical analysis deployed the measurement and structural model evaluation technique for this study.

3.1.1. Common Method Variance

The common methods variance (CMV) gave birth to the common method bias (CMB). The CMB can explain why an analysis’s result has a discrepancy (or inaccuracy) resulting from the analytical method rather than the constructs represented by the measurements [74]. Conversely, CMV can be regarded as a variance overlap attributed to the constructs and types of measurement instruments used [74]. However, CMV is often problematic when data are obtained from a single source, such as a self-administered questionnaire. In some cases, the self-reported data can trigger issues such as inflating or preventing the extent of the investigated connections [75,76]. These issues may be underlying in this research, considering that the data is subjective, self-reported, and was obtained from a singular source. Hence, it was paramount to address these concerns to deal with any CMV. Therefore, a formal systematic one-factor test, as postulated by Harman’s experiment in 1976, was performed [77]. Consequently, the factor analysis yielded a single factor that accounted for the most variance [76].

3.1.2. Construct Validity Analysis

Examining the measurement (outer) model, also known as the confirmatory factor analysis (CFA), is usually the first step in examining the PLS-SEM results. On the other hand, the EFA is used to confirm the statistical significance of the constructs before reducing them into cluster groups [78]. The EFA is designed for interval data or ordinal data. The variables are partly or wholly correlated to each other through a scatterplot. The method is used to reduce the factors with the clusters categories that contain other variables. The formula is indicated below:
Xi = ai1F1 + ai2F2 + … + aimFm + ei
where ai are the factor loadings (or scores) for variable i, F is the factors to be analyzed, and ei is the part of the variable that the factors cannot explain.
For this study, the EFA was adopted to explore the primary constructs underpinning cyber technology CSFs. It also aids in evaluating the appropriateness of the measuring items of individual constructs to assess their validity. Since the Principal Component Analysis (PCA) is more accurate and less conceptually complex, it was chosen over alpha factoring, image factoring, maximum probability, and Principal Axis Factoring (PAF) [79]. According to Williams et al. [78], PCA is more suitable when no prior theories or models and immediate solutions are found in the EFA. For this reason, PCA is often set at the default in several statistical programs and is widely used across the EFA. Due to its ability to optimize the load dispersion between variables, the varimax rotation method was adopted over the direct oblimin or Promax rotation. Hence, varimax is often preferred for a simple EFA, because it is an excellent approach that simplifies the clustering of variables (factors) [80]. Therefore, the 18 variables were considered suitable for the EFA [81].

3.1.3. Measurement Model

The first step in examining the results of PLS-SEM is to evaluate the measurement (outer) model, known as the confirmatory factor analysis (CFA). It reveals the existing relationship between the objects and their latent underpinning structure [82]. The convergent and discriminant validity of the measurement model are presented in the following sections.

Convergent Validity

Convergent validity represents the degree of agreement among two or more measurements of the same construct cluster [83]. It is also regarded as the subset of the construct validity. The convergent validity of the constructs is often determined using several tests such as average variance extracted (AVE), Cronbach’s alpha[M1] ( α ) , and composite reliability (CR) [84]. A CR value of 0.70 and above is an acceptable CR value. Generally, the higher the values, the higher the reliability levels [85]. AVE, a standard measure of assessing the convergent validity of constructs in a model, requires values larger than 0.50 [85].

Discriminant Validity

The discriminant validity describes the empirical exceptionality of the phenomena being evaluated and the extent to which model factors are distinct and uncorrelated [86]. For discriminant validity to be demonstrated, the similarity among measurements that differ from one another must not be too high [79].

3.1.4. Structural Model Analysis

The major objective of this study is to evaluate the impact of cyber/digital technology CSFs in construction using PLS-SEM. Consequently, the path coefficients were established, which show a one-way causal relationship between CSFs of cyber technology constructs (£) and CSFs of cyber technology implementation (µ). Equation (2) presents the structural relationship between £, µ, and €1 formula in the structural model (inner relationship) [87].
µ=β £+ €1
where β is the route coefficient that links the CSFs of cyber technology constructions, and the residual variance at this structural level is predicted to reside in €1. The bootstrap was carried out with 5000 subsamples that defined the model’s t-statistics. For the PLS model, four structural equations for cyber technology CSF constructs were formulated, representing the inner relationship between the constructs and Equation (2).

4. Data Collection and Case Study

The target population for this study comprised residential building sector participants from the Nigerian construction industry. These professionals (contractors, consultants, and clients) had relevant industry experience responding to questions addressing the cyber/digital technology CSFs. The respondents were derived from different professions/occupations in the construction industry (architects, builders, engineers, and quantity surveyors). Consequently, two groups of non-probability sampling techniques were considered: purposive (judgment) and snowball techniques. The purposive sampling technique was adopted because it is a time and cost-effective sampling method, since it relies on the researcher’s judgement in identifying the population of interest in the study. The initial set of respondents also identified other professionals (referrals), which achieved the aims of the snowball sampling technique. The questionnaire survey was divided into three significant sections. The first section focused on the demographic profile of the respondents, and the second section addressed the cyber technology/digital CSFs. These are presented in Table 1. The third section comprised open-ended questions that allowed respondents to provide any CSF deemed necessary to the study. Respondents assessed the cyber technology CSFs using a 5-point Likert scale, where 5 was “extremely high”, 4 was “high”, 3 was “moderate”, 2 was “small”, and 1 was “no or very small”. The Likert scale is widely used in this analysis [88,89,90,91,92,93,94,95]. To obtain the required sample size for the study, the methodological purpose analysis by Badewi [96] was adopted, providing a good head start. For SEM, a sample size must be greater than 100 cases. Therefore, from a population size of 119 individuals, 98 responses were retrieved, which indicated a response rate of 82%. This figure was considered appropriate based on the existing literature [97,98].

5. Data Analysis and Results

5.1. Characteristics of the Respondents

Table 2 shows the demographic profile of the respondents (i.e., profession, experience, and educational attainment). Architects constitute 26%, quantity surveyors constitute 30%, 18% are builders, and 26% are engineers. The composition of the respondents shows that the critical professions in the construction industry are well represented among the respondents. Hence, credible sources of information for the study have been established. Likewise, half (50%) of the respondents have been in their profession in the construction industry between 11 and 20 years, while 37% have experience below 10 years (Table 2). Thirteen percent (13%) have more than 20 years of experience. This indicates that the respondents possess the requisite knowledge for the construction process. Based on the educational qualification of the respondents, B.Sc./B. Tech degree holders make up 46%, while HND holders constitute 15%. M.Sc./M. Tech holders constitute 27%. Those with a PhD constitute 12% of the respondents (Table 2).
Based on their educational attainment, it can be inferred that all the respondents are educationally sound concerning construction expertise and deemed relevant for this research. Based on the number of construction projects undertaken/participated in by the respondents, 32% of the respondents have participated in 11–15 projects, 22% in 16–20 projects, and 19% in more than 20 projects. Additionally, 17% and 10% of the respondents have participated in 6–10 and 1–5 projects, respectively. It revealed that the respondents who participated in this study are experienced professionals in the construction industry. Therefore, they are conversant with the use of technology in the industry. Concerning the type of organization where the respondents practice, results indicate that 35% work in consulting firms, 36% in government agencies, and 29% in contracting firms. Thus, it can be inferred that professionals have different backgrounds and practices in relevant sectors of the construction industry.

5.2. Common Method Bias (CMB)

The CMB is the variance or error measurement that affects a study’s validity. It represents the systematic error variance linked with the estimated and the measured variables [57]. Thus, Harman’s single-factor assessment of models, which indicates numerous structure measures, was used for the measurement [28]. To measure the variance of the standard method, the single-factor test was adopted [58]. If the total variance of the factors is less than 50%, the CMB does not affect the results [28]. Based on this study’s results, the first category of factors represents 11.75% of the total variance, which means that the CMV is not likely to influence the results, because it is less than the threshold of 50% [28].

5.3. Normality Test of Data

The test of data normality is an important check when using multivariate approaches to data analysis, including regression analysis and SEM. By the way, alternatives should be utilized when a normality assumption is violated [99]. In this study, the normality of data was measured as an elementary assumption, and the normality test results for all variables in the model are shown in Table 3 [100]. If the skewness value is between −2 and +2 and the kurtosis value is between −7 and +7, the data are considered normal. As shown in the following table, the skewness ranged from −1.45 to −0.29, and the kurtosis ranged from −0.65 to 1.50, revealing that all variables are normally distributed.

5.4. Reliability Test of Data

Table 4 provides the reliability analysis results. According to Nunnally [101], Cronbach’s alpha values greater than 0.6 are acceptable for newly developed measurements, while the average value is 0.7, and those above 0.8 are highly reliable. Therefore, all the above Cronbach’s alpha values are acceptable, as they are above 0.6. The set average correlations of the items were higher than 0.3 for all objects, indicating consistent internal variables [79].

5.5. Exploratory Factor Analysis

Using an exploratory factor analysis (EFA), the factorability structure of the 18 items relating to the cyber technology CSFs was determined. Consequently, several popular factorability parameters were adopted. One such is the Kaiser–Meyer–Olkin (KMO). It is a measurement of factor homogeneity used to check if the partial correlations among variables are the minimum [102]. Tabachnick et al. [103] argued that the KMO values range between 0 and 1, and a minimum value of 0.6 is commonly associated with a successful factor analysis. Apart from KMO, the Bartlett sphericity test was used to compare an observed correlation matrix to the identity matrix, where p < 0.05 was considered significant [104,105]. For this study, the KMO sampling adequacy measure was 0.854, above the recommended threshold value of 0.6. It indicated that a factor analysis could be performed on the factors. More so, Bartlett’s test of sphericity revealed a high chi-square value of 215.623, with a significance level of 0.001, which falls below the 0.050 threshold. It further highlights that the EFA is suitable for the various cyber technology CSFs. The validity of each variable was also tested with the anti-image correlation matrix diagonals reflecting values over 0.5, which validated its suitability. A quick look at the communities revealed that all values were between 0.40 and 0.70 [94]. Values below 0.4 were considered problematic. The scree plot and its matrix were examined objectively using the factors extracted. Based on the scree plot, there was a shift or break after the seventh component, and sections above this level were retained [94], as shown in Figure 2. The point on the scree plot where the slope of the curve trails off gives a clear indication of the components that should be further analyzed.
Table 5 presents the matrices of the seven extracted components concerning the various identified drivers of cyber technology in the construction industry. The matrices indicated the individual relationship (positive or negative) between each factor and each extracted component. The total variance explained for the cyber technology CSFs in the construction industry with the Principal Component Analysis revealed the presence of seven components with initial eigenvalues ≥1. These components explained 12.89%, 12.74%, 12.29%, 11.06%, 10.33%, 10.02%, and 8.36% variances for components 1–7, respectively. The results further showed the rotated component matrix of the various drivers for cyber technology adoption in the construction industry (Table 5). After eight iterations, the rotation converged concerning the initial eigenvalue of 1. The highlighted matrices indicated the benefits with the slightest variations in the initial eigenvalue. Additionally, Table 6 shows the factors/drivers that share a common attribute with the extracted components based on the initial eigenvalue of 1, and all commonalities have been accepted (Table 7). Factors with the same/similar extraction coefficients are grouped in the components (Table 8).
All loading factors are greater than 0.5, except D7, D9, D3, D2, and D17. It is important to note that the factor “D16” has been deleted, since there cannot be only one factor in the group (Table 9) [106]. Consequently, there were five accepted groups based on the EFA on all 18 items: Governmental, Customer satisfaction, Time, Social safety, and Marketability of the construction product.
The highest loading of each variable in the matrix was used to identify the variables for each phase of the factor. Cronbach’s alpha values greater than 0.6 are considered appropriate, and 0.7 are suitable, while those above 0.75 are deemed highly accurate [96]. Therefore, in this study, values greater than 0.6 were obtained, making it appropriate for further analysis [79].
Following the factor analysis, the conceptual model (Figure 3) for the study was created, and it contains the four hypotheses listed below.
  • H1. Governmental satisfaction positively influences cyber technology CSFs implementation.
  • H2. Customer satisfaction positively influences cyber technology CSFs implementation.
  • H3. Time positively influences cyber technology CSFs implementation.
  • H4. Social safety positively influences cyber technology CSFs implementation.
  • H5. Marketability of the construction product positively influences cyber technology CSFs implementation.

5.6. Measurement Model

In assessing the reflective measurement models in PLS-SEM, the convergent and discriminant validity and internal reliability must be evaluated. The structural model would, subsequently, be evaluated after the reliability and validity of the measurement model were analyzed [107]. Table 10 shows that all the model constructs satisfy the established thresholds ( α and ρ c > 0.70) and, hence, are acceptable [108].
Table 7 further shows that the constructs also satisfied the AVE threshold, with values above 0.5 considered acceptable [84]. These results indicate that the measurement model is internally consistent and convergent. It further implies that the measurement elements for each construct are well-measured and do not assess any other construct. Constructs with high outer loads indicate a close relationship between the relevant items for each construct, while low outer loadings (below 0.4) indicate that the loadings are less influential and are removed [109]. The external loadings of the measurement models for all items are acceptable, as shown in Figure 4.

5.6.1. Discriminant Validity

Table 11 showed that the square roots of the AVEs have stronger correlations with other constructs than their respective equivalent correlations. This indicates that there is no preexisting link with any of the constructs. In addition, the data demonstrate that each predictor achieves the maximum loading on the related construct. It further highlights the suitability of the constructs, which suggests that an acceptable degree of one-dimensionality may be secured for each construction.

5.6.2. Path Model Validation

In addition, the variance inflation factor (VIF) was evaluated to explore the collinearity among the construct’s formative variables. In this study, all VIF values were below the value of 3.5, which shows that the subdomains significantly contributed to the higher-order constructs. Subsequently, bootstrapping was performed to predict the significance of the path coefficients, revealing that all the analyzed paths are statistically significant (Table 12) [83].

5.6.3. Predictive Relevance Q² and Effect Size f2 of the Structural Model

The cross-validated redundancy measures for each dependent variable were tested using a blinding approach. The findings showed that the Q2 value of project success of 0.220 is significantly greater than zero, showing that independent constructs have a predictive relevance for both dependent constructs and moderators taken into consideration in this study [109]. In addition, the other indicator was called the f2 or effect size. The calculation of the effect size is as below [66]:
ƒ2 = (R2included − R2excluded)/(1 − R2excluded)
The suggested guidelines for measuring the effect size are f2 ≥ 0.02, f2 ≥ 0.15, and f2 ≥ 0.35, correspondingly representing the small, medium, and large effect sizes of the exogenous construct [110]. The results of the f2 showed an influence of the size of the exogenous construct for the project performance: CSFs with f2 = 1.45.

6. Discussion

Unlike developed nations, adopting cyber technology in construction in developing countries remains limited and modest. Thus, these developing nations, including Nigeria, have continued to experience difficulties in infrastructural development and contradictions in the standards of residential building construction. Although new technologies are expected to impact the sector significantly, the cyber technology’s potential benefits and implications are still difficult to assess. More so, the essential links in the supply chain, the stages that make up the building project lifecycle, and the implications for different industry stakeholders are yet to be fully understood [111,112]. This underlines the need to implement cyber/digital technology principles to address most of these concerns. The practitioners’ recognition of cyber technology and its benefits in construction activities will significantly enhance the decision for higher-level executives to embrace cyber technology as an integral platform/element in their projects. The successful application of cyber technology is often based on understanding its adoption and benefits by various stakeholders (including understanding the CSFs influencing cyber/digital technology). As revealed by the proposed model, all five cyber/digital technology constructs significantly impact cyber/digital technology implementation, which can enhance the sustainability of residential building projects. Therefore, by adopting cyber/digital technology, building enterprises can improve the quality of their activities and processes at a reduced cost and time efficiency. The components derived from the PLS-SEM model can be used to prioritize the CSFs of cyber/digital technology, and these are thoroughly discussed in the preceding sections.

6.1. Governmental

The role of the “government” in constructing infrastructural projects in an economy cannot be overstated. Based on the PLS-SEM model’s results, the governmental factor possessed the highest effect on the CSFs of cyber/digital technology with a coefficient loading of 0.408. The components loadings of 0.852 and 0.610 were from the constructs the “availability of a working communication layer” and “government support”, respectively. This is in line with the existing literature [100]. Communication networks allow data to be collected by mobile devices and then transferred to the database through the internet [14]. A good communication network, through the support of various levels of government, helps to promote technology use in the construction industry.

6.2. Customer Satisfaction

Another critical component is related to “customer satisfaction”. The construct has two components: availability of sensors and customer satisfaction, with factor loadings of 0.941 and 0.530, respectively. With a coefficient loading of 0.400, “customer satisfaction” is also related to “stakeholders and knowledge”. These have a significant impact on the CSFs of cyber/digital technology. This is also in line with the existing literature [55]. Sensors provide access to crucial information required for cyber applications, improving the satisfaction of consumers of the services from the industry [15].

6.3. Time

A critical component is related to the “time” with a coefficient loading of 0.367. It ranks third on the scale of CSFs for cyber technology implementation. Constructs such as the “creation of workable virtual models” and “project time regulations” possessed factor loadings of 0.880 and 0.602, respectively. As earlier stated during the review of the existing literature, VMs are often used to control physical components of cyber/digital technologies remotely. Thus, it ensures construction safety in the industry processes and activities. These have reiterated that cyber technology’s safety depends on the virtual means adopted [39,60].

6.4. Social Safety

Social safety is another critical component. It has a coefficient loading of 0.203. Constructs including “safety and security”, “employment development”, and “fraud resistance and the availability of good communication networks” possessed factor loadings of 0.720, 0.748, and 0.779, respectively. The current results concurred with the existing literature [7]. Fraud is a significant impediment to the growth and transparency of the construction industry [7]. Through cyber technologies, several of these issues can be addressed. The data collected by mobile devices can also be sent to the database via the internet using communication networks [101].

7. Marketability of the Construction Product

The final component is related to the marketability of the construction product. It has a coefficient loading of 0.16. Constructs including flexibility and market advantage possessed factor loadings of 0.654 and 0.827, respectively. When flexibility is assured, marketability can be guaranteed. Additionally, Akanmu et al. [36] corroborated this by arguing that electronic devices aid the marketability of the technology to the end users.

7.1. Managerial Implications

The formulation of the final model underpinned by the CSFs is a potential framework to be used by residential building professionals (including contractors, project owners, and stakeholders) in executing cyber/digital technology in their projects more effectively. Thus, this can provide a “benchmarking tool” or “framework” for successfully transforming construction industry processes and activities through cyber technology. This will ultimately help developing countries such as Nigeria experience a competitive, stable, sustainable economy. The model and “road map” developed in this study further strengthen developing nations’ need to encourage cyber technology adoption [113]. These developing nations face several limitations in their quest to embrace new technologies, such as cost concerns, technology knowhow, and a general lack of awareness of these cyber technologies [114]. As shown in this study, cyber technology provides the opportunity for sustainability and other relevant innovations to be incorporated into the design procedures of construction projects [115,116]. Therefore, this study contributes to the body of knowledge on several ways cyber technology benefits the construction industry.
  • Firstly, this study revealed that the governmental component possessed the highest effect on the model. Hence, this study has provided a platform for understanding digital (or cyber) technology standards and the corresponding factors that influence the adoption of digital technology to assess their ability to compete and thrive in the international market via cyber technology integration.
  • Secondly, this study has provided vital information concerning residential building professionals (including contractors, project owners, and stakeholders) to implement digital technology in their projects. This will enable building corporations to optimize the efficiency, planning, constructability, and consistency of the building/construction projects’ sustainability.
  • Thirdly, this study provides empirical proof for developing nations such as Nigeria that the benefits of adopting cyber technologies certainly outweigh the drawbacks.
  • This study revealed that developed nations have been at the forefront of related cyber technology and cyber technology research. However, some emerging nations, including Australia, China, Hong Kong, Saudi Arabia, the United Kingdom, the United States, and several others, have continued to research how cyber technologies have changed the construction industry landscape in their respective countries.
  • With very few studies on the subject matter in developing nations such as Nigeria, this study has highlighted the need for a paradigm shift from traditional construction methods to a digitalized approach.
  • Hence, this study has narrowed the gap by introducing cyber technology into the Nigerian construction industry.
  • Additionally, this study’s results will provide a reference point for future studies on the need to integrate cyber technology into the activities and processes of the construction industry in Nigeria.
  • Another contribution of the study is in the area of the methodological approach. Several existing studies on digital technology in the construction industry have centered around numerous statistical methods, such as the analysis of variance (ANOVA), content analysis, multiple analysis of variance (MANOVA), and regression modeling.
  • Using PLS-SEM, the weaknesses observed in those first-generation analysis methods were mitigated. This study has provided a deep analysis of the various purposes of adopting and implementing digital technology into the activities and processes of the construction industry.
  • Apart from leading to sustainability in the project, digital technologies can lead to the timely delivery of projects, improved flow of information across the organization, improved efficiency in operations, improved communication processing, enabled innovation, the improved international competitiveness of the construction project delivery, an improved return of investments, and so on.
  • This study also provided excellent results for residential building professionals (including contractors, project owners, and stakeholders) on incorporating cyber technology into the construction industry to enhance project success.
  • Additionally, the regulatory bodies of the construction industry will benefit immensely from this study in the area of policy-making to incorporate the technology into newly revised policies of the construction industry [20]. By assessing the CSFs and factors for incorporation, cyber technology can be quickly and gradually incorporated into construction activities in Nigeria.

7.2. Theoretical Implications

Although the concept of sustainable development is not new, it does seem to play a vital role in the way the activities and processes of the construction industry are perceived. The CSFs model developed using Partial Least Square Structural Equation Modeling (PLS-SEM) was adopted. Thus, the results of this study will have the following theoretical implications:
  • provides a functional framework for implementing digital technology in building sustainable residential projects, especially in developing countries. For this reason, CSFs for implementing digital technology in developing nations are implemented through the lens of Nigeria as a case study.
  • Assessing these CSFs was critical in overcoming the present barriers facing the successful implementation of cyber technology in the Nigerian construction industry. The objective of this study is novel, considering that no study has analyzed digital technology CSFs in a Nigerian context before.
  • Therefore, this study has provided a baseline framework built on CSFs for future studies based on the need to integrate cyber technology into the activities and processes of the construction industry in Nigeria. The five constructs of CSFs digital technology were empirically tested using the PLS-SEM, and inferences were made from the analysis using the bootstrapping technique [108].

8. Conclusions

Cyber/digital technology is widely accepted as a valuable instrument for maximizing money’s value and boosting project goals and sustainability. However, the application of cyber technology in developing nations is slow and still has a long way to go. Developing countries, including Nigeria, have encountered several issues with adopting cyber/digital technologies, resulting in discrepancies and anomalies in achieving adequate infrastructural development. One way to mitigate these problems is adopting cyber/digital technology in Nigeria’s construction industry. This study addressed the CSFs of cyber/digital technology implementation in the Nigerian construction industry using Partial Least Square Structural Equation Modeling (PLS-SEM). The identified cyber/digital technology CSFs from the literature were subjected to an exploratory factor analysis (EFA) and subsequently analyzed using the PLS-SEM method. However, this study adopted only a quantitative approach in evaluating the CSFs; future studies could adopt a qualitative or mixed-methods approach to mitigate against any weakness(es) that might be encountered using a single methodological approach. Moreso, the sampling techniques adopted and the scope for this study (i.e., Nigeria), which, in this case, were both purposive and snowball, make it challenging to generalize the study’s findings. Therefore, future studies could employ different sampling techniques to eradicate any possible bias that may have sprung up from using both the purposive and snowball techniques. Even though cyber/digital technology has been broadly discussed in the literature, for some sectors, including construction, the adoption of this technology is still immature and has evolved mainly at the theoretical level, short of practical applications. This study has demonstrated our novel efforts to identify and investigate the critical success factors (CSFs) required for implementing cyber technology in residential building projects. Investigations of these CSFs for potential applications of cyber/digital technology to realize sustainability in residential construction projects could lead to significant cost savings, improve construction efficiency, and reduce delays in project execution. Lastly, the model for the CSFs was developed to showcase the adoption of cyber/digital technology with other implications for facilitating the goal of achieving sustainable residential building projects.

Author Contributions

Methodology, A.F.K.; Software, A.F.K. and A.O.; Validation, J.A.; Investigation, A.F.K.; Writing–review & editing, A.F.K., M.M.H. and E.O. All authors have read and agreed to the published version of the manuscript.

Funding

This study was supported via funding from Prince Sattam bin Abdulaziz University, project number PSAU/2023/R/1444.

Institutional Review Board Statement

Not applicable.

Informed Consent Statement

Not applicable.

Data Availability Statement

Not applicable.

Conflicts of Interest

The authors declare no conflict of interest.

References

  1. Chan, A.P.; Adabre, M.A. Bridging the gap between sustainable housing and affordable housing: The required critical success criteria (CSC). Build. Environ. 2019, 151, 112–125. [Google Scholar] [CrossRef]
  2. Sbci, U. Buildings and Climate Change: Summary for Decision-Makers; Sustainable Buildings and Climate Initiative, Paris; United Nations Environmental Programme: Nairobi, Kenya, 2009; pp. 1–62. [Google Scholar]
  3. Gan, X.; Zuo, J.; Wu, P.; Wang, J.; Chang, R.; Wen, T. How affordable housing becomes more sustainable? A stakeholder study. J. Clean. Prod. 2017, 162, 427–437. [Google Scholar] [CrossRef]
  4. Dezhi, L.; Yanchao, C.; Hongxia, C.; Kai, G.; Hui, E.C.-M.; Yang, J. Assessing the integrated sustainability of a public rental housing project from the perspective of complex eco-system. Habitat Int. 2016, 53, 546–555. [Google Scholar] [CrossRef]
  5. Al-Saadi, R.; Abdou, A. Factors critical for the success of public—private partnerships in UAE infrasstructure projects: Experts’ perception. Int. J. Constr. Manag. 2016, 16, 234–248. [Google Scholar]
  6. Bezuidenhout, L. From Welfare to Community Development-The Role of Local Congregations as Agents of Development in the Mangaung Metropolitan Area. Ph.D. Thesis, University of the Free State, Bloemfontein, South Africa, 2019. [Google Scholar]
  7. Chan, A.P.C.; Darko, A.; Olanipekun, A.O.; Ameyaw, E.E. Critical barriers to green building technologies adoption in developing countries: The case of Ghana. J. Clean. Prod. 2018, 172, 1067–1079. [Google Scholar] [CrossRef]
  8. Durdyev, S.; Ismail, S.; Ihtiyar, A.; Bakar, N.F.S.A.; Darko, A. A partial least squares structural equation modeling (PLS-SEM) of barriers to sustainable construction in Malaysia. J. Clean. Prod. 2018, 204, 564–572. [Google Scholar] [CrossRef]
  9. Dimakis, N.; Filippoupolitis, A.; Gelenbe, E. Distributed building evacuation simulator for smart emergency management. Comput. J. 2010, 53, 1384–1400. [Google Scholar] [CrossRef] [Green Version]
  10. Doloi, H. Understanding impacts of time and cost related construction risks on operational performance of PPP projects. Int. J. Strateg. Prop. Manag. 2012, 16, 316–337. [Google Scholar] [CrossRef]
  11. Leite, F.; Cho, Y.; Behzadan, A.H.; Lee, S.; Choe, S.; Fang, Y.; Akhavian, R.; Hwang, S. Visualization, information modeling, and simulation: Grand challenges in the construction industry. J. Comput. Civ. Eng. 2016, 30, 04016035. [Google Scholar] [CrossRef] [Green Version]
  12. Kineber, A.F.; Othman, I.; Oke, A.E.; Chileshe, N.; Buniya, M.K. Identifying and Assessing Sustainable Value Management Implementation Activities in Developing Countries:The Case of Egypt. Sustainability 2020, 12, 9143. [Google Scholar] [CrossRef]
  13. Balasubramanian, S.; Shukla, V.; Islam, N.; Manghat, S. Construction industry 4.0 and sustainability: An enabling framework. In IEEE Transactions on Engineering Management; IEEE: Piscataway, NJ, USA, 2021. [Google Scholar]
  14. Russell-Smith, S.V.; Lepech, M.D. Cradle-to-gate sustainable target value design: Integrating life cycle assessment and construction management for buildings. J. Clean. Prod. 2015, 100, 107–115. [Google Scholar] [CrossRef]
  15. Jiao, Y.B. The Design of the Logistics Information Sharing Platform Based on Cloud Computing. In Advanced Materials Research; Trans Tech Publications Ltd.: Wollerau, Switzerland, 2013; pp. 3220–3223. [Google Scholar]
  16. Shen, W.; Hao, Q.; Mak, H.; Neelamkavil, J.; Xie, H.; Dickinson, J.; Thomas, R.; Pardasani, A.; Xue, H. Systems integration and collaboration in architecture, engineering, construction, and facilities management: A review. Adv. Eng. Inform. 2010, 24, 196–207. [Google Scholar] [CrossRef] [Green Version]
  17. Akanmu, A.; Anumba, C.; Messner, J. Active monitoring and control of light fixtures during building construction and operation: Cyber-physical systems approach. J. Archit. Eng. 2014, 20, 04013008. [Google Scholar] [CrossRef]
  18. You, Z.; Wu, C. A framework for data-driven informatization of the construction company. Adv. Eng. Inform. 2019, 39, 269–277. [Google Scholar] [CrossRef]
  19. Chen, B.; Wan, J.; Shu, L.; Li, P.; Mukherjee, M.; Yin, B. Smart factory of industry 4.0: Key technologies, application case, and challenges. IEEE Access 2017, 6, 6505–6519. [Google Scholar] [CrossRef]
  20. Kaewunruen, S.; Sresakoolchai, J.; Ma, W.; Phil-Ebosie, O. Digital twin aided vulnerability assessment and risk-based maintenance planning of bridge infrastructures exposed to extreme conditions. Sustainability 2021, 13, 2051. [Google Scholar] [CrossRef]
  21. Oesterreich, T.D.; Teuteberg, F. Understanding the implications of digitisation and automation in the context of Industry 4.0: A triangulation approach and elements of a research agenda for the construction industry. Comput. Ind. 2016, 83, 121–139. [Google Scholar] [CrossRef]
  22. Ebekozien, A.; Samsurijan, M.S. Incentivisation of digital technology takers in the construction industry. Eng. Constr. Archit. Manag. 2022. [Google Scholar] [CrossRef]
  23. Stetsenko, S.P.; Tytok, V.V.; Emelianova, O.M.; Bielienkova, O.Y.; Tsyfra, T.Y. Management of adaptation of organizational and economic mechanisms of construction to increasing impact of digital technologies on the national economy. J. Rev. Glob. Econ. 2020, 9, 149–164. [Google Scholar] [CrossRef]
  24. Windapo, A.O. The construction industry transformation and the digital divide: Bridging the gap. S. Afr. J. Sci. 2021, 117, 1–4. [Google Scholar] [CrossRef]
  25. Mohamad Ramly, Z.; Shen, G.Q.; Yu, A.T. Critical success factors for value management workshops in Malaysia. J. Manag. Eng. 2015, 31, 05014015. [Google Scholar] [CrossRef] [Green Version]
  26. Lu, W.; Shen, L.; Yam, M.C. Critical success factors for competitiveness of contractors: China study. J. Constr. Eng. Manag. 2008, 134, 972–982. [Google Scholar] [CrossRef]
  27. Saraph, J.V.; Benson, P.G.; Schroeder, R.G. An instrument for measuring the critical factors of quality management. Decis. Sci. 1989, 20, 810–829. [Google Scholar] [CrossRef]
  28. Male, S.; Kelly, J.; Fernie, S.; Grönqvist, M.; Bowles, G. Value Management: The Value Management Benchmark: A Good Practice Framework for Clients and Practitioners; Thomas Telford Publishing: London, UK, 1998. [Google Scholar]
  29. Ikuabe, M.; Aghimien, D.; Aigbavboa, C.; Oke, A. Exploring the adoption of digital technology at the different phases of construction projects in South Africa. In Proceedings of the International Conference on Industrial Engineering and Operations Management, Dubai, United Arab Emirates, 10–12 March 2020; pp. 10–12. [Google Scholar]
  30. Gurgun, A.P.; Koc, K.; Kunkcu, H. Exploring the adoption of technology against delays in construction projects. Eng. Constr. Archit. Manag. 2022; ahead-of-print. [Google Scholar] [CrossRef]
  31. Sadeghi, M.; Mahmoudi, A.; Deng, X. Adopting distributed ledger technology for the sustainable construction industry: Evaluating the barriers using Ordinal Priority Approach. Environ. Sci. Pollut. Res. 2022, 29, 10495–10520. [Google Scholar] [CrossRef] [PubMed]
  32. Liu, J.; Yi, Y.; Wang, X. Exploring factors influencing construction waste reduction: A structural equation modeling approach. J. Clean. Prod. 2020, 276, 123185. [Google Scholar] [CrossRef]
  33. Mardani, A.; Kannan, D.; Hooker, R.E.; Ozkul, S.; Alrasheedi, M.; Tirkolaee, E.B. Evaluation of green and sustainable supply chain management using structural equation modelling: A systematic review of the state of the art literature and recommendations for future research. J. Clean. Prod. 2020, 249, 119383. [Google Scholar] [CrossRef]
  34. Ingle, P.V.; Mahesh, G. Construction project performance areas for Indian construction projects. Int. J. Constr. Manag. 2022, 22, 1443–1454. [Google Scholar] [CrossRef]
  35. Wuni, I.Y.; Shen, G.Q. Critical success factors for modular integrated construction projects: A review. Build. Res. Inf. 2020, 48, 763–784. [Google Scholar] [CrossRef]
  36. Akanmu, A.; Anumba, C.; Messner, J. Scenarios for cyber-physical systems integration in construction. J. Inf. Technol. Constr. 2013, 18, 240–260. [Google Scholar]
  37. Ding, D.; Han, Q.-L.; Xiang, Y.; Ge, X.; Zhang, X.-M. A survey on security control and attack detection for industrial cyber-physical systems. Neurocomputing 2018, 275, 1674–1683. [Google Scholar] [CrossRef]
  38. Sørensen, C. Enterprise Mobility: Tiny Technology with Global Impact on Work; Springer: Berlin/Heidelberg, Germany, 2011. [Google Scholar]
  39. Akanmu, A.A.; Anumba, C.J.; Ogunseiju, O.O. Towards next generation cyber-physical systems and digital twins for construction. J. Inf. Technol. Constr. 2021, 26, 505–525. [Google Scholar] [CrossRef]
  40. Pärn, E.A.; de Soto, B.G. Cyber threats and actors confronting the Construction 4.0. In Construction 4.0; Routledge: Oxfordshire, UK, 2020; pp. 441–459. [Google Scholar]
  41. Al-Rakhami, M.; Gumaei, A.; Alsahli, M.; Hassan, M.M.; Alamri, A.; Guerrieri, A.; Fortino, G. A lightweight and cost effective edge intelligence architecture based on containerization technology. World Wide Web 2020, 23, 1341–1360. [Google Scholar] [CrossRef]
  42. Navon, R.; Sacks, R. Assessing research issues in automated project performance control (APPC). Autom. Constr. 2007, 16, 474–484. [Google Scholar] [CrossRef]
  43. Golovina, O.; Teizer, J.; Pradhananga, N. Heat map generation for predictive safety planning: Preventing struck-by and near miss interactions between workers-on-foot and construction equipment. Autom. Constr. 2016, 71, 99–115. [Google Scholar] [CrossRef]
  44. Bhave, A.; Garlan, D.; Krogh, B.; Rajhans, A.; Schmerl, B. Augmenting software architectures with physical components. In Proceedings of the ERTS2 2010, Embedded Real Time Software & Systems, Toulouse, France, 19–21 May 2010. [Google Scholar]
  45. Onyegiri, I.; Nwachukwu, C.; Jamike, O. Information and communication technology in the construction industry. Am. J. Sci. Ind. Res. 2011, 2, 461–468. [Google Scholar] [CrossRef]
  46. Tang, P.; Bittner, R.B. Use of value engineering to develop creative design solutions for marine construction projects. Pract. Period. Struct. Des. Constr. Build. Mater. 2014, 19, 129–136. [Google Scholar] [CrossRef]
  47. Fan, X.; Fan, K.; Wang, Y.; Zhou, R. Overview of cyber-security of industrial control system. In Proceedings of the 2015 International Conference on Cyber Security of Smart Cities, Industrial Control System and Communications (SSIC), Shanghai, China, 5–7 August 2015; pp. 1–7. [Google Scholar]
  48. Al-Rakhami, M.; Alsahli, M.; Hassan, M.M.; Alamri, A.; Guerrieri, A.; Fortino, G. Cost efficient edge intelligence framework using docker containers. In Proceedings of the 2018 IEEE 16th Intl Conf on Dependable, Autonomic and Secure Computing, 16th Intl Conf on Pervasive Intelligence and Computing, 4th Intl Conf on Big Data Intelligence and Computing and Cyber Science and Technology Congress (DASC/PiCom/DataCom/CyberSciTech), Athens, Greece, 12–15 August 2018; pp. 800–807. [Google Scholar]
  49. Fan, H.; Xue, F.; Li, H. Project-based as-needed information retrieval from unstructured AEC documents. J. Manag. Eng. 2015, 31, A4014012. [Google Scholar] [CrossRef]
  50. Gu, W.; Foster, K.; Shang, J.; Wei, L. A game-predicting expert system using big data and machine learning. Expert Syst. Appl. 2019, 130, 293–305. [Google Scholar] [CrossRef]
  51. de Soto, B.G.; Georgescu, A.; Mantha, B.; Turk, Ž.; Maciel, A. Construction cybersecurity and critical infrastructure protection: Significance, overlaps, and proposed action plan. Preprints 2020, 2020050213. [Google Scholar] [CrossRef]
  52. Liu, C.; Xu, X. Cyber-physical machine tool–the era of machine tool 4.0. Procedia Cirp 2017, 63, 70–75. [Google Scholar] [CrossRef]
  53. Wollschlaeger, M.; Sauter, T.; Jasperneite, J. The future of industrial communication: Automation networks in the era of the internet of things and industry 4.0. IEEE Ind. Electron. Mag. 2017, 11, 17–27. [Google Scholar] [CrossRef]
  54. Creese, S.; Dutton, W.H.; Esteve-Gonzalez, P.; Shillair, R. Cybersecurity capacity-building: Cross-national benefits and international divides. J. Cyber Policy 2021, 6, 214–235. [Google Scholar] [CrossRef]
  55. Turkan, Y.; Bosche, F.; Haas, C.T.; Haas, R. Automated progress tracking using 4D schedule and 3D sensing technologies. Autom. Constr. 2012, 22, 414–421. [Google Scholar] [CrossRef]
  56. Xia, F.; Hao, R.; Li, J.; Xiong, N.; Yang, L.T.; Zhang, Y. Adaptive GTS allocation in IEEE 802.15. 4 for real-time wireless sensor networks. J. Syst. Archit. 2013, 59, 1231–1242. [Google Scholar] [CrossRef]
  57. Akinci, B.; Anumba, C. Sensors in construction and infrastructure management. J. Inf. Technol. Constr. 2008, 13, 69–70. [Google Scholar]
  58. Sørensen, E. The Materiality of Learning: Technology and Knowledge in Educational Practice; Cambridge University Press: Cambridge, UK, 2009. [Google Scholar]
  59. El-Omari, S.; Moselhi, O. Integrating automated data acquisition technologies for progress reporting of construction projects. Autom. Constr. 2011, 20, 699–705. [Google Scholar] [CrossRef] [Green Version]
  60. Akanmu, A.A.; Anumba, C.J.; Messner, J.I. An RTLS-based approach to cyber-physical systems integration in design and construction. Int. J. Distrib. Sens. Netw. 2012, 8, 596845. [Google Scholar] [CrossRef] [Green Version]
  61. Kim, H.; Han, S. Accuracy improvement of real-time location tracking for construction workers. Sustainability 2018, 10, 1488. [Google Scholar] [CrossRef] [Green Version]
  62. Migliaccio, G.C.; Cheng, T.; Gatti, U.C.; Teizer, J. Data fusion of real-time location sensing (RTLS) and physiological status monitoring (PSM) for ergonomics analysis of construction workers. In Proceedings of the 19th Triennial CIB World Building Congress, Brisbane, Australia, 5–9 May 2013. [Google Scholar]
  63. Chen, H.-M.; Chang, K.-C.; Lin, T.-H. A cloud-based system framework for performing online viewing, storage, and analysis on big data of massive BIMs. Autom. Constr. 2016, 71, 34–48. [Google Scholar] [CrossRef]
  64. Memon, Z.A.; Abd, M.Z.; Mustaffar, M. A systematic procedure for developing the 3D model to evaluate the construction project progress. Constr. Innov. 2007, 7, 187–199. [Google Scholar] [CrossRef] [Green Version]
  65. Kim, S.; Moore, A.; Srinivasan, D.; Akanmu, A.; Barr, A.; Harris-Adamson, C.; Rempel, D.M.; Nussbaum, M.A. Potential of exoskeleton technologies to enhance safety, health, and performance in construction: Industry perspectives and future research directions. Trans. Occup. Ergonomics. Hum. Factors 2019, 7, 185–191. [Google Scholar] [CrossRef]
  66. Chin, W.W. The partial least squares approach to structural equation modeling. Mod. Methods Bus. Res. 1998, 295, 295–336. [Google Scholar]
  67. Bodoff, D.; Ho, S.Y. Partial least squares structural equation modeling approach for analyzing a model with a binary indicator as an endogenous variable. Commun. Assoc. Inf. Syst. 2016, 38, 23. [Google Scholar]
  68. Rahman, I.A.; Memon, A.H.; Aziz, A.A.A.; Abdullah, N.H. Modeling causes of cost overrun in large construction projects with partial least square-SEM approach: Contractor’s perspective. Res. J. Appl. Sci. Eng. Technol. 2013, 5, 1963–1972. [Google Scholar] [CrossRef] [Green Version]
  69. Henseler, J.; Hubona, G.; Ray, P.A. Using PLS path modeling in new technology research: Updated guidelines. Ind. Manag. Data Syst. 2016, 116, 2–20. [Google Scholar] [CrossRef]
  70. Banihashemi, S.; Hosseini, M.R.; Golizadeh, H.; Sankaran, S. Critical success factors (CSFs) for integration of sustainability into construction project management practices in developing countries. Int. J. Proj. Manag. 2017, 35, 1103–1119. [Google Scholar] [CrossRef]
  71. Lee, C.; Hallak, R. Investigating the moderating role of education on a structural model of restaurant performance using multi-group PLS-SEM analysis. J. Bus. Res. 2018, 88, 298–305. [Google Scholar] [CrossRef]
  72. Hult, G.T.M.; Hair Jr, J.F.; Proksch, D.; Sarstedt, M.; Pinkwart, A.; Ringle, C.M. Addressing endogeneity in international marketing applications of partial least squares structural equation modeling. J. Int. Mark. 2018, 26, 1–21. [Google Scholar] [CrossRef]
  73. Hair Jr, J.F.; Matthews, L.M.; Matthews, R.L.; Sarstedt, M. PLS-SEM or CB-SEM: Updated guidelines on which method to use. Int. J. Multivar. Data Anal. 2017, 1, 107–123. [Google Scholar] [CrossRef]
  74. Podsakoff, P.M.; MacKenzie, S.B.; Lee, J.-Y.; Podsakoff, N.P. Common method biases in behavioral research: A critical review of the literature and recommended remedies. J. Appl. Psychol. 2003, 88, 879. [Google Scholar] [CrossRef]
  75. Williams, L.J.; Cote, J.A.; Buckley, M.R. Lack of method variance in self-reported affect and perceptions at work: Reality or artifact? J. Appl. Psychol. 1989, 74, 462. [Google Scholar] [CrossRef]
  76. Strandholm, K.; Kumar, K.; Subramanian, R. Examining the interrelationships among perceived environmental change, strategic response, managerial characteristics, and organizational performance. J. Bus. Res. 2004, 57, 58–68. [Google Scholar] [CrossRef]
  77. Podsakoff, P.M.; Organ, D.W. Self-reports in organizational research: Problems and prospects. J. Manag. 1986, 12, 531–544. [Google Scholar] [CrossRef]
  78. Williams, B.; Onsman, A.; Brown, T. Exploratory factor analysis: A five-step guide for novices. Australas. J. Paramed. 2010, 8, 1–13. [Google Scholar] [CrossRef] [Green Version]
  79. Field, A. Discovering Statistics Using SPSS (3. baskı); Sage Publications: New York, NY, USA, 2009. [Google Scholar]
  80. Costello, A.B.; Osborne, J. Best practices in exploratory factor analysis: Four recommendations for getting the most from your analysis. Pract. Assess. Res. Eval. 2005, 10, 7. [Google Scholar]
  81. Olanrewaju, O.I.; Kineber, A.F.; Chileshe, N.; Edwards, D.J. Modelling the relationship between Building Information Modelling (BIM) implementation barriers, usage and awareness on building project lifecycle. Build. Environ. 2021, 207, 108556. [Google Scholar] [CrossRef]
  82. Al-Ashmori, Y.Y.; Othman, I.; Rahmawati, Y.; Amran, Y.M.; Sabah, S.A.; Rafindadi, A.D.u.; Mikić, M. BIM benefits and its influence on the BIM implementation in Malaysia. Ain Shams Eng. J. 2020, 11, 1013–1019. [Google Scholar] [CrossRef]
  83. Hulland, J. Use of partial least squares (PLS) in strategic management research: A review of four recent studies. Strateg. Manag. J. 1999, 20, 195–204. [Google Scholar] [CrossRef]
  84. Fornell, C.; Larcker, D.F. Evaluating structural equation models with unobservable variables and measurement error. J. Mark. Res. 1981, 18, 39–50. [Google Scholar] [CrossRef]
  85. Wong, K.K.-K. Partial least squares structural equation modeling (PLS-SEM) techniques using SmartPLS. Mark. Bull. 2013, 24, 1–32. [Google Scholar]
  86. Hair, J.F.; Anderson, R.E.; Babin, B.J.; Black, W.C. Multivariate Data Analysis: A Global Perspective (Vol. 7); Pearson: Upper Saddle River, NJ, USA, 2010. [Google Scholar]
  87. Alkilani, S.G.R.Z. Performance Measurement and Improvement Model for Small and Medium Contractors in Developing Countries. Ph.D. Thesis, The University of New South Wales, Kensington, Australia, 2018. [Google Scholar]
  88. Olanrewaju, O.I.; Kineber, A.F.; Chileshe, N.; Edwards, D.J. Modelling the impact of Building Information Modelling (BIM) Implementation Drivers and Awareness on Project Lifecycle. Sustainability 2021, 13, 8887. [Google Scholar] [CrossRef]
  89. Kineber, A.F.; Othman, I.; Oke, A.E.; Chileshe, N.; Zayed, T. Value management implementation barriers for sustainable building: A bibliometric analysis and partial least square structural equation modeling. Constr. Innov. 2021, 23, 38–73. [Google Scholar] [CrossRef]
  90. Othman, I.; Kineber, A.; Oke, A.; Zayed, T.; Buniya, M. Barriers of value management implementation for building projects in Egyptian construction industry. Ain Shams Eng. J. 2020, 12, 21–30. [Google Scholar] [CrossRef]
  91. Al-Mekhlafi, A.-B.A.; Isha, A.S.N.; Chileshe, N.; Abdulrab, M.; Saeed, A.A.H.; Kineber, A.F. Modelling the Relationship between the Nature of Work Factors and Driving Performance Mediating by Role of Fatigue. Int. J. Environ. Res. Public Health 2021, 18, 6752. [Google Scholar] [CrossRef] [PubMed]
  92. Buniya, M.K.; Othman, I.; Durdyev, S.; Sunindijo, R.Y.; Ismail, S.; Kineber, A.F. Safety Program Elements in the Construction Industry: The Case of Iraq. Int. J. Environ. Res. Public Health 2021, 18, 411. [Google Scholar] [CrossRef] [PubMed]
  93. Famakin, I.O.; Othman, I.; Kineber, A.F.; Oke, A.E.; Olanrewaju, O.I.; Hamed, M.M.; Olayemi, T.M. Building Information Modeling Execution Drivers for Sustainable Building Developments. Sustainability 2023, 15, 3445. [Google Scholar] [CrossRef]
  94. Oke, A.E.; Kineber, A.F.; Albukhari, I.; Othman, I.; Kingsley, C. Assessment of Cloud Computing Success Factors for Sustainable Construction Industry: The Case of Nigeria. Buildings 2021, 11, 36. [Google Scholar] [CrossRef]
  95. Oke, A.E.; Kineber, A.F.; Al-Bukhari, I.; Famakin, I.; Kingsley, C. Exploring the benefits of cloud computing for sustainable construction in Nigeria. J. Eng. Des. Technol. Soc. 2021. [Google Scholar] [CrossRef]
  96. Badewi, A. Investigating Benefits Realisation Process for Enterprise Resource Planning Systems. Ph.D. Thesis, Cranfield University, Cranfield, UK, 2016. [Google Scholar]
  97. Kothari, C. Research Methodology Methods and Techniques 2 nd Revised edition New Age International publishers. Retrieved Febr. 2009, 20, 2018. [Google Scholar]
  98. Wahyuni, D. The research design maze: Understanding paradigms, cases, methods and methodologies. J. Appl. Manag. Account. Res. 2012, 10, 69–80. [Google Scholar]
  99. Henseler, J.; Ringle, C.M.; Sinkovics, R.R. The use of partial least squares path modeling in international marketing. In New Challenges to International Marketing; Emerald Group Publishing Limited: Bingley, UK, 2009. [Google Scholar]
  100. Byrne, B. Structural Equation Modeling with AMOS: Basic Concepts, Applications, and Programming, 2nd ed.; Taylor & Francis Group: New York, NY, USA, 2010. [Google Scholar]
  101. Nunnally, J.C. Psychometric Theory 3E; Tata McGraw-Hill Education: New York, NY, USA, 1994. [Google Scholar]
  102. Sharma, S. Applied Multivariate Techniques; John Wiley and Sons: Hoboken, NJ, USA, 1996. [Google Scholar]
  103. Tabachnick, B.G.; Fidell, L.S.; Ullman, J.B. Using Multivariate Statistics; Pearson Boston: Boston, MA, USA, 2007; Volume 5. [Google Scholar]
  104. Tavakol, M.; Dennick, R. Making sense of Cronbach’s alpha. Int. J. Med. Educ. 2011, 2, 53. [Google Scholar] [CrossRef] [PubMed]
  105. Pallant, J. SPSS Survival Manual, 3rd ed.; McGrath Hill: New York, NY, USA, 2007; Volume 15. [Google Scholar]
  106. Kineber, A.F.; Othman, I.; Oke, A.E.; Chileshe, N.; Zayed, T. Exploring the value management critical success factors for sustainable residential building—A structural equation modelling approach. J. Clean. Prod. 2021, 293, 126115. [Google Scholar] [CrossRef]
  107. Hair, J.F.; Black, W.C.; Babin, B.J.; Anderson, R.E.; Tatham, R.L. Multivariate Data Analysis (Vol. 6); Pearson Prentice Hall: Upper Saddle River, NJ, USA, 2006. [Google Scholar]
  108. Hair, J.F.; Hult, G.T.M.; Ringle, C.; Sarstedt, M. A Primer on Partial Least Squares Structural Equation Modeling (PLS-SEM); Sage Publications: New York, NY, USA, 2016. [Google Scholar]
  109. Hair, J.F.; Ringle, C.M.; Sarstedt, M. PLS-SEM: Indeed a silver bullet. J. Mark. Theory Pract. 2011, 19, 139–152. [Google Scholar] [CrossRef]
  110. Cohen, J. Statistical Power for the Behavioural Sciences; Lawrence Erlbaum: New York, NY, USA, 1988. [Google Scholar]
  111. Mantha, B.R.; de Soto, B.G. Cyber security challenges and vulnerability assessment in the construction industry. In Proceedings of the Creative Construction Conference 2019, Budapest, Hungary, 29 June–2 July 2019; pp. 29–37. [Google Scholar]
  112. Arpaci, I.; Sevinc, K.J.I.D. Development of the cybersecurity scale (CS-S): Evidence of validity and reliability. Inf. Dev. 2022, 38, 218–226. [Google Scholar] [CrossRef]
  113. Aghimien, D.O.; Oke, A.E.; Aigbavboa, C.O. Barriers to the adoption of value management in developing countries. Eng. Constr. Archit. Manag. 2018, 25, 818–834. [Google Scholar] [CrossRef]
  114. Pham, D.H.; Kim, B.; Lee, J.; Ahn, A.C.; Ahn, Y. A Comprehensive Analysis: Sustainable Trends and Awarded LEED 2009 Credits in Vietnam. Sustainability 2020, 12, 852. [Google Scholar] [CrossRef] [Green Version]
  115. Zainul-Abidin, N.; Pasquire, C. Moving towards sustainability through value management. In Proceedings of the Joint International Symposium of CIB Working Commissions W55 and W107, Singapore, 22–24 October 2003; Volume 2, pp. 258–268. [Google Scholar]
  116. Abidin, N.Z.; Pasquire, C.L. Revolutionize value management: A mode towards sustainability. Int. J. Proj. Manag. 2007, 25, 275–282. [Google Scholar] [CrossRef]
Figure 1. Research design.
Sustainability 15 05043 g001
Figure 2. Scree plot results for cyber technology CSFs.
Sustainability 15 05043 g002
Figure 3. Research model.
Sustainability 15 05043 g003
Figure 4. The PLS-SEM structural model.
Sustainability 15 05043 g004
Table 1. CSFs of cyber technology in the construction industry.
CodeCSFsReferences
D1Availability of sensors[36,44,45,49,53,63,65]
D2Availability of good communication networks
D3Availability of mobile devices
D4Availability of device layers
D5Creation of workable virtual modes
D6Availability of a working communication layer
D7Availability of sensing layers
D8Government support
D9Globalization
D10Flexibility
D11Market Advantage
D12Customer satisfaction
D13Employment development
D14Its safety and security
D15Its fraud resistance
D16Accuracy
D17Life quality improvement
D18Project time regulations
Table 2. Characteristics of the respondents.
Educational Qualification
H.N.D 1515%
B. Sc/B. Tech4546%
M. Sc/M. Tech2627%
PhD1212%
Total98100%
Number of projects participated
1–5 1010%
6–10 1717%
11–15 3132%
16–20 2122%
Above 201919%
Total98100%
Type of organization
Consulting 3435%
Contracting 2929%
Government Agency3536%
Total98100%
Profession of practice
Architects2626%
Quantity Surveyor2930%
Builders1818%
Engineer2526%
Total98100%
Number of practice years
Below 103637%
Nov-204950%
Above 201313%
Total98100%
Table 3. Results of the normality test.
VariableSkewnessStd. ErrorKurtosisStd. Error
D1−0.520.17−0.560.33
D2−0.360.17−0.610.33
D3−0.330.17−0.530.33
D4−0.290.17−0.190.33
D5−1.510.171.660.33
D6−1.150.170.760.33
D7−0.860.170.360.33
D8−0.900.170.190.33
D9−0.680.170.050.33
D10−0.430.170.170.33
D11−0.670.17−0.370.33
D12−0.670.17−0.200.33
D13−0.570.17−0.180.33
D14−0.440.170.210.33
D15−0.650.17−0.550.33
D16−1.510.171.660.33
D17−0.680.170.050.33
D18−0.360.17−0.610.33
Table 4. Reliability analysis for barriers to the adoption of cyber technology CSF implementation.
Factors Reliability Analysis
Governmental0.712
Customer satisfaction0.745
Time0.765
Social safety0.798
Marketability of the construction product0.710
Table 5. Component matrix of the drivers for cyber technology adoption.
Component
1234567
D10.335−0.708−0.1690.445−0.0950.0850.002
D2−0.345−0.464−0.120−0.3020.487−0.1660.051
D3−0.0590.3830.551−0.156−0.0790.5530.338
D4−0.4410.018−0.3470.2680.113−0.1700.377
D50.0690.585−0.543−0.043−0.3840.1090.273
D6−0.0110.227−0.3140.4400.3170.3580.287
D70.229−0.0040.077−0.3380.6060.3320.065
D8−0.719−0.175−0.270−0.245−0.0570.2480.054
D9−0.5340.0140.1780.1880.297−0.4740.411
D100.6700.2780.0860.1280.169−0.0380.115
D110.027−0.5320.425−0.244−0.1740.2550.500
D12−0.0550.7430.315−0.3300.004−0.260−0.057
D130.2770.1120.1070.4670.6280.368−0.156
D14−0.169−0.0600.8170.1080.174−0.252−0.058
D150.4190.0460.2270.663−0.212−0.3280.224
D160.651−0.3700.104−0.299−0.3410.0790.128
D170.5810.039−0.362−0.3880.394−0.2060.115
D18−0.5380.0410.1550.374−0.1550.404−0.236
Extraction method: Principal Component Analysis.
Table 6. Total variance explained the drivers for cyber technology.
DriversInitial EigenvaluesExtraction Sums of Squared LoadingsRotation Sums of Squared Loadings
Total% of VarianceCumulative %Total% of VarianceCumulative %Total% of VarianceCumulative %
13.07217.06517.0653.07217.06517.0652.32112.89212.892
22.35713.09630.1602.35713.09630.1602.29312.73825.630
32.15511.97342.1332.15511.97342.1332.21312.29237.922
42.02411.24353.3772.02411.24353.3771.99011.05548.977
51.7959.97263.3491.7959.97263.3491.86010.33359.310
61.5598.66272.0111.5598.66272.0111.80410.02369.333
71.0225.67877.6891.0225.67877.6891.5048.35677.689
80.9475.26282.952
90.7093.93686.888
100.6613.67390.561
110.6243.46594.025
120.4882.71296.737
130.2151.19397.930
140.1650.91998.849
150.1080.60199.450
160.0860.47899.928
170.0130.07099.998
180.0000.002100.000
Extraction Method: Principal Component Analysis.
Table 7. Rotated component matrix of the drivers of cyber technology.
Component
Factors1234567
D10.207−0.8940.0070.064−0.0910.0290.031
D2−0.599−0.1880.2820.3570.3240.010−0.028
D30.0590.500−0.284−0.054−0.1360.2760.688
D4−0.111−0.109−0.092−0.2260.6920.006−0.088
D50.1170.2580.028−0.8850.055−0.095−0.047
D60.083−0.116−0.097−0.3880.3090.615−0.009
D7−0.2800.1170.4040.147−0.1660.5530.209
D8−0.730−0.037−0.316−0.1710.244−0.1360.086
D9−0.0070.161−0.0420.3150.838−0.0700.027
D100.5450.0970.389−0.068−0.1820.3110.021
D11−0.095−0.2520.0300.222−0.026−0.1600.848
D120.1370.8890.0760.036−0.024−0.102−0.080
D130.207−0.104−0.0360.173−0.0770.872−0.143
D140.2170.256−0.2010.7820.122−0.0210.167
D150.889−0.208−0.0430.0580.170−0.0430.005
D160.208−0.3050.390−0.029−0.514−0.2640.421
F17−0.0140.0040.873−0.141−0.1080.152−0.120
F18−0.146−0.014-0.8080.0220.0270.148−0.027
Extraction Method: Principal Component Analysis. Rotation Method: Varimax with Kaiser Normalization.
Table 8. Commonalities of the drivers to the extracted components.
Communalities
InitialExtraction
D11.0000.856
D21.0000.707
D31.0000.905
D41.0000.571
D51.0000.878
D61.0000.654
D71.0000.654
D81.0000.749
D91.0000.835
D101.0000.593
D111.0000.868
D121.0000.834
D131.0000.872
D141.0000.808
D151.0000.871
D161.0000.800
F171.0000.831
F181.0000.698
Table 9. Factor loadings of CSFs of cyber technology.
S/NComponent factorsDriversDriversFactor Loadings
1Component 1D6Availability of a working communication layer0.615
D8Government support0.553
2Component 2D1Availability of sensors0.692
D12Customer satisfaction0.545
3Component 3D7 *Availability of sensing layers0.357
D9 *Globalization0.148
D3 *Availability of mobile devices0.244
4Component 4D5Creation of workable virtual modes0.782
D18Project time regulations0.421
5Component 5D14Its safety and security0.848
D13Employment development0.872
D15Its fraud resistance0.889
D2 *Availability of good communication networks0.207
6Component 6D10Flexibility0.873
D11Market Advantage0.889
D4 *Availability of device layers0.838
7Component 7D16 *Accuracy0.688
D17 *Life quality improvement0.258
* Excluded due to low factor loading.
Table 10. The results of the convergent validity.
ConstructsCronbach’s AlphaComposite ReliabilityAVE
Governmental0.7120.7030.549
Customer satisfaction0.7450.7220.583
Time0.7650.7180.568
Social safety0.7980.7940.562
Marketability of the construction product0.7100.7120.556
Table 11. Discriminant validity.
ConstructsCustomer SatisfactionGovernmentalMarketability of the Construction ProductSocial SafetyTime
Customer satisfaction0.775
Governmental0.4160.74
Marketability of the construction product0.0010.0790.747
Social safety0.0470.0950.1890.749
Time0.0550.1210.1330.4020.741
Table 12. Path analysis.
PathsSDT Statistics Bp Values
Customer satisfaction -> CSFs of Cyber technology0.1361.4840.400<0.001
Governmental -> CSFs of Cybertechnology0.1141.8240.408<0.001
Marketability of the construction product -> CSFs of Cyber technology0.2171.0270.16<0.001
Social safety -> CSFs of Cyber technology0.1315.20.203<0.001
Time -> CSFs of Cybertechnology0.073.8080.367<0.001
Note: SD = Standard deviation; β = A standardized regression coefficient.
Disclaimer/Publisher’s Note: The statements, opinions and data contained in all publications are solely those of the individual author(s) and contributor(s) and not of MDPI and/or the editor(s). MDPI and/or the editor(s) disclaim responsibility for any injury to people or property resulting from any ideas, methods, instructions or products referred to in the content.

