Article

Impact of Heat Pump and Cogeneration Integration on Power Distribution Grids Based on Transition Scenarios for Heating in Urban Areas

by
Marten Fesefeldt
*,
Massimiliano Capezzali
,
Mokhtar Bozorg
and
Riina Karjalainen
Institute of Energy and Electrical Systems (IESE), School of Engineering and Management Vaud, HES-SO University of Applied Sciences and Arts Western Switzerland, Route de Cheseaux 1, 1400 Yverdon-les-Bains, Switzerland
*
Author to whom correspondence should be addressed.
Sustainability 2023, 15(6), 4985; https://doi.org/10.3390/su15064985
Submission received: 22 December 2022 / Revised: 1 March 2023 / Accepted: 8 March 2023 / Published: 10 March 2023
(This article belongs to the Special Issue Urban and Territorial Energy Planning)

Abstract

:
Electrification of final use sectors such as heating and mobility is often proposed as an effective pathway towards decarbonization of urban areas. In this context, power-driven heat pumps (HP) are usually strongly fostered as alternatives to fossil-burning boilers in municipal planning processes. In continental climates, this leads to substantially increased electricity demand in winter months that, in turn may lead to stress situations on local power distribution grids. Hence, in parallel to the massive implementation of electric HP, strategies must be put in place to ensure the grid stability and operational security, notably in terms of voltage levels, as well as transformer and line’s capacity limits. In this paper, three such strategies are highlighted within the specific situation of a mid-sized Swiss city, potentially representative of many continental, central Europe urban zones as a test-case. The hourly-based power flow simulations of the medium- and low-voltage distribution grids show the impact of various future scenarios, inspired from typical territorial energy planning processes, implying various degrees of heat pumps penetration. The first strategy relies on the implementation of decentralized combined heat and power (CHP) units, fed by the existing natural gas network and is shown to provide an effective pathway to accommodate heat pump electricity demand on urban power distribution grids. Two alternative solutions based on grid reinforcements and controlled usage of reactive power from photovoltaic (PV) inverters are additionally considered to ensure security constraints of grid operation and compared with the scenario relying on CHP deployment.

1. Introduction

In almost all European countries, the penetration of heating technologies aimed at replacing standard oil and natural-gas-based boilers has been steadfast since many years. This change is driven by local and national policies aimed at decreasing both greenhouse-gas emissions, as well as the usage of fossil energy sources. In the case of oil-based boilers, their replacement is also called for, in order to reduce particulate pollution in dense urban zones. Among the alternatives to these well-established, easy-to-use, but environmentally questionable technologies, power-driven heat pumps (HP) are penetrating the heating market in a substantial way and are often supported by local energy planning policies, since they do not emit any local direct pollution [1]. However, other possibilities are also finding a position in the evolving heating market, such as wood boilers, solar thermal collectors, combined heat and power units (CHP), along with a wide variety of district heating networks (DHN) typologies, covering from a few blocks to entire cities/regions and relying on both renewable (e.g., wood or geothermal energy) as well as non-renewable (e.g., natural gas) supply sources. In Switzerland, for example, public policies tend to favour both power-driven heat pumps and DHN configurations [2].
Power-driven heat pumps require massive amounts of electricity during winter time in continental, cold climates. This constitutes a major energy supply security issue in many European countries, in a period of decreasing available conventional power generation capacities—providing both baseload and peak power—and also due to the fact that solar PV generation in wintertime is limited on Central European latitudes [3]. In the case of Switzerland, PV is a favoured renewable option at power distribution level from an energy planning and local policy point of view. The penetration rate of PV, notably in terms of decentralized generation, is steadfast and is expected to continue in the next two decades [4]. PV production is intermittent and follows day-night, as well as summer-winter variations. On one hand, the integration of PV production on local power distribution grids, as well as additional charges such as electricity-driven HPs and increased amount of electric vehicles, must be carefully studied to avoid any violation from grid operation security constraints such as voltage limits and transformers and line’s capacity (loading) limits. On the other hand, even limited grid reinforcements typically require relatively large investments, especially in dense urban territories [5,6]. Hence, if electrification of usages by way of heat pumps in the heating sector but also in the mobility sector is presently on the way, the overall electricity and energy system resilience towards such evolutions—desirable from a sustainability point of view—needs to be carefully analysed and quantified in order to understand the impact on local grids. To the best of the authors’ knowledge, no study has attempted to quantitatively tackle how to balance the distribution grid requirements with the penetration of new decentralized production by way of PV and of massively increased (winter and night) demand through heat pumps, by focusing on a real grid configuration of an existing urban area and based on a hourly approach. The present study intends to cover this gap by proposing, quantifying and comparing three possible routes to increase HP implementation with PV production in urban areas, while fulfilling the physical and operational constraints of power distribution grids, based on real data.
In a previous article [7], the authors have demonstrated with an economic-based optimization how CHP units distributed on a given territory are able to bring one possible answer to the above-described issue of concomitant increase of power demand and intermittent power production on the distribution grids. Indeed, by generating both heat and distributed power in simultaneous and synergetic fashion, CHP contribute to additional and crucial local power supply matching new power consumptions, such as those emanating from newly installed HPs in winter time and electric vehicles charging units. However, in that paper, focus was mainly set on the economic optimization of the natural gas grid topology, while the potential contribution of adequately chosen CHP units with respect to the secure operation of the power distribution grid was estimated only on a yearly basis.
In the present paper, we follow up on [7] in several important directions. First, we focus on the hourly dynamics of power distribution grids, using real energy demand and supply data for the Swiss city of Yverdon-les-Bains as a test-case of the presented method. Yverdon-les-Bains represents a small- to mid-sized city in continental Europe with moderately cold climate. The selected approach is able to precisely and quantitatively identify the real-time effects linked to increased power consumption on given cold days, both in terms of deviations of voltage levels, as well as overloading conditions regarding both active and reactive power flow. Secondly, we focus on three ad hoc scenarios regarding the future replacement of standard oil and natural gas boilers, thereby identifying the precise role of bridging technologies such as CHP in the transition to more sustainable heating systems. Thirdly, we investigate two different approaches aimed at ensuring grid operation security constraints, namely by focused on grid reinforcement and dedicated usage of PV inverters to inject/consume reactive power, and compare their effectiveness in contributing to local power grid stability. The study thus provides quantified inputs based on real territorial data for increased implementation of urban PV production on the supply side, as well as additional demand from power-driven HPs. The approach can be easily broadened to include future electric vehicle charging needs, as shown in an internal project for a different test case but with a stronger focus on recharging of electric vehicles in microgrids [8].

2. Methodology

2.1. Definition of Boundaries

The following work must take into account several boundary condition based on: available computational power, relevance and data availability. The boundary conditions are distinguished according to three distinct categories, namely.
  • Temporal
In this article we used a set of different annual demand and solar irradiation profiles for the year 2019. After analysing the demand and production files we focused the study on different relevant extreme days, e.g., peak electricity demand day or peak heat demand day. For the chosen year, we identified the 24th of January as the most significant day for the power grid by using large scale heat pump installation in the whole city. This day represents the highest heat demand point and also showcases total electricity demand close to the annual peak. All necessary time series have been either collected (Irradiation) or created (demand profiles) on an hourly base for the selected day.
  • Spatial
A detailed power grid analysis is performed over the whole territory of the Swiss city of Yverdon-les-Bains, at the levels of both mid- and low-voltage grids. The mid-voltage grid of Yverdon-les-Bains consists of a 20 kV and a 40 kV circle (see Table 1). The raw data of the grid does include all cable lines of the power grid, independent of the circuit and configuration at each time step. This leads to an interconnecting system of most low voltage subgrids. However, the grid is operated mostly in radial mode in normal condition. In order to find a realistic grid operation topology, we need to separate the subgrids with the goal of having one transformator for each subgrid, an algorithm was developed based on the distance between two connected transformer nodes via low voltage cables.
1.
finding all existing subgraphs (sg)
2.
finding all transformers in sg
3.
if amount of transformers in sg > 1:
3a.
determine distance between all transformer nodes in sg
3b.
find pair of connected transformator nodes with the shortest distance
3c.
determine and cut edge located in the middle of both nodes
3d.
return to 3.
4.
else:
4a.
return to 1 and check next subgraph sg + 1
  • Data Pre-Processing
The hourly load profiles for both heat and electricity demand (at single building level) were created with a large set of measured, standard or synthetic created profiles and are selected based on buildings type (heat and electricity) and construction year (only for heat). Each profile is thereafter normalized and adjusted based to the total annual demand. While active power demand files were available for most building types, the reactive power was calculated for the missing building types based on the cumulative distribution of reactive power in the known demand files of similar buildings. The reactive power Q related to the operation of heat pumps is calculated based on active power demand P and a technology factor x as:
Q = P · 1 x 2 y

2.2. Creation of Initial Scenario (s0)

In a first step, we used all available data to recreate the current power grid of Yverdon-les-Bains. The grid configuration details were provided by the local energy provider Yverdon Énergies. The physical parameters of important components of the grid were partly also made available by Yverdon Énergies while for unknown quantities, either standard parameters or the most common elements were used. The evaluation of a power flow analysis for the initial situation showed that the selected parameter had little to no impact on critical events in the grid.
The parameters used to create the power grid is summarised in Table 2. The mid-voltage (MV) power grid is connected at one point to the external high-voltage (HV) grid by HV-MV transformers. The MV grid is then connected to the low-voltage (LV) grid by 85 MV-LV transformers, which distribute electricity to the consumers. In total, the distribution grid is connected to 3364 buildings, of which the large majority is connected to the LV distribution grid and only very large consumers are directly connected to the MV grid.
Yverdon Énergies also provided data for all buildings in the city of Yverdon-les-Bains, notably regarding geographical position, building type and usage, size, installed heating technology, annual electrical demand and production related to locally installed photovoltaic (PV) systems. In order to perform a time-series power flow analysis we generated annual hourly power and heat demand profiles for each building, depending on the building size, given total demand data and the type of building. Buildings connected to the district heating networks were combined to a single heat demand for the whole DHN with one heating unit. In a second step, we merged the building data with the grid data and aggregated all information to create the initial scenario with hourly-based annual demand. Each building is assumed to be connected to the closest end-node low-voltage power grid. Following the grid connection recommendation of Group E [9] and Viteos [10], buildings with a total annual consumption of 750 MWh or a maximal power demand of 360 kW peak are connected directly to the mid-voltage grid. In addition to the electric supply, we assigned a heating system to each building. Most buildings are connected to the dense natural gas distribution grid and are heated with gas combustion units. Another big part of the built environment relies on oil boilers, while presently only a small percentage is heated with heat pumps. In addition, there are already two urban districts supplied by dedicated existing district heating networks (red area in Figure 1). The final electricity balance for the selected day is shown in Figure 2a, with the electricity demand of current heat pumps included.

2.3. Future Scenarios

The transition of urban heating systems in Switzerland away from fossil fuels is heavily focused on replacement of existing heating generation technologies—mainly constituted by single- and multi-building traditional boilers—with power-driven heat pumps and district heating networks. The analysis presented here also includes the presence and the future installation of PV systems on buildings rooftops; we apply a growth rate consistent with the municipal and federal objectives of 2% per year [4]. As seen in Figure 1, a number of future district heating networks are planned and each is supposed to be operated separately and supplied by a dedicated heat source. These heat sources vary for each DHN and depends on already available local features like waste heat, a good connection to the mid voltage grid for the installation of large sized heat pumps or other alternative heat sources, e.g., geothermal. Even though the district heating networks are mostly in the first steps of planning at city level, Yverdon Énergies communicated the overall strategy at this point of time regarding connection of buildings and heating technologies (see Figure 1). All buildings with a peak demand of 50 kW (or more) located in this area are assumed to be connected to the district heating network if not known otherwise.
In order to evaluate the impact of future transition of the heating market on the resilience of the local power grid, three ad hoc scenarios have been designed (see Table 1) as to represent the possible “extreme” situations. In all three of them, all planned DHN are implemented as foreseen by the city utility. A more detailed overview of the transition in each scenario is given in Table 3, where the number of buildings connected with each heating technology and the relative share of the total heat demand are given. The three scenarios are the following: (1) A complete transition of all gas and oil combustion boilers to single- or multi-building, power-driven heat pumps, named as scenario 1 (s1) in the following. The large-scale implementation of power-driven heat pumps as foreseen in the selected scenarios implicitly results in a significant increase of electricity demand on days with high heat demand. On the selected day, as can be seen in Figure 2b, the peak external electricity demand increase by around 40 % from 30 MW to 43 MW and a shift of the base load from around 5 MW to around 20 MW. (2) A second future scenario (s2) represents a “less drastic” transition to heat pumps. Only oil-based combustion units, which represent around 35% of the cities heat production of residential heat production in Yverdon-les-Bains (a share relatively lower than the Swiss national average ranging slightly below 50%), are replaced with heat pumps. As seen in Figure 2c, the demand in the peak-time step increases by around 16% from the initial 30 MW to 35 MW while the baseload demand doubles from 5 MW to 10 MW. (3) The last scenario (s3) is based on s2, but it integrates the switch of natural gas-based combustion boilers to gas-based CHP units (internal combustion engines). Since the infrastructure for the natural gas supply already exists, this transition requires little infrastructure changes on the heat side. The power balance in Figure 2d shows that the grid-external demand at the peak hour actually decrease to 25 MW. The whole curve shows a significant drop, based on the concomitant distributed power generation originating from the CHP units which are either used locally or injected into the grid. It is also important to mention that emergence of negative reactive power can be seen in the early and late hours of the day.
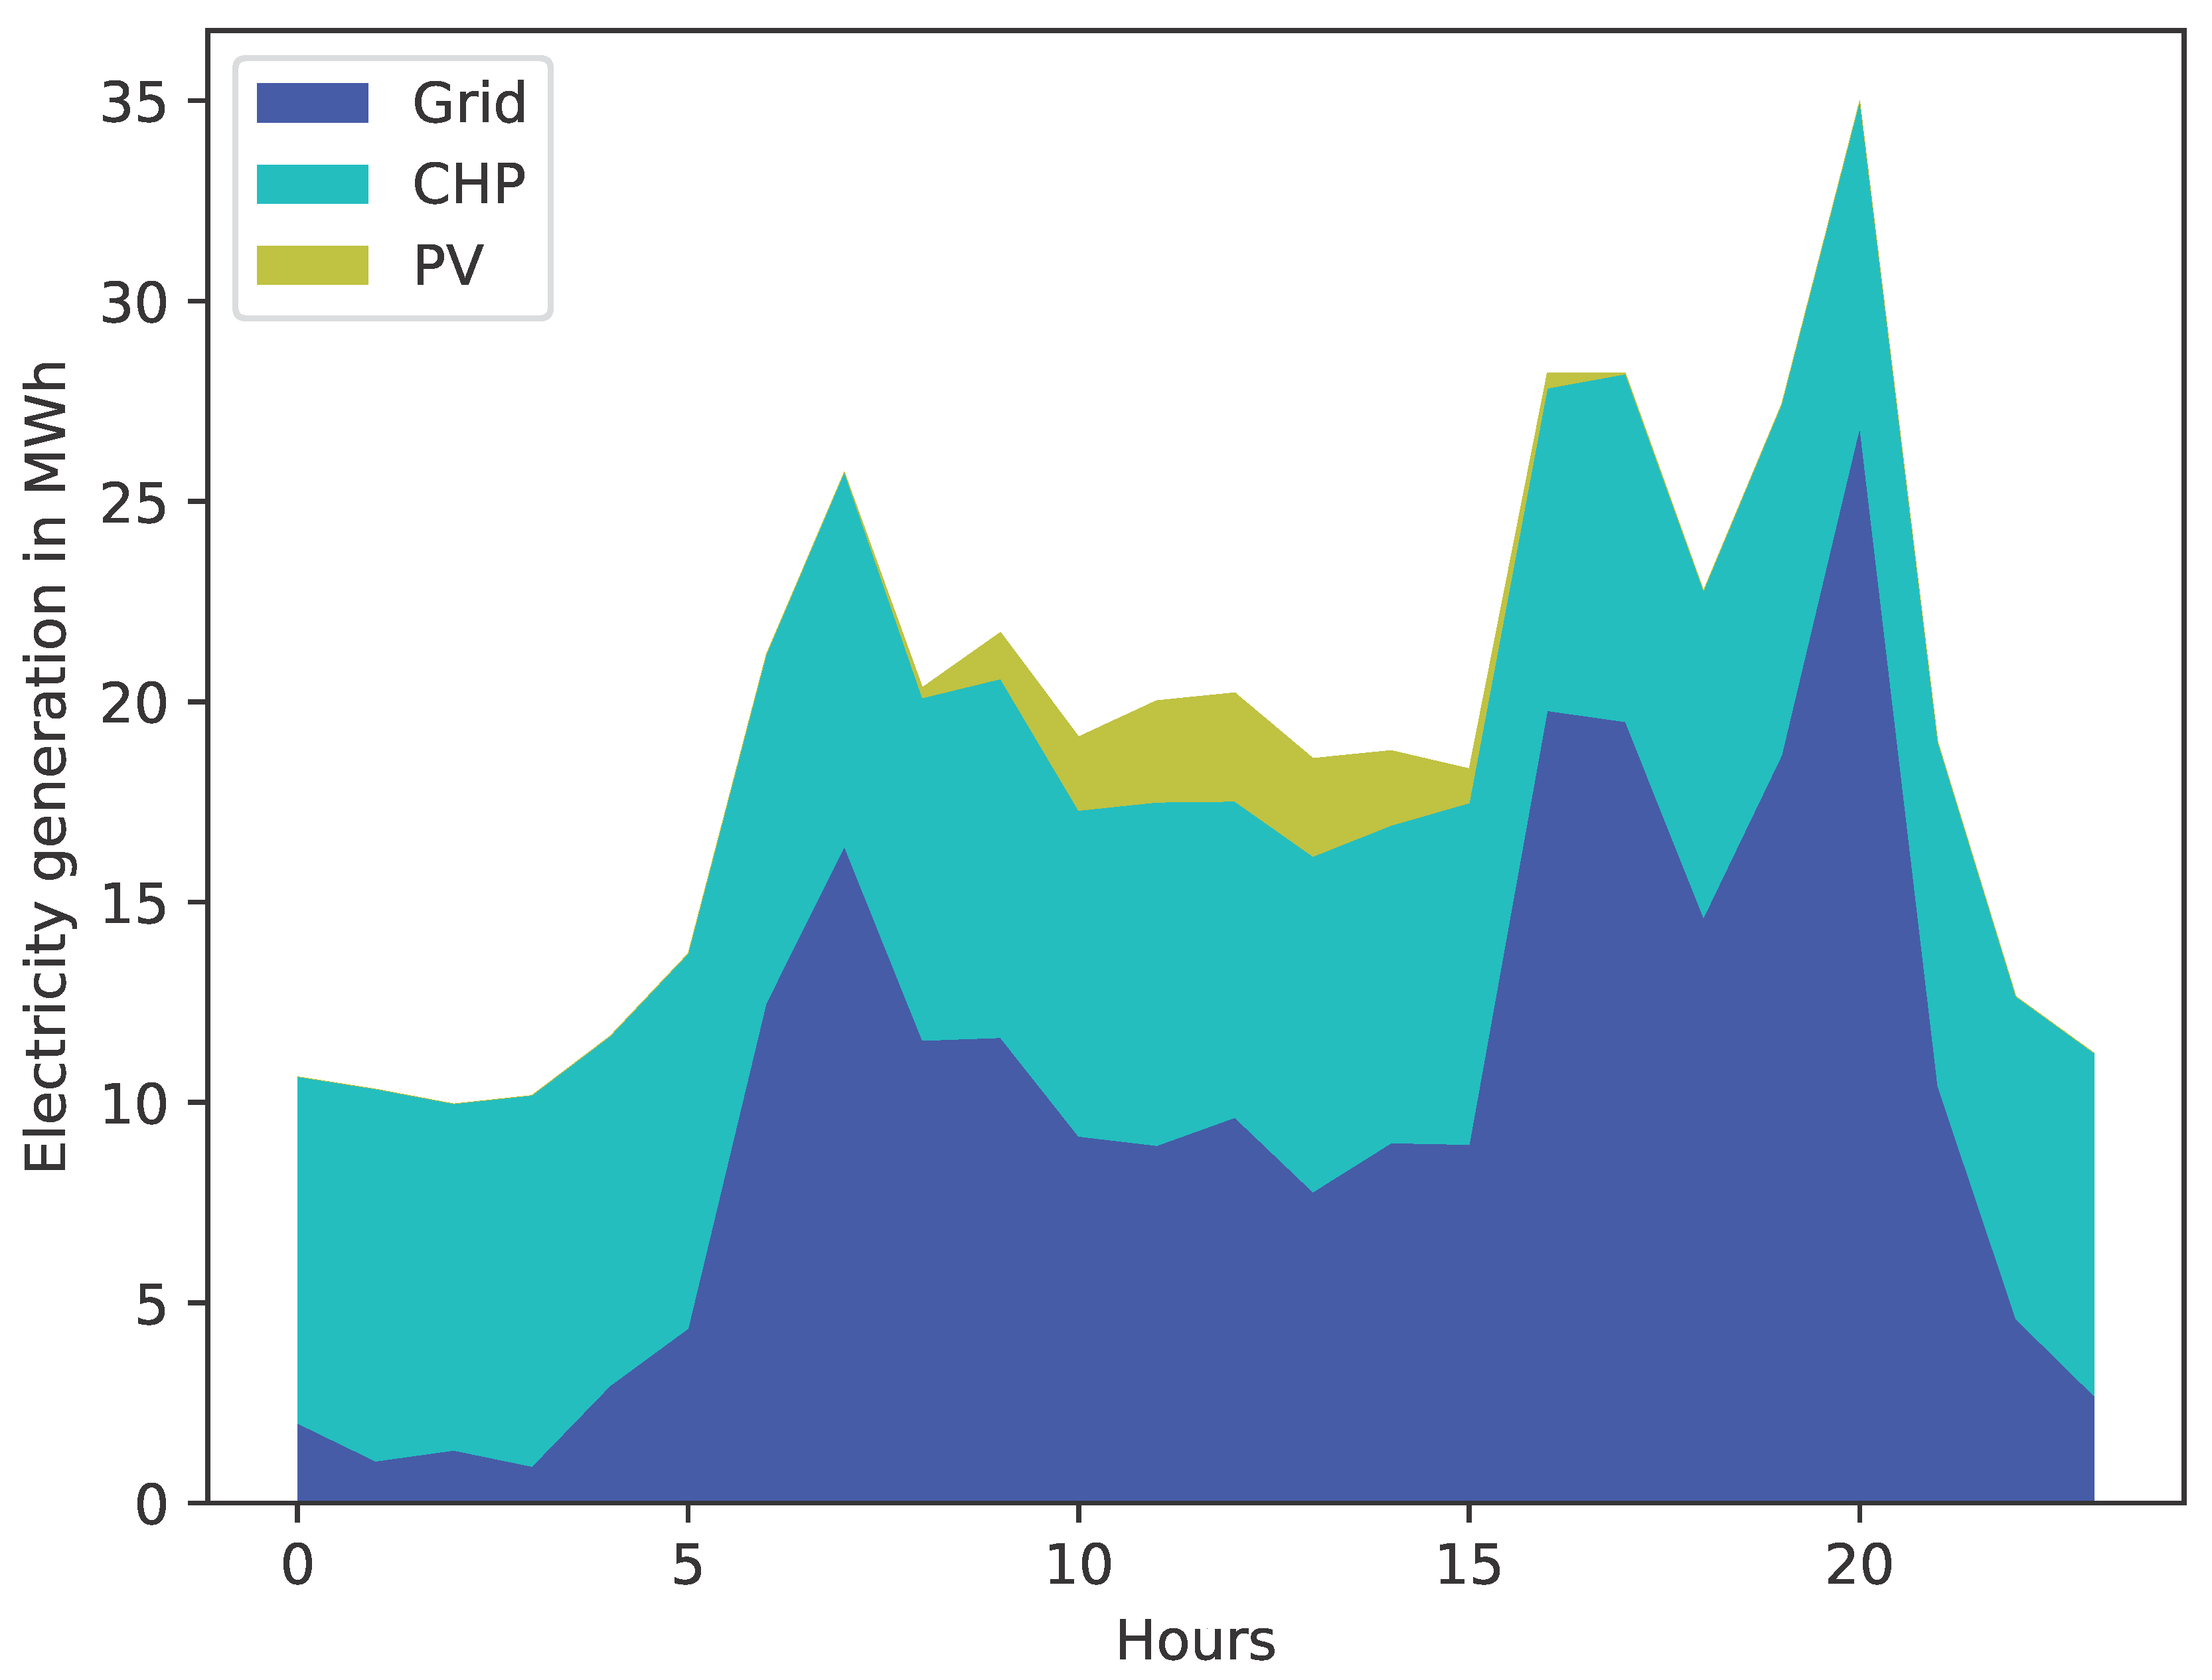
The electricity source for scenario 3 is illustrated in Figure 3 and shows the power production by photovoltaic panels which is similar for all three future scenarios. The CHP production stays relatively constant during the considered day and provides the majority of electricity in the early morning hours. In the local electricity consumption peak hours most electricity is provided from the external high voltage power grid.

2.4. Power Flow Simulation

The power flow simulation has been implemented in Python via jupyter notebook with the open-source power flow library Pandapower [11,12,13]. For each scenario in this simulation, the net active and reactive power injection at each node is defined based on power consumptions and generations (i.e., P i = P Gen , i P load , i and Q i = Q Gen , i Q Load , i i = 1 . . . N , where N is the numbe rof the nodes). Then, a balanced AC power flow model is used as presented in Equations (2) and (3) in order to find the voltage magnitude at each node of the grid ( V i ; i = 1 . . . N ) .
P i ( θ , V ) = V i j = 1 N V j ( G i j · cos ( θ i θ j ) + B i j · sin ( θ i θ j ) )
Q i ( θ , V ) = V i j = 1 N V j ( G i j · sin ( θ i θ j ) B i j · cos ( θ i θ j ) )
where G i j and B i j are the real and imaginary parts of the component i j of the admittance matrix of the grid, respectively. θ i is the voltage angle at node i with respect to the reference node ( θ 1 = 0 ) . The non-linear Equations (2) and (3) are solved iteratively using a conventional Newton-Raphson algorithm as formulated in (4) [14]:
x k + 1 x k = ( J k ) 1 ( x k ) · f ( x k )
where x = θ V is the vector of unknown variables (voltage magnitudes and angles at every node). At each iteration k, f ( x k ) is the set of mismatch equations between defined and calculated net active and reactive power injection at each node (i.e., left-hand side and right-hand side of Equations (2) and (3), respectively). J is the Jacobian matrix including the partial derivatives of f ( x ) that is updated at each iteration as in Equation (5).
J ( θ , V ) = P θ ( θ k , V k ) P V ( θ k , V k ) Q θ ( θ k , V k ) Q V ( θ k , V k )

3. Results

3.1. Initial Scenario (s0)

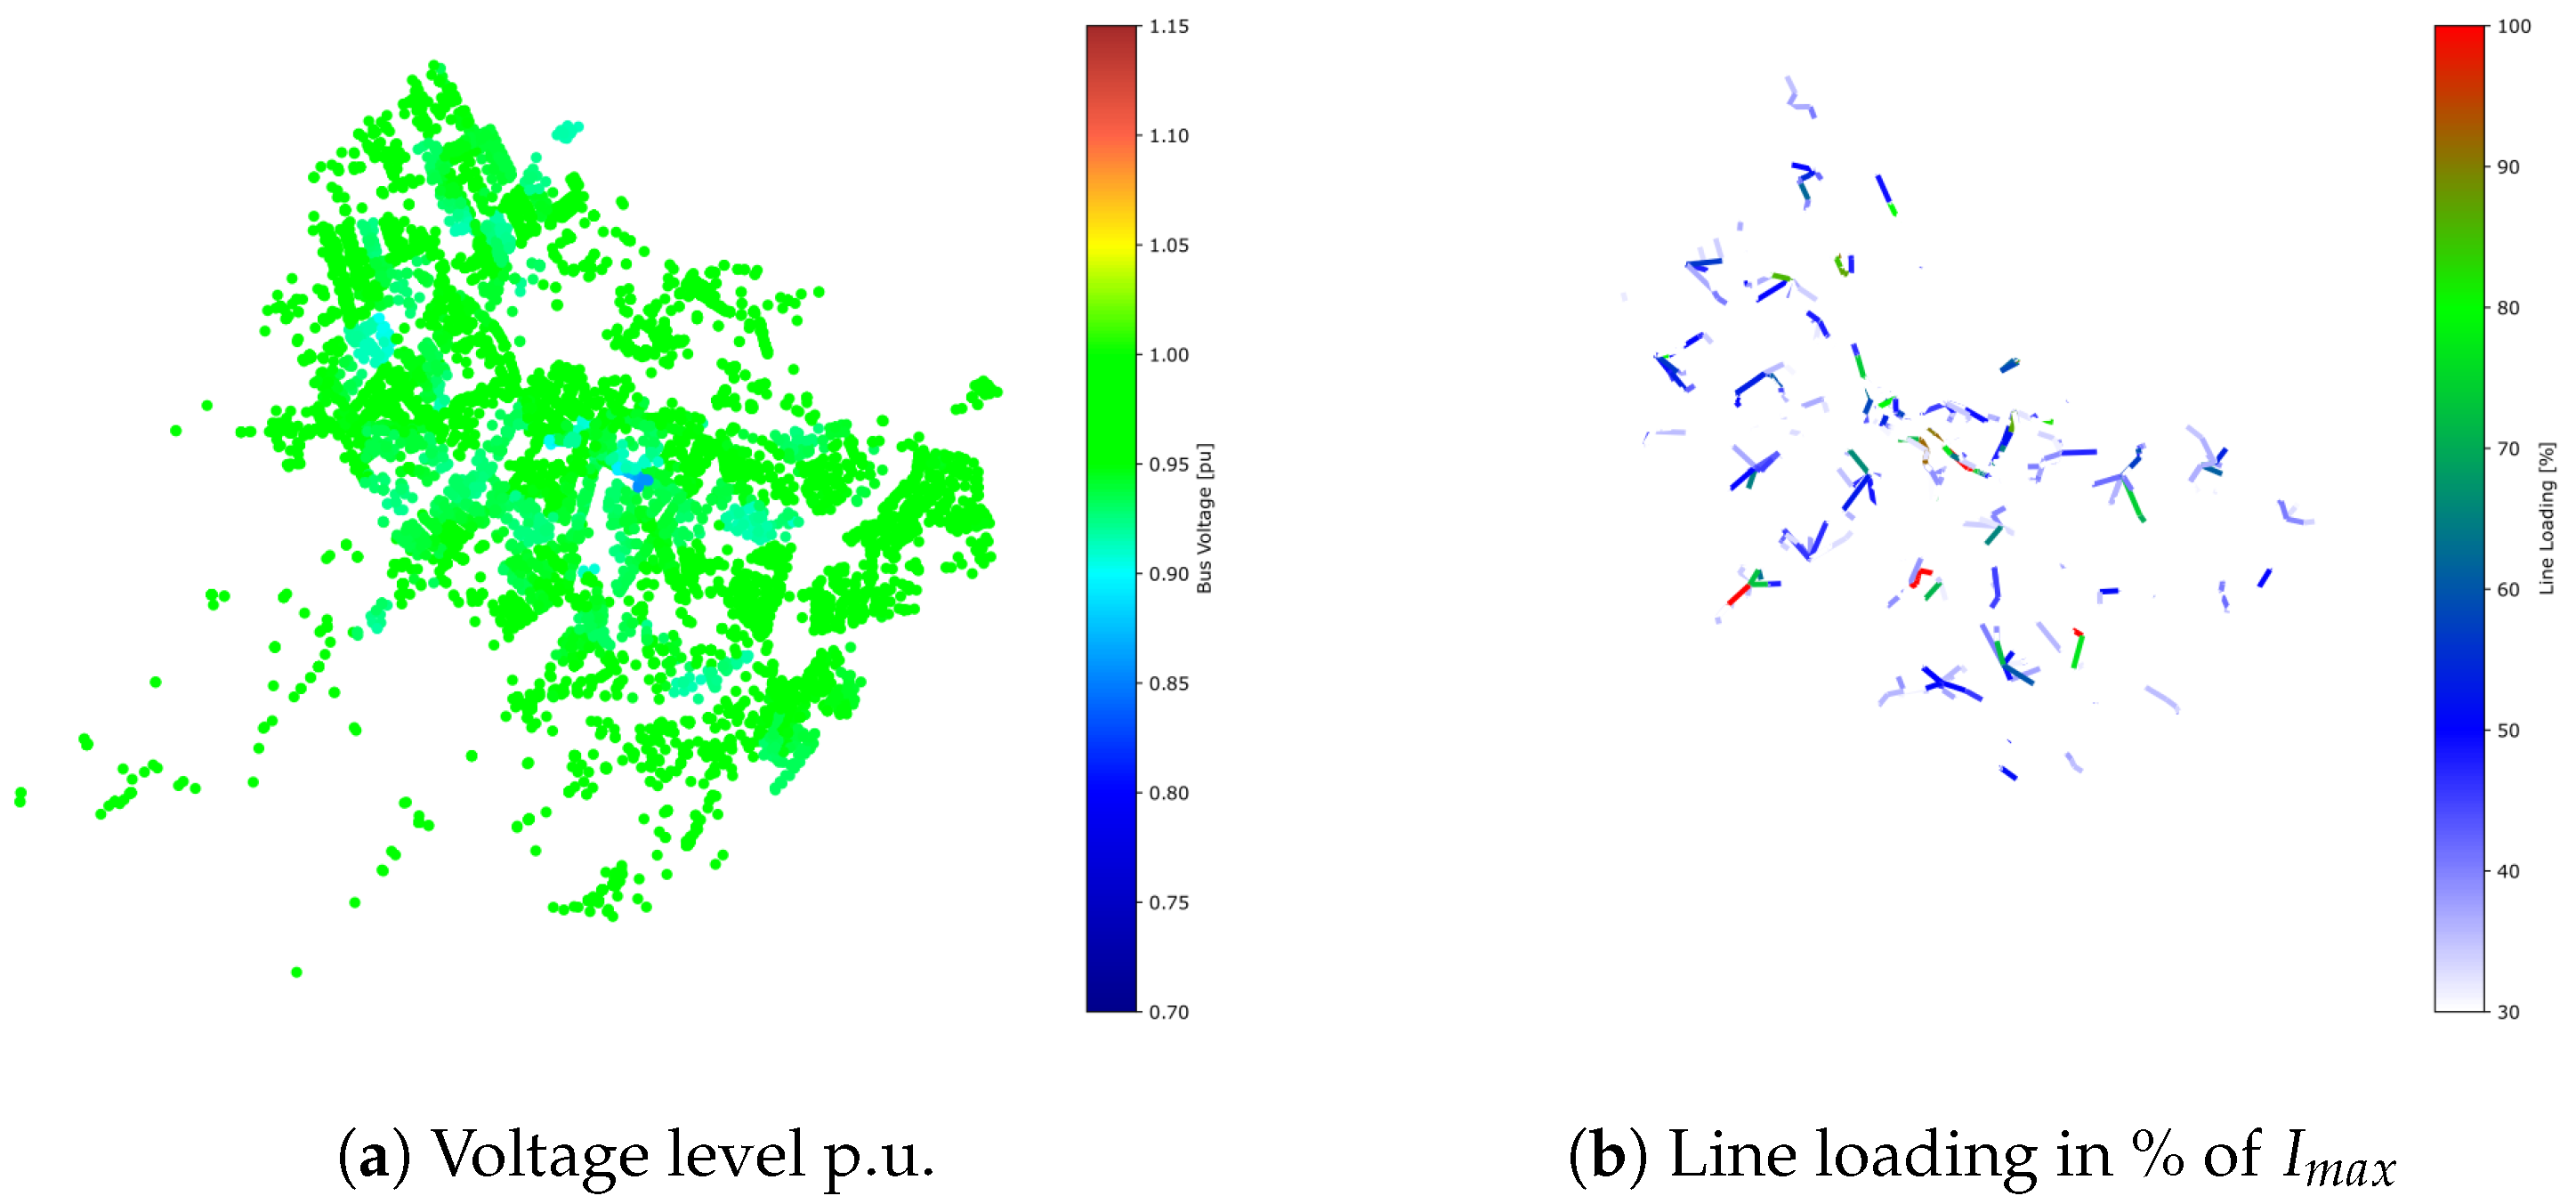
The power flow results of the initial scenario (Figure 4) show that the present power distribution grid configuration and dimensioning is able to handle the determined extreme demand situation. For the initial scenario, the annual peak demand for electricity is in a similar range as the electric demand for the heat during demand peak (24.01). While the power flow shows some weak regions for the heat demand peak, these do not occur during the electric peak demand time step. Therefore, we will only focus on the results for the heat demand peak day. As seen in Figure 4a, a small area in the central with an under-voltage of around 0.9 p.u. is visible. In Figure 4b the line loading of the power grid is showcased, it can also be seen that at some regions the line loading exceeds the recommended value in a certain number of urban zones. The total length of all cables with a line loading above 100% is shown in Figure 5a for the initial scenario (s0). The most critical time step is for s0 at 20:00 with around 650 m in total for the whole city of Yverdon-les-Bains. This peak is explainable with the peak in electricity demand shown in Figure 2a.

3.2. Future Scenarios

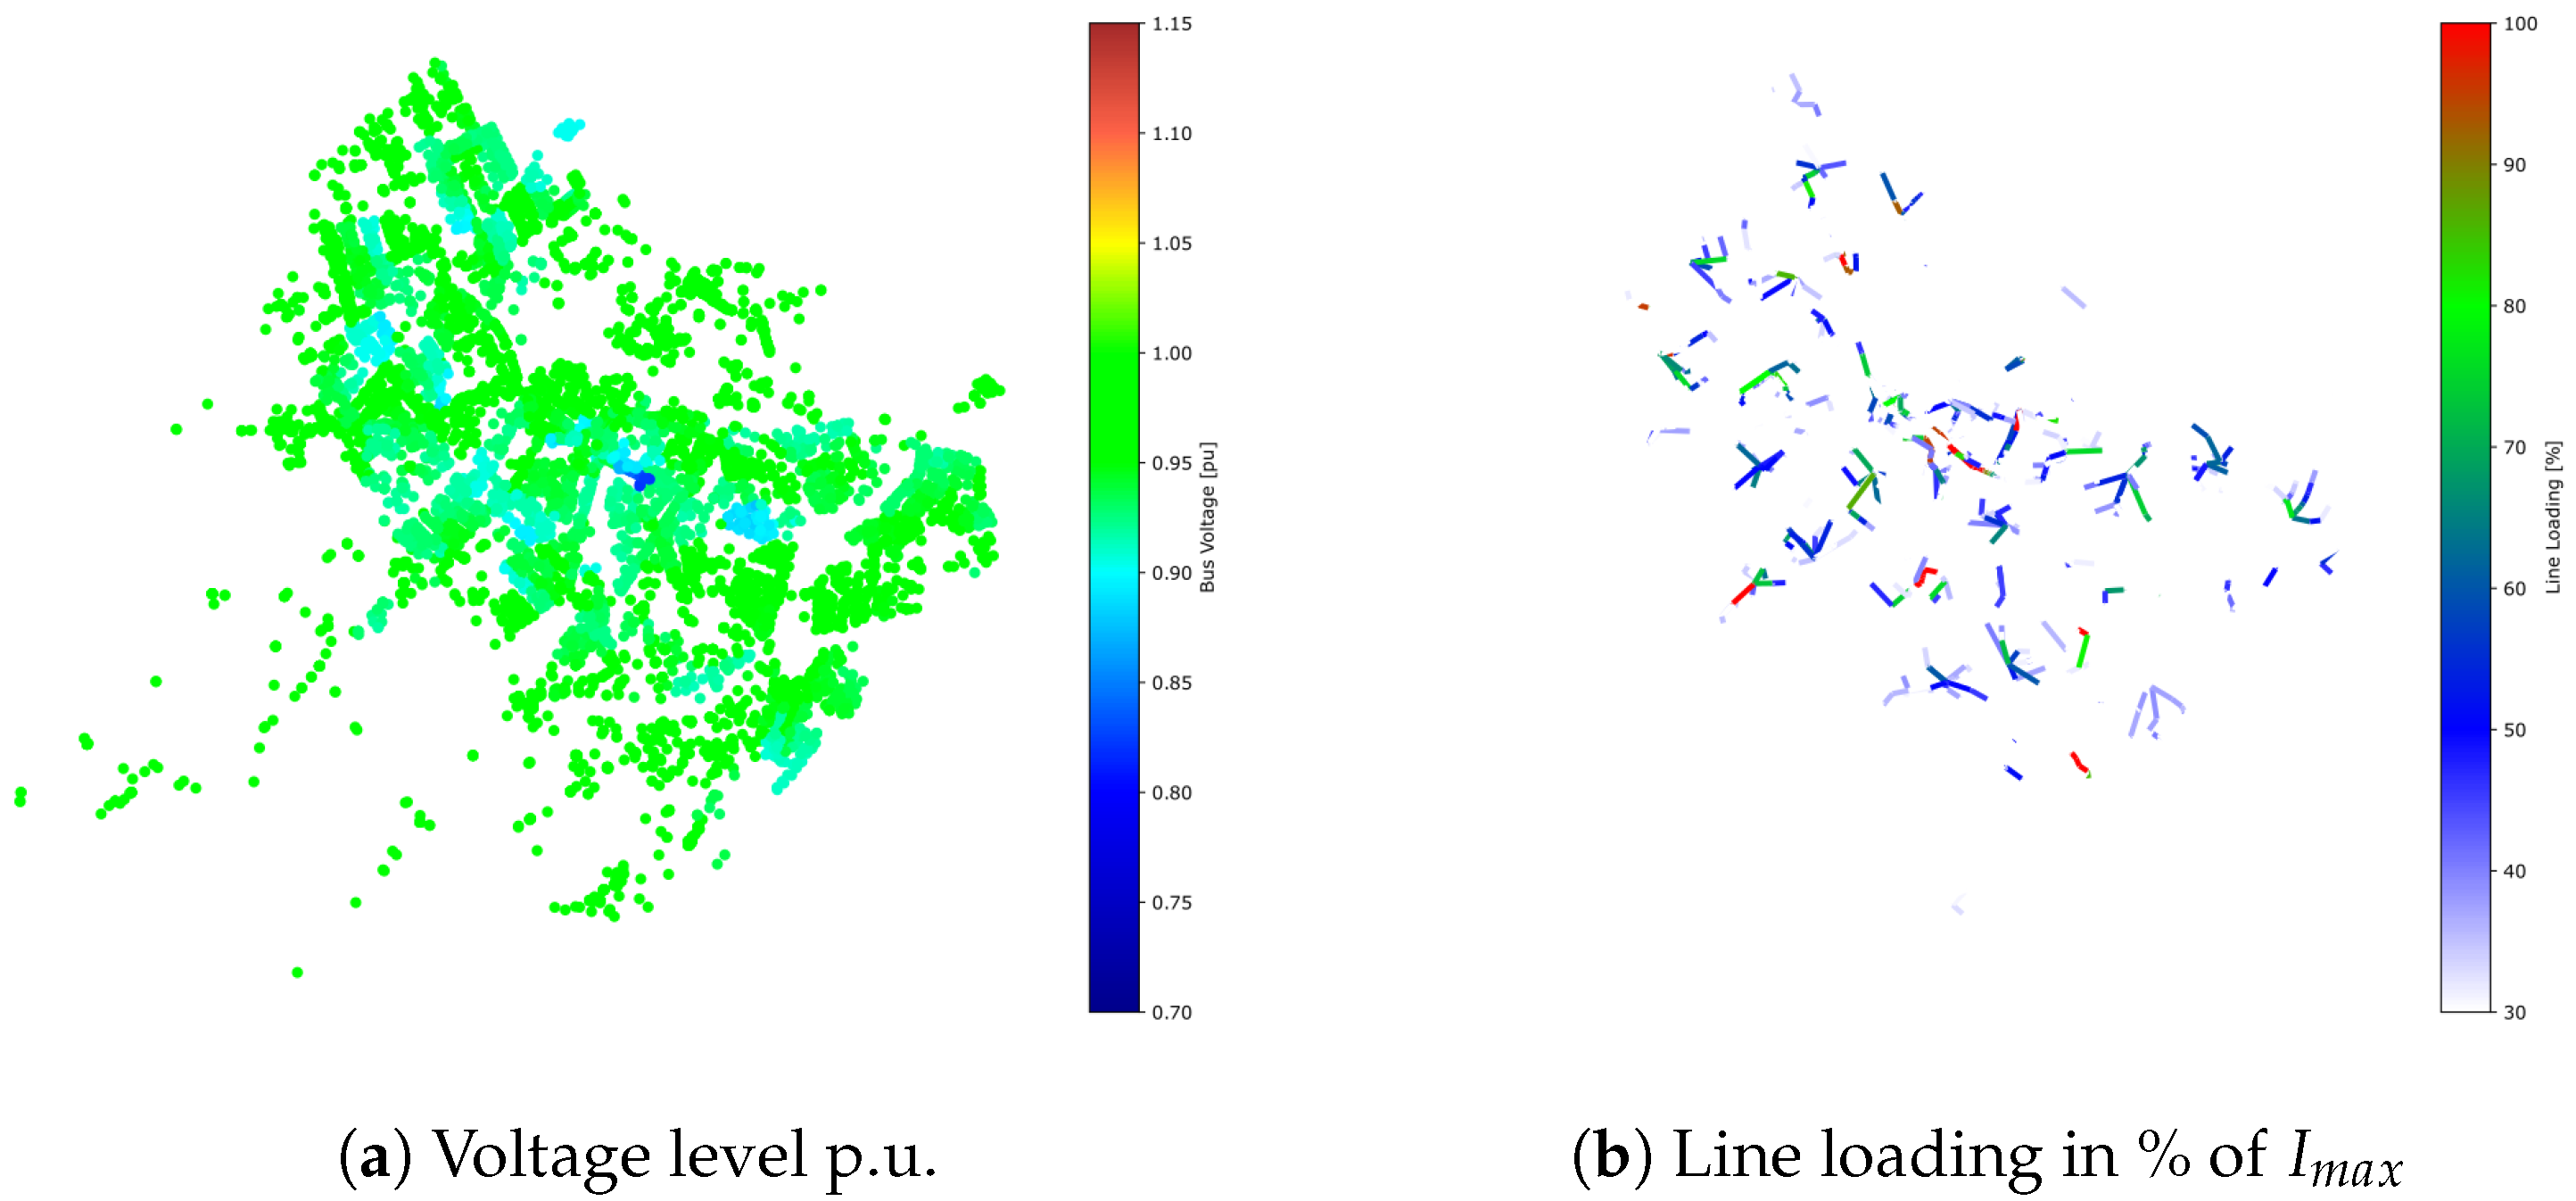
The installation of heat pumps results in an increased electricity demand in the power grid, especially during high heat demand periods. In contrast to the initial scenario (s0), the scenario with a full transition to heat pumps (s1) shows multiple regions with critical events. Figure 6a indicates the different regions with under-voltage levels of even under 0.8 p.u. spread over different parts of the city. The line loading (Figure 6b) shows a similar pattern and by comparing the initial length of over loaded lines in Figure 5a with the over line loading of s1 in Figure 5b, the peak at 20:00 increased from around 650 m towards over 3 km. It is also important to note that the system experiences over loading during the whole day, exceeding the initial peak of 650 m in many time steps.
Scenario 2 (s2), where the installation of heat pumps is limited to replace current oil-based boilers shows far lesser critical events for under-voltage (showcased in Figure 7a) or line loading (Figure 7b). However, as shown in Figure 5c during the peak time step at 20:00 the total length of over line loading cables does reach over 1 km.
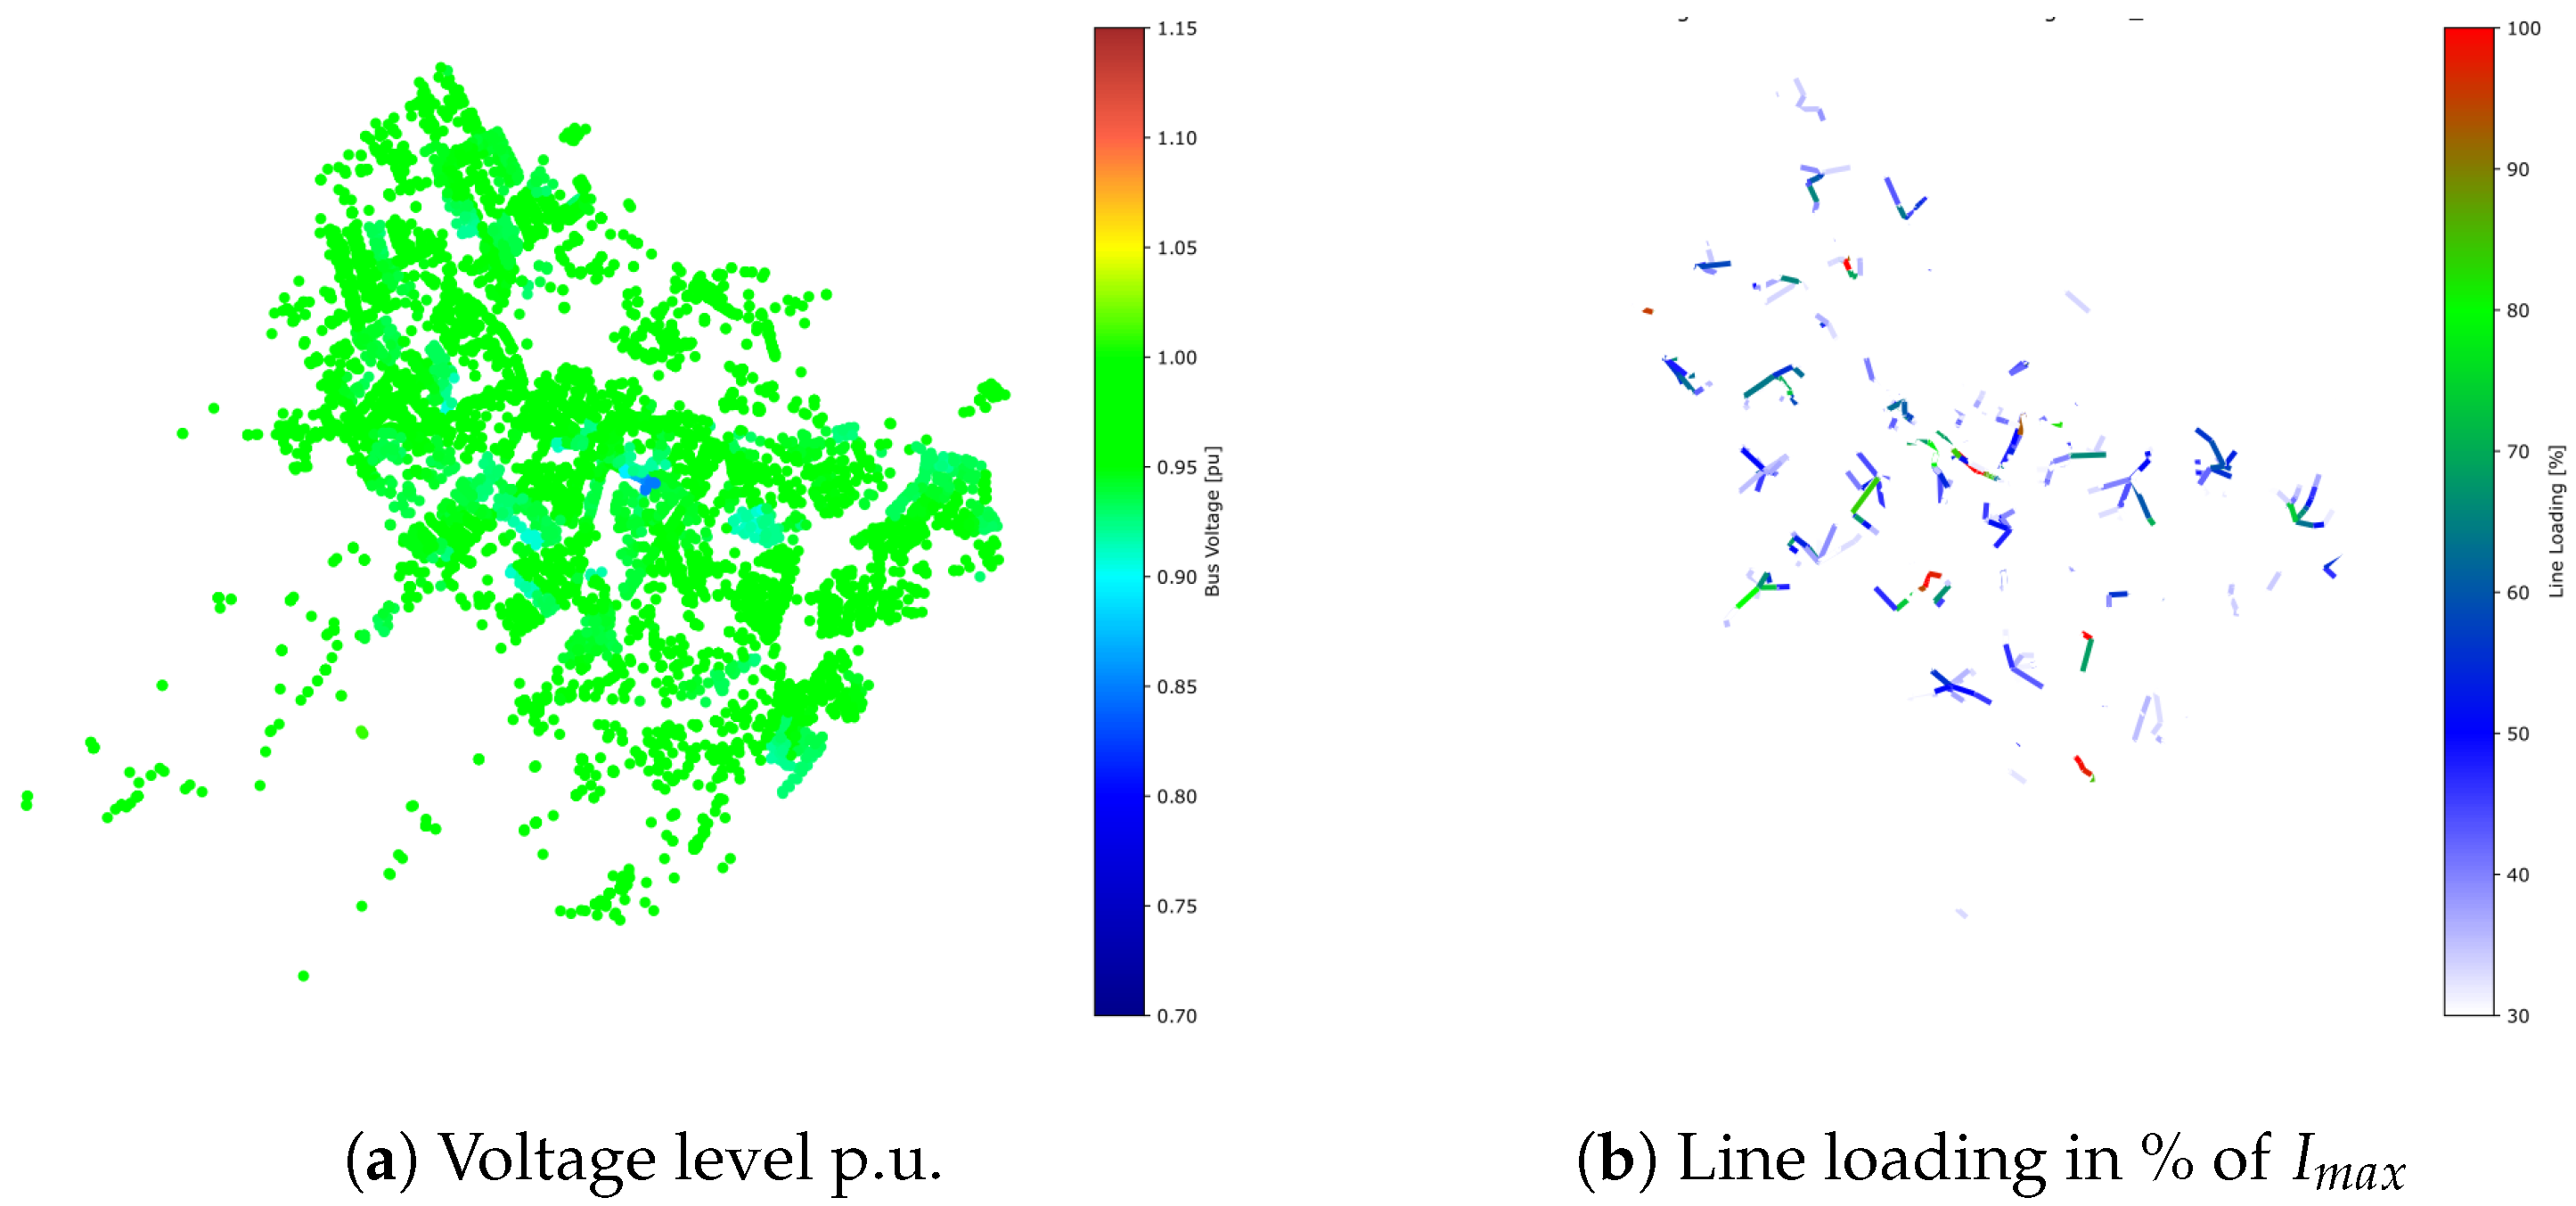
The last scenario (s3), with a similar heat pump installation to s2 but with CHP engines are imagined to take the place of natural-gas fired furnaces, shows a similar image as the initial scenario for both voltage (Figure 8a) and line loading (Figure 8b). The peak of total length of over loading lines (Figure 5d) is even lower than in the initial, but local peaks of between 300 m and 400 m are visible towards the whole day. Thus, important overloadings and under-voltages are identified in scenarios focusing on the installation on heat pumps. The results of s3 show that further modification in the grid can help to stabilize the power grid.

3.3. Grid Reinforcement vs. Cogeneration

In order to ensure grid security constraints regarding the under-voltage in certain buses and the over loading in stressed lines, which occur in the scenarios where heat pumps are implemented more broadly, two strategies are notably considered. The first strategy is to foster the replacement of standard gas boilers by cogeneration units for buildings that are already connected to the natural gas distribution grid. This strategy represents scenario 3 described above. In the heat demand peak-day, we see a shift of the voltage level of around 0.05 p.u. towards the nominal value in the solution with CHP (Figure 9b) compared to the full heat pump solution (Figure 9a). Hence, a strategy involving CHP units allows to significantly hamper the under-voltage situations due to the demand of additional heat pumps on cold days.
The second strategy is to reinforce the grid directly by installing lines with lower electrical resistance. In practice, this could happen gradually by replacing a cable at the end of its life time with a new one with larger cross section. We assumed that the overloaded lines are replaced with new ones where the larger cross sections result in 20% lower resistance and 25% higher line loading current limit. This is done for all over-loaded cables of the previous grid reinforcement iteration i by keeping the ratio between the resistance and reactances of the cables constant.
R n e w , i = 0.8 · R i 1 i [ 1 , 2 ]
R n e w , i X n e w , i = R i 1 X i 1
In addition, we also increase the maximal current in the cable:
I m a x , i = 1.25 · I m a x , i 1 i [ 1 , 2 ]
The results are given in Table 4 for scenario 1 and as comparison the state of the initial (s0) and the other two considers scenarios with unchanged cable parameters, with values in bold representing lower values then obtained for the initial solution (s0). After the first iteration of reinforcement for s1, the number of over voltage buses and over loaded line length drops slightly, but stays far higher than in the comparison scenarios without reinforcements. Even a second iteration does not reach the solution of the initial scenario (s0). However, the second iteration reaches a level with less cable length of critical line loading than in the initial scenario. The problem of line loading can be handled by grid reinforcement, but this is not very effective at solving the under-voltage issue.

3.4. Voltage Regulation by Photovoltaic Systems

The installation of new photovoltaic systems have the major benefit and purpose of injecting electricity in the grid via renewable energy. Unfortunately, the effect of solar power on the active power in the grid is negligible during hours without available solar irradiation, especially on winter days. The results in Section 3.3 show that a reinforcement of the cables in the grid to reduce the over line-loading still remains a high amount of under-voltage buses. As PV systems are connected to the grid through power electronic inverters, they could be able to inject reactive power into the grid, even when no solar irradiation and therefore no active power is available (see [15,16]). Scenario 1 with a full heat pump solution is adapted in a way that the photovoltaic systems inject reactive power into the grid based on their capacity S i and active power P i ( t ) derived from available solar irradiation at at time-step i according to:
Q i ( t ) = S i 2 P i ( t ) 2
We assumed that the injection of reactive power from a PV inverters into the power grid is only activated if under-voltages of at least 0.9 p.u. are measured for the same subgrid as the photovoltaic system. Scenario 1 is simulated for three different cases with 30, 70 and 100% of the available reactive power in the activated photovoltaic systems. When no grid reinforcement is applied, a 30% usage of reactive power already reduced the amount of buses with under-voltage of 0.9 p.u. significant from 993 buses to 389 buses. In addition the line loading in the grid does have a major change. By increasing the reactive power the under-voltage improves further but the line loading problematic increases. The usage of reactive power from photovoltaic systems does seem to help solving the under-voltage but increase the line loading problematic at the same time, as already indicated in Table 4.
Combining the approach of grid reinforcement presented in Section 3.3 with using reactive power of photovoltaic systems helps to reduce both problems. However, even with two reinforcement iterations, the results of the initial scenario (s0) cannot be achieved for both line loading and under-voltage (see Table 5). By using 30% of reactive power of activated photovoltaic systems, a high amount of buses still remain in the state of under-voltage, while the usage of >70% reactive power have a significant length of cables with line loading over 80% and even 150%.

3.5. Impact on Initial Electricity Consumption k-Medoids Day

The simulation of a non-extreme point in time was chosen in order to better understand the previous results and their significance for the grid. The electricity consumption determined for the initial situation does not include demand for heating purpose, since nearly no heat pumps or direct electricity are used. By using a k-Medoids algorithm on the electricity consumption, the 22nd of April has been determined as an average day for the considered test case. All considered scenarios show a peak in both line loading and under-voltage at 11:00 for this day. The line loading and under-voltage results are given in Table 6 and should be put into comparison with the results of the heat-peak day in Table 4. While at the electricity consumption peak point described in Section 3.2 no over-voltage appeared in all scenario, at 11:00 on the k-Medoids day over voltages can be seen at various buses in the power grid. The under-voltage and line loading issues also seem to appear in all future scenarios in a similar manner, but are reasonable low in the initial scenario. The results for the CHP based s3 shows even more critical nodes and cable length.

4. Discussion and Perspectives

The power flow analysis of the current electricity system of Yverdon-les-Bains shows that the current grid is well dimensioned and is even capable of operating in an acceptable manner when subject to an extreme demand scenario. However, the results for the three different future heating strategies indicates a significant impact on the future operation security of the power grid with changing heating technologies. Even the installation of large scale district heating networks for larger consumers appears not to be able to mitigate the impact of a full transition to heat pumps, in accordance with results obtained in [17]. Indeed, the corresponding scenario s2 shows that if only the current oil-boilers switch to heat pumps, the grid would require reinforcement at certain locations to handle under-voltage in the corresponding buses and over-loading in a number of lines. We proposed and analysed three possible solutions to handle these crucial issues stemming out of the chosen ad hoc scenarios. (1) The installation of CHP units as a replacement for standard gas combustion boilers. The results of the power flow analysis show that the additional produced electricity is able to cover the new demand stemming from heat pumps. There are indeed effective synergies between co-generation units and heat pumps, since the installation of both technologies results in a stronger synchronizing of heat and electricity demand for continental climate conditions. During cold periods, the operation of heat pumps leads to a higher electricity demand, while the operation of CHP units leads to a higher production of electricity. With the help of co-generation units, the heavy under-voltage situations were significantly improved by around 0.05 p.u. to more feasible voltage levels. (2) A second solution is the reinforcement of the existing grid by installing stronger cables or lay new cables in parallel to existing ones, as explored, e.g., by [18]. We addressed that strategy by reducing the resistance of over loaded cables and the maximal current. While this strategy solved the line loading issue, it did not significantly change the under-voltage situations. (3) To handle the under-voltage occurring in many buses, due to the operation of heat pumps, the injection of reactive power from the inverters of the installed photovoltaic systems is proposed, as a second alternative pathway with respect to the implementation of decentralized CHP units. The installation of photovoltaic units itself made little impact on the overall urban power system, since during cold winter days, limited amounts of electricity is fed into the grid. However, the injection of reactive power could be used to raise the voltage level within an acceptable range, as studied by [19], within PV penetration scenarios on low-voltage distribution systems. Unfortunately, with the increase of reactive power in the grid the line loading increases concomitantly. Buses with under-voltage disappear nearly completely, but even with reinforcement of the grid, the line loading in a significant amount of cables stay far over 80%. A first simplified control strategy was implemented in the sense of injecting reactive power only to subgrids with significant under-voltage problems and analysing the impact of different shares of the total possible injection capacity of reactive power on a city-wide scale. The authors propose to define a more detailed and improved control strategy in a follow-up project based on the injection of reactive power based on an optimal solution for the considered scenarios. The control strategy will be improved (1) by enabling the control strategy to size the share of reactive power locally on line level instead of city-wide; and (2) by considering the optimal impact of each separate photovoltaic unit on the whole grid.

5. Conclusions

The penetration of power-driven heat pumps is supported by national and local policies in many continental Europe countries. In this paper, we investigate the impact of such a transition from traditional fossil-based boilers to heat pumps on the local power distribution grid in terms of voltage, current and reactive power dynamics. First, an easily reproducible methodology is developed, based on the coupling of detailed, geo-referenced heat demand data of a given territory and the specificities of the local electricity supply grid (mid- and low-voltage). It is assumed that the required electricity which is not supplied within the grid is provided from the external high-voltage grid and furthermore that the existing gas grid continues to be able to provide the current gas quantities.
In a second step, the proposed approach is applied to the Swiss city of Yverdon-les-Bains within three different scenarios, portraying various future combinations of heating technology distributions in such a mid-sized city. The results indicate that a massive penetration of power-driven heat pumps indeed leads, on the coldest days of a given year, to severe under-voltages and line overloading on considerable extensions of the distribution power grid. These effects are quantitatively identifiable by using the proposed methodology, along with a precise map localization. One of the explored scenarios involving the transition from natural-gas fired boilers to CHP units highlights the first of three mitigation routes for such severe grid instabilities linked to increased power demand on cold winter days due to heat pumps. The hourly-based power flow computations clearly demonstrate that CHP units indeed efficiently restore voltage and current levels in the low-voltage grid, up to levels consistent with the present, balanced situation. Two alternative mitigation routes are also explored in terms of focused grid reinforcements and usage of PV inverters and are compared to the implementation of CHP units. On one hand, the reinforcement of cables show a significant reduction of overline loading, but does not reduce under-voltage issues in the grid to an acceptable level. On the other hand, the injection of reactive power by PV inverters leads to the opposite effect, reducing the under-voltage but increasing the line loading issues. Even a combined strategy of grid reinforcement and reactive power injection does not result to a superior solution for the considered HP focused scenario, in comparison to the CHP supported scenario in relation to both voltage and line-loading issues. Therefore, the above analysis confirms the results previously obtained in [7] that already pointed out the positive synergies stemming from a coordinated penetration of electricity-driven heat pumps and optimally distributed CHP units on existing natural gas distribution urban infrastructures, in terms of both reductions of GHG emissions and distributed power generation aimed at covering the electrification of the heating sector. Real territorial data and hourly-resolution power flow simulations provide the basis of a transparent analysis, in which a variety of scenarios can be compared in order to ensure a reliable and resilient operation of power distribution urban systems, as well as a quantitative decision-support process in terms of urban multi-energy planning.

Author Contributions

M.F.: Conceptualization, Methodology, Software, Validation, Investigation, Writing—Original Draft, Visualization; M.C.: Conceptualization, Investigation, Writing—Original Draft, Writing—Review & Editing, Supervision, Project administration, Funding acquisition; M.B.: Methodology, Resources, Writing—Review & Editing, Funding acquisition; R.K.: Methodology, Software, Visualization. All authors have read and agreed to the published version of the manuscript.

Funding

This research received no external funding.

Data Availability Statement

Not applicable.

Acknowledgments

The authors thanks Fabien Poumadère and Jean-Marc Sutterlet from Yverdon Énergies for the supply of important data, answer to queries and suggestions for the scenario creation. Internal HEIG-VD financial support is gratefully acknowledged.

Conflicts of Interest

The authors declare that they have no known competing financial interests or personal relationships that could have appeared to influence the work reported in this paper.

References

  1. Rüdisüli, M.; Teske, S.L.; Elber, U. Impacts of an Increased Substitution of Fossil Energy Carriers with Electricity-Based Technologies on the Swiss Electricity System. Energies 2019, 12, 2339. [Google Scholar] [CrossRef]
  2. Rüdisüli, M.; Romano, E.; Eggimann, S.; Patel, M. Decarbonization strategies for Switzerland considering embedded greenhouse gas emissions in electricity imports. Energy Policy 2022, 162, 112794. [Google Scholar] [CrossRef]
  3. Yang, Y.; Javanroodi, K.; Nik, V.M. Climate Change and Renewable Energy Generation in Europe-Long-Term Impact Assessment on Solar and Wind Energy Using High-Resolution Future Climate Data and Considering Climate Uncertainties. Energies 2022, 15, 302. [Google Scholar] [CrossRef]
  4. Swiss Federal Office of Energy (SFOE). Energy-Perspectives-2050+. 2020. Available online: https://www.bfe.admin.ch/bfe/en/home/policy/energy-perspectives-2050-plus.html/ (accessed on 12 December 2022).
  5. Park, B.; Hur, J. Spatial prediction of renewable energy resources for reinforcing and expanding power grids. Energy 2018, 164, 757–772. [Google Scholar] [CrossRef]
  6. Brown, T.; Schlachtberger, D.; Kies, A.; Schramm, S.; Greiner, M. Synergies of sector coupling and transmission reinforcement in a cost-optimised, highly renewable European energy system. Energy 2018, 160, 720–739. [Google Scholar] [CrossRef]
  7. Fesefeldt, M.; Capezzali, M.; Bozorg, M.; de Lapparent, M. Evaluation of Future Scenarios for Gas Distribution Networks under Hypothesis of Decreasing Heat Demand in Urban Zones. Energy 2021, 231, 120909. [Google Scholar] [CrossRef]
  8. Jonin, B. Systèmes Décentralisés de Recharge des Véhicules Électriques et Application aux Futurs Microgrids de Quartier. Bachelor’s Thesis, School of Engineering and Management Vaud, HES-SO University of Applied Sciences and Arts Western Switzerland, Delémont, Switzerland, 2021. [Google Scholar]
  9. Group E. PT3—Critères D’accès aux Différents Niveaux de Tension Pour Clients Finaux. Technical Report, Groupe E SA. 2017. Available online: https://www.yumpu.com/fr/document/view/22091075/criteres-dacces-aux-differents-niveaux-de-tension-pour-groupe-e (accessed on 12 December 2022).
  10. Viteos. Prescriptions Techniques Relatives aux Conditions générales (CG) de Raccordement, D’utilisation du réseau et de Fourniture d’énergie électrique. Technical Report, Viteos SA. 2009. Available online: https://viteos.ch/wp-content/uploads/Prescription_05_01-07-2009.pdf (accessed on 12 December 2022).
  11. Thurner, L.; Scheidler, A.; Schäfer, F.; Menke, J.; Dollichon, J.; Meier, F.; Meinecke, S.; Braun, M. pandapower—An Open-Source Python Tool for Convenient Modeling, Analysis, and Optimization of Electric Power Systems. IEEE Trans. Power Syst. 2018, 33, 6510–6521. [Google Scholar] [CrossRef]
  12. Frank, S.; Sexauer, J.; Mohagheghi, S. Temperature-Dependent Power Flow. IEEE Trans. Power Syst. 2013, 28, 4007–4018. [Google Scholar] [CrossRef]
  13. Ngoko, B.; Sugihara, H.; Funaki, T. A Temperature Dependent Power Flow Model Considering Overhead Transmission Line Conductor Thermal Inertia Characteristics. In Proceedings of the 2019 IEEE International Conference on Environment and Electrical Engineering and 2019 IEEE Industrial and Commercial Power Systems Europe (EEEIC/I&CPS Europe), Genova, Italy, , 11–14 June 2019; pp. 1–6. [Google Scholar] [CrossRef]
  14. Glover, J.D.; Sarma, M.S.; Overbye, T.J. Power System Analysis and Design; Cengage Learning: Boston, MA, USA, 2008; Volume 4. [Google Scholar]
  15. Merai, M.; Naouar, M.; Slama-Belkhodja, I.; Monmasson, E. Grid connected converters as reactive power ancillary service providers: Technical analysis for minimum required DC-link voltage. Math. Comput. Simul. 2019, 158, 344–354. [Google Scholar] [CrossRef]
  16. Sal y Rosas, D.; Chavez, D.; Frey, D.; Ferrieux, J.P. Single-Stage Isolated and Bidirectional Three-Phase Series-Resonant AC–DC Converter: Modulation for Active and Reactive Power Control. Energies 2022, 15, 8070. [Google Scholar] [CrossRef]
  17. Crimmann, M.; Madlener, R. Assessing Local Power Generation Potentials of Photovoltaics, Engine Cogeneration, and Heat Pumps: The Case of a Major Swiss City. Energies 2021, 14, 5432. [Google Scholar] [CrossRef]
  18. Kisse, J.M.; Braun, M.; Letzgus, S.; Kneiske, T.M. A GIS-Based Planning Approach for Urban Power and Natural Gas Distribution Grids with Different Heat Pump Scenarios. Energies 2020, 13, 4052. [Google Scholar] [CrossRef]
  19. Wang, L.; Yan, R.; Saha, T.K. Voltage regulation challenges with unbalanced PV integration in low voltage distribution systems and the corresponding solution. Appl. Energy 2019, 256, 113927. [Google Scholar] [CrossRef]
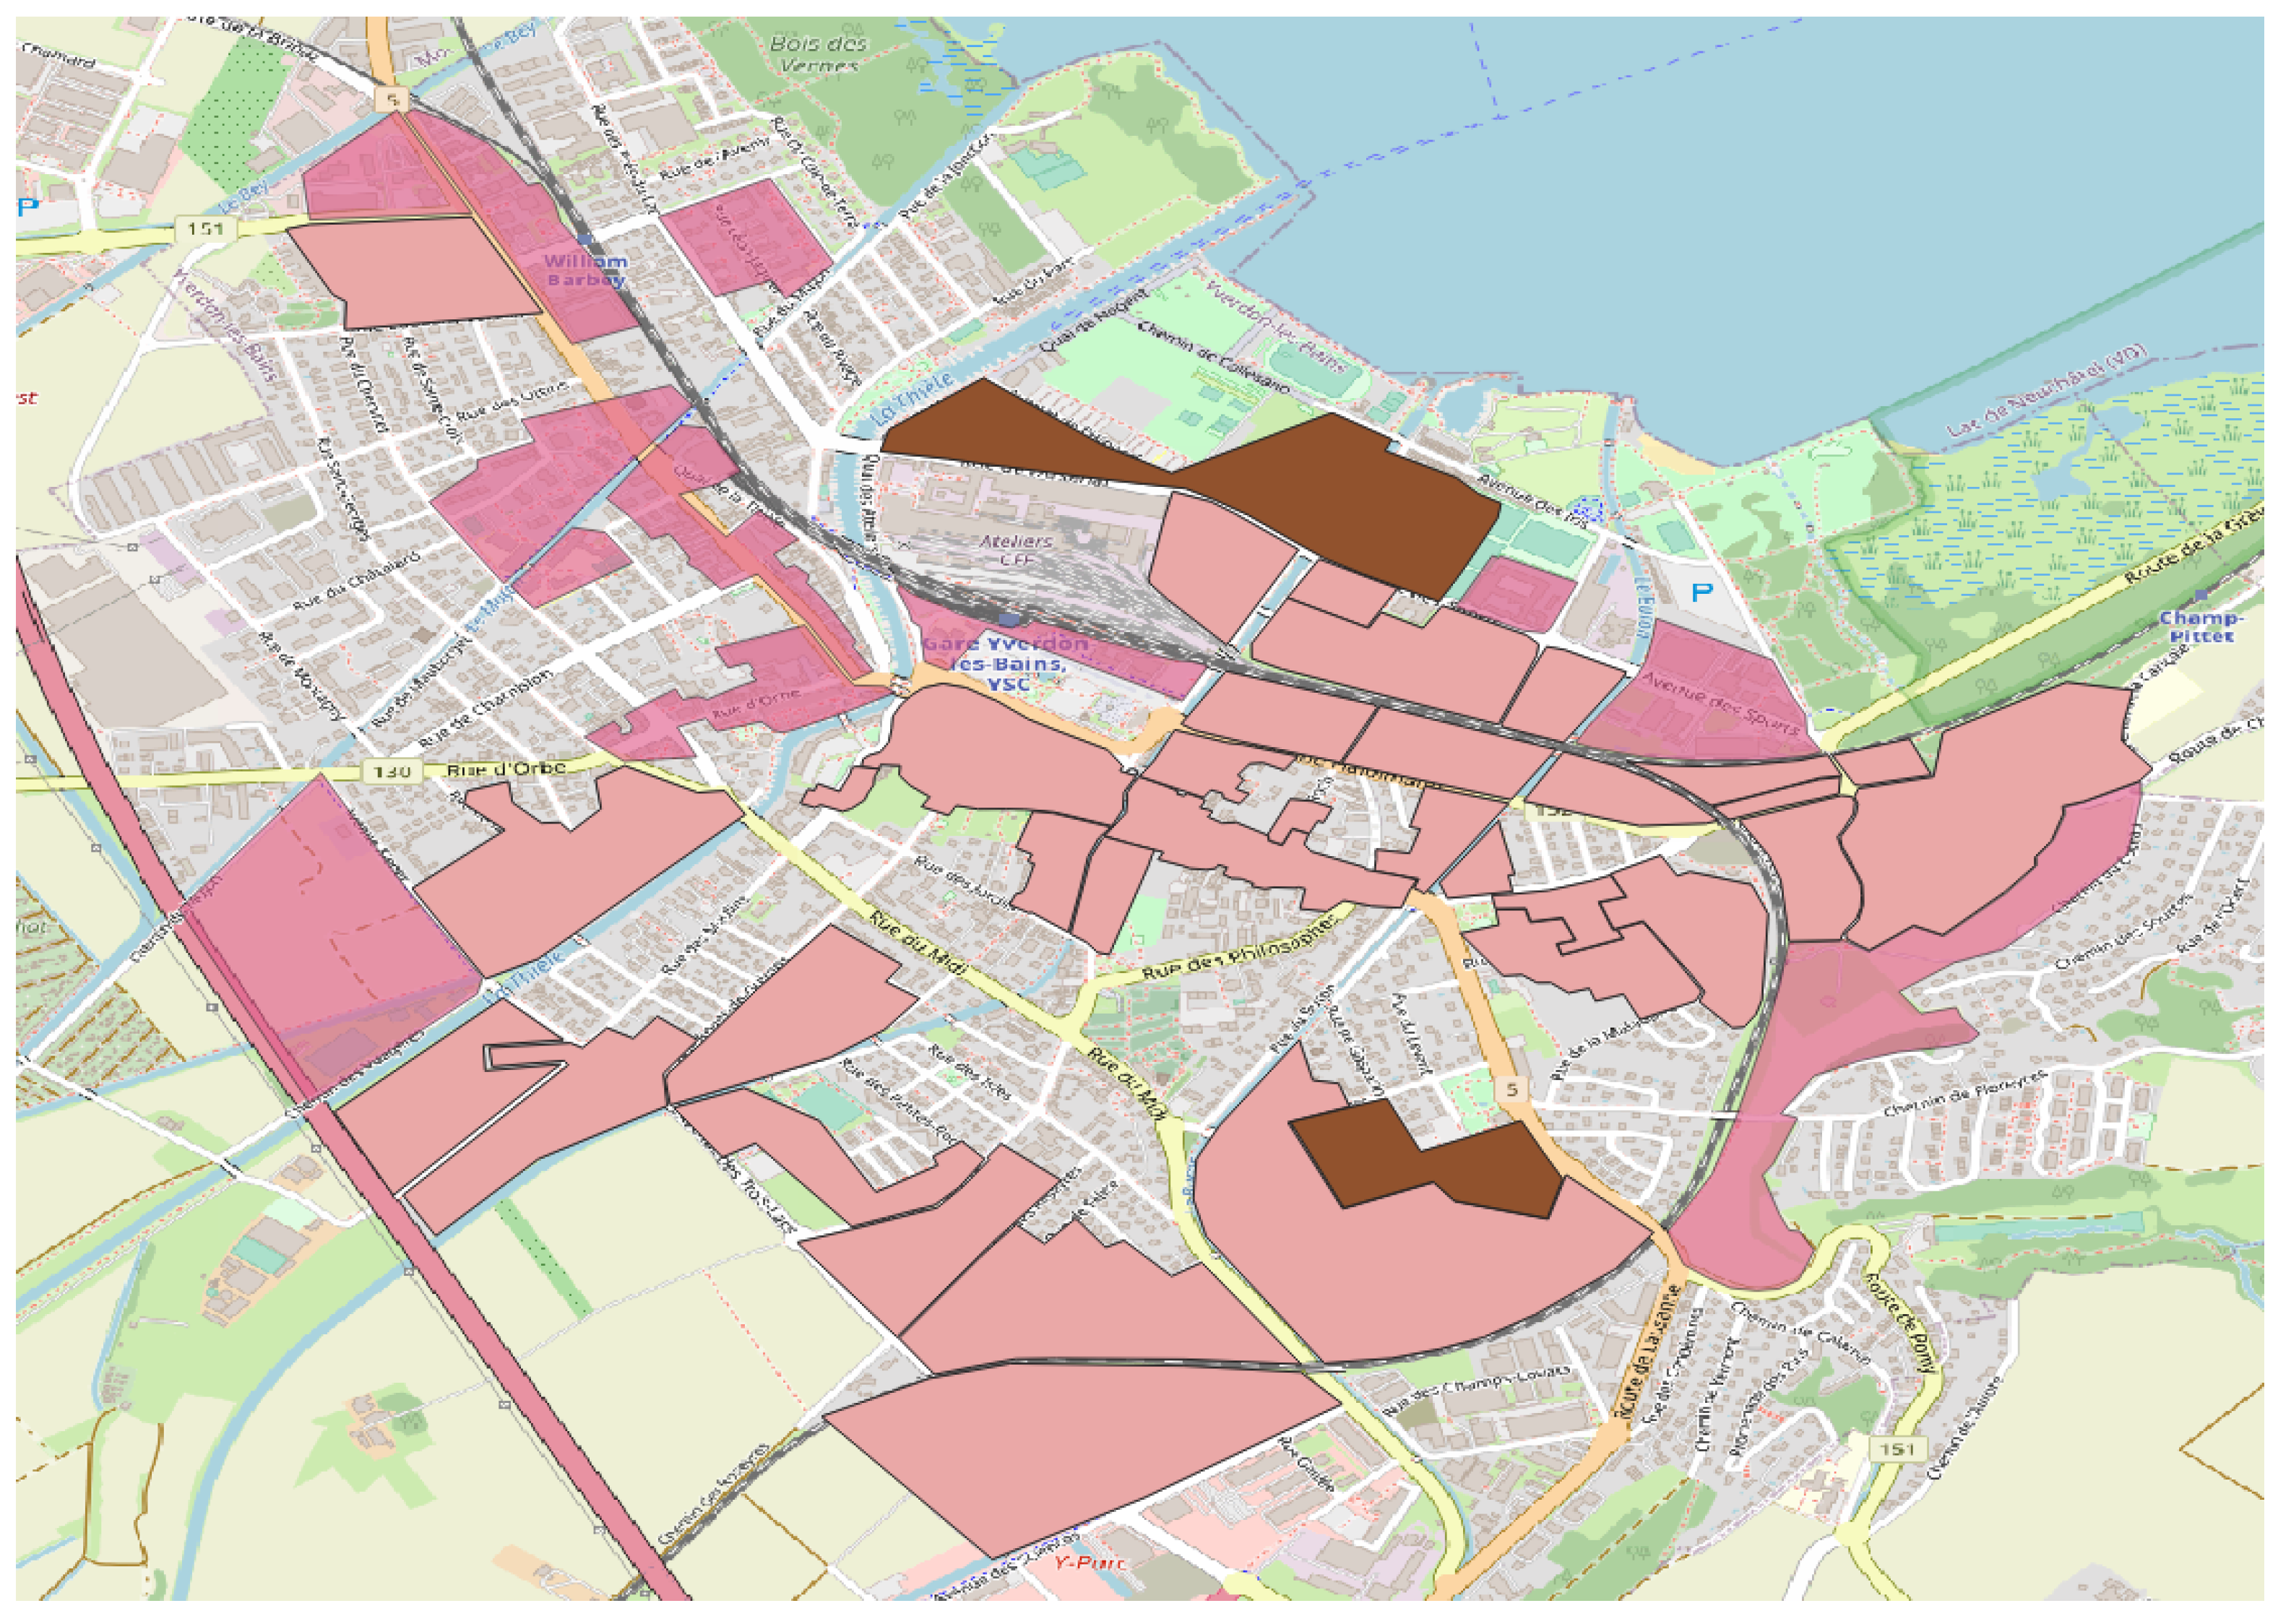
Figure 1. Planned zones for DHN on the territory of Yverdon-les-Bains.
Sustainability 15 04985 g001
Figure 2. Injection from the external high voltage feeder into the power grid of Yverdon-les-Bains for the initial (a) and the 3 (bd) future scenarios for the selected heat peak day.
Sustainability 15 04985 g002
Figure 3. Electricity supply over the considered heat-peak day for scenario 3.
Sustainability 15 04985 g003
Figure 4. Distribution of voltage (left) and line loading (right) for the power grid at 20:00 for the initial state (s0).
Sustainability 15 04985 g004
Figure 5. Total length of all cables with over line loading for the 4 considered scenarios on the selected heat demand peak day.
Sustainability 15 04985 g005
Figure 6. Distribution of voltage and line loading at 20:00 for the full heat pump scenario (s1).
Sustainability 15 04985 g006
Figure 7. Distribution of voltage and line loading at 20:00 for the partly heat pump scenario (s2).
Sustainability 15 04985 g007
Figure 8. Distribution of voltage and line loading at 20:00 for the heat pump and co-generation mixed scenario (s3).
Sustainability 15 04985 g008
Figure 9. Voltage of every cable in the power grid in p.u. for scenario 1 (a) and scenario 3 (b).
Sustainability 15 04985 g009
Table 1. Definition of each scenario based on the heating unit transition.
Transition
from… to…
Oil BoilerGas BoilerDHNHPCHP
Scenario 0-----
Scenario 1HPHPfuture *-HP
Scenario 2HP-future *--
Scenario 3HPCHPfuture *--
* as defined in Section 2.3.
Table 2. Parameters of the power grid for the test case of Yverdon-les Bains.
ParameterValueUnit
Surface of YLB13.54km 3
Inhabitants29,955-
Number of Buildings3364-
Nodes9744-
Length LV cables270.32km
Length MV cables53.95km
Transformers85-
Table 3. Distribution of heating technologies for all scenarios over number of buildings and share of total heating.
TechnologyParameters0s1s2s3
Oil Boiler# Buildings1118---
% H t o t a l 35.9---
Gas Boiler# Buildings2208-2150-
% H t o t a l 61.8-42.3-
DHN# Buildings3105105105
% H t o t a l 0.6313131
HP# Buildings3532591109 (+6)1109
% H t o t a l 0.86925.325.3
CHP# Buildings--- (+1)2150
% H t o t a l ---42.3
Table 4. Comparison of grid reinforcement for considered scenarios (with values in bold lower then in the initial scenario s0).
100% Cable ResistanceIter. 1 (80%)Iter. 2 (64%)
Scenarios0s1s2s3s1s1
V ≤ 0.9 p.u. (Nodes)6499326360657481
V ≤ 0.85 p.u. (Nodes)08543204323
LL ≥ 80% (in km)1.668.753.261.693.211.28
LL ≥ 100% (in km)0.673.201.130.491.260.07
LL ≥ 150% (in km)00.39<0.010<0.010
Table 5. Influence on the line loading and voltage level of injecting reactive power by the proposed installed photovoltaic systems (with values in bold lower then in the initial scenario s0).
100% Cable ResistanceIter. 1 (80%)Iter. 2 (64%)
Scenario PV 0 PV 30 PV 70 PV 100 PV 30 PV 70 PV 100 PV 30 PV 70 PV 100
V ≤ 0.9 p.u.993389136502395129190340
V ≤ 0.85 p.u.85432102400000
LL ≥ 80%(in km)8.758.329.8311.953.424.657.281.483.165.15
LL ≥ 100%(in km)3.203.383.614.741.351.922.550.160.751.49
LL ≥ 150% (in km)0.390.200.710.92<0.010.250.5400.230.37
Table 6. Critical cable results of the power grid at 11:00 for the k-Medoids day of initial electricity demand (with values in bold lower then in the initial scenario s0).
Scenarios0s1s2s3
V ≥ 1.1 p.u.0117125126
V ≤ 0.9 p.u.0185185185
LL ≥ 80% (in km)0.322.222.222.39
LL ≥ 100% (in km)0.181.461.461.46
LL ≥ 150% (in km)≤ 0.010.670.670.67
Disclaimer/Publisher’s Note: The statements, opinions and data contained in all publications are solely those of the individual author(s) and contributor(s) and not of MDPI and/or the editor(s). MDPI and/or the editor(s) disclaim responsibility for any injury to people or property resulting from any ideas, methods, instructions or products referred to in the content.