Article

Origin-Destination Traffic Survey—Case Study: Data Analyse for Bacau Municipality

by
Oana Irimia
1,
Mirela Panaite-Lehadus
1,*,
Claudia Tomozei
1,*,
Emilian Mosnegutu
1 and
Grzegorz Przydatek
2
1
Faculty of Engineering, “Vasile Alecsandri” University of Bacău, 600115 Bacău, Romania
2
Institute of Engineering, Nowy State University of Applied Sciences Sacz Zamenhofa 1a, 33-300 Nowy Sacz, Poland
*
Authors to whom correspondence should be addressed.
Sustainability 2023, 15(6), 4975; https://doi.org/10.3390/su15064975
Submission received: 15 February 2023 / Revised: 7 March 2023 / Accepted: 9 March 2023 / Published: 10 March 2023
(This article belongs to the Special Issue Sustainable Road Transport System Planning and Optimization)

Abstract

:
In order to develop a transport model for the municipality of Bacau, it was necessary to collect data on the current mobility characteristics of people and goods. Traffic data were collected by means of using an origin-destination (O-D) survey. This survey was carried out in the form of a manual traffic census arranged in stations at six points on the entrance sectors of the national roads in the city of Bacau. At the level of the municipality of Bacau, data from a sample of 3040 drivers were used for the origin-destination surveys. The respondents answered 11 questions. The article presents the results obtained from the six control points for seven questions that were considered relevant. The data obtained were initially used to identify, from a percentage and quantitative point of view, the type of traffic specific to the municipality of Bacau. The analysis of the data shows that the majority of vehicles, 78.9%, originate from Bacau County and that 87.2% of those interviewed have Bacau County as their destination. Most vehicles passing through the checkpoints were within the time intervals 7:30–8:30, i.e., 15.55%, and 16:30–17:30, i.e., 16.18%. The highest proportion of registered vehicles were from Romania, 97.99%. Additionally, 40.75% of the respondents were travelling for business purposes, and approximately the same share was found for the number of people in the vehicle; i.e., single occupant vehicles comprised 58.35% of the total vehicles surveyed. Passenger cars accounted for 67.66% of the vehicles. By using the OriginLab software, the aim was to create parallel graphs for each control point in order to identify certain correlations between the data obtained from the questionnaire. At the end of the article, a hierarchical cluster statistical analysis was carried out by using OriginLab, which identified a series of correlations between the analysed parameters.

1. Introduction

According to European strategic documents, a sustainable urban mobility plan (SUMP) is a document but also a tool for the development of specific policies, based on a transport model developed with the help of traffic-modelling software, to solve the mobility needs of people and economic units in the city and in neighbouring areas, for better quality of life, contributing at the same time to the achievement of European objectives for energy efficiency and environmental protection [1,2,3,4,5].
Additionally, in the Romanian legislative context, the main target of the urban mobility plan is to improve the accessibility of localities and the relationships between them, to diversify and sustainably use the means of transport from social, economic and environmental points of view and to ensure the good integration of different modes of mobility and transport [6,7]. In Romania, the laws governing aspects of the urban mobility plan include Law no. 350/2001 on spatial planning and urbanism, republished with additions and changes in March 2022 and as Order no. 233/2016 for the approval of the methodological norms for the application of Law no. 350/2001 on spatial planning and urbanism and on the elaboration and updating of urban-planning documentation [6,7,8].
The procedures for creating a sustainable urban mobility plan are carried out by the European Commission in the form of the Guide for Developing and Implementing a Sustainable Urban Mobility Plan and are distributed to the other member states [3,9]. Within the Guide for Developing and Implementing a SUMP, Rupprecht Consult elaborated, in the form of a cyclic diagram, the stages of the development and implementation of a sustainable urban mobility plan. This cycle diagram includes four phases, each with three steps, and a total of 32 activities (Figure 1) [10,11,12].
An important stage of a SUMP consists of analysing the mobility situation and developing possible future mobility scenarios. To analyse the mobility situation, it is necessary to collect data on the current characteristics of mobility for the transport of people and goods. Traffic data are collected in four ways: a travel behaviour survey, an origin-destination survey of passenger cars, an origin-destination survey of public transport and a park and ride survey [10,13,14].
Origin-destination (O-D) studies are used to determine the patterns of traffic movement in an area of interest for a specific period of time [13,15]. These studies provide traffic planners and agencies with information on where drivers start and end their trips. O-D surveys provide rich and extensive data that allow planners to gain a clear picture of journey routes from start to finish [16,17,18].
Numerous sustainable urban mobility plans have been developed with origin-destination surveys as the main components. Various methods were used to collect the data needed to produce such a plan: questionnaires completed by traffic participants [19,20,21,22] and information transmission systems (these are used to study the movement of specific vehicles) [1,10].
In the city of Sussex (New Jersey), 12,346 questionnaires were distributed to drivers in the form of postcards. Of these, 42% sent their answers by email or post, including comments on the travel route (origin and destination), traffic conditions and/or possible solutions [20,21].
Another urban mobility plan study conducted with questionnaires in the form of postcards was conducted in Bloomington-Normal (Illinois). In total, 20,233 survey postcards were handed out to drivers at police stop signs or signalized intersections. The total number of survey cards returned was 6023, representing a return rate of approximately 30%. The subsequent analysis of the O-D data supported the calibration and validation process of the city’s transport model [19,22].
The traffic survey in the metropolitan area of Helsinki (Finland) included four studies: a travel behaviour study, a car origin-destination study, a public transport origin-destination study and a parking and travel study. The survey area covered 37 municipalities in and around the Helsinki region, and the target population was 1.5 million inhabitants [23,24].
Also in Romania, sustainable urban mobility plans were developed on the basis of the modelling of travel demand through the O-D matrix. Studies were carried out in cities such as Pitesti, Deva, Ianca, Marghita, Campina, Alexandria, Campulung and Reghin, following which transport needs and appropriate solutions were identified on the basis of using O-D surveys [25,26,27,28].
The analysis of the articles involving a sustainable urban mobility plan (SUMP) was restricted to using only questionnaires. Table 1 presents the findings and gaps in the literature.
At the level of Bacau municipality (Romania), the SUMP was developed according to European documents and recommendations, in accordance with national legislation [40]. The Bacau SUMP aimed to improve the efficiency of transport services and infrastructure, reduce the need for motorized transport, reduce the environmental impact and energy consumption of transport activities, ensure an optimal level of accessibility within the city and within the metropolitan areas, ensure a safe environment for the population and ensure accessibility for all categories of people, including people with disabilities [40].
For the elaboration of the SUMP for the municipality of Bacau, complex documentation of the current performance of the transport system was carried out. Thus, the transport model for the SUMP for the municipality of Bacau was developed on a common application including three basic components. For the development of the transport model, in the case of Bacau’s SUMP, a questionnaire analysis was designed, in 2016, with the following objectives: an origin-destination analysis focused on the entry points of the municipality, an analysis on transport in the municipality and a traffic analysis on the main intersections of the municipality [41].
In the present paper, only a detailed analysis of the data obtained from the questionnaires, based on the origin-destination traffic analysis on the entry points in Bacau municipality, is presented. This analysis was carried out in order to identify certain correlations between the parameters required in the study and obtained through the questionnaires. The article did not aim to generate a traffic model, which was presented in the Bacau SUMP [40].

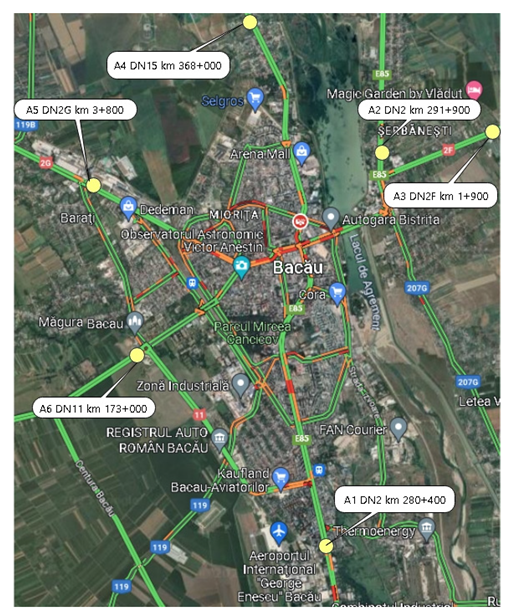
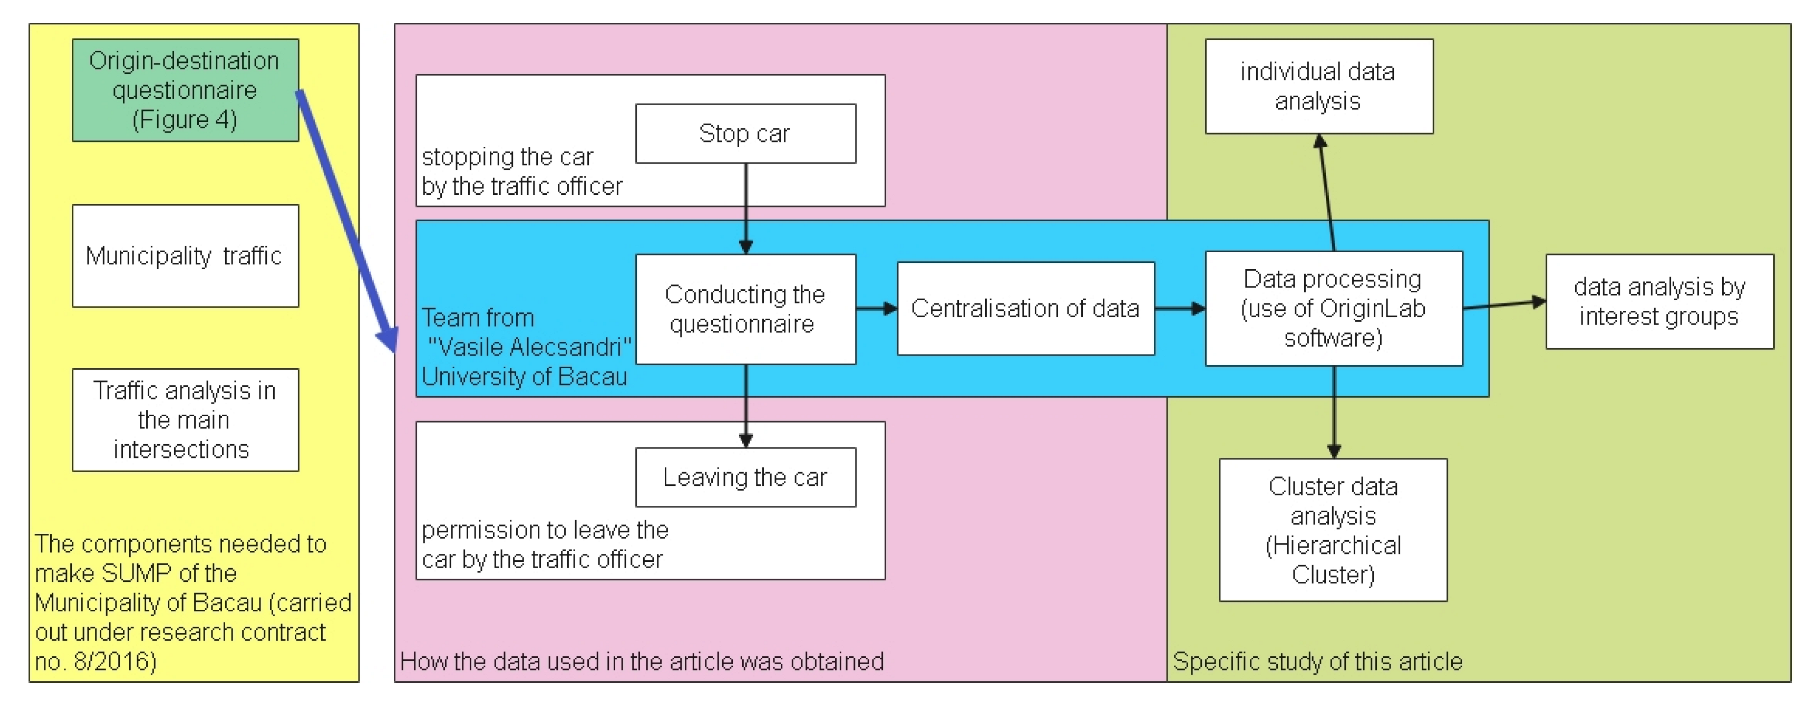
2. Materials and Methods

The origin-destination (O-D) surveys, which were necessary for the realization of the transport model for the municipality of Bacau, were carried out in November 2016 at six survey points on the entrance sectors of national roads in the city of Bacau, Bacau County, Romania (Figure 2) [40].
At each point, the investigation was carried out over a single day, between 07:30 and 13:30 and between 14:30 and 17:30, investigating vehicles whose trip directions were within the city centre. With the help of the Romanian traffic police, the third or fourth car and all goods vehicles was stopped on the way into the city, for the investigation (by administering the questionnaire). Figure 3 shows images from the A1 investigation point (DN 2, km 280 + 400), in the metropolitan Praktiker area.
In order to carry out the interviews, each interview point was appropriately set up according to the actual conditions in the field under the close supervision of a representative of the Romanian traffic police. The vehicles were stopped only by a police officer so as not to block the traffic.
Interviews were conducted on the basis of a questionnaire. The questionnaire items are shown schematically in Figure 4. Thus, the questionnaire recorded information on the origin and destination of the trip, the time interval in which the interview was conducted, the country of registration of the vehicle and its type, the purpose of the trip and the number of passengers in the car.
This type of traffic analysis, which was based on questionnaires and which involved interviewing drivers and manually filling in the paper questionnaire, was carried out because Bacau does not have a traffic-monitoring system that uses surveillance cameras, tracking cards or drones. Because this analysis was carried out over a single day (for a 9 h interval) and because of the way the analysis was carried out (on the basis of interviewing drivers), the data obtained are not accurate and do not show the real value of car traffic intensity. A comparison of the data collection method used in this study with the data collection method used in the literature (Table 1) shows that there is a significant difference in the time spent on data collection. However, the main element is the number of completed questionnaires, which are, in this case, sufficient and can generate an overview of the traffic in Bacau municipality.
After the data were collected and centralized, they were submitted for analysis. For this purpose, OriginLab software was used [42], which has special tools to perform a simple analysis (individual analysis of the components of the questionnaire) or a complex analysis of the data used. The complex data analysis included a graphical analysis of the data (a graphical analysis that was carried out on two groups of data, groups that were made so that the obtained graphs were clear and as representative as possible) and a statistical analysis; because the data were obtained from a questionnaire and because they have different forms of presentation (numerical and text), it was decided that a statistical cluster analysis be carried out to try to identify a correlation between the obtained data.
In Figure 5, the working steps for both data collection and data analysis are presented.

3. Results

At the level of the Bacau municipality, data from a sample of 3040 drivers were used for the origin-destination surveys, as follows: Point A1—584 questionnaires, Point A2—426 questionnaires, Point A3—514 questionnaire, Point A4—484 questionnaires, Point A5—588 questionnaires and Point A6—444 questionnaires. The results of the interviews are individually presented for each questionnaire item.

3.1. Origin of the Trip

When asked the origin of their trip, respondents had the option of designating the nearest intersection, the actual address, the municipality or the zip code. After analysing the interviews, it was found that, on average, for the six interview positions, 78.94% of the respondents had Bacau County as the origin of their trip, and about 20% of the respondents had 31 counties, among the 41 counties of Romania, as the origin of their trip. It was also observed that the counties neighbouring Bacau County (Neamt, Iasi, Harghita, Covasna, Galati, Vrancea and Vaslui) were the largest contributors of traffic to individual routes (13.05%) and that 1.84% of all trips originated from Bucharest City (the capital of Romania), through the A1 route. There were no registered travellers from the Bihor, Calarasi, Caras Severin, Dolj, Gorj, Hunedoara, Mehedinti, Salaj, Satu Mare or Valcea counties.
Table 2 describes the distribution of trip origins for all surveyed trips for each individual route, and Figure 6 shows the origin of respondents’ travel for each county.

3.2. Destination of the Trip

As with the question of trip origin, respondents were given several options to describe their destination. It was found that approximately 88% of all trips were destined to stay in Bacau County, with about 8% variation for individual routes, and about 12% of the respondents had 23 counties, out of the 41 counties of Romania, as their trip destination. Additionally, an analysis of the questionnaires revealed that between 3.52% and 17.61% of the trips were to counties bordering Bacau County (Neamt, Iasi, Harghita, Covasna, Galati, Vrancea and Vaslui), and 1.21% of all trips were destined for Bucharest City (the capital of Romania), through the A1 route. There were no registered travellers in the Arges, Bihor, Calarasi, Caras Severin, Dambovita, Dolj, Gorj, Hunedoara, Ialomita, Maramures, Mehedinti, Mures, Olt, Salaj, Teleorman, Timis, Tulcea and Valcea counties.
Table 3 describes the distribution of trip destinations for all surveyed trips for each individual route, and Figure 7 shows the travel destination of respondents for each county in Romania.

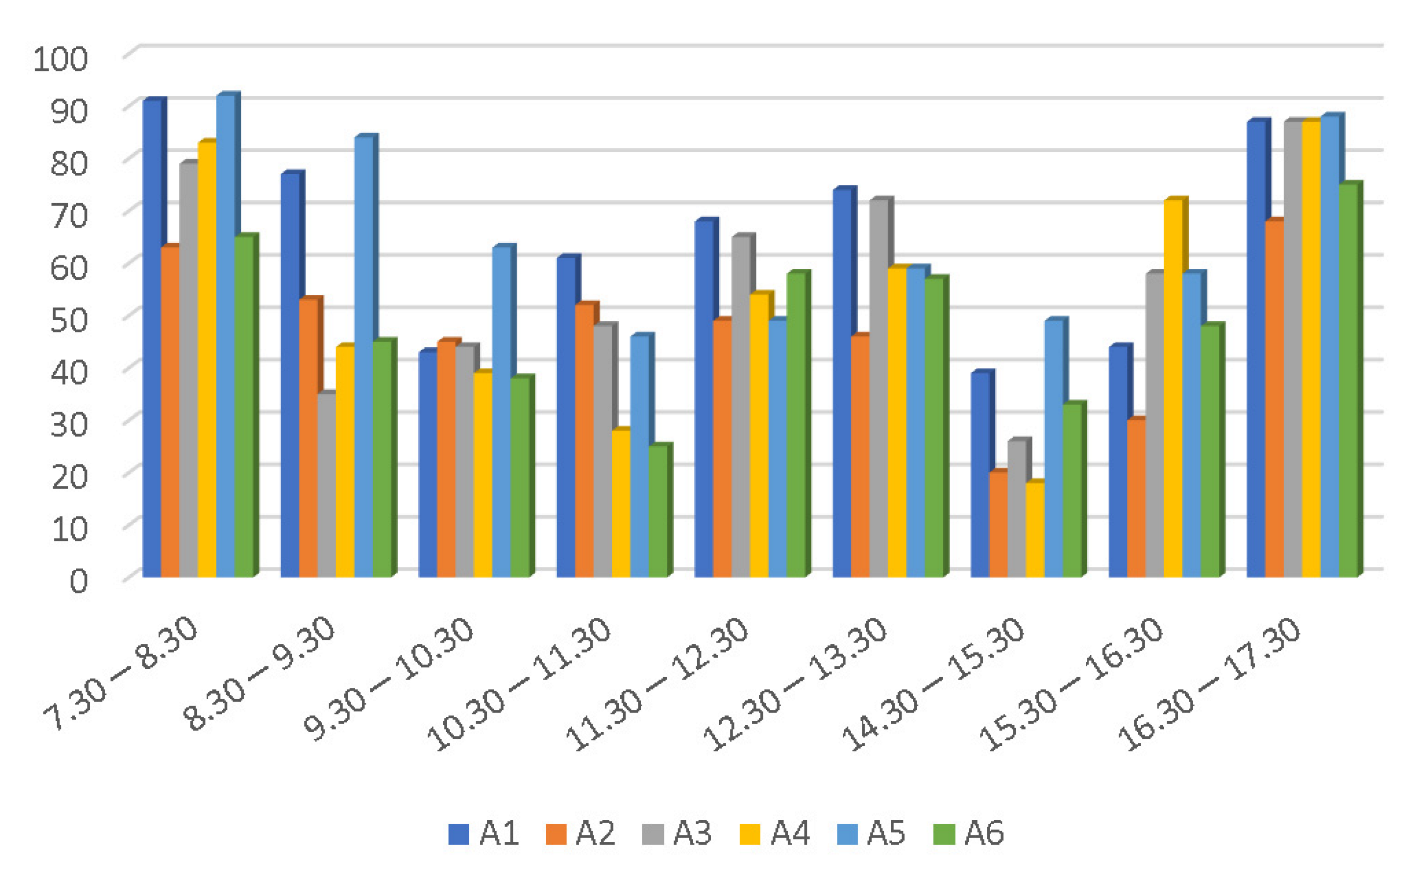
3.3. Hourly Interval

The time intervals during which the interviews were carried out were 07.30–13:30 and 14:30–17:30. An analysis of the interviews revealed that the time intervals during which the most interviews were carried out were 07:30–08:30, with 15.55% of the questionnaires and a variation of approximately 1% for each individual route, and 16:30–17:30, with 16.18% of the questionnaires and a variation of 2% for each individual route. From these results, it can be concluded that the highest traffic is recorded in these time intervals because the journey to work/school (07:30–08:30) and the return home (16:30–17:30) takes place in these time intervals. It was observed that two other time intervals with high traffic volumes were 11:30–12:30, at 11.28%, and 12:30–13:30, at 12.07%. The high traffic in these two time intervals was due to the commuting of preschool and high school students in the localities bordering Bacau municipality. The time intervals that registered the lowest traffic were 9:30–10:30, at 8.94%; 10:30–11:30, at 8.5%; and 14:30–15:30, at 6.08%.
Table 4 and Figure 8 show the hourly intervals of trips, recorded as origin-destination survey points.

3.4. Trip Purpose

Respondents were asked their trip purpose on the day of the survey and were given several choices: work/shuttle (WS), work interest (WI), studies/school (SS), shopping (SP), free time (FT) and other purpose (OP), of which they could check only one. Table 5 presents the trip purpose information in detail, and Figure 9 shows the trip purpose for the total of all the surveyed routes. Following the questionnaire analysis, it can be noted that, as expected, an overwhelming majority of trips were destined for the workplace: just over 40%, with 7% variation for individual routes. It was also observed that the next-highest trip purposes were work interest, at 12.26%, followed by free time, at 10.65%, and 6.74% of the respondents went shopping, while the purpose of 2.23% of them was school. It was also noted that 27.33% of the respondents had a different purpose of travel compared to those listed by the interviewer or did not want to declare the purpose of their trip.

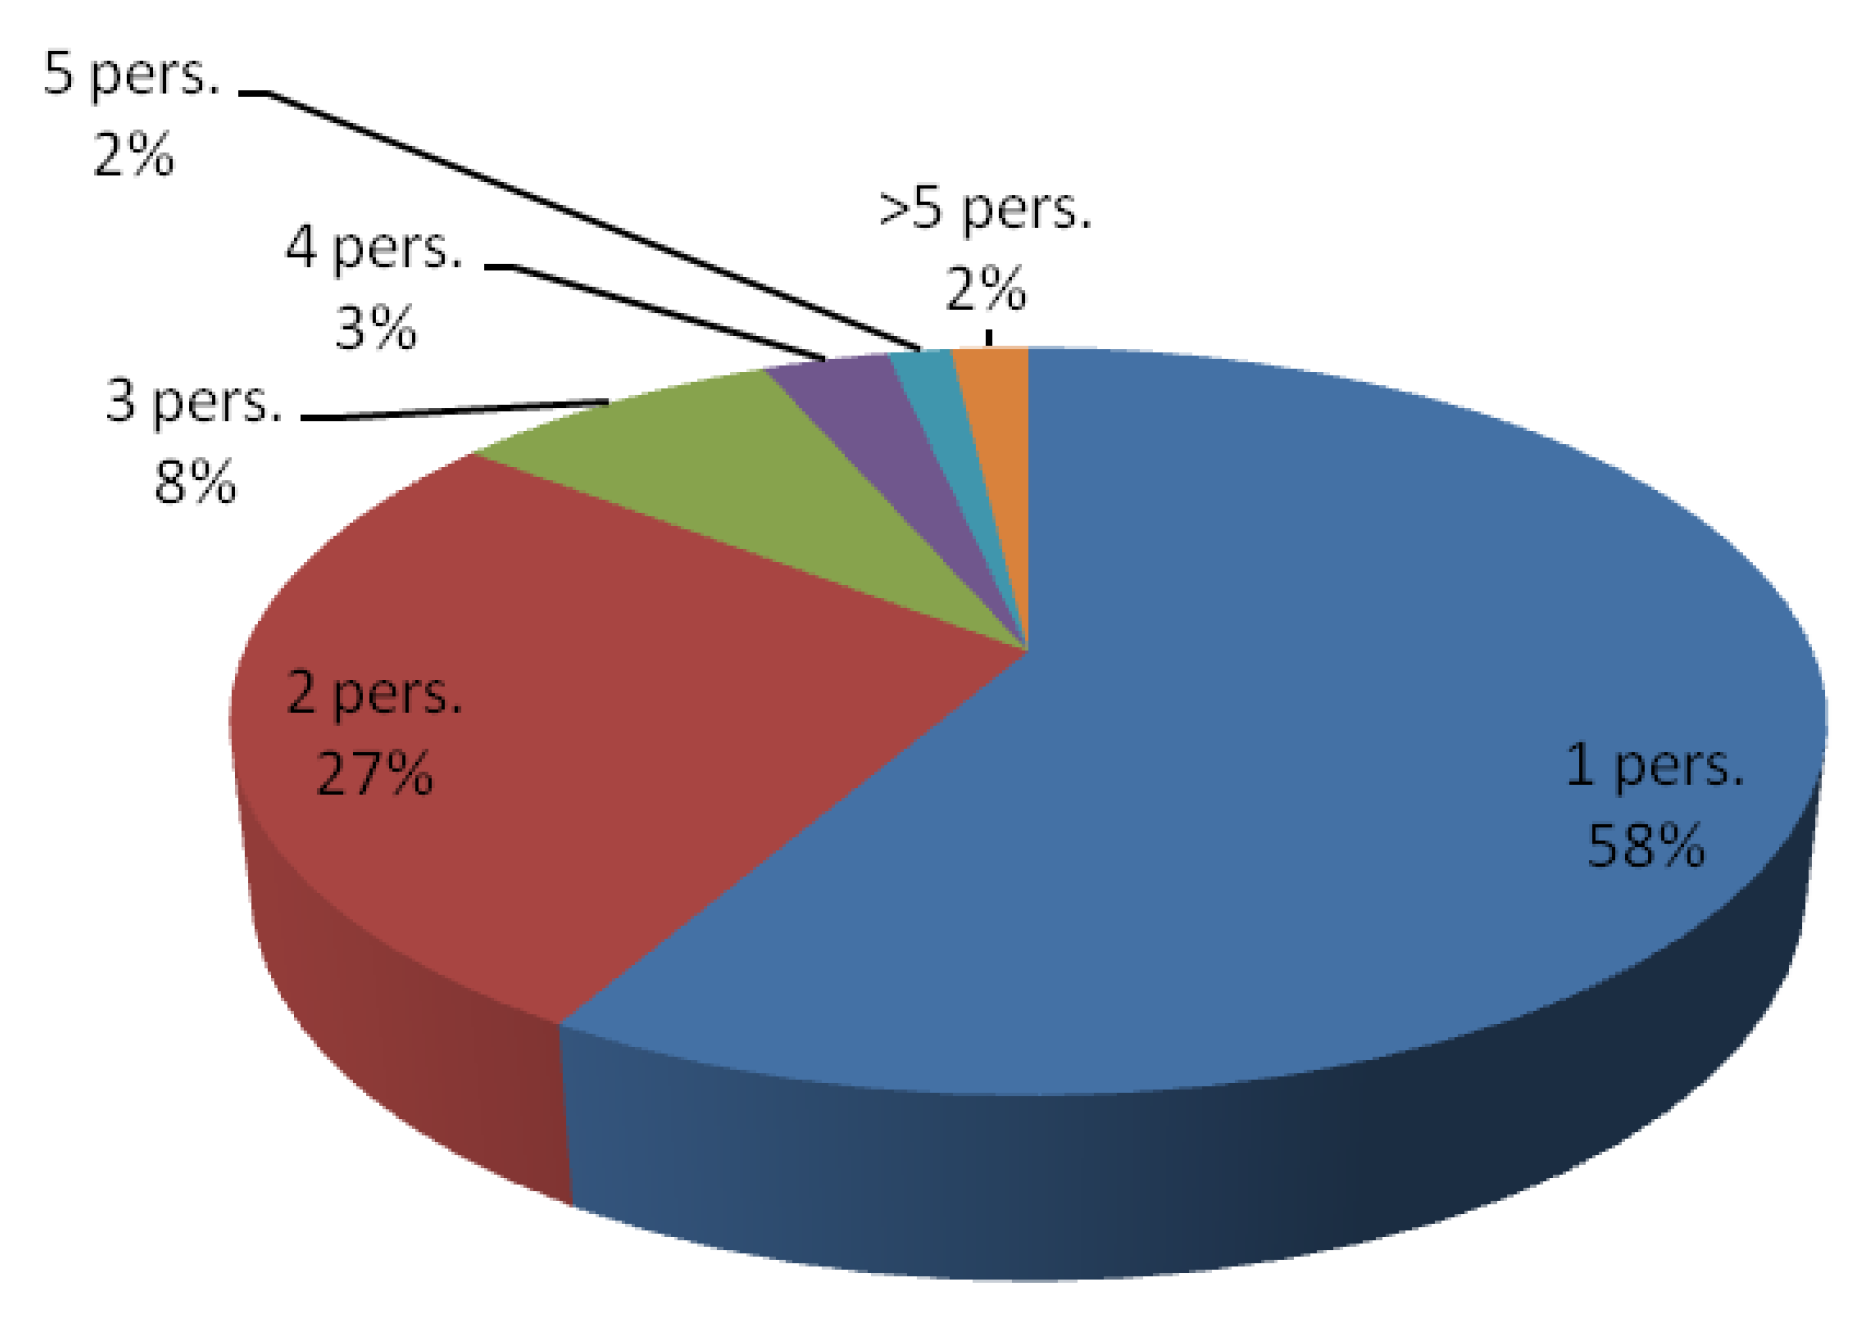
3.5. Vehicle Occupancy

Respondents were asked how many occupants were in their vehicle, including themselves. An analysis of the interviews revealed that single occupant vehicles represented 58.35% of all trips; vehicles with two occupants represented 27.13%; vehicles with three occupants represented 8.02% of all trips; and those with four passengers represented just over 3%. It was also found that vehicles with five or more occupants comprised just under 5%. The average vehicle occupancy for the surveyed routes was calculated at 1.52 people.
Table 6 and Figure 10 in detail describe the vehicle occupancy for each of the six interview points.

3.6. Vehicle Registration County

Another rubric in the interview questionnaire referred to the country of registration of the reviewed vehicles. Figure 11 shows the number of cars registered in Romania (N) and the number of cars registered in a foreign country (I). Thus, of the 3040 vehicles surveyed, 2979 were vehicles registered in Romania (97.99%), while only 61 vehicles were registered abroad (2.01%). These percentages registered very small variations in the six interview points (Table 7 and Figure 11).

3.7. Type of Vehicle

The rubric from the questionnaire relating to the type of vehicle was completed by the interviewer. He noticed the type of car stopped for review and ticked one of the options in the questionnaire:
  • Buses and coaches (BCs).
  • Trucks and derivatives with two axles (>3.5 t) (TD2s).
  • Trucks and derivatives with 3 or 4 axles (TD3s).
  • Trucks and special vehicles with MTMA ≤ 3.5 tonnes (TSs).
  • Passenger cars (PCs).
  • Passenger transport minibuses 8 + 1 seats (PTs).
  • Articulated vehicles and tugs with a trailer (AVs).
The following general observations were made on type of vehicle (Table 8 and Figure 12): 67.66% of the reviewed vehicles were part of the PCs category, followed by vehicles from category TSs, with 19.6%, and the other five types of vehicles (BCs, TD2s, TD3s, PTs and AVs) each have percentages lower than 5%.

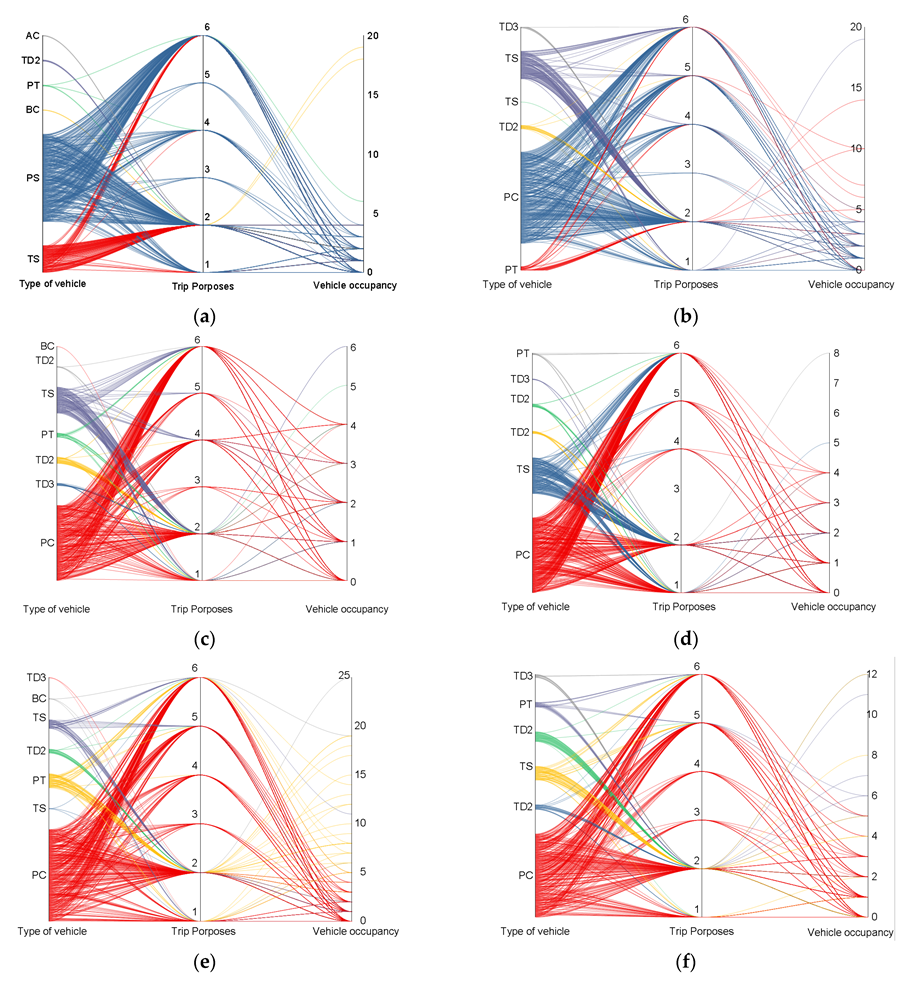
3.8. Complex Data Analysis

Next, a complex analysis of the studied parameters was carried out. This analysis involved the identification of certain correlations between the studied parameters and their grouping into specific groups that are easy to follow.
The fractional analysis of the questionnaire attempted to identify correlations between the studied parameters. Initially, a visual analysis was carried out by using a parallel graphical representation (from OriginLab software) in order to put forth an overall representation. Owing to the very large number of data (3040 data) and to the large set of responses, this type of representation was carried out for each individual investigation point (Figure 13), for the identification of the origin and destination and for the identification of the registration.
An analysis of the graphical representations in Figure 13 concludes that because the traffic analysis was carried out in Bacau municipality, the county seat, a significant number of cars were found to have Bacau County as their origin and destination. This can also be identified in Figure 5 and Figure 6. According to an analysis of the origin and destination of the cars interviewed, most of the results obtained correspond to the administrative-territorial structure. For Point A1, the number of vehicles that had Bacau County as their destination was 61% more than those that left Bacau County. It can be seen that this point is traversed by a lot of cars originating in the north and the south of the country. It was also observed that for Points A2, A3, A5 and A6, the difference between the number of cars originating from and destined to Bacau County is very small, ranging from 3% to 15%, the dominant number of cars destined for Bacau County, while for Point A4, the difference between the number of cars originating from and destined to Bacau County was about 7%, the majority of cars originating from Bacau County.
The graphical representations in Figure 12 also show a very small number of locations that do not correspond, from an administrative point of view. This was because drivers were asked to specify their departure and their final destination, and the municipality of Bacau is a transit location.
Figure 14 shows correlations between car type, trip purpose and number of passengers in the car. In Figure 14, in order not to load the graphic representation, the following notations were made: 1—work/shuttle; 2—work interest; 3—studies/school; 4—shopping; 5—free time; and 6—other purpose.
In addition to the conclusions drawn from the analysis of Figure 9, Figure 10 and Figure 12, from which general conclusions were drawn for the three questions in the questionnaire, it can be seen in those figures that for Point A1, the highest number of vehicles was found to be PCs, at 314, followed by TSs, at 96. From the large number of PCs, it is observed that 41.7% of them had other purpose and 35% had work interest as the purpose of their trip. For TSs, 73% of them selected work interest. About 60% of the drivers of PCs had no passengers, and 53.1% of the drivers of TCs were alone in the cab. At Point A2, the highest share of vehicles comprised passenger cars, at 66.4%, where two (36.3%) and six (26%) people were in the cab, and 53.6% of these vehicles had only a driver. The next-largest group of vehicles was PCs, at 119 vehicles, 69.74% selected work interest as their purpose. In addition, for these vehicles, 64.7% of the drivers were alone in the car. At Points A2 and A3, the highest share of vehicles comprised passenger cars, at 63.9%, who selected work interest (28.3%) or other purpose (34.7%); 47.8% of these vehicles had only a driver in them. TSs were in second place, representing 22.6% of all vehicles, whose occupants selected work interest as the main purpose (62.06%), and 53.4% of the drivers were alone in the car. At Point A4, the highest number of vehicles were in the PCs category, at 62.2%, followed by TSs, at 30.1%. For passenger cars, the main purpose of the journey was other purpose, at 45%, followed by work, at 22.1%, and work interest, at 22.4%. In the case of TSs, the same main activity was found, i.e., work interest, at 53.6%. Like the points presented above, the highest share of vehicles with only drivers in them was corepresenting the other categories, i.e., 60.9% of cars.
It was also observed that 74.7% of the vehicles that passed through Point A5 were motor vehicles, and in contrast to the previous points presented under Point A5, the next category of motor vehicles, at 11.77%, were PTs. The main purpose of the journey for these two vehicle categories was work interest, at 30.1% of motor vehicles and 61.4% of PTs. Additionally, at Point A5, 225 traffic participants were alone in the vehicle; this number is included in the category of car drivers.
At Point A6, 68.9% of the cars identified their purpose as work interest. In terms of the number of persons in the car, it was found that 56% of those questioned were alone in the vehicle. The second largest category of vehicles that were identified as passing through Point A6 were TSs, at 52 vehicles, whose purpose was work interest. Additionally, in this category of vehicles, it was found that 73% of the drivers were alone.
However, even from an analysis of these graphs, no correlations can be identified between the studied parameters. For this reason, a statistical analysis was used, i.e., a hierarchical cluster analysis, obtained using OriginLab software. The analysis was carried out by taking into account all the parameters previously presented and analysed, aiming at identifying an absolute correlation. The analysis performed by the programme resulted in the graphical representation shown in Figure 15.
From a statistical point of view, it can be concluded that as a result of the statistical analysis, three clauses emerge, from which the main correlations between the studied parameters are apparent. The first cluster is defined by the origin and destination of the trip, where origin is the most representative variable and where the second cluster comprises the type of vehicle and the number of passengers. Vehicle type and trip purpose are the characteristics included in the last cluster, and the time parameter is, according to the statistical analysis, the last representative parameter of the last cluster, being a secondary parameter.

4. Discussion

The main purpose of the work was to analyse the data obtained from conducting a questionnaire-type analysis, on the origin and destination of the vehicles that were on the entrance route to the Bacau municipality. This analysis is part of a plan for the realization of the traffic model corresponding to the municipality of Bacau and represents only part of the information necessary for its creation. The aim of the study is to identify certain correlations between the data obtained from the questionnaire.
According to this traffic model, the Bacau municipality needed a bypass belt, an objective that was completed in the second half of 2021.
In the future, we propose to carry out a second study that will have as its objective the impact of the bypass belt of Bacau on the traffic in the municipality of Bacau, aiming to carry out a comparative study between the values obtained in 2016 and new values.
A comparison of the analysis presented in the paper with those found in the literature (including only studies that conducted an origin-destination type of analysis and not a traffic model) reveals that the present paper is highlighted by the following: (1) it introduces a representation model of data, obtained after the questionnaire, that is much more complex but at the same time easier to analyse (Figure 13 and Figure 14) and (2) it carries out a hierarchical cluster statistical analysis with the aim of identifying whether traffic is influenced by certain individual factors or a combination of factors (Figure 15).

5. Conclusions

At the current stage of global economic development, transport planners are faced with the options of building new roads or implementing traffic management programmes as a result of increasing transport demand.
In order to realize the transport model for Bacau municipality, but also for traffic analysis and forecasting, it was necessary to collect concrete traffic data. Data from a sample of 3040 drivers were used to obtain traffic information.
The majority of respondents (about 80%) had Bacau County as the origin of the trip, the other respondents coming from 31 of the other counties of Romania, and no vehicles came from the other 10 counties of Romania.
Regarding the destination of the trip, almost 90% of the travellers had Bacau County as the final destination of the trip; the rest of the respondents were travelling to one of the 23 other counties of Romania.
The time intervals in which most interviews were conducted were 07:30–08:30, with a variation of approximately 1% for each route, and 16:30–17:30, with a variation of 2% for each route.
In terms of trip purpose, as expected, an overwhelming majority of trips were to work (of the six travel options): at just over 40%, with a 7% variation for individual routes.
The average vehicle occupancy for the all the surveyed routes was calculated at 1.52.
Of the cars that participated in the survey, 98% were registered in Romania, and the rest were registered abroad.
Additionally, following the interviews, it was found that approximately 70% of the vehicles surveyed belonged to the PCs category.
The results of the raw data processing were of particular importance in both calibrating and validating the transport model in terms of the spatial distribution of trips and trip purposes.
The statistical analysis resulted in three groups, into which the analysed variable parameters could be grouped.
As a final conclusion of this study, it can be said that the Bacau municipality is a city where the number of vehicles is high, which results from the large number of drivers who were surveyed in the relatively small time interval, i.e., 3040 questionnaires in 10 h. These drivers are only a fraction of those who passed through the checkpoints. Bacau is also a road junction linking the north of Moldavia to the south, east and west of the country.
The origin-destination questionnaires were used for the elaboration of the sustainable urban mobility plan of the municipality of Bacau and implicitly to improve the efficiency of transport services and infrastructure, reduce the need for motorized transport, reduce the environmental impact and energy consumption of transport activities, ensure an optimal level of accessibility within the locality and within the metropolitan/periurban areas, ensure a safe environment for the population and ensure accessibility for all categories of people, including people with disabilities.
Consequently, the assessment of the current and future mobility of Bacau in terms of its impact on economic efficiency, the environment, accessibility and safety was implicitly an assessment of its impact on the quality of life and liveability of cities.

Author Contributions

Conceptualization, O.I. and E.M.; methodology, M.P.-L.; software, E.M.; validation, M.P.-L. and G.P.; formal analysis, E.M.; investigation, O.I. and M.P.-L.; data curation, O.I.; writing—original draft preparation, O.I.; writing—review and editing, E.M.; visualization, C.T.; supervision, M.P.-L.; funding acquisition, M.P.-L. All authors have read and agreed to the published version of the manuscript.

Funding

This research was funded by research contract no. 8/2016 under the theme “Traffic data collection for the elaboration of the Sustainable Urban Mobility Plan—BACAU”. Funded by SC SEARCH CORPORATION S.R.L., Bucuresti, Romania.

Institutional Review Board Statement

Not applicable.

Informed Consent Statement

Not applicable.

Data Availability Statement

Not applicable.

Conflicts of Interest

The authors declare no conflict of interest.

References

  1. Alsger, A.; Assemi, B.; Mesbah, M.; Ferreira, L. Validating and improving public transport origin-destination estimation algorithm using smart card fare data. Transp. Res. Part C Emerg. Technol. 2016, 68, 490–506. [Google Scholar] [CrossRef]
  2. Anthony, C.; Chootinan, P.; Ryu, S.; Wong, S.C. Quality measures of origin-destination trip table estimated from traffic counts: Review and new generalized demand scale measure. J. Transp. Eng. 2012, 138, 1340–1349. [Google Scholar]
  3. Bonnel, P.; Fekih, M.; Smoreda, Z. Origin-Destination estimation using mobile network probe data. Transp. Res. Procedia 2018, 32, 69–81. [Google Scholar] [CrossRef]
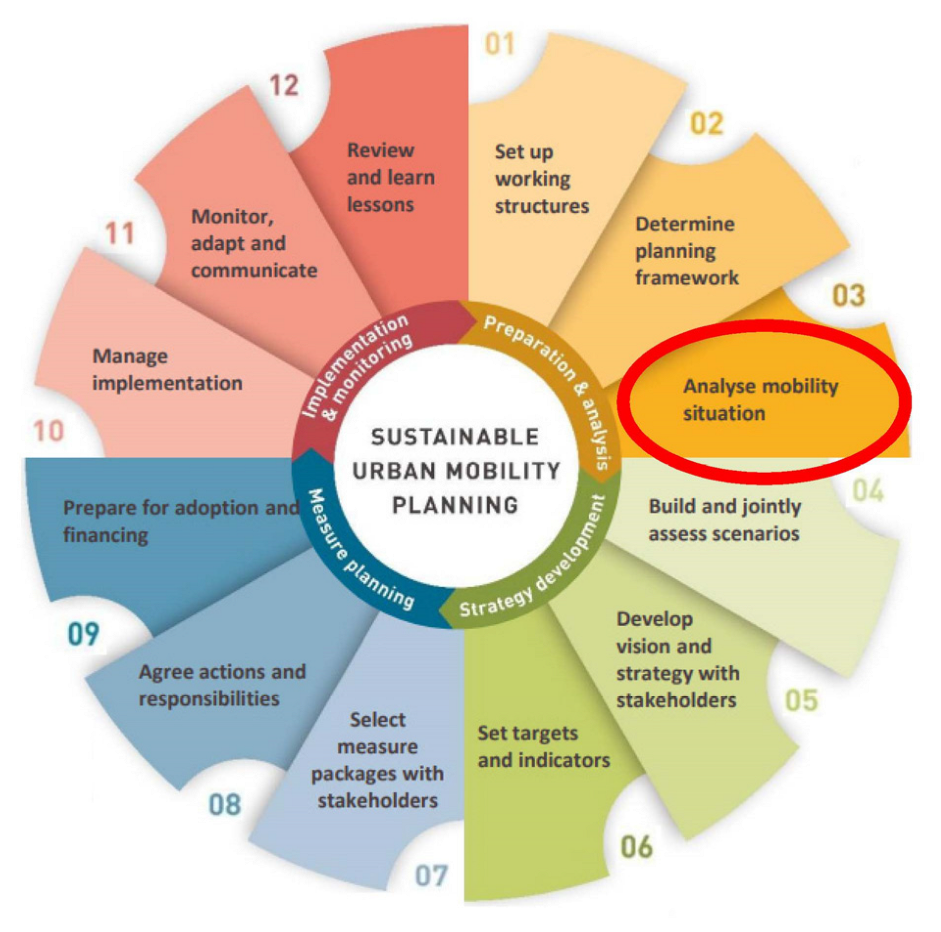
  4. SUMP. Guidelines European Programme for Accelerating the Take-Up of Sustainable Urban Mobility Plans. 2019. Available online: https://www.eltis.org/sites/default/files/sump_guidelines_2019_interactive_document_1.pdf (accessed on 12 June 2022).
  5. Werland, S. Diffusing sustainable urban mobility planning in the EU. Sustainability 2020, 12, 8436. [Google Scholar] [CrossRef]
  6. Law 350/2001 Regarding Spatial Planning and Urbanism, Republished with Addition and Changes in March 2022. Available online: https://legislatie.just.ro/Public/DetaliiDocument/29453 (accessed on 15 July 2022).
  7. Order no. 233/2016 for the Approval of the Methodological Norms for the Application of Law no. 350/2001 on Spatial Planning and Urbanism and on the Elaboration and Updating of Urban Planning Documentations. Available online: https://isc.gov.ro/files/2018/Legislatie/Ordinul%20nr%20233_2016%20Norme%20aplicare%20%20Legiea%20350_2001.pdf (accessed on 12 June 2022).
  8. Chimba, D.; Emaasit, D.; Kutela, B. Integrating Origin-Destination survey and stochastic user equilibrium: A case study for route relocation. J. Transp. Technol. 2012, 2, 297–304. [Google Scholar] [CrossRef]
  9. Haitao, Y.; Guoliang, L. A survey of traffic prediction: From spatio-temporal data to intelligent transportation. Data Sci. Eng. 2021, 6, 63–85. [Google Scholar]
  10. Munizaga, M.; Palma, C. Estimation of a disaggregate multimodal public transport Origin–Destination matrix from passive smartcard data from Santiago, Chile. Transp. Res. Part C Emerg. Technol. 2012, 24, 9–18. [Google Scholar] [CrossRef]
  11. Rupprecht Consult. 2005: SUTP Efficiency Study: Sustainable Urban Transport Plans (SUTP) and Urban Environment: Policies, Effects, and Simulations—Review of European References Regarding CO2 Emissions, Final Report. 10 October 2005. Available online: http://ec.europa.eu/environment/urban/pdf/sutp.pdf (accessed on 22 July 2022).
  12. Rupprecht Consult and Edinburgh Napier University. 2012: State-of-the-Art of Sustainable Urban Mobility Plans in Europe, Revised Version, September 2012. Available online: http://www.eltis.org/docs/sump_library/eltisplus_state-of-the-art_of_sumps_in_europe_sep2011_FINAL.pdf (accessed on 22 July 2022).
  13. Florin, R.; Olariu, S. A survey of vehicular communications for traffic signal optimization. Veh. Commun. 2015, 2, 70–79. [Google Scholar] [CrossRef]
  14. SMATS. Smart Traffic—5 Origin-Destination Study Methods. Available online: https://www.smatstraffic.com/2022/07/14/5-origin-destination-study-methods-2/ (accessed on 22 April 2022).
  15. Guy, B.P.; Fricker, J.D. Guidelines for Data Collection Techniques and Methods for Roadside Station Origin-Destination Studies, Purdue University, Indiana. 2005. Available online: https://docs.lib.purdue.edu/cgi/viewcontent.cgi?article=1716&context=jtrp (accessed on 12 July 2022).
  16. Kawasaki, S. The challenges of transportation/traffic statistics in Japan and directions for the future. IATSS Res. 2015, 39, 1–8. [Google Scholar] [CrossRef]
  17. Mandhare, P.A.; Kharat, V.; Patil, C.A. Intelligent road traffic control system for traffic congestion: A perspective. Int. J. Comput. Sci. Eng. 2018, 6, 908–915. [Google Scholar] [CrossRef]
  18. Nagy, A.A.M.; Simon, V. Survey on traffic prediction in smart cities. Pervasive Mob. Comput. 2018, 50, 148–163. [Google Scholar] [CrossRef]
  19. Seo, T.; Bayen, A.M.; Kusakabe, T.; Asakura, Y. Traffic state estimation on highway: A comprehensive survey. Annu. Rev. Control 2017, 43, 128–151. [Google Scholar] [CrossRef]
  20. Shahgholian, M.; Gharavian, D. Advanced traffic management systems: An overview and a development strategy. Electr. Eng. Syst. Sci. 2018, 1–39. Available online: https://arxiv.org/ftp/arxiv/papers/1810/1810.02530.pdf (accessed on 22 April 2022).
  21. SCNJ—Sussex County New Jersey. Sussex County Ten-Year Mobility Strategy. 2006. Available online: https://www.sussex.nj.us/cn/webpage.cfm?TPID=5765 (accessed on 11 August 2021).
  22. Eastside Highway Origin-Destination (od) Survey Summary. Available online: http://www.eastsidehighway.com/wp-content/uploads/2014/05/20110122_ESH-OD-Survey-Techmemo_Final1.pdf (accessed on 22 July 2022).
  23. Soltésza, T.; Abaa, A.; Bánfia, M.; Kózela, M. PFS method for pedestrian origin-destination surveys of enclosed areas. Transp. Res. Procedia 2017, 27, 680–687. [Google Scholar] [CrossRef]
  24. Pirkko, K. Origin-Destination Matrix Estimation with a Conditionally. Available online: https://helda.helsinki.fi/bitstream/handle/10138/317282/document.pdf?sequence=1 (accessed on 22 July 2022).
  25. Andrei, A.C.; Papuc, I.E. A Sustainable Urban Mobility Plan—Solution for a City of the Future? Rethinking Global Space, Culture and Change in Organizations; Conference Proceedings. 2016; ISBN 978-606-775-454-4. 2016. Available online: https://seaopenresearch.eu/Conferences/Proceedings/Article/NORD4_5.pdf (accessed on 12 July 2022).
  26. Mitran, G.; Ilie, S.; Nicolae, V. Origin—Destination traffic survey. Case study: Data collection for Pitesti—Mioveni transport model. Ann. Oradea Univ. Fascicle Manag. Technol. Eng. 2012, XI (XXI). Available online: https://imt.uoradea.ro/auo.fmte/files-2012-v2/TRANSPORT/Mitran%20Gabriela%20L1.pdf (accessed on 22 July 2022).
  27. Search Corporation. Traffic Study at the Level of Deva Municipality. 2009. Available online: https://www.primariadeva.ro/images/uploads/documente/PMUD_aprobat.pdf (accessed on 22 April 2022).
  28. TTL Planning. The Sustainable Urban Mobility Plan of Reghin Municipality. 2017. Available online: https://www.primariareghin.ro/fileadmin/editorimages/doc/studiu_trafic/Memoriu_trafic_dezmembrat_partea1.pdf (accessed on 22 April 2022).
  29. Sussex Country, New Jersey, Chapter 3: Origin/Destination Survey. Available online: https://www.sussex.nj.us/documents/planning/mobility/Mobility%20Study%20Chapter%203.pdf (accessed on 7 March 2023).
  30. East Side Highway, Eastside Highway Origin-Destination (OD) Survey Summary. Available online: http://www.eastsidehighway.com/wp-content/uploads/2014/04/20110122_ESH-OD-Survey-Techmemo_Final.pdf (accessed on 7 March 2023).
  31. Bartuska, L.; Stopka, O.; Hanzl, J.; Sedivy, J.; Rybicka, I. Changes in transport behaviour of the czech population caused by state of emergency. Transp. Probl. 2022, 17, 101–114. [Google Scholar] [CrossRef]
  32. Jordová, R.; Bruhová-Foltýnová, H. Rise of a new sustainable urban mobility planning paradigm in local governance: Does the SUMP make a difference? Sustainability 2021, 13, 5950. [Google Scholar] [CrossRef]
  33. Campisi, T.; Akgün, N.; Ticali, D.; Tesoriere, G. Exploring public opinion on personal mobility vehicle use: A case study in Palermo, Italy. Sustainability 2020, 12, 5460. [Google Scholar] [CrossRef]
  34. Krukle, Z.; Biezina, L.; Ernsteins, R. Sustainable urban mobility planning development preconditions: Governance system approach. Eng. Rural. Dev. 2019, 18, 954–963. [Google Scholar]
  35. Ravensbergen, L.; Fournier, J.; El-Geneidy, A. Exploratory analysis of mobility of care in Montreal, Canada. Transp. Res. Rec. 2023, 2677, 1499–1509. [Google Scholar] [CrossRef]
  36. Mohammad, P.; Gonzalo, R.; Asal, K.F. Pedestrian mobility in Temuco, Chile: The contribution of density and socio-demographic factors. Rev. Urban. 2022, 46, 57–74. Available online: https://scholar.google.com/citations?view_op=view_citation&hl=en&user=exxVzrkAAAAJ&citation_for_view=exxVzrkAAAAJ:4DMP91E08xMC (accessed on 12 May 2022).
  37. Bender, J.É.C.; Nassi, C.D.; Bortolini, J. Diferenças de padrão de viagem na Região Metropolitana do Rio de Janeiro (RMRJ). Rev. Transp. Territ. 2021, 24, 203–223. [Google Scholar]
  38. Thapa, K.; Sukhwani, V.; Deshkar, S.; Shaw, R.; Mitra, B.K. Strengthening urban-rural resource flow through regional circular and ecological sphere (R-CES) approach in Nagpur, India. Sustainability 2020, 12, 8663. [Google Scholar] [CrossRef]
  39. Japan International Cooperation Agency (JICA). Data collection survey on traffic improvement in Kathmandu Valley. The Federal Democratic Republic of Nepal, Ministry of Physical Planning, Works and Transport Management, Department of Roads. 2012; pp. 1–92. Available online: https://openjicareport.jica.go.jp/pdf/12082459_01.pdf (accessed on 7 March 2023).
  40. PMUD—Sustainable Urban Mobility Plan for Bacau Municipality. 2018. Available online: https://municipiulbacau.ro/wp-content/uploads/2019/01/02.planul-de-mobilitate-urbana-durabila-bacau-pmud.pdf (accessed on 12 May 2022).
  41. Tomozei, C.; Panainte-Lehadus, M.; Irimia, O.; Nedeff, F. Public transport in Bacau City. In Proceedings of the 2020 7th International Conference on Energy Efficiency and Agricultural Engineering (EE&AE), Ruse, Bulgaria, 12–14 November 2020; Available online: https://ieeexplore.ieee.org/document/9279088/authors#authors (accessed on 28 February 2023).
  42. Corporation Origine Origin Pro 2019b, Version 9.6.5.169. Available online: https://www.originlab.com/ (accessed on 12 January 2023).
Figure 1. The steps of a sustainable urban mobility plan.
Sustainability 15 04975 g001
Figure 2. Location of points where origin-destruction surveys were carried out.
Sustainability 15 04975 g002
Figure 3. Image of the investigation point A1 (DN 2, km 280 + 400), metropolitan Praktiker area.
Sustainability 15 04975 g003
Figure 4. Schematic presentation of the interview questionnaire questions.
Sustainability 15 04975 g004
Figure 5. Presentation of the work steps required for both data collection and data analysis.
Sustainability 15 04975 g005
Figure 6. Graphic representation for origin of respondents’ trip for each county.
Sustainability 15 04975 g006
Figure 7. Graphic representation for destination of respondents’ trip for each county.
Sustainability 15 04975 g007
Figure 8. Graphic representation for hourly interval of trip, recorded as origin-destination survey points.
Sustainability 15 04975 g008
Figure 9. Graphic representation for trip purposes, recorded as origin-destination survey points.
Sustainability 15 04975 g009
Figure 10. Graphic representation for vehicle occupancy recorded as origin-destination survey points.
Sustainability 15 04975 g010
Figure 11. Graphic representation for vehicle registration county, recorded as origin-destination survey points.
Sustainability 15 04975 g011
Figure 12. Graphic representation for type of vehicle, recorded as origin-destination survey points.
Sustainability 15 04975 g012
Figure 13. Identification of cars according to their origin, destination and registration: (a) Point A1; (b) Point A2; (c) Point A3; (d) Point A4; (e) Point A5; (f) Point A6.
Sustainability 15 04975 g013
Figure 14. Analysis of the data obtained for each point, according to type of car, purpose of travel and number of passengers: (a) Point A1; (b) Point A2; (c) Point A3; (d) Point A4; (e) Point A5; (f) Point A6.
Sustainability 15 04975 g014
Figure 15. Demographic representation of correlations between questionnaire parameters.
Sustainability 15 04975 g015
Table 1. Summary of the findings and the gaps in the literature.
Location under AnalysisType of Data AnalysisFindingsGaps
Romania—Pitesti [25]
statistical analysis
questionnaire completed on paper
1-month survey
14 h monitoring
Small number of questions in the questionnaire (5)
The number of questionnaires analysed was not specified
USA—Sussex, NJ [29]
statistical and graphical analysis
questionnaire completed on paper
5186 respondents
the questionnaire was conducted for 1.5 months
The questionnaire was conducted only for a period of 3 h, in the morning
USA— Bloomington-Normal, IL [30]
statistical and graphical analysis
questionnaire completed on paper
20 monitoring points
6023 respondents
There is no data on the period during which monitoring was carried out
Czech Republic [31]
statistical and graphical analysis
estimation model
DEA model for evaluation
questionnaire completed online
3136 respondents
1-month survey
Investigation was affected by the COVID-19 situation
Czech Republic [32]statistical and graphical analysisquestionnaire completed onlineA small number of respondents participated in the questionnaire (45), who were chosen as experts
Italy—Palermo [33]statistical and graphical analysis
questionnaire completed online and on paper
400 respondents
1-month survey
13 questions
Some questions were multiple choice
Latvia—Valmiera [34]document analysis
carrying out questionnaires
semistructured deep interviews
structured observations
No values were given, and the way the questionnaire was carried out was not shown
Canada—Montreal, QC [35]statistical and graphical analysis
360,000 respondents
The mode of completion of the questionnaire was not specified
The period during which the analysis was carried out was not specified
Chile—Temuco [36]statistical analysis
1721 respondents
questionnaire completed on paper
The mode of completion of the questionnaire was not specified
The analysis was carried out in 2013 and the article presenting the data was published in 2022
Brazil—Rio de Janeiro [37]statistical and graphical analysis
questionnaire completed on paper
9578 respondents
The period during which the analysis was carried out was not specified
India—Nagpur [38]statistical and graphical analysis
questionnaire completed on paper
study conducted over 2 months
437 respondents
The study was carried out for a region and not for a city
Nepal—Kathmandu Valley [39]statistical and graphical analysis
questionnaire completed on paper
18,100 respondents
study conducted over 2 months
The study was carried out for a region and not for a city
Table 2. Origin of trip, recorded as origin-destination survey points.
Point NumberA1A2A3A4A5A6All Routes
Origin of Trip T%T%T%T%T%T%T%
Bacau County42672.9421750.9344987.3540583.6753891.4936582.2240078.94
Other Counties15827.0620949.076512.657916.33508.517917.864021.06
Total5841004261005141004841005881004441003040100
Table 3. Destination of trip, recorded as origin-destination survey points.
Point NumberA1A2A3A4A5A6All Routes
Destination of Trip T%T%T%T%T%T%T%
Bacau County48783.3935182.3948494.1646796.4850285.3737985.36267087.82
Other Counties9716.617517.61305.84173.528614.636514.6437012.18
Total5841004261005141004841005881004441003040100
Table 4. Hourly interval of trip, recorded as origin-destination survey points.
Point NumberA1A2A3A4A5A6All Routes
Hourly Interval T%T%T%T%T%T%T%
7.30–8.309115.586314.787915.368317.149215.646514.6347315.55
8.30–9.307713.185312.44356.80449.098414.284510.1333811.11
9.30–10.30437.364510.56448.56398.056310.71388.552728.94
10.30–11.306110.445212.20489.33285.78467.82255.632608.55
11.30–12.306811.644911.506512.645411.15498.335813.0634311.28
12.30–13.307412.674610.797214.005912.195910.035712.8336712.07
14.30–15.30396.67204.694265.058183.71498.33337.431856.08
15.30–16.30447.53307.0425811.287214.87589.864810.8131010.19
16.30–17.308714.896815.968716.928717.978814.967516.8949216.18
Total5841004261005141004841005881004441003040100
Table 5. Trip purpose, recorded as origin-destination survey points.
Point NumberA1A2A3A4A5A6All Routes
Trip Purpose T%T%T%T%T%T%T%
WS27547.0817541.0720940.6618237.6019933.8419944.81123940.75
WI478.04388.925410.505611.5713823.46409.0037312.26
SS132.22173.9981.55183.7100122.702682.23
SP355.99317.277714.98336.81111.87184.0542056.74
FT9015.41133.05305.837415.28335.618418.9132410.65
OP12421.2315235.6813626.451212520735.209120.4983127.33
Total5841004261005141004841005881004441003040100
Table 6. Vehicle occupancy, recorded as origin-destination survey points.
Point NumberA1A2A3A4A5A6All Routes
Occupancy T%T%T%T%T%T%T%
133156.6724557.5126250.9728558.8837463.6027762.38177458.35
216027.3912830.0415630.3512826.4415225.8510122.7482527.13
3589.93337.745410.5275.57386.46347.652448.02
4172.91133.05244.66112.27132.21153.37933.05
571.1940.93152.9161.2391.5361.35471.54
>5111.8830.7030.58275.5720.34112.47571.87
Total5841004261005141004841005881004441003040100
Table 7. Vehicle registration county recorded as origin-destination survey points.
Point NumberA1A2A3A4A5A6All Routes
Occupancy T%T%T%T%T%T%T%
N56897.2641998.3550598.2547698.3557998.4643297.29297997.99
I162.7471.6591.6581.7591.64122.71612.01
Total5841004261005141004841005881004441003040100
Table 8. Type of vehicle, recorded as origin-destination survey points.
Point NumberA1A2A3A4A5A6All Routes
Type of Vehicle V%V%V%V%V%V%V%
BCs61.0240.9330.5840.8220.3430.67220.72
TD2s162.7361.40285.44102.06132.21184.05912.99
TD3s101.7120.46122.3330.6150.85132.92451.48
TSs11920.379622.5311622.56398.0517730.104911.0359619.60
PCs38265.4131173.0032964.0036475.2036662.2430568.692.05767.66
PTs335.6540.93203.895711.7791.53194.271424.67
AVs183.0830.761.1671.44162.72378.33872.86
Total5841004261005141004841005881004441003040100
Disclaimer/Publisher’s Note: The statements, opinions and data contained in all publications are solely those of the individual author(s) and contributor(s) and not of MDPI and/or the editor(s). MDPI and/or the editor(s) disclaim responsibility for any injury to people or property resulting from any ideas, methods, instructions or products referred to in the content.

