

Do We Consider Sustainability When We Measure Small and Medium Enterprises’ (SMEs’) Performance Passing through Digital Transformation?

 , , ,
, , ,
Abstract
1. Introduction
2. Theoretical Background
2.1. Small and Medium Enterprises (SMEs)
2.2. Digital Transformation (DT)
2.3. Triple Bottom Line (TBL)
3. Research Design
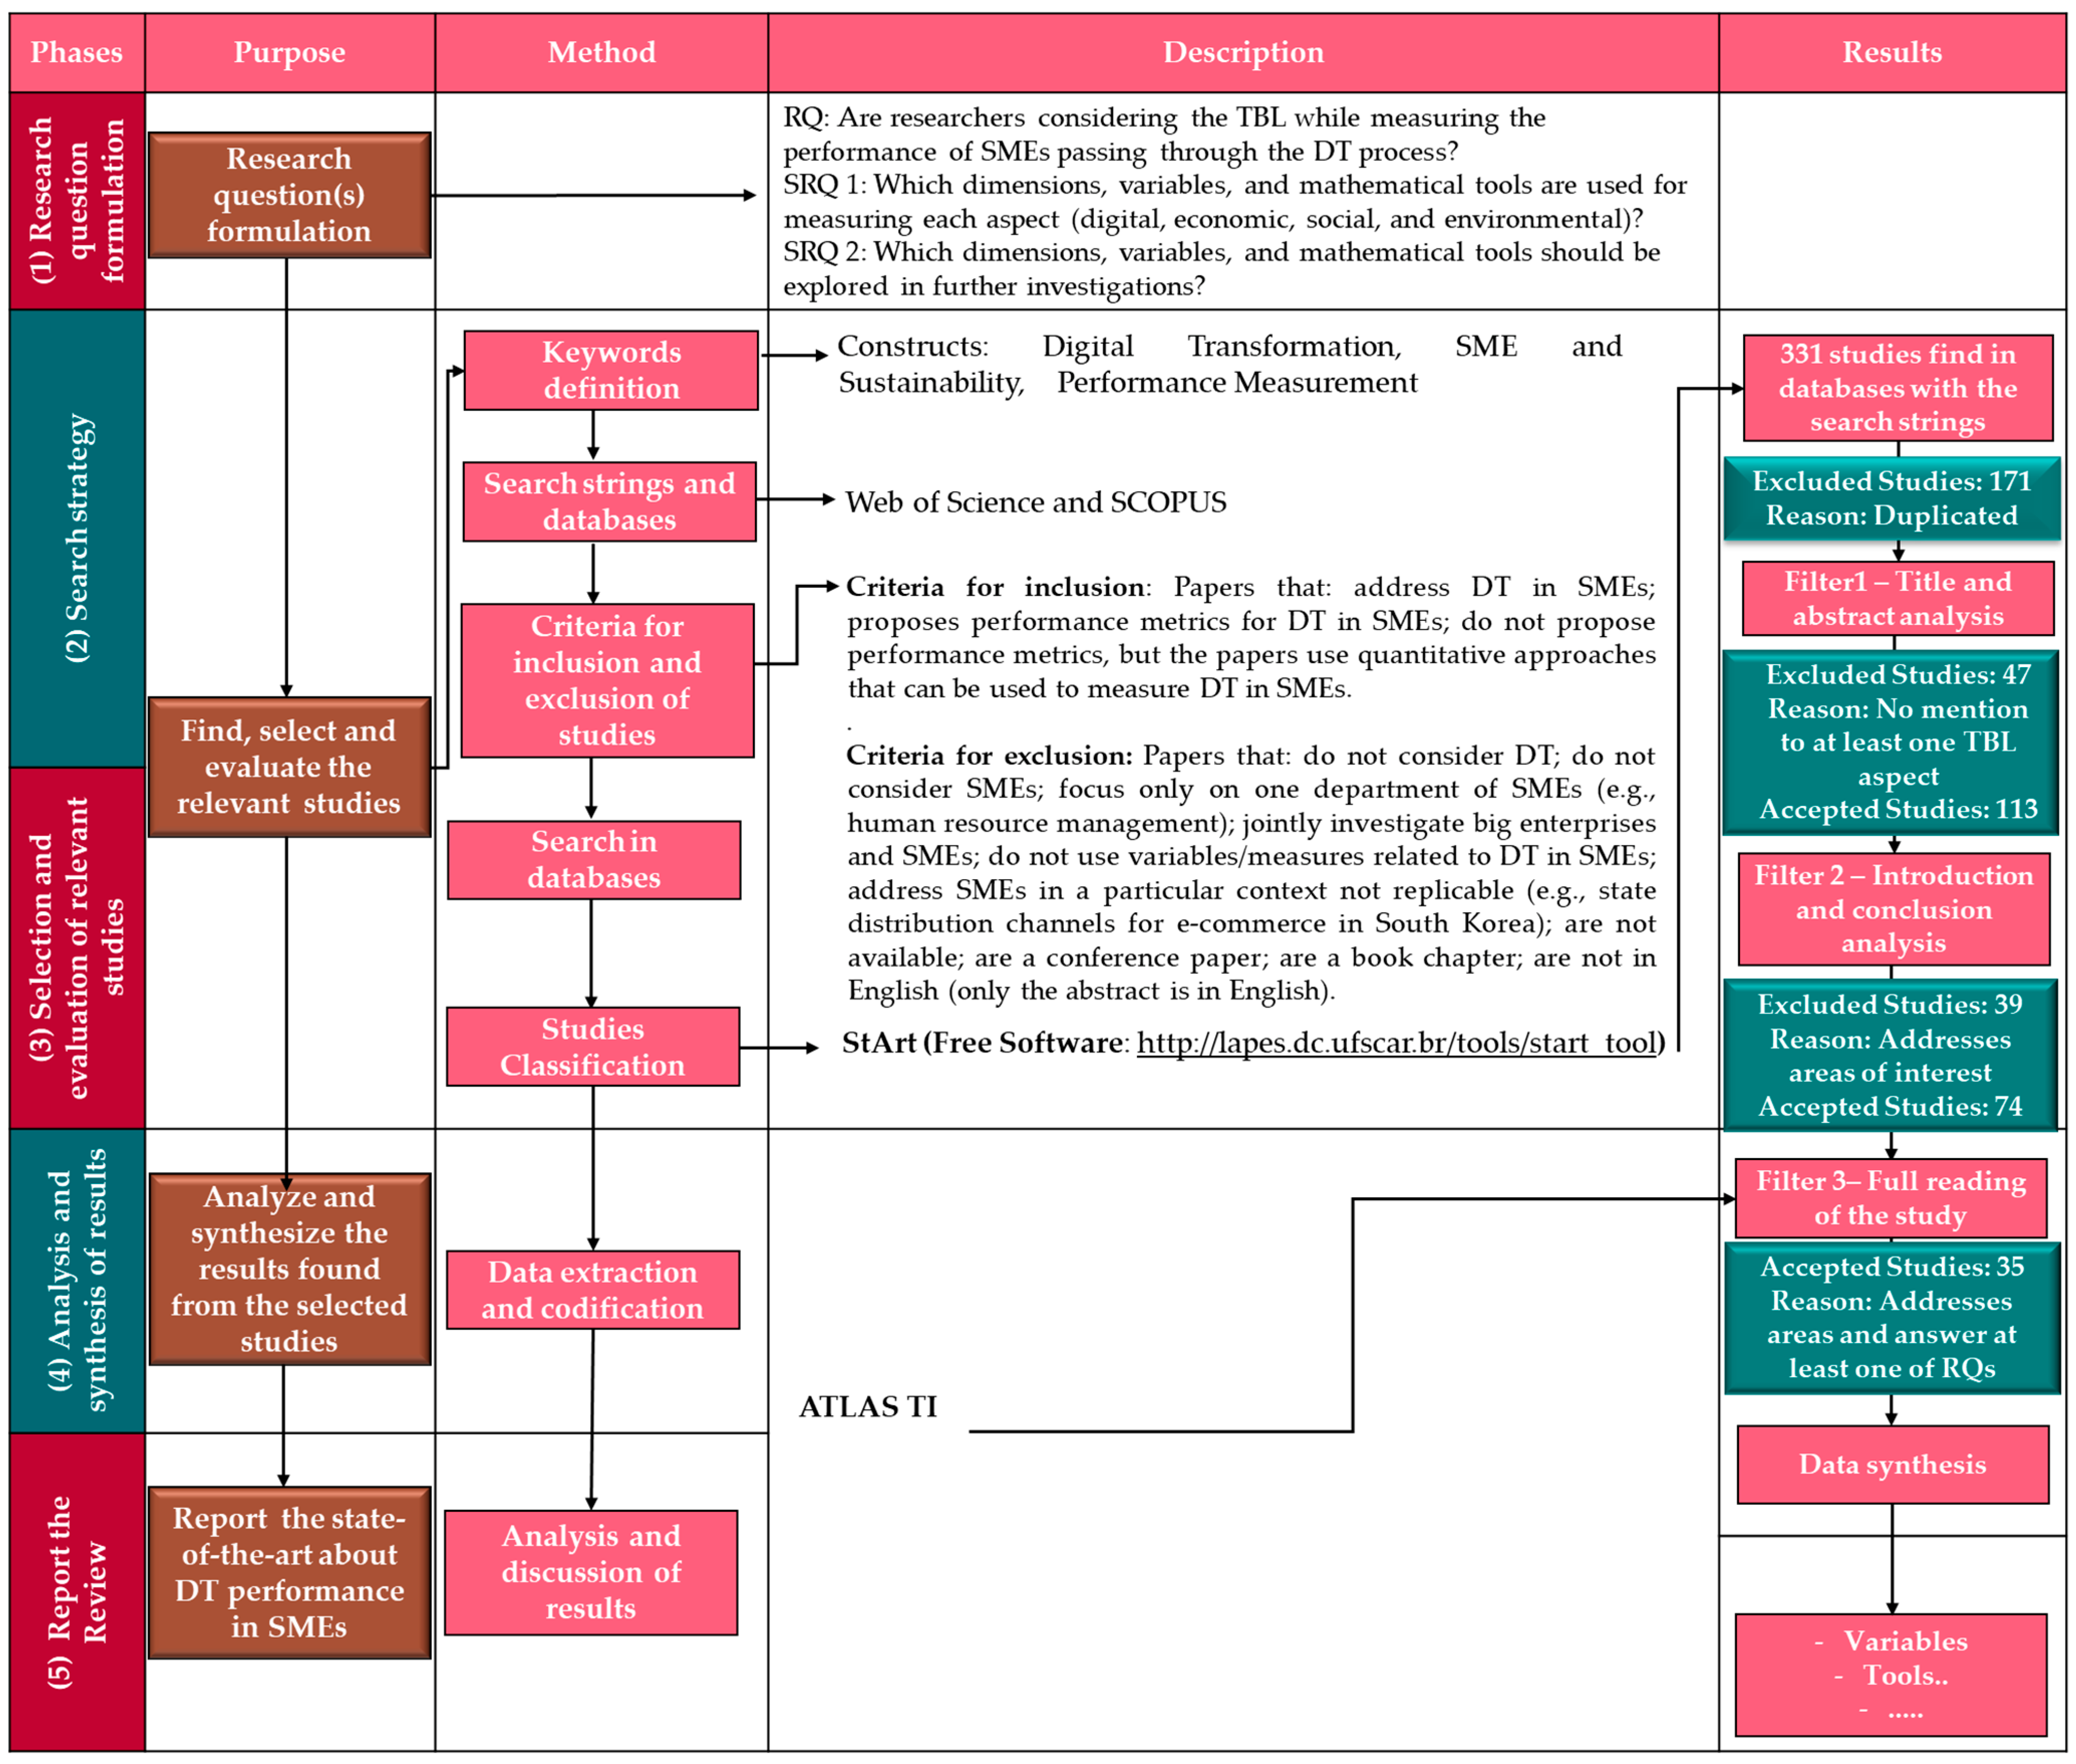
3.1. Manual SLR
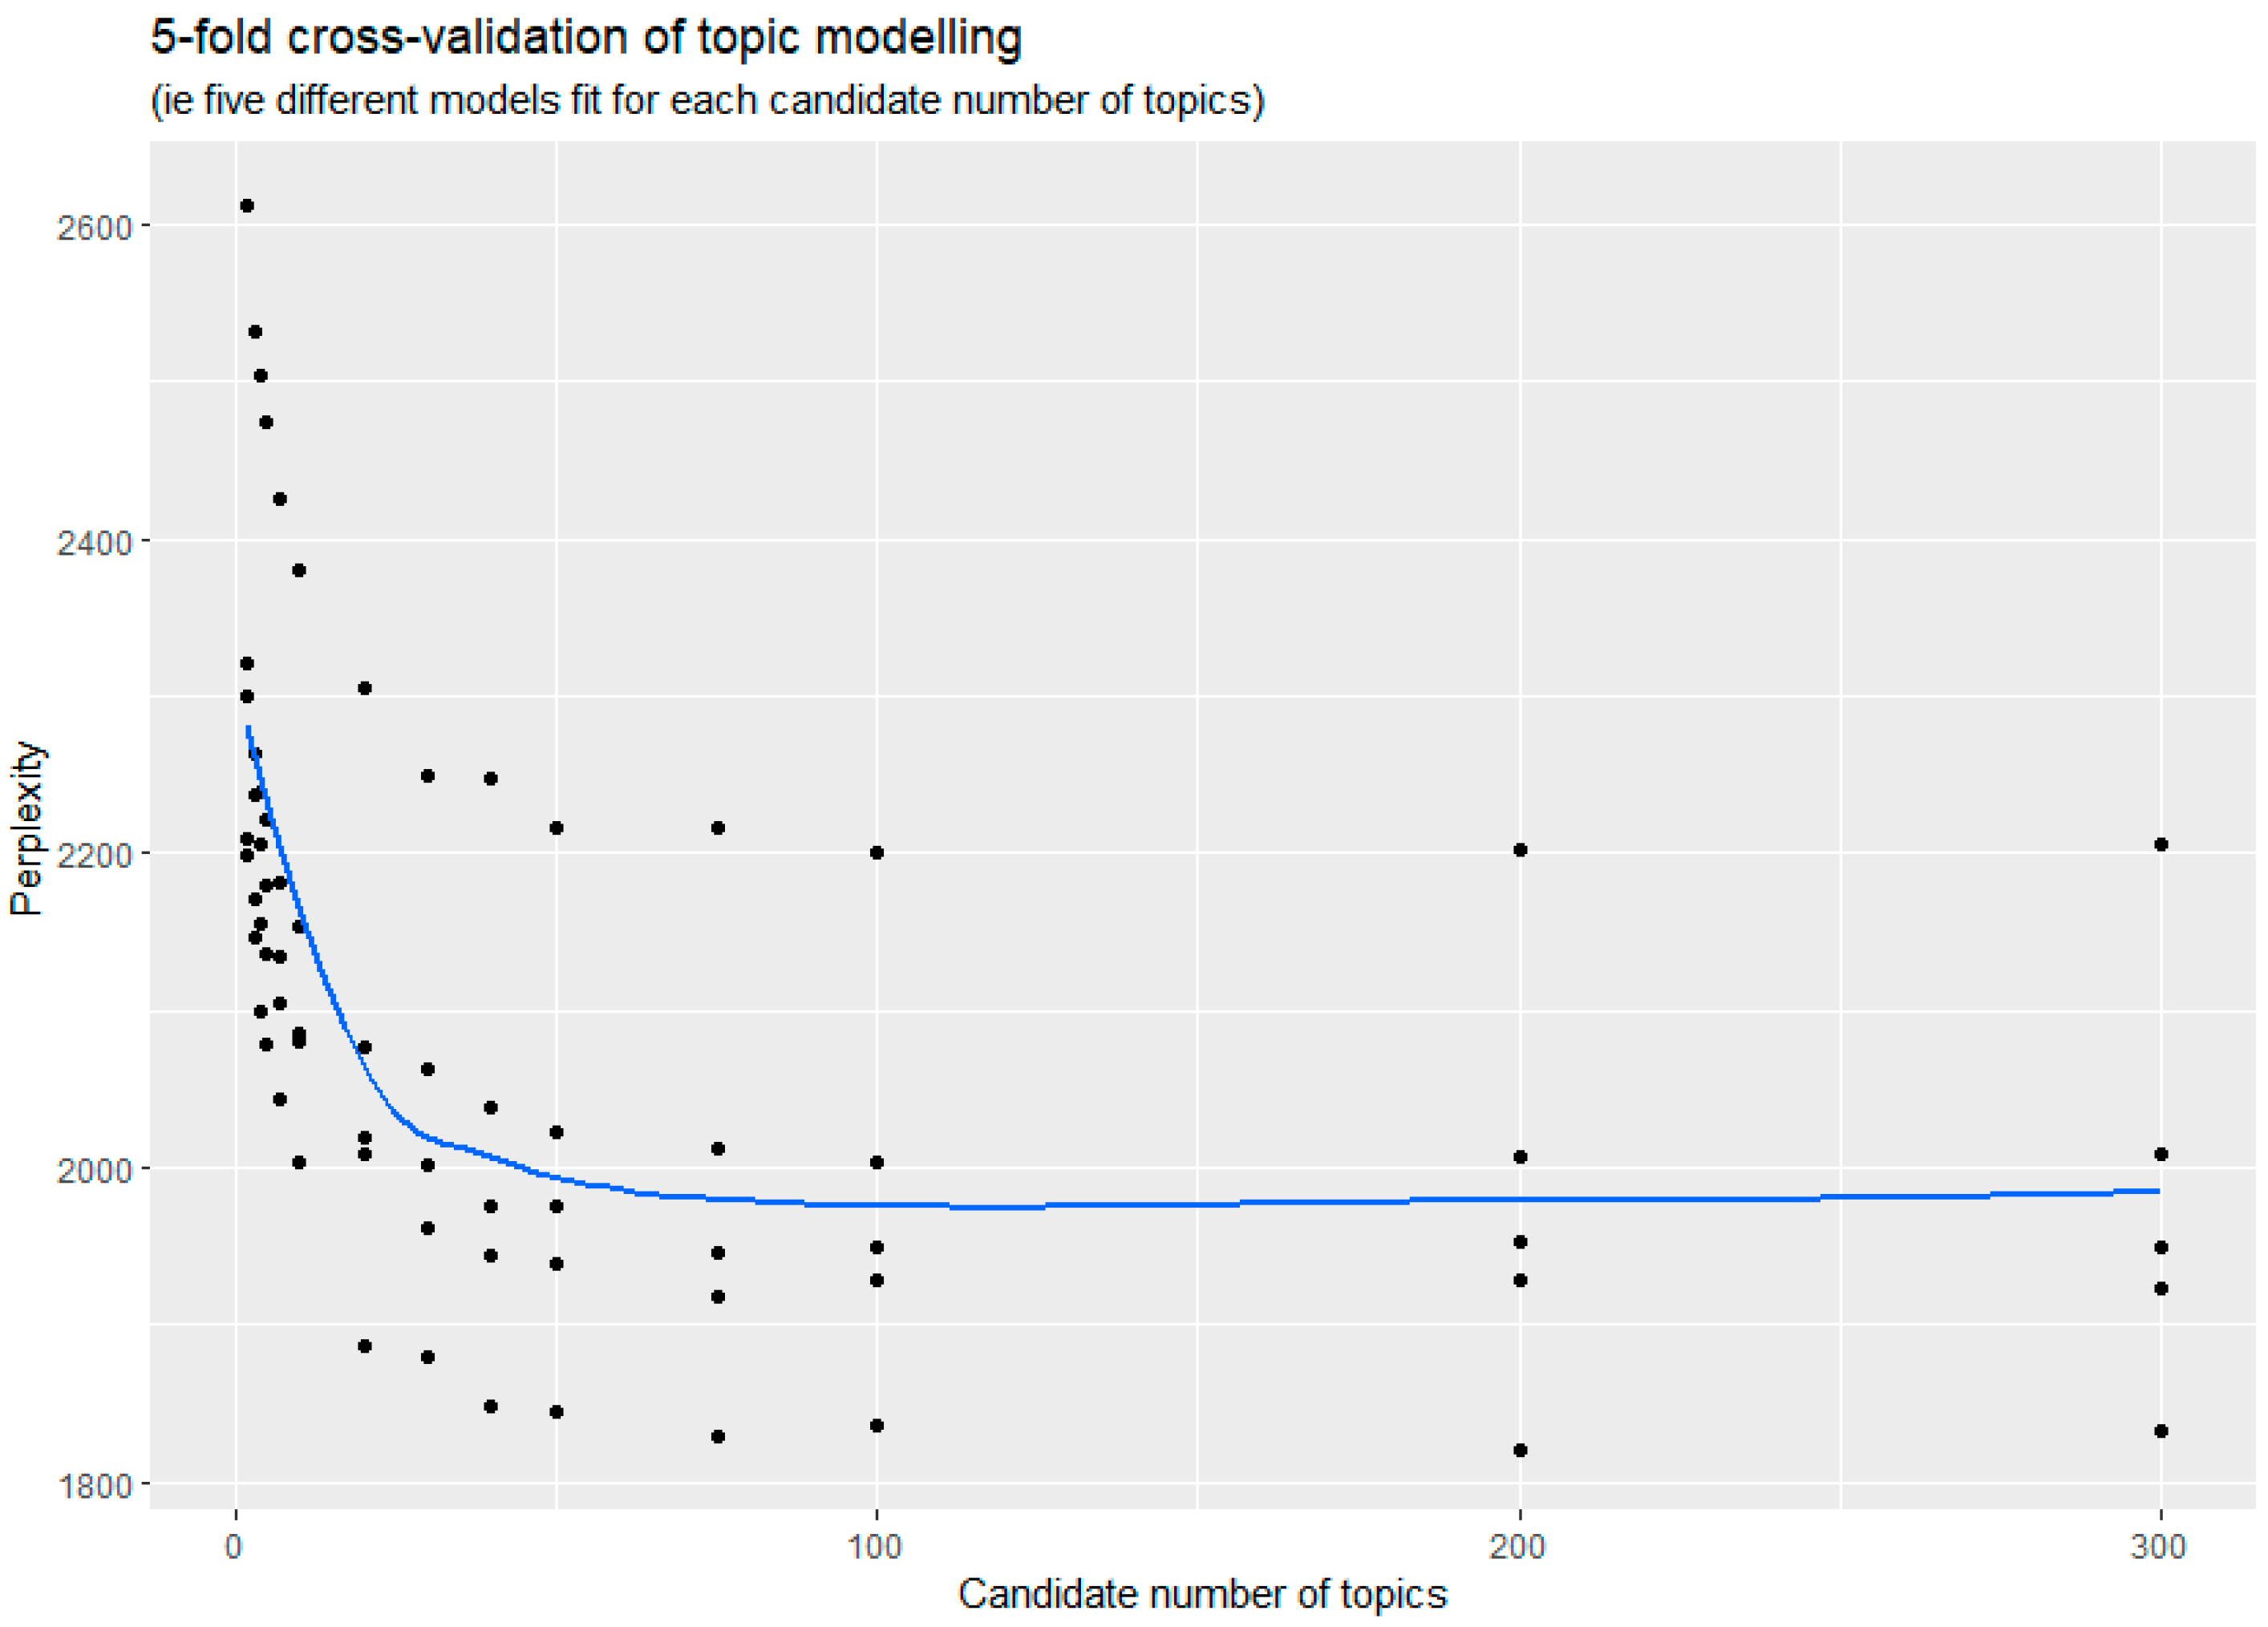
3.2. LDA-Based SLR
4. Manual SLR Results
4.1. Research Profiling
4.2. Data Collection Approaches

| Source | Variables |
|---|---|
| [61] | SME Size (Number of Employees), SME Age, Industry Sector, Private Ownership, Family Ownership |
| [63] | SME Age, SME Size (Number of Employees) |
| [9] | SME Size (Number of Employees), SME Age, Family Business, Company Group |
| [65] | SME Size (Number of Employees), Annual Revenues |
| [67] | SME Size (Number of Employees), Family Ownership, SME Age |
| [1] | SME Size (Number of Employees), Industry |
| [72] | EBIT to Sales, Sales, Operating Margin, Total Assets, Liabilities, SME Age, Manager’s Education, SME Size (Number of Employees), ROA, Manager’s Ownership, Gender |
| [71] | Business Model, SME Age, Ownership, Region, Listed/unlisted in Stock Market, Industry Sector |
| [77] | SME Size (Number of Employees), Ownership |
| [78] | SME Size (Number of Employees), SME Age |
| [86] | Business Field, SME Size (Number of Employees), Annual Sales |
| [8] | Industry Sector, Geographical Location, SME Size (Number of Employees) |
| [81] | Position of Respondent, Experience of Respondent, Marital Status of Respondent, Gender of Respondent, Age of Respondent, Income of Respondent |
| [85] | Determine the Primary Fashion Segment (Apparel/Footwear/Beauty/Accessories) of the Company, Age, Turnover and Headcount; Assess the Position of the Respondent Within the Fashion Organization (Department—Management Level) |
4.3. Methodological Approaches
4.4. Variables and Dimension
4.4.1. DT
- Platform Orientation [63], for understanding the competitiveness of SMEs in platforms. This dimension is associated with external operations.
- Portal Usefulness, Portal Interface, and Service-Orientation Portal Function [5], for understanding the effects of DT on SMEs’ performance. This is the oldest identified paper. The word “portal” can be understood as what was later named “platform”. These dimensions are associated with external activities.
- Organizational Resilience, Infrastructure System, Manufacturing System, Data Transformation, and Digital Technology [64], for defining readiness indicators for SMEs’ DT. The authors focused on the manufacturing industry; the adopted dimensions are associated with internal activities. Instead of “platform”, the authors used the words “system”, “technology”, and “data” for the use of internal platforms.
- System Integration [66], for understanding the DT priorities of Indian SMEs in the manufacturing sector. Again, the dimension is associated with internal activities, and the word used is “system”.
- Measurement System, Technology Management, Data Management, and Customer Experience [69], for understanding the DT priorities of Canadian SMEs in the manufacturing industry. Three dimensions are associated with internal activities and use the words “system”, “technology”, and “data”. The “Customer Experience” dimension is associated with external activities, and it is linked to the measure “customization”. There are no variables related to platforms for communicating with customers. The use of platforms is a general practice for SMEs in retailing but is not taken into consideration in the literature in the manufacturing industry.
- Overall Digitalization Degree, Digitalization Method, Digital Technology Adoption, Business Mode, and Long-term Crisis Responses [71], for investigating the response of the SMEs to the pandemic. These dimensions are associated with internal and external operations in a multi-industrial context.
- Fixed-line Broadband—Connectivity, Mobile Broadband—Connectivity, Online Presence, E-commerce—Online Presence, Online Activity, ICT Infrastructure, Advanced Technologies—ICT Infrastructure, Production Technologies—ICT Infrastructure, ICT Policy, and ICT Usage [76], for understanding the DT of fiber-based SME manufacturers in Europe. The dimensions are associated with internal and external activities as well as a strategy (ICT Policy). However, the dimensions associated with external activities are not associated with the use of a shared selling platform (common for retailing SMEs) but with the “Proprietary Website” and “B2B E-business Activity (Online Activity)”. Although common for SMEs in the manufacturing industry, these investments are unusual and unaffordable for the DT of SMEs in other industries (such as service and retailing).
- Sensing Digitally Enabled Growth Potentials, Seizing Digitally Enabled Growth Potentials, and Managing Resources for Digital Transformation [83], for understanding the maturity level of SMEs regarding DT.
- IT Perspectives [84], for measuring the effects of factors influencing the readiness of SMEs towards DT. This dimension is linked to the variable “Technical Infrastructure”, which may be associated with internal activities. As it is a multi-industrial perspective, the term “infrastructure” can represent investments in generally used technologies or advanced ones (usually prohibitive for SMEs in some industries).
4.4.2. Economic
- Organizational Performance—Balanced Score Card (BSC) [5], for understanding the effects of DT on SMEs’ performance based on BSC.
- Professional Competence, Operation Management, Critical Resources, Regulatory System, and Market Expansion [68], for establishing DT strategies for Med-Tech SMEs.
- Leadership and Culture and Organization [69], for understanding the DT priorities of Canadian SMEs in the manufacturing industry.
- Short-term Crisis Responses, Long-term Crisis Responses, and Performance [71], for investigating the response of the SMEs to the pandemic.
- Corporate Digital Responsibility [73], for building digital trust while implementing high-performance computing (HPC) in SMEs. The variable linked to this dimension is “Economic” and related to operations.
- R&D Infrastructure [77], for identifying and evaluating indicators of DT in SMEs and determining critical factors of DT.
- Managing Resources for DT [83], for understanding the maturity level of SMEs regarding DT.
- IT Perspectives and Economical Perspectives [84], for measuring the effects of factors influencing the readiness of SMEs towards DT.
4.4.3. Social
- Network Orientation [63], for understanding the competitiveness of SMEs in platforms.
- Operation Management and Critical Resources [68], for establishing DT strategies for Med-Tech SMEs.
- Culture and Organization [69], for understanding the DT priorities of Canadian SMEs in the manufacturing sector.
- Corporate Digital Responsibility and Digital Trust [73], for building digital trust while implementing high-performance computing (HPC) in SMEs.
- Human Resources and Employee Skills—Human Resources [76], for understanding DT of fiber-based SME manufacturers in Europe.
- Developing a Digitally Enabled Growth Strategy and Mindset and Managing Resources for Digital Transformation [83], to understand SMEs’ maturity level regarding DT.
- IT Perspectives [84], for measuring the effects of factors influencing the readiness of SMEs towards DT.
4.4.4. Environmental
- Environmental Orientation and Sustainability Market [61], for understanding the relationship between digital and environmental orientations to enhance innovation outcomes. Innovations are assumed to be mandatorily related to Digital Transformation.
- Environmental Sustainability Readiness [60], for investigating the impact of AI on the international performance of SMEs and investigating how the relationship between internationalization and DT affects sustainability.
- Environmental linked to the dimension of Corporate Digital Responsibility and Sustainability linked to the dimension of Digital Trust [73], for building digital trust while implementing high-performance computing (HPC) in SMEs.
- Sustainability Strategy [87], for understanding the role of sustainability in the relation between digital business strategy and financial performance.
5. LDA-Based SLR
5.1. Topic Modeling for Papers’ Initial Selection
5.2. Topic Modeling for Papers’ Filtering: The Onion Approach
6. Framework for Measuring SMEs’ Performance
7. Conclusions
Author Contributions
Funding
Conflicts of Interest
References
- Hassan, S.S.; Reuter, C.; Bzhalava, L. Perception or Capabilities? An Empirical Investigation of the Factors Influencing the Adoption of Social Media and Public Cloud in German SMEs. Int. J. Innov. Manag. 2021, 25, 2150002. [Google Scholar] [CrossRef]
- Grover, V.; Kohli, R. Revealing Your Hand: Caveats in Implementing Digital Business Strategy. MIS Q. 2013, 37, 655–662. [Google Scholar]
- Lyytinen, K.; Rose, G.M. The Disruptive Nature of Information Technology Innovations: The Case of Internet Computing in Systems Development Organizations. MIS Q. 2003, 27, 557. [Google Scholar] [CrossRef]
- World Bank. World Bank SME Finance: Development News, Research, Data|World Bank. Available online: https://www.worldbank.org/en/topic/smefinance (accessed on 8 January 2022).
- Chen, Y.-Y.K.; Jaw, Y.-L.; Wu, B.-L. Effect of Digital Transformation on Organisational Performance of SMEs. Internet Res. 2016, 26, 186–212. [Google Scholar] [CrossRef]
- González-Varona, J.; López-Paredes, A.; Poza, D.; Acebes, F. Building and Development of an Organizational Competence for Digital Transformation in SMEs. J. Ind. Eng. Manag. 2021, 14, 15. [Google Scholar] [CrossRef]
- Siegel, R.; Antony, J.; Garza-Reyes, J.A.; Cherrafi, A.; Lameijer, B. Integrated Green Lean Approach and Sustainability for SMEs: From Literature Review to a Conceptual Framework. J. Clean. Prod. 2019, 240, 118205. [Google Scholar] [CrossRef]
- Troise, C.; Corvello, V.; Ghobadian, A.; O’Regan, N. How Can SMEs Successfully Navigate VUCA Environment: The Role of Agility in the Digital Transformation Era. Technol. Forecast. Soc. Chang. 2022, 174, 121227. [Google Scholar] [CrossRef]
- Denicolai, S.; Zucchella, A.; Magnani, G. Internationalization, Digitalization, and Sustainability: Are SMEs Ready? A Survey on Synergies and Substituting Effects among Growth Paths. Technol. Forecast. Soc. Chang. 2021, 166, 120650. [Google Scholar] [CrossRef]
- Viale Pereira, G.; Estevez, E.; Cardona, D.; Chesñevar, C.; Collazzo-Yelpo, P.; Cunha, M.A.; Diniz, E.H.; Ferraresi, A.A.; Fischer, F.M.; Cardinelle Oliveira Garcia, F.; et al. South American Expert Roundtable: Increasing Adaptive Governance Capacity for Coping with Unintended Side Effects of Digital Transformation. Sustainability 2020, 12, 718. [Google Scholar] [CrossRef]
- Chatzistamoulou, N. Is Digital Transformation the Deus Ex Machina towards Sustainability Transition of the European SMEs? Ecol. Econ. 2023, 206, 107739. [Google Scholar] [CrossRef]
- Pfister, P.; Lehmann, C. Returns on Digitisation in SMEs—A Systematic Literature Review. J. Small Bus. Entrep. 2021, 1–25. [Google Scholar] [CrossRef]
- Asmussen, C.B.; Møller, C. Smart Literature Review: A Practical Topic Modelling Approach to Exploratory Literature Review. J. Big Data 2019, 6, 93. [Google Scholar] [CrossRef]
- Queiroz, G.A.; Alves Junior, P.N.; Costa Melo, I. Digitalization as an Enabler to SMEs Implementing Lean-Green? A Systematic Review through the Topic Modelling Approach. Sustainability 2022, 14, 14089. [Google Scholar] [CrossRef]
- Saha, B. Application of topic modelling for literature review in management research. In Interdisciplinary Research in Technology and Management; CRC Press: Boca Raton, FL, USA, 2021; pp. 1–8. ISBN 9781003202240. [Google Scholar]
- Quinn, K.M.; Monroe, B.L.; Colaresi, M.; Crespin, M.H.; Radev, D.R. How to Analyze Political Attention with Minimal Assumptions and Costs. Am. J. Pol. Sci. 2010, 54, 209–228. [Google Scholar] [CrossRef]
- U.S. Small Business Administration (SBA) SBA Table of Size Standards. 2017. Available online: https://www.sba.gov/sites/default/files/2019-08/SBA%20Table%20of%20Size%20Standards_Effective%20Aug%2019%2C%202019_Rev.pdf (accessed on 8 January 2022).
- OECD Brazil|Financing SMEs and Entrepreneurs 2020: An OECD Scoreboard|OECD iLibrary. Available online: https://www.oecd-ilibrary.org/sites/8153da8d-en/index.html?itemId=/content/component/8153da8d-en (accessed on 4 April 2022).
- Library of Chilean Congress. Biblioteca del Congreso Chileno] Estatuto de Las PYMES—Ley Fácil—Biblioteca Del Congreso Nacional de Chile. Available online: https://www.bcn.cl/leyfacil/recurso/estatuto-de-las-pymes (accessed on 6 January 2022).
- Alves Junior, P.N.; Costa Melo, I.; Yamanaka, L.; Severino, M.R.; Rentizelas, A. Supporting the Bidding Decisions of Smallholder Farmers in Public Calls in Brazil. Agriculture 2021, 12, 48. [Google Scholar] [CrossRef]
- Government of Japan Small and Medium Enterprise Agency. Available online: https://www.chusho.meti.go.jp/sme_english/outline/07/01.html (accessed on 8 January 2022).
- World Trade Organization Levelling the Trading Field for SMEs. 2017. Available online: https://www.wto.org/english/news_e/spra_e/spra135_e.htm (accessed on 8 January 2022).
- Kim, S.-S. Sustainable Growth Variables by Industry Sectors and Their Influence on Changes in Business Models of SMEs in the Era of Digital Transformation. Sustainability 2021, 13, 7114. [Google Scholar] [CrossRef]
- Lu, J.W.; Beamish, P.W. The Internationalization and Performance of SMEs. Strateg. Manag. J. 2001, 22, 565–586. [Google Scholar] [CrossRef]
- Dosi, G.; Lechevalier, S.; Secchi, A. Introduction: Interfirm Heterogeneity--Nature, Sources and Consequences for Industrial Dynamics. Ind. Corp. Chang. 2010, 19, 1867–1890. [Google Scholar] [CrossRef]
- Marinho, B.F.D.; Costa Melo, I. Fostering Innovative SMEs in a Developing Country: The ALI Program Experience. Sustainability 2022, 2, 13344. [Google Scholar] [CrossRef]
- Gong, C.; Ribiere, V. Developing a Unified Definition of Digital Transformation. Technovation 2021, 102, 102217. [Google Scholar] [CrossRef]
- Verhoef, P.C.; Broekhuizen, T.; Bart, Y.; Bhattacharya, A.; Qi Dong, J.; Fabian, N.; Haenlein, M. Digital Transformation: A Multidisciplinary Reflection and Research Agenda. J. Bus. Res. 2021, 122, 889–901. [Google Scholar] [CrossRef]
- Culot, G.; Nassimbeni, G.; Orzes, G.; Sartor, M. Behind the Definition of Industry 4.0: Analysis and Open Questions. Int. J. Prod. Econ. 2020, 226, 107617. [Google Scholar] [CrossRef]
- Sassanelli, C.; Rossi, M.; Terzi, S. Evaluating the Smart Maturity of Manufacturing Companies along the Product Development Process to Set a PLM Project Roadmap. Int. J. Prod. Lifecycle Manag. 2020, 12, 185. [Google Scholar] [CrossRef]
- Costa Melo, I.; Queiroz, G.A.; Alves Junior, P.N.; de Sousa, T.B.; Yushimito, W.; Pereira, J. Sustainable Digital Transformation in Small and Medium Enterprises (SMEs): A Review on Performance. Heliyon 2020, 9, e13908. [Google Scholar] [CrossRef]
- OECD. Entrepreneurship at a Glance 2011; OECD: Paris, France, 2011; ISBN 9789264095762. [Google Scholar]
- OECD. Entrepreneurship at a Glance 2017; OECD: Paris, France, 2017; ISBN 9789264279926. [Google Scholar]
- Elkington, J. Towards the Sustainable Corporation: Win-Win-Win Business Strategies for Sustainable Development. Calif. Manag. Rev. 1994, 36, 90–100. [Google Scholar] [CrossRef]
- Elkington, J. Accounting for the triple bottom line. Meas. Bus. Excell. 1998, 2, 18–22. [Google Scholar] [CrossRef]
- Helleno, A.L.; de Moraes, A.J.I.; Simon, A.T. Integrating Sustainability Indicators and Lean Manufacturing to Assess Manufacturing Processes: Application Case Studies in Brazilian Industry. J. Clean. Prod. 2017, 153, 405–416. [Google Scholar] [CrossRef]
- Slaper, T.F.; Hall, T.J. The Triple Bottom Line: What Is It and How Does It Work? Indiana Bus. Res. Cent. 2011, 86, 4–8. [Google Scholar]
- Santos, J.; Muñoz-Villamizar, A.; Ormazábal, M.; Viles, E. Using Problem-Oriented Monitoring to Simultaneously Improve Productivity and Environmental Performance in Manufacturing Companies. Int. J. Comput. Integr. Manuf. 2019, 32, 183–193. [Google Scholar] [CrossRef]
- Ellen MacArthour Foundation. What Is Circular Economy? Available online: https://ellenmacarthurfoundation.org/topics/circular-economy-introduction/overview (accessed on 16 February 2023).
- Acerbi, F.; Sassanelli, C.; Taisch, M. A Conceptual Data Model Promoting Data-Driven Circular Manufacturing. Oper. Manag. Res. 2022, 15, 838–857. [Google Scholar] [CrossRef]
- Acerbi, F.; Sassanelli, C.; Terzi, S.; Taisch, M. A Systematic Literature Review on Data and Information Required for Circular Manufacturing Strategies Adoption. Sustainability 2021, 13, 2047. [Google Scholar] [CrossRef]
- Taddei, E.; Sassanelli, C.; Rosa, P.; Terzi, S. Circular Supply Chains in the Era of Industry 4.0: A Systematic Literature Review. Comput. Ind. Eng. 2022, 170, 108268. [Google Scholar] [CrossRef]
- Walker, A.M.; Vermeulen, W.J.V.; Simboli, A.; Raggi, A. Sustainability Assessment in Circular Inter-Firm Networks: An Integrated Framework of Industrial Ecology and Circular Supply Chain Management Approaches. J. Clean. Prod. 2021, 286, 125457. [Google Scholar] [CrossRef]
- Ranjbari, M.; Shams Esfandabadi, Z.; Zanetti, M.C.; Scagnelli, S.D.; Siebers, P.-O.; Aghbashlo, M.; Peng, W.; Quatraro, F.; Tabatabaei, M. Three Pillars of Sustainability in the Wake of COVID-19: A Systematic Review and Future Research Agenda for Sustainable Development. J. Clean. Prod. 2021, 297, 126660. [Google Scholar] [CrossRef]
- Rodrigues, M.; Franco, M.; Sousa, N.; Silva, R. COVID 19 and the Business Management Crisis: An Empirical Study in SMEs. Sustainability 2021, 13, 5912. [Google Scholar] [CrossRef]
- Lopez-Nicolas, C.; Nikou, S.; Molina-Castillo, F.-J.; Bouwman, H. Gender Differences and Business Model Experimentation in European SMEs. J. Bus. Ind. Mark. 2020, 35, 1205–1219. [Google Scholar] [CrossRef]
- Tranfield, D.; Denyer, D.; Smart, P. Towards a Methodology for Developing Evidence-Informed Management Knowledge by Means of Systematic Review. Br. J. Manag. 2003, 14, 207–222. [Google Scholar] [CrossRef]
- Moher, D.; Liberati, A.; Tetzlaff, J.; Altman, D.G. Preferred Reporting Items for Systematic Reviews and Meta-Analyses: The PRISMA Statement. PLoS Med. 2009, 6, e1000097. [Google Scholar] [CrossRef]
- Chadegani, A.A.; Salehi, H.; Yunus, M.M.; Farhadi, H.; Fooladi, M.; Farhadi, M.; Ebrahim, N.A. A Comparison between Two Main Academic Literature Collections: Web of Science and Scopus Databases. Asian Soc. Sci. 2013, 9. [Google Scholar] [CrossRef]
- Barnes, S.; Rutter, R.N.; la Paz, A.I.; Scornavacca, E. Empirical Identification of Skills Gaps between Chief Information Officer Supply and Demand: A Resource-Based View Using Machine Learning. Ind. Manag. Data Syst. 2021, 121, 1749–1766. [Google Scholar] [CrossRef]
- Krippendorff, K. Content Analysis: An Introduction to Its Methodology, 2nd ed.; Sage Publications: Thousand Oaks, CA, USA, 2004; Volume 13. [Google Scholar]
- van Dinter, R.; Tekinerdogan, B.; Catal, C. Automation of Systematic Literature Reviews: A Systematic Literature Review. Inf. Softw. Technol. 2021, 136, 106589. [Google Scholar] [CrossRef]
- Lancichinetti, A.; Sirer, M.I.; Wang, J.X.; Acuna, D.; Körding, K.; Amaral, L.A.N. High-Reproducibility and High-Accuracy Method for Automated Topic Classification. Phys. Rev. X 2015, 5, 011007. [Google Scholar] [CrossRef]
- Saura, J.R.; Ribeiro-Soriano, D.; Zegarra Saldaña, P. Exploring the Challenges of Remote Work on Twitter Users’ Sentiments: From Digital Technology Development to a Post-Pandemic Era. J. Bus. Res. 2022, 142, 242–254. [Google Scholar] [CrossRef]
- Gupta, A.; Li, H.; Farnoush, A.; Jiang, W. Understanding Patterns of COVID Infodemic: A Systematic and Pragmatic Approach to Curb Fake News. J. Bus. Res. 2022, 140, 670–683. [Google Scholar] [CrossRef]
- van Nguyen, T.; Cong Pham, H.; Nhat Nguyen, M.; Zhou, L.; Akbari, M. Data-Driven Review of Blockchain Applications in Supply Chain Management: Key Research Themes and Future Directions. Int. J. Prod. Res. 2023, 1–23. [Google Scholar] [CrossRef]
- Olorisade, B.K.; de Quincey, E.; Brereton, P.; Andras, P. A Critical Analysis of Studies That Address the Use of Text Mining for Citation Screening in Systematic Reviews. In Proceedings of the 20th International Conference on Evaluation and Assessment in Software Engineering, Klagenfurt am Wörthersee, Austria, 1–3 June 2016; pp. 1–11. [Google Scholar]
- AlMujaini, H.; Hilmi, M.F.; Abudaqa, A.; Alzahmi, R. Corporate Foresight Organizational Learning and Performance: The Moderating Role of Digital Transformation and Mediating Role of Innovativeness in SMEs. Int. J. Data Netw. Sci. 2021, 5, 703–712. [Google Scholar] [CrossRef]
- AlMulhim, A.F. Smart Supply Chain and Firm Performance: The Role of Digital Technologies. Bus. Process Manag. J. 2021, 27, 1353–1372. [Google Scholar] [CrossRef]
- Apostolov, M.; Coco, N. Digitalization-Based Innovation—A Case Study Framework. Int. J. Innov. Technol. Manag. 2021, 18, 2050025. [Google Scholar] [CrossRef]
- Ardito, L.; Raby, S.; Albino, V.; Bertoldi, B. The Duality of Digital and Environmental Orientations in the Context of SMEs: Implications for Innovation Performance. J. Bus. Res. 2021, 123, 44–56. [Google Scholar] [CrossRef]
- Bouwman, H.; Nikou, S.; de Reuver, M. Digitalization, Business Models, and SMEs: How Do Business Model Innovation Practices Improve Performance of Digitalizing SMEs? Telecomm. Policy 2019, 43, 101828. [Google Scholar] [CrossRef]
- Cenamor, J.; Parida, V.; Wincent, J. How Entrepreneurial SMEs Compete through Digital Platforms: The Roles of Digital Platform Capability, Network Capability and Ambidexterity. J. Bus. Res. 2019, 100, 196–206. [Google Scholar] [CrossRef]
- Chonsawat, N.; Sopadang, A. Defining SMEs’ 4.0 Readiness Indicators. Appl. Sci. 2020, 10, 8998. [Google Scholar] [CrossRef]
- Dutot, V.; Bergeron, F.; Calabrò, A. The Impact of Family Harmony on Family SMEs’ Performance: The Mediating Role of Information Technologies. J. Fam. Bus. Manag. 2021, 12, 1131–1151. [Google Scholar] [CrossRef]
- Dutta, G.; Kumar, R.; Sindhwani, R.; Singh, R.K. Digital Transformation Priorities of India’s Discrete Manufacturing SMEs—A Conceptual Study in Perspective of Industry 4.0. Compet. Rev. Int. Bus. J. 2020, 30, 289–314. [Google Scholar] [CrossRef]
- Eller, R.; Alford, P.; Kallmünzer, A.; Peters, M. Antecedents, Consequences, and Challenges of Small and Medium-Sized Enterprise Digitalization. J. Bus. Res. 2020, 112, 119–127. [Google Scholar] [CrossRef]
- Fang, I.-C.; Chen, P.-T.; Chiu, H.-H.; Lin, C.-L.; Su, F.-C. Establishing the Digital Transformation Strategies for the Med-Tech Enterprises Based on the AIA-NRM Approach. Appl. Sci. 2020, 10, 7574. [Google Scholar] [CrossRef]
- Gamache, S.; Abdul-Nour, G.; Baril, C. Evaluation of the Influence Parameters of Industry 4.0 and Their Impact on the Quebec Manufacturing SMEs: The First Findings. Cogent Eng. 2020, 7, 1771818. [Google Scholar] [CrossRef]
- Gruenbichler, R.; Klucka, J.; Haviernikova, K.; Strelcova, S. Business Performance Management in Small and Medium-Sized Enterprises in the Slovak Republic: An Integrated Three-Phase-Framework for Implementation. J. Compet. 2021, 13, 42–58. [Google Scholar] [CrossRef]
- Guo, H.; Yang, Z.; Huang, R.; Guo, A. The Digitalization and Public Crisis Responses of Small and Medium Enterprises: Implications from a COVID-19 Survey. Front. Bus. Res. China 2020, 14, 19. [Google Scholar] [CrossRef]
- Holopainen, R.; Niskanen, M.; Rissanen, S. The Impact of Internet and Innovation on the Profitability of Private Healthcare Companies. J. Small Bus. Entrep. 2020, 1–25. [Google Scholar] [CrossRef]
- Jelovac, D.; Ljubojević, Č.; Ljubojević, L. HPC in Business: The Impact of Corporate Digital Responsibility on Building Digital Trust and Responsible Corporate Digital Governance. Digit. Policy Regul. Gov. 2021, 24, 485–497. [Google Scholar] [CrossRef]
- Joensuu-Salo, S.; Sorama, K.; Viljamaa, A.; Varamäki, E. Firm Performance among Internationalized SMEs: The Interplay of Market Orientation, Marketing Capability and Digitalization. Adm. Sci. 2018, 8, 31. [Google Scholar] [CrossRef]
- Jun, W.; Nasir, M.H.; Yousaf, Z.; Khattak, A.; Yasir, M.; Javed, A.; Shirazi, S.H. Innovation Performance in Digital Economy: Does Digital Platform Capability, Improvisation Capability and Organizational Readiness Really Matter? Eur. J. Innov. Manag. 2021, in press. [Google Scholar] [CrossRef]
- Kamišalić, A.; Šestak, M.; Beranič, T. Supporting the Sustainability of Natural Fiber-Based Value Chains of SMEs through Digitalization. Sustainability 2020, 12, 8121. [Google Scholar] [CrossRef]
- Kmecová, I.; Stuchlý, J.; Sagapova, N.; Tlustý, M. SME Human Resources Management Digitization: Evaluation of the Level of Digitization and Estimation of Future Developments. Pol. J. Manag. Stud. 2021, 23, 232–248. [Google Scholar] [CrossRef]
- Kulathunga, K.M.M.C.B.; Ye, J.; Sharma, S.; Weerathunga, P.R. How Does Technological and Financial Literacy Influence SME Performance: Mediating Role of ERM Practices. Information 2020, 11, 297. [Google Scholar] [CrossRef]
- Kumar, R.; Sindhwani, R.; Singh, P.L. IIoT Implementation Challenges: Analysis and Mitigation by Blockchain. J. Glob. Oper. Strateg. Sourc. 2021. [Google Scholar] [CrossRef]
- Lányi, B.; Hornyák, M.; Kruzslicz, F. The Effect of Online Activity on SMEs’ Competitiveness. Compet. Rev. Int. Bus. J. 2021, 31, 477–496. [Google Scholar] [CrossRef]
- Mubarak, M.F.; Shaikh, F.A.; Mubarik, M.; Samo, K.A.; Mastoi, S. The Impact of Digital Transformation on Business Performance: A Study of Pakistani SMEs. Eng. Technol. Appl. Sci. Res. 2019, 9, 5056–5061. [Google Scholar] [CrossRef]
- Nasiri, M.; Ukko, J.; Saunila, M.; Rantala, T. Managing the Digital Supply Chain: The Role of Smart Technologies. Technovation 2020, 96, 102121. [Google Scholar] [CrossRef]
- North, K.; Aramburu, N.; Lorenzo, O.J. Promoting Digitally Enabled Growth in SMEs: A Framework Proposal. J. Enterp. Inf. Manag. 2019, 33, 238–262. [Google Scholar] [CrossRef]
- Okfalisa, O.; Anggraini, W.; Nawanir, G.; Saktioto, S.; Wong, K.Y. Measuring the Effects of Different Factors Influencing on the Readiness of SMEs towards Digitalization: A Multiple Perspectives Design of Decision Support System. Decis. Sci. Lett. 2021, 10, 425–442. [Google Scholar] [CrossRef]
- Ponis, S.T.; Lada, C. Digital Transformation in the Greek Fashion Industry: A Survey. Int. J. Fash. Des. Technol. Educ. 2021, 14, 162–172. [Google Scholar] [CrossRef]
- Rozak, H.; Adhiatma, A.; Fachrunnisa, O.; Rahayu, T. Social Media Engagement, Organizational Agility and Digitalization Strategic Plan to Improve SMEs’ Performance. IEEE Trans. Eng. Manag. 2021, 1–10. [Google Scholar] [CrossRef]
- Ukko, J.; Nasiri, M.; Saunila, M.; Rantala, T. Sustainability Strategy as a Moderator in the Relationship between Digital Business Strategy and Financial Performance. J. Clean. Prod. 2019, 236, 117626. [Google Scholar] [CrossRef]
- Bluhm, D.J.; Harman, W.; Lee, T.W.; Mitchell, T.R. Qualitative Research in Management: A Decade of Progress. J. Manag. Stud. 2011, 48, 1866–1891. [Google Scholar] [CrossRef]
- Bryman, A. Barriers to Integrating Quantitative and Qualitative Research. J. Mix. Methods Res. 2007, 1, 8–22. [Google Scholar] [CrossRef]
- Hussey, D.M.; Eagan, P.D. Using Structural Equation Modeling to Test Environmental Performance in Small and Medium-Sized Manufacturers: Can SEM Help SMEs? J. Clean. Prod. 2007, 15, 303–312. [Google Scholar] [CrossRef]


| Author/Year | DT | Econ. | Soc. | Env. | Methodological Approach | Data Collection |
|---|---|---|---|---|---|---|
| AlMujaini et al. (2021) [58] | X | X | X | Two-step approach: Structural Equation Modelling (SEM) and Interviews | Survey, 354 respondents (owners or managers of SMEs) | |
| AlMulhim (2021) [59] | X | X | Partial Least Square Structural Equation Modelling (PLS-SEM) | Survey, 460 respondents (of 150 SMEs) | ||
| Apostolov and Coco (2021) [60] | X | X | X | X | Case Studies | Visits and interviews (8 SMEs) |
| Ardito et al. (2021) [61] | X | X | X | X | Tobit regression | Survey, 369 respondents |
| Bouwman et al. (2019) [62] | X | X | Partial Least Square Structural Equation Modelling (PLS-SEM) and fuzzy-set Qualitative Comparative Analysis (fsQCA) | Survey, 321 respondents | ||
| Cenamor et al. (2019) [63] | X | X | X | Partial Least Square Structural Equation Modelling (PLS-SEM) | Survey, 129 respondents | |
| Chen et al. (2016) [5] | X | X | Hierarchical Regression | In-depth interviews (8 SMEs) and survey, 46 respondents (owners or high executives of SMEs) | ||
| Chonsawat and Sopadang (2020) [64] | X | Literature Review and Case Studies | Secondary data and qualitative primary data | |||
| Denicolai et al. (2021) [9] | X | X | X | Tobit Regression | Survey, balanced sample of 438 respondents (one respondent per SME) | |
| Dutot et al. (2021) [65] | X | X | X | Partial Least Square Structural Equation Modelling (PLS-SEM) | Survey, 197 respondents | |
| Dutta et al. (2020) [66] | X | Literature Review and Maturity Model Assessment (descriptive statistics) | Secondary data and survey of 250 SMEs | |||
| Eller et al. (2020) [67] | X | X | X | Hierarchical Regression | Survey, 193 respondents | |
| Fang et al. (2020) [68] | X | X | X | Acquisition–Importance Analysis (AIA) and Network Relation Map (NRM) based on Decision-Making Trial and Evaluation Laboratory (DEMATEL) Technique | Interviews with 18 experts | |
| Gamache et al. (2020) [69] | X | X | X | Literature Review and Case Studies | Secondary data and two loops of interviews (15 SMEs and 21 SMEs) | |
| Gruenbichler et al. (2021) [70] | X | X | X | Descriptive Statistics and Case Studies | Survey (123 respondents) and interviews | |
| Guo et al. (2020) [71] | X | X | X | Multilinear Regression | Survey, 518 respondents (one respondent per SME) | |
| Hassan et al. (2021) [1] | X | X | X | Bivariate Probit Regression | Secondary data, 2404 SMEs | |
| Holopainen et al. (2020) [72] | X | X | X | Multilinear Regression | Survey, 668 respondents (one respondent per SME) | |
| Jelovac et al. (2021) [73] | X | X | X | X | Critical Review | Secondary data |
| Joensuu-Salo et al. (2018) [74] | X | X | Linear Regression | Survey, 101 respondents (one respondent per SME) | ||
| Jun et al. (2021) [75] | X | X | Correlation, Multilinear regressions, and Structural Equation Modeling (SEM) | Survey, 647 respondents (managers of SMEs) | ||
| Kamišalić et al. (2020) [76] | X | X | X | Literature Review and Case Studies | Secondary data | |
| Kmecová et al. (2021) [77] | X | X | X | Linear Regression | Survey, 610 respondents | |
| Kulathunga et al. (2020) [78] | X | X | Structural Equation Modelling (SEM) | Survey, 319 respondents (chief financial officers of SMEs) | ||
| Kumar et al. (2021) [79] | X | X | Literature Review, Decision-Making Trial and Evaluation Laboratory (DEMATEL) | Secondary data, experts’ opinions (50 experts at the first round and 35 experts at the second round) | ||
| Lányi et al. (2021) [80] | X | Analysis of Variance (ANOVA) | Content analysis of websites of 958 SMEs | |||
| Mubarak et al. (2019) [81] | X | X | Linear Regression | Survey, 237 respondents | ||
| Nasiri et al. (2020) [82] | X | X | Structural Equation Modelling (SEM) | Survey, 280 respondents (one respondent per SME) | ||
| North et al. (2019) [83] | X | X | X | Literature Review and Case Studies | Visits and interviews (52 SMEs) | |
| Okfalisa et al. (2021) [84] | X | X | X | Fuzzy Analytical Hierarchy Process (F-AHP) method | Experts’ opinions | |
| Ponis and Lada (2021) [85] | X | X | Descriptive Statistics | Survey, 60 respondents | ||
| Rozak et al. (2021) [86] | X | X | X | Partial Least Square Structural Equation Modelling (PLS-SEM) | Survey, 239 respondents | |
| Troise et al. (2022) [8] | X | X | X | Partial Least Square Structural Equation Modelling (PLS-SEM) | Survey, 204 respondents | |
| Ukko et al. (2019) [87] | X | X | X | X | Analysis of Variance (ANOVA) and Multilinear Regression | Survey, 280 respondents (one respondent per SME) |
| Viale Pereira et al. (2020) [10] | X | X | X | Cluster Analysis | Experts’ opinion |
| Source | Variables | Dimensions |
|---|---|---|
| [58] | Digital Transformation | - |
| [59] | Digital Transformation, Smart Technologies | - |
| [61] | Digital Orientation | - |
| [62] | Resources for Business Model Experimentation, Business Model Strategy Implementation Practices, Business Model Experimentation Practices | - |
| [63] | Platform Integration, Platform Reconfiguration | Platform Orientation |
| [5] | Portal Training, Portal Usage | Portal Usefulness |
| Operational Friendliness, Industry Benchmark InformationBilingual Information | Portal Interface | |
| Portal Maintenance Service, B2B Function, Cloud Computing | Service-Orientation Portal Function | |
| [64] | Business Model, Business Strategy, Digital Transformation, Leadership, Organizational Structure, Supply Chain Management | Organizational Resilience |
| Infrastructure, Financial Resource and Investment, Standardization | Infrastructure System | |
| Logistics System, Collaborative Robot, Customized Product, Industrial Automation, Industrial Internet | Manufacturing System | |
| Cloud Manufacturing, Data Acquisition, Data Connected, Real Time Data | Data Transformation | |
| Big Data Analytics, Information System, Tracking System, Predictive Maintenance, Cybersecurity | Digital Technology | |
| [65] | IT Governance, IT Strategy | - |
| [66] | Horizontal Integration, Vertical Integration, End-to-end Integration | System Integration |
| Internet of Things, Big Data, Cloud Computing, Autonomous Robots, Simulation, Cyber Physical Systems, Augmented Reality, Additive Manufacturing | - | |
| [67] | Information Technology, Digitalization, Digital Strategy | - |
| [69] | Operational Use of Data, Strategic Use of Data | Measurement System |
| Ecosystem and Architecture, Mastery of Technologies, Cybersecurity, Intelligence, Autonomy, and Automation | Technology Management | |
| Collection of Data, Integrity and Quality of Data, Data Delivery | Data Management | |
| Customization, Engagement and Loyalty, Cocreation and Open Innovation, E-Commerce and SMAC | Customer Experience | |
| [70] | Suitable Performance Measurement (PM) System | - |
| [71] | Digital Artifact, Digital Platform, Digital Infrastructure, Digital Business Model, Digital Management Model | Overall Digitalization Degree |
| Internal R&D, External Acquisition | Digitalization Method | |
| Big Data, AI, Mobile, Cloud Computing, IoT, Social, Platform Development | Digital Technology Adoption | |
| Rate of Online Business | Business Mode | |
| Digital Transformation | Long-term Crisis Responses | |
| [1] | Cloud Computing, Social Media Network, Perceived Usefulness, Security and Privacy Concerns | - |
| [72] | Internet is the Source of Innovation | |
| [73] | High Performance Computing, Technological (Corporate Digital Responsibility) | - |
| [74] | Digitalization | - |
| [75] | Digital Platform Capability | - |
| [76] | Phoneline Connection, Fixed BB/NGA Connection, Fast BB Connection, Ultra-fast BB Connection | Fixed-line Broadband—Connectivity |
| 4G Connection, 5G Connection | Mobile Broadband—Connectivity | |
| Proprietary Website, E-marketing Activity, Social Media Presence | Online Presence | |
| Online Sales, E-commerce Turnover, Cross-border E-commerce, Digital/electronic Catalog, Online Communication with Customers, Customer Engagement in Product Customization | E-commerce—Online Presence | |
| B2B E-business Activity (Online Activity), B2G E-business Activity (Online Activity), E-banking (Online Activity), Online Purchases | Online Activity | |
| Intranet, Electronic records, Automatically Generated Invoices, Electronic Information Sharing | ICT Infrastructure | |
| Big Data, Cloud Services, Integrated or Specialized Systems or Tools, Business Intelligence or Knowledge Base, Decision Support Tool | Advanced Technologies—ICT Infrastructure | |
| Robots and 3D Printing, Automation, Product Identification Throughout the Supply Chain (Unique, Automated), Digital Supply Chain Management and Supplier Relationships | Production Technologies—ICT Infrastructure | |
| Security Policy, Data Protection Policy, Regulatory Quality, Assessment Effectiveness, Software or Hardware Upgrades | ICT Policy | |
| Computer or Mobile Device Use, Internet Use, E-mail or IM Use, Standard Application or Office Software Usage, Video Calls or Conferences | ICT Usage | |
| [77] | Digitization of Analogue Data, Digitization of Biometric Data, Digital Interaction Platforms, Networking, Big Data Analytics, Rapid Analytics, Predictive Analytics, Use of Social Networks for the Recruitment of Employees | - |
| [78] | Technological Literacy | - |
| [79] | Security of Data, Efficient Data management system, Reliable and Affordable Big Data Analytic technologies, Egression of IoT-specific Operating Systems, Trust on IoT Systems, Customer and Supplier Relationship Management, Collaborations Between Heterogeneous IoT Systems | - |
| [80] | WebIXbin, Online Presence Category, Competitiveness Index, Competitiveness Index, Category | - |
| [81] | Big Data, Interoperability, Internet of Things, Cyber-Physical Systems | - |
| [82] | Digital Transformation, Smart Technologies | - |
| [83] | Searching for Digitally Enabled Growth Opportunities, Understanding and Developing Digital Customer Needs, Sensing Technology Driven Opportunities, Use of External Sources Digital Innovation | Sensing Digitally Enabled Growth Potentials |
| Digitally Enabled Growth Strategy, Digital Leadership, Digital Mindset | Developing a Digitally Enabled Growth Strategy and Mindset | |
| Digitally Enabled Business Models, Digital Market Presence, Digital Customer Experience, Agile Deployment of Digitalization Initiatives | Seizing Digitally Enabled Growth Potentials | |
| Digital Processes, Digital Technology and Security | Managing Resources for Digital Transformation | |
| [84] | Technical Infrastructures | IT Perspectives |
| [10] | Smart Cities’/Regions’ Rebounds, SMEs vs. Global ICT-based Company, Digital Divide, Digital Literacy | - |
| [85] | General Standpoint of the Respondent on DT in the Sector, Respondents’ Opinion on DT in their Organization and Whether They Have Been Involved in a DT Process, Respondent’s Opinion on Which Digital Technologies he/she Expects to Impact his/her Company’s Digital Strategy in the Coming Years and to What Extent, Respondent’s Opinion on Which are the Major Barriers to Implementing their Company’s DT Strategy, Respondent’s Opinion on the Importance of Specific Digital Practices/Initiatives, Respondents’ Opinion on the Benefits their Company has Ripped from DT Initiatives, Respondent’s Opinion on the Effectiveness of his/her Company’s DT Strategy. | - |
| [86] | ICT Utilization, Social Media Engagement | |
| [8] | IT Infrastructure Flexibility, Application Digital Technology | |
| [87] | Managerial Capabilities, Operational Capabilities |
| Source | Variables | Dimensions |
|---|---|---|
| [58] | Organizational Innovativeness, Organizational Performance | - |
| [59] | Firm Performance | - |
| [61] | Product Innovation, Process Innovation, Market Orientation Trade, Market Orientation Business, Market Internationalization, Cost Strategy, Collaboration, Obstacles | - |
| [62] | Overall Performance | - |
| [63] | Entrepreneurial SMEs’ Performance, International, Orientation, Exploration Orientation, Exploitation Orientation | - |
| [5] | Finance, Customer, Process, Learning | Organizational Performance—Balanced Score Card |
| [9] | Export Intensity, Investment in Innovation | - |
| [65] | Organizational Performance | - |
| [67] | Financial Performance | - |
| [68] | Product Innovation Capability, R&D and Manufacturing Capability, Marketing Capability, Branding Capability | Professional Competence |
| Stable Cash Flow, Merge and Acquisition, International Operation Experience | Operation Management | |
| Fundraising, Obtain Key Resource, Obtain Market Information | Critical Resources | |
| Approve by International Certification, Approve by Local Sales Certification, Approve by Health Insurance, Apply Intellectual Property | Regulatory System | |
| Build up Reputation, Connect Channels, Influence by National Image, Understand Different Culture | Market Expansion | |
| [69] | Vision and Strategy, Technological Watch, New Business Models, Commitment and Exemplarity | Leadership |
| Change Management, Agile Manufacturing and Innovation, Investment and Available Resources, Lean and Continuous Improvement | Culture and Organization | |
| [70] | Define and/or Visualize Business Objectives and Strategies, Allocate Resources for Implementation (Within Budget), Define Key Objectives in Consideration of Vision/Objectives, Define KPI for All Areas, Modify Existing Management System (Processes and Org. Structure) and Incentive System, Implement Measures and Use KPI, Initiate Change Process (Change Management), Set Up a Secondary Org. for Project Implementation, Identify Risks for Each Activity During the Implementation, Review Objectives, KPIs, and Measures, Evaluate Project Implementation | - |
| [71] | Production Recovery | Short-term Crisis Responses |
| Strategic Change | Long-term Crisis Responses | |
| Cost Control Status, Cash Flow Status, Revenue Status in the First Quarter, Predicted Performance | Performance | |
| [1] | Implementation Cost, Innovativeness, Productivity, Exporter, End Customer | - |
| [72] | EBIT to sales, ROA, Total Assets, Liabilities to Assets | - |
| Desire to Growth, Sales Change in Five Years, Sum Variable Measuring Organization Structure and Cooperation, Sum Variable Measuring Organization Structure, Family’s Share (%) and Cooperation as Projects, Sum Variable Measuring Size Measured as Growth in Sales, Market Share and Profitability, Sum Variable Measuring Environment, Cooperation with Resources and Subcontracting, Sum Variable Measuring Environment, Customers with Voucher or with Agreement, Sum Variable Measuring Strategy to Grow with Boost sales, New Products and Expansion Internationally, Sum Variable Measuring Strategy to Meet the Competition by New Investments and Better Quality, Sum Variable Measuring Strategy to Grow with Investments in New Customers and New Products, Business Plan Exists, Bank Financing | ||
| [73] | Economic | Corporate Digital Responsibility |
| [74] | Firm Performance, Market Orientation, Marketing Capability | - |
| [75] | Improvisational Capability, Organizational Readiness, Innovation Performance | - |
| [77] | R&D Department, ICT Investment in R&D, Patents or Trademarks, In-house Innovation Capacity, Innovative Collaboration | R&D Infrastructure |
| [78] | Financial Literacy, Enterprise Risk Management, SME Performance, SME Sector | - |
| [83] | Digital Investments | Managing Resources for Digital Transformation |
| [84] | Financial Resources | IT Perspectives |
| Business Activities, Transaction, Marketing, Management, Micro-Environment, Macro-Environment | Economical Perspective | |
| [10] | Corruption, Economic Value of Data | - |
| [86] | Organizational Agility, SMEs Performance | - |
| [8] | Firm Innovativeness, Coupling, Organizational Agility, Product Innovation, Process Innovation, Financial Performance | - |
| Source | Variables | Dimensions |
|---|---|---|
| [58] | Adaptative Learning, Culture, Experimental Learning, People and Networking | - |
| [61] | Sustainability Workforce, Sustainability Community, Sustainability Human Rights | - |
| [63] | Internal Communication, Coordination, Relationship Skill, Partner Knowledge | Network Orientation |
| [65] | Family Harmony, Gender of Respondent, Age of Respondent, Family Generation of Respondent | - |
| [67] | Employee Skills | - |
| [68] | Motivate All Teams to Transform | Operation Management |
| Train Multifunction Team Member | Critical Resources | |
| [69] | Acquisition and Development of Skills, External Openness and Collaboration, Internal Communication | Culture and Organization |
| [70] | Sensitize Shareholders and/or Top Management to the Need for Performance Measurement (PM), Identify Required Knowledge for Performance Measurement (PM) (Knowledge Management), Provide Employees with Information (Communication Management), Raise Acceptance Among Employees and Review the Change Management Process, Evaluate Communication Within the Company | - |
| [71] | Employee Protection (Short-term Crisis Responses), Donation (Short-term Crisis Responses) | - |
| [1] | Skilled Labor | - |
| [72] | Manager’s Education, Sum Variable Measuring Manager’s Age and Experience in Industry (Social), Sum Variable Measuring Manager in Practical Work (%), Sum Variable Measuring Environment as Customer and Educational Institutions, Sum Variable Measuring Environment, Cooperation with Other Companies, Educational Institutions, and R&D Institution, Sum Variable Measuring Culture, Competition Require Lower Quality in Service or Problems to Find Qualified Employees, Sum Variable Measuring Culture, Service Innovations Internal or External From the Company, Sum Variable Measuring Culture, Firm’s Age and International Employees. | - |
| [73] | Moral, Socio-Cultural | Corporate Digital Responsibility |
| Integrity, Credibility, Security, Reliability, Transparency | Digital Trust | |
| Responsible Corporate Digital Governance | - | |
| [76] | ICT Department, Employment of STEM Graduates, Employment of Business Specialists, Telework | Human Resources |
| ICT Training, Self-learning, Expertise Reuse | Employee Skills—Human Resources | |
| [77] | GDPR (Employee Protection) | - |
| [78] | Financial Literacy | - |
| [79] | Availability of In-house Trained Manpower, Fear of Unemployment, Top Management Allegiance | - |
| [82] | Relationship Performance (Assesses Internal Collaboration Over the Last Three years. Assesses External Collaboration Over the Last Three Years.) | - |
| [83] | Digitally Empowered Employees | Developing a Digitally Enabled Growth Strategy and Mindset |
| Digital Skills and Learning | Managing Resources for Digital Transformation | |
| [84] | Education, Culture | IT Perspectives |
| [10] | Legal Systems, Biases Due to Digital Data, Autonomous Decision-making Acceptance, Trust in Unknown Digital Information, Ethical Dilemmas, Social Media’s Democracy Threat, Vulnerable Group, Governmental Capacity | - |
| [86] | Digital Skill | - |
| [8] | Relational Capability | - |
| Source | Variables | Dimensions |
|---|---|---|
| [61] | Environmental OrientationSustainability Market | - |
| [60] | Environmental Sustainability Readiness | - |
| [73] | Environmental | Corporate Digital Responsibility |
| Sustainability | Digital Trust | |
| [87] | Sustainability Strategy | - |
| K | 5 | 7 | 10 | 15 | 20 |
|---|---|---|---|---|---|
| Topics with 100% of accepted papers | T4 | - | T5 | T1, T3, T7, T8, T10, T12, T14 | T1, T5, T7, T8, T11, T12, T16, T17, T18, T19 |
| Number of papers | 24 | - | 5 | 48 | 34 |
| T1 | T3 | T7 | T8 | T10 ** | T12 | T14 * |
|---|---|---|---|---|---|---|
| digit | digit | adopt | capabl | covid | perform | work |
| busi | knowledg | organis | market | smes | innov | sustain |
| smes | firm | technolog | perform | pandem | busi | safeti |
| transform | technolog | smes | firm | crisi | model | health |
| technolog | smes | inform | orient | busi | manag | studi |
| valu | capabl | factor | smes | respons | studi | environment |
| organiz | innov | market | technolog | firm | suppli | cultur |
| capabl | extern | competit | busi | measur | chain | osh |
| matur | inform | portal | agil | impact | organiz | employe |
| level | platform | cloud | manag | economi | firm | relat |
| T1 | T2 | T3 | T4 | T5 * | T6 ** | T7 * |
|---|---|---|---|---|---|---|
| industri | digit | innov | capabl | orient | covid | port |
| product | manag | knowledg | perform | firm | pandem | work |
| manufactur | busi | famili | innov | market | crisi | data |
| system | technolog | enterpris | busi | perform | smes | sustain |
| chain | smes | perform | model | environment | busi | servic |
| data | research | industri | agil | sustain | respons | health |
| evalu | studi | model | organiz | innov | distribut | safeti |
| suppli | develop | extern | strategi | green | enterpris | forest |
| oper | compani | search | firm | capabl | impact | environment |
| indic | model | dih | relationship | suppli | market | iot |
| T1 | T2 | T3 * | T4 | T5 | T6 | T7 |
|---|---|---|---|---|---|---|
| capabl | digit | sustain | perform | market | capabl | industri |
| innov | busi | environment | variabl | onlin | firm | product |
| matur | manag | port | studi | media | knowledg | manufactur |
| market | smes | green | chain | distribut | agil | chain |
| orient | technolog | capit | suppli | communic | entrepreneuri | compani |
| knowledg | research | cultur | effect | custom | famili | design |
| social | innov | variabl | factor | social | orient | technolog |
| crisi | model | smsps | portal | compani | effect | suppli |
| organiz | develop | intellectu | adopt | competit | intern | process |
| servic | studi | tool | signific | enterpris | innov | system |
| T1 | T2 | T3 * | T4 | T5 |
|---|---|---|---|---|
| perform | capabl | sustain | firm | digit |
| innov | digit | environment | market | technolog |
| busi | innov | port | social | mes |
| manag | firm | manag | innov | busi |
| studi | orient | research | distribut | manag |
| effect | busi | green | knowledg | industri |
| model | research | adopt | custom | compani |
| strategi | knowledg | cultur | strategi | product |
| firm | manag | iot | action | process |
| research | smes | social | servic | develop |
| T1 | T2 | T3 | T4 | T5 |
|---|---|---|---|---|
| digit | valu | innov | industri | firm |
| busi | market | capabl | knowledg | work |
| manag | chain | market | innov | crisi |
| technolog | onlin | competit | technolog | respons |
| smes | aspect | matur | smes | chang |
| compani | resourc | servic | product | covid |
| research | smes | technolog | manufactur | dynam |
| process | enterpris | orient | extern | entrepreneur |
| transform | develop | iot | firm | small |
| develop | indic | knowledg | adopt | smes |
Disclaimer/Publisher’s Note: The statements, opinions and data contained in all publications are solely those of the individual author(s) and contributor(s) and not of MDPI and/or the editor(s). MDPI and/or the editor(s) disclaim responsibility for any injury to people or property resulting from any ideas, methods, instructions or products referred to in the content. |
© 2023 by the authors. Licensee MDPI, Basel, Switzerland. This article is an open access article distributed under the terms and conditions of the Creative Commons Attribution (CC BY) license (https://creativecommons.org/licenses/by/4.0/).
Share and Cite
Costa Melo, I.; Alves Junior, P.N.; Queiroz, G.A.; Yushimito, W.; Pereira, J. Do We Consider Sustainability When We Measure Small and Medium Enterprises’ (SMEs’) Performance Passing through Digital Transformation? Sustainability 2023, 15, 4917. https://doi.org/10.3390/su15064917
Costa Melo I, Alves Junior PN, Queiroz GA, Yushimito W, Pereira J. Do We Consider Sustainability When We Measure Small and Medium Enterprises’ (SMEs’) Performance Passing through Digital Transformation? Sustainability. 2023; 15(6):4917. https://doi.org/10.3390/su15064917
Chicago/Turabian StyleCosta Melo, Isotilia, Paulo Nocera Alves Junior, Geandra Alves Queiroz, Wilfredo Yushimito, and Jordi Pereira. 2023. "Do We Consider Sustainability When We Measure Small and Medium Enterprises’ (SMEs’) Performance Passing through Digital Transformation?" Sustainability 15, no. 6: 4917. https://doi.org/10.3390/su15064917
APA StyleCosta Melo, I., Alves Junior, P. N., Queiroz, G. A., Yushimito, W., & Pereira, J. (2023). Do We Consider Sustainability When We Measure Small and Medium Enterprises’ (SMEs’) Performance Passing through Digital Transformation? Sustainability, 15(6), 4917. https://doi.org/10.3390/su15064917