Article

Seismic Dynamic Response and Lining Damage Analysis of Curved Tunnel under Shallowly Buried Rock Strata

College of Urban Construction, Changzhou University, Changzhou 213164, China
*
Author to whom correspondence should be addressed.
Sustainability 2023, 15(6), 4905; https://doi.org/10.3390/su15064905
Submission received: 7 February 2023 / Revised: 6 March 2023 / Accepted: 8 March 2023 / Published: 9 March 2023
(This article belongs to the Special Issue Sustainability in Geology and Civil Engineering)

Abstract

:
It is still challenging to anticipate with accuracy how tunnels will behave and if they will fail when subjected to an earthquake load. In this study, assuming nonlinear material behavior and a three-dimensional inelastic rock medium, the theory of damage mechanics is applied to numerical simulation to build a curved tunnel-surrounding rock model, whose correctness was verified in laboratory experiments. To better understand the influence of surrounding rock strength on the seismic performance of a curved tunnel, the stratum parameters of the curved tunnel-surrounding rock system are quantified. The findings demonstrate that the damage process in curved tunnels is a circular process of damage change, and the model accurately captures these structural aspects of the damage evolution process. In addition, structural damage can be identified using displacement detection because the displacement of a curved tunnel is directly related to its compression damage. Finally, the seismic response of the curved tunnel-surrounding rock system is studied parametrically to determine the extent to which different parameters affect the seismic response. These parameters, including elastic modulus, friction angle, cohesion, and Poisson’s ratio, are characteristics of rock-medium materials. We then created multi-factor evaluation formulas to direct the surrounding rock to reinforce.

1. Introduction

Owing to the rapid growth of the urban population and the fast development of urbanization, demands for improvement and development of services in cities are increasing. In recent years, the pace of urban metro systems has accelerated significantly to alleviate transportation pressure in many cities, among which the tunnel has been widely employed owing to its various applications, such as favorable site conditions and use where above-ground buildings exist. China is a country with a high incidence of earthquakes. Under the action of seismic waves, curved tunnels suffer from damage, especially in shallowly buried rock strata. The reasons are complicated, including the complexities of geological engineering conditions, stratigraphic physical and mechanically unique properties, inevitable nearby construction, and so on [1]. Large damage degrees will adversely affect the safety and serviceability of curved tunnels [2]. Stress concentration, along with lining cracks, cave collapse, concrete falloff, and steel bending, may occur, which brings great risk to the operational metro train. Many attempts have been made to investigate the damage behavior of curved tunnels. Those available methods can be separated into three categories: analytical models, experiments, and numerical analyses.
Constructing reasonably constructed analytical solutions for tunnel dynamic response is a critical issue in investigating the damage behavior and seismic dynamic response of a curved tunnel. Many researchers have pointed out that damage problems in curved tunnels can be divided into two categories: in-plane problems, where the external loads are in the plane of the tunnel, and out-of-plane problems, where the loads are perpendicular to the plane of the tunnel. Initially, tunnels were generally treated as simplified solutions for basic geometries known as the beam-spring model. Because of its ease of computation, the beam-spring model, which considers the curved tunnel as a curved beam with reduced stiffness, is popular and widely accepted. Following that, the Galerkin method was used to obtain closed-form solutions for the vertical, torsional, radial, and axial responses of a curved beam subjected to multi-directional moving loads [3]. Then, the controlling differential equations for the dynamic response of the curved tunnel were presented based on the arbitrary form of viscoelasticity using Hamilton’s principle and dynamic equilibrium theory [4]. Three-dimensional discontinuous contact models for curved tunnels based on nonlinear contact theory have also been gradually developed [5].
Experimentation is the most direct method, and the results of full-scale experiments are relatively reliable. In this regard, most of the experiments have been conducted to verify the stability and safety of the designed tunnel structures under specific ground conditions and surrounding soil pressure. For example, Gong [6] used triaxial experiments to simulate the failure process and mechanism of tunnel vaults. Xie [7] conducted resonant column experiments to verify the matching of acceleration similarity ratios of various parts of the structure–soil–tunnel interaction system and realistically recovered the dynamic response of the whole system under earthquake. Wang [8] recovered the actual working conditions on site through large shaking table model experiments and verified the correctness of the analytical solution of strain at the entrance of the mountain tunnel by elastic wave theory.
Analytical methods are frequently used as quick and low-cost approaches for estimating the curved tunnel’s seismic dynamic response; additionally, they contribute to a better understanding of curved tunnel damage. However, analytical methods’ inherent assumptions and simplifications limit their applications and frequently provide limited details. In contrast, experiments are expensive and time-consuming, and some have stringent site, environmental, and equipment requirements. On the other hand, numerical simulation has become a more widely used tool for investigating the impact of earthquakes on the mechanical and deformation performance of curved tunnel structures. This paper presents a representative study of the interaction between a curved tunnel and surrounding rock in numerical models.
Kang [9] used a numerical simulation method based on the finite difference principle of the FLAC number to study the coupled loading between earthquakes and ground fracture site settlement. When considering the seismic dynamic response of the subway tunnel, the analysis is inaccurate because the diffusion characteristics of seismic waves are not considered during the analysis. Zhang [10] analyzed the effect of distance conditions on the stability of the tunnel envelope by numerical simulation. Zhang [11] used the water analysis formula between horizontal seismic dynamic forces and envelope stability in shallow tunnels to derive the relationship between envelope fracture angle and envelope pressure under seismic conditions.
Early studies have improved our understanding of the interaction between curved tunnels and the surrounding rock [12], but the study of the interaction between the surrounding rock and curved tunnels is inadequate [13]. There is an urgent need to establish a complete theory of seismic dynamic response and damage analysis of tunnel envelopes. In this paper, the tensile and compressive damage of curved tunnels is analyzed by laboratory experiments and numerical simulation methods; and the weaknesses of the seismic response of curved tunnels are explored. The effects of the surrounding rock parameters (elastic modulus, friction angle, cohesion, and Poisson’s ratio) on tunnel damage are investigated by numerical simulations, and the quantitative relationship between tunnel damage and displacement is explored. The numerical equations reflecting the damage degree are further proposed to explain the influence of the surrounding rock layer on the seismic performance of the tunnel structure when the surrounding rock parameters are varied. Following that, the correctness of the numerical simulation was verified by laboratory experiments. Finally, a comprehensive set of tunnel damage degree evaluation theory is established, providing a novel approach to resolving the impact of the rock layer on the seismic damage effect of tunnels.

2. Theoretical Introduction

The tunnel structure is generally considered to be a concrete structure, and concrete is a quasi-brittle material with typical unilateral effects. It has embrittlement under tension and a certain plasticity under compression, and the compressive strength is significantly higher than the tensile strength. To describe the nonlinear mechanical behavior of concrete [14], many researchers introduced tension/compressive damage variables [15]. The damage evolution rule can refer to the strain-derived experimental functions of concrete suggested by the national code [16]:
d ± = 1 ρ ± n ± n ± 1 + ( x ± ) ± ,   x ± 1 1 ρ ± α ± ( x ± 1 ) 2 + x ± ,   x ± > 1 , x ± = ε ¯ e q ± ε c ± ,   ρ ± = f c ± E 0 ε c ± , n ± = 1 1 ρ ±
where f c ± is the tensile/compressive peak strength; ε c ± is the tensile/compressive strain corresponding to the peak strength f c ± , as shown in Figure 1; α ± is the material parameter that controls the shape of the descending part of the stress–strain curve in tension/compression; ε ¯ e q ± is the tensile/compressive equivalent strains; E 0 is the initial elastic modules of concrete; ρ ± is the tensile/compressive strength-to-initial strain ratio; n ± the tensile/compressive strain capacity factor of concrete; and x ± is the tensile/compressive strain-softening ratio.
Figure 1 illustrates the stress–strain relationship of the adopted concrete damage model under uniaxial conditions.
Therefore, the damage evolution function Equation (1) for concrete in the reference code defines the damage evolution under complex stress conditions [17]. Figure 2 compares the stress–strain curves recommended by Chinese design codes with the ABAQUS simulation results. The analysis was performed for C40 concrete and used the material parameters given in the national code. The results show that the simulation results are in good agreement with the recommended curves from several tensile and compression specimen tests, indicating that the improved model can capture the nonlinear properties of concrete.

3. Methodology

3.1. Project Overview

The second metro line to open in Changzhou City, Jiangsu Province, China, used lake blue in the logo design for Changzhou Metro Line 2. The Changzhou Metro Line 2’s first phase travels mainly east-west from Changzhou City’s Zhonglou district through the Tianning district and ends at Wuyi Road Station in the Wujin district. The tunnel is 19.79 km long, with a tunnel section of 1.29 km that is above sea level, while a section of 18.4 km is located below sea level.
According to Figure 3, curved tunnels make up the majority of the length. The various surrounding rocks around the tunnel have a considerable impact on the seismic performance of the tunnel since the tunnel structure is constrained by the conditions of the surrounding rocks.

3.2. The Laboratory Experiment Process

3.2.1. Preparation of Materials Similitude, Relations Confirmation, and Derivation

According to the project profile, the goal of this experiment is to create a curved tunnel interval section. The outer diameter and thickness of a curved tunnel with a turning radius of 1500 mm are 620 mm and 35 mm, respectively. The main characteristic parameters of an artificial mass model were geometry, density, and acceleration. The distance between the model boundary and the tunnel centerline should be at least 3 to 5 times the diameter of the bore. The distance was calculated using the model box’s dimensions, which were three times the bore’s diameter. Given the size of the model box and the model preparation process, only a 1/2 tunnel model with a geometric similarity ratio of 1:100 was available. The model box size was determined to be 750 × 550 × 500 mm based on the influence of site conditions and shaking table size, as shown in Figure 4.
According to the Saint-Venant principle, a laboratory experiment was carried out to eliminate the influence of boundary effects on the results. The density and acceleration similarity ratios were both 1:1, and the similarity relationships of other physical quantities were derived using the π theorem [18], as shown in Table 1.

3.2.2. Surrounding Rock and Tunnel Lining Model

A lining model with a thickness of 35 mm and a length of 750 mm was created out of water, cement, and sand with a weight ratio of 1:1.4:7.25 to simulate realistic seismic mechanical behavior and track deformations on the outside surface of the lining structure, as shown in Figure 4. Additionally, the aggregate was medium sand with a 0.2 mm particle diameter, while the sieved cement was regular cement with a 1% fineness. To imitate rebar in the middle of the lining model, a steel wire mesh with a diameter of 1 mm and a spacing of 2 mm was also inserted.
Additionally, based on specific mixing ratios, consolidation, direct shear, and other indoor tests, we determined the formation parameters to create beneficial coherence with the governing similitude relations. A mixture of 27% river sand, 54% fly ash, and 16% engine oil was used as the aggregate, cement, and supplementary materials, respectively, in the synthetic surrounding rock model.
The miscellaneous fill soil after 1 cm was set above the rock layer to realistically simulate the environment around the tunnel, as shown in Figure 4.

3.2.3. Experiment Schemes and Monitoring Instruments

A seismic wave can be described by its amplitude, frequency spectrum, and duration. The section with the greatest seismic wave, El Centro record energy, is intercepted with a length of 40 s. According to the similar relationship shown in Table 1, the time axis was compressed, and the seismic wave was input as a laboratory experiment.
First, 0.05 g of white noise was input to detect the dynamic characteristics of the model. The input direction was horizontal after filtering and baseline correction, and the peak acceleration of the input EI wave was 0.2 g. The seismic waveform and the Fourier diagram are shown in Figure 5.
An earthquake seismic waveform was applied at the inner bottom boundary of finite elements along the horizontal direction to generate the seismic shear wave excitation as the laboratory experiment model was tested.
Three measurement points were set up to obtain the input seismic acceleration of the laboratory model experiment. As shown in Figure 6, two measurement points were set at the top and bottom of the curved tunnel entrance to measure the seismic acceleration of the tunnel, respectively, and measurement point 3 was located at the bottom of the shaking table.

3.3. Numerical Simulation Method

3.3.1. Elaborated Evaluation on the Seismic Performance of a Curved Tunnel

The following series of numerical simulations are based on the above theoretical analysis, which adopted the nonlinear mechanical properties of concrete material and focused on assessing the influence of surrounding rock strata on a curved tunnel by establishing the valuation expression.
The curved tunnel-surrounding rock system has remarkable nonlinear properties that can be described in three parallel dimensions. The nonlinear dynamic properties of lining structures and surrounding rock are the first. The second is nonlinear geometry issues in the interaction of the lining structure and surrounding rock. The last one is the nonlinear dynamic contact relationship.
ABAQUS is a set of powerful finite element software. It is widely used in industry and research in various countries due to its powerful analysis functions and the reliability of simulating complex systems. In his development of the domain reduction technique (DRM), Bielak [19] demonstrated the site effect of irregular terrain in the near field as well as the path that seismic waves take during their propagation in the far field. By precisely transforming mistaken seismic forces in the far field, the DRM could build synthetic boundaries for irregular topography posts, which should be capable of significantly decreasing the computer load in traditional seismic response analysis [20].

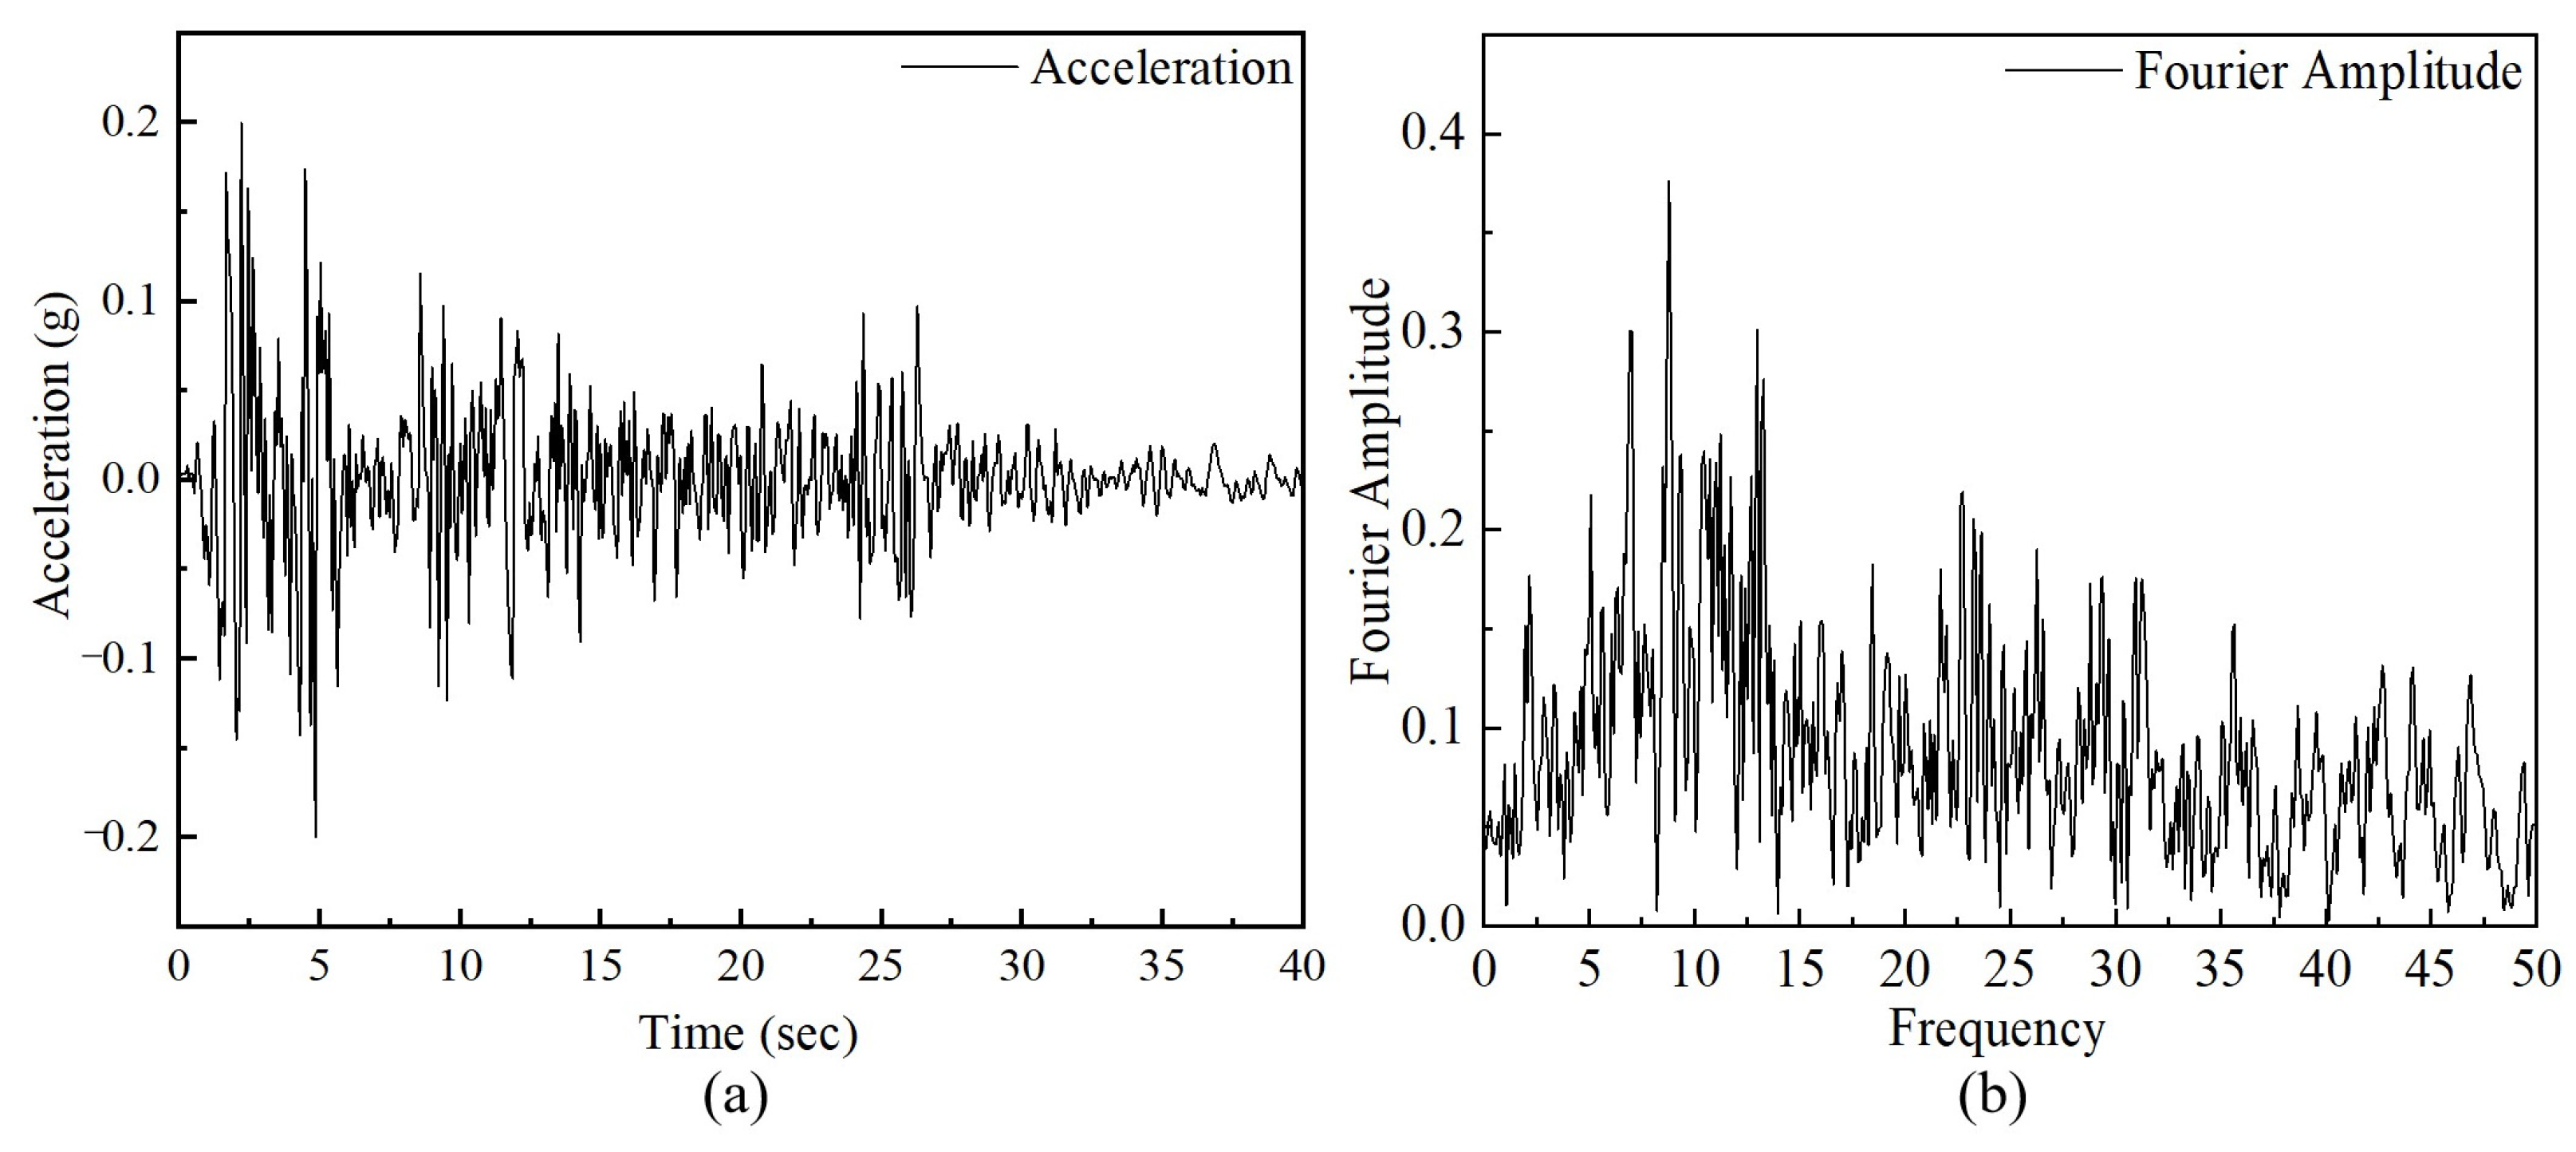
3.3.2. Input of Seismic Waves

There are currently two basic approaches to structural dynamic analysis. To handle the random response and dynamic reliability issues of nonlinear multi-degree-of-freedom (MDOF) systems under coupled excitation, one is the direct probability integration method (DPIM) [21]. The generalized probability density evolution method (GPDEM), which can also be used to address the problem of random seismic response, unknown parameter response, and random ground motion, is the alternative. Thus, by using GPDEM, it is possible to determine the statistical value and probability information of the structural random response in a dynamic system [22].
It is vital to choose a group of EDP [23] that can accurately represent the cumulative damage effect of earthquakes on tunnels in order to examine the influence of earthquakes on tunnel lining damage. EDP selects from three parameters: horizontal deformation (X deformation), vertical deformation (Y deformation), and damage factor D.
The same seismic input motion at the same time and intensity was utilized for model tests to ensure the accuracy of the numerical simulation of the curved tunnel. Consequently, the seismic wave input is consistent with the seismic wave calculated using numerical simulation.

3.3.3. Modeling and Parameter Assignment

According to the tunnel project of Changzhou Metro Line 2, a three-dimensional finite element analysis model of the circular tunnel was established using ABAQUS, and a self-developed Python program was used to implement the three-dimensional input method of seismic and shear waves. The computational model uses a viscoelastic artificial boundary (VSAB) as the peripheral absorption boundary and bottom absorption boundary of the finite element. The top is the free-field boundary, which accurately represents the specific deformation mode of the system in the theoretical analysis.
As shown in Figure 7, the rock layer around the tunnel should be 5–8 times the tunnel radius, according to the specification. The surrounding rock layer exceeding three times the tunnel’s diameter has little effect on the seismic loading of the tunnel. The length, width, and height of the model are 200 m, 200 m, and 50 m, respectively. The curved tunnel has a turning radius of 150 m and a turning angle of 90 degrees.
The model analyzes the extent of tunnel losses under seismic loading and the influence of the surrounding rock conditions on the seismic performance of the tunnel. The analysis model mainly considers stress redistribution, the concrete damage plasticity model is used for the tunnel, and the Mohr-Coulomb model is used for the surrounding rock. The tunnel’s outer diameter is 6.2 m, and the inner diameter is 5.5 m. The tunnel and the stratigraphic grid are 8-node linear brick elements C3D8R, and the interaction between the surrounding rock and the tunnel is determined by combining the contact correlation [24]. Since the measured element size is less than one-tenth of the wavelength, the grid can be moved independently of the material, ensuring high-quality results for large deformation analyses. In this case, the maximum element size of the computational model is 5.0 m, which is consistent with the computational accuracy. The specific division size is shown in Figure 7.
The tunnel structure was simulated using the concrete damage plasticity (CDP) model from the ABAQUS material library to better understand the interaction between the surrounding rock parameters and the tunnel structure. The CDP model can explain the nonlinear dynamic behavior of the concrete tunnel [25].
Since the seismic motion of the surrounding rock immediately affected the lining structure, it was equally important to record its nonlinear seismic reactions. Additionally, the area of infinite elements uses the nonlinear elastic model. Table 2 contains the physical and mechanical properties of the lining structure and surrounding rock that were used in the calculations.

3.3.4. Calculation Condition and Monitoring Schemes

According to the selected fundamental geometric and material parameters, four combinational variables are designated to evaluate the seismic performance of a curved tunnel (i.e., E , υ , n , Φ ). These constants can help assess the seismic performance of curved tunnels concerning some particular variations or even help obtain an evaluation expression to analyze the damage sensibilities in terms of these particular variations.
To explore the effect of tunnel seismic performance under different surrounding rock parameters, the elastic modulus, internal friction angle, Poisson’s ratio, and bond of the surrounding rock are classified into five categories, and 27 sets of experiments were established using a homogeneous design approach. Based on a large number of actual projects and research background, the elastic modulus, Poisson’s ratio, internal friction angle, and cohesion were determined to be 5 GPa~35 GPa, 0.1~0.4, 5°~35°, and 0.5 MPa~3.5 MPa, respectively, considering the applicable range of the site surrounding rocks, as shown in Table 3.
During the numerical calculation, the ABAQUS code recorded the maximum deformations on the outer surface of the lining structure with different rock strata. Before nonlinear seismic calculation, it was necessary to calculate the equilibrium state of the initial stress field, which can accurately simulate the after-tunneling mechanical states of the surrounding rock around the tunnel structure.

3.4. Validating Results Analysis and Comparisons

The accelerations at measurement points 1 and 2 are shown in Figure 8. By comparing the acceleration of the vault with the acceleration of the model experiment point, the error of the experimental results is less than 5%, and the simulation results can accurately reflect the experimental phenomenon. The experimental data are consistent with the numerical simulation results, indicating that the numerical simulation results are correct.
In comparison to the seismic wave, both measurement points 1 and 2 have higher peak accelerations, with measurement point 2′s peak acceleration being higher than that of point 1. This is because the tunnel has a certain amplification impact on seismic waves, and that effect will be amplified as the surrounding rock strength increases.
The purpose of setting measurement point 3 on the vibration table is to collect data about the seismic wave exerted on the structure by the vibration table. By setting the measuring point 3 on the shaking table, the seismic wave of the shaking table experiment is consistent with the input seismic wave, and these data are used to evaluate the structural integrity of the experiment.

4. Analysis

4.1. The Difference between Deformations of the Curved Tunnels and the Straight Tunnels

A series of [26,27,28] studies have been carried out to investigate the seismic behavior of linear tunnels. These studies have revealed the damage mechanism of linear tunnels under seismic loading. The additional stresses and deformations due to the curvature of curved tunnels pose additional challenges to curved tunnel safety and construction design.
Due to the curvature of curved tunnels, they experience radial deformation and tangential deformation, which can lead to additional stresses and strains in the tunnel lining. By contrast, straight tunnels do not experience this deformation. Deformation in curved tunnels is typically uneven due to the uneven curvature along the length of the tunnel. This can lead to uneven settlement and cracking of the tunnel lining. Due to their geometry, curved tunnels exhibit resonant effects during earthquakes, which can amplify ground motions and increase stresses and strains on the tunnel lining. By contrast, straight tunnels are less susceptible to resonance effects.
Compared to the structural damage characteristics of straight tunnels, curved tunnels are also susceptible to damage at the arch waist. The main reason for this is that the geometry of the tunnel, the characteristics of the seismic ground motion, and the nature of the surrounding ground increase the stresses and strains at the arch waist of curved tunnels.

4.2. Lining Damage Analysis

Both the compressive damage variable and the tensile damage region showed significant variations. The waist, the top, and the bottom were the three main sites of the injury. Comparatively speaking, the compressive damage on the left side was less severe than on the right. Figure 9 illustrates compressive damage that mostly affected the arch of the waist and was fairly symmetrical on the left and right sides.
Under the same seismic wave, curved tunnels with different surrounding rock characteristics have different tensile/compressive damage degrees, but the overall trend of structural damage process is consistent. The impact of increasing degradation in curving tunnels subject to seismic loads was examined using Project 1. When t = 0.83 s, tensile damage begins to manifest near the top of the tunnel lining arch. It then spreads out to the sides. Compressive damage initially manifests in the tunnel lining’s left arch at 0.26 s. At t = 0.29 s, the right arch of the tunnel experienced compressive damage. Compressive damage happened in the tunnel’s left and right arches practically simultaneously. Tensile damage is the principal form of injury. The damage variation proceeds in a circular fashion.
According to the numerical simulation results of Project 1, the maximum compression damage factor of the tunnel lining is 0.7292, and the maximum tensile damage factor is 9.113. The ratio of the area with a tensile damage factor > 0.4 on the outer surface of the curved tunnel to the tunnel surface area is 0.1667, indicating the extent of tensile damage. The maximum compression damage factor obtained by the tunnel structure is 0.7292, indicating the degree of tunnel compression damage.

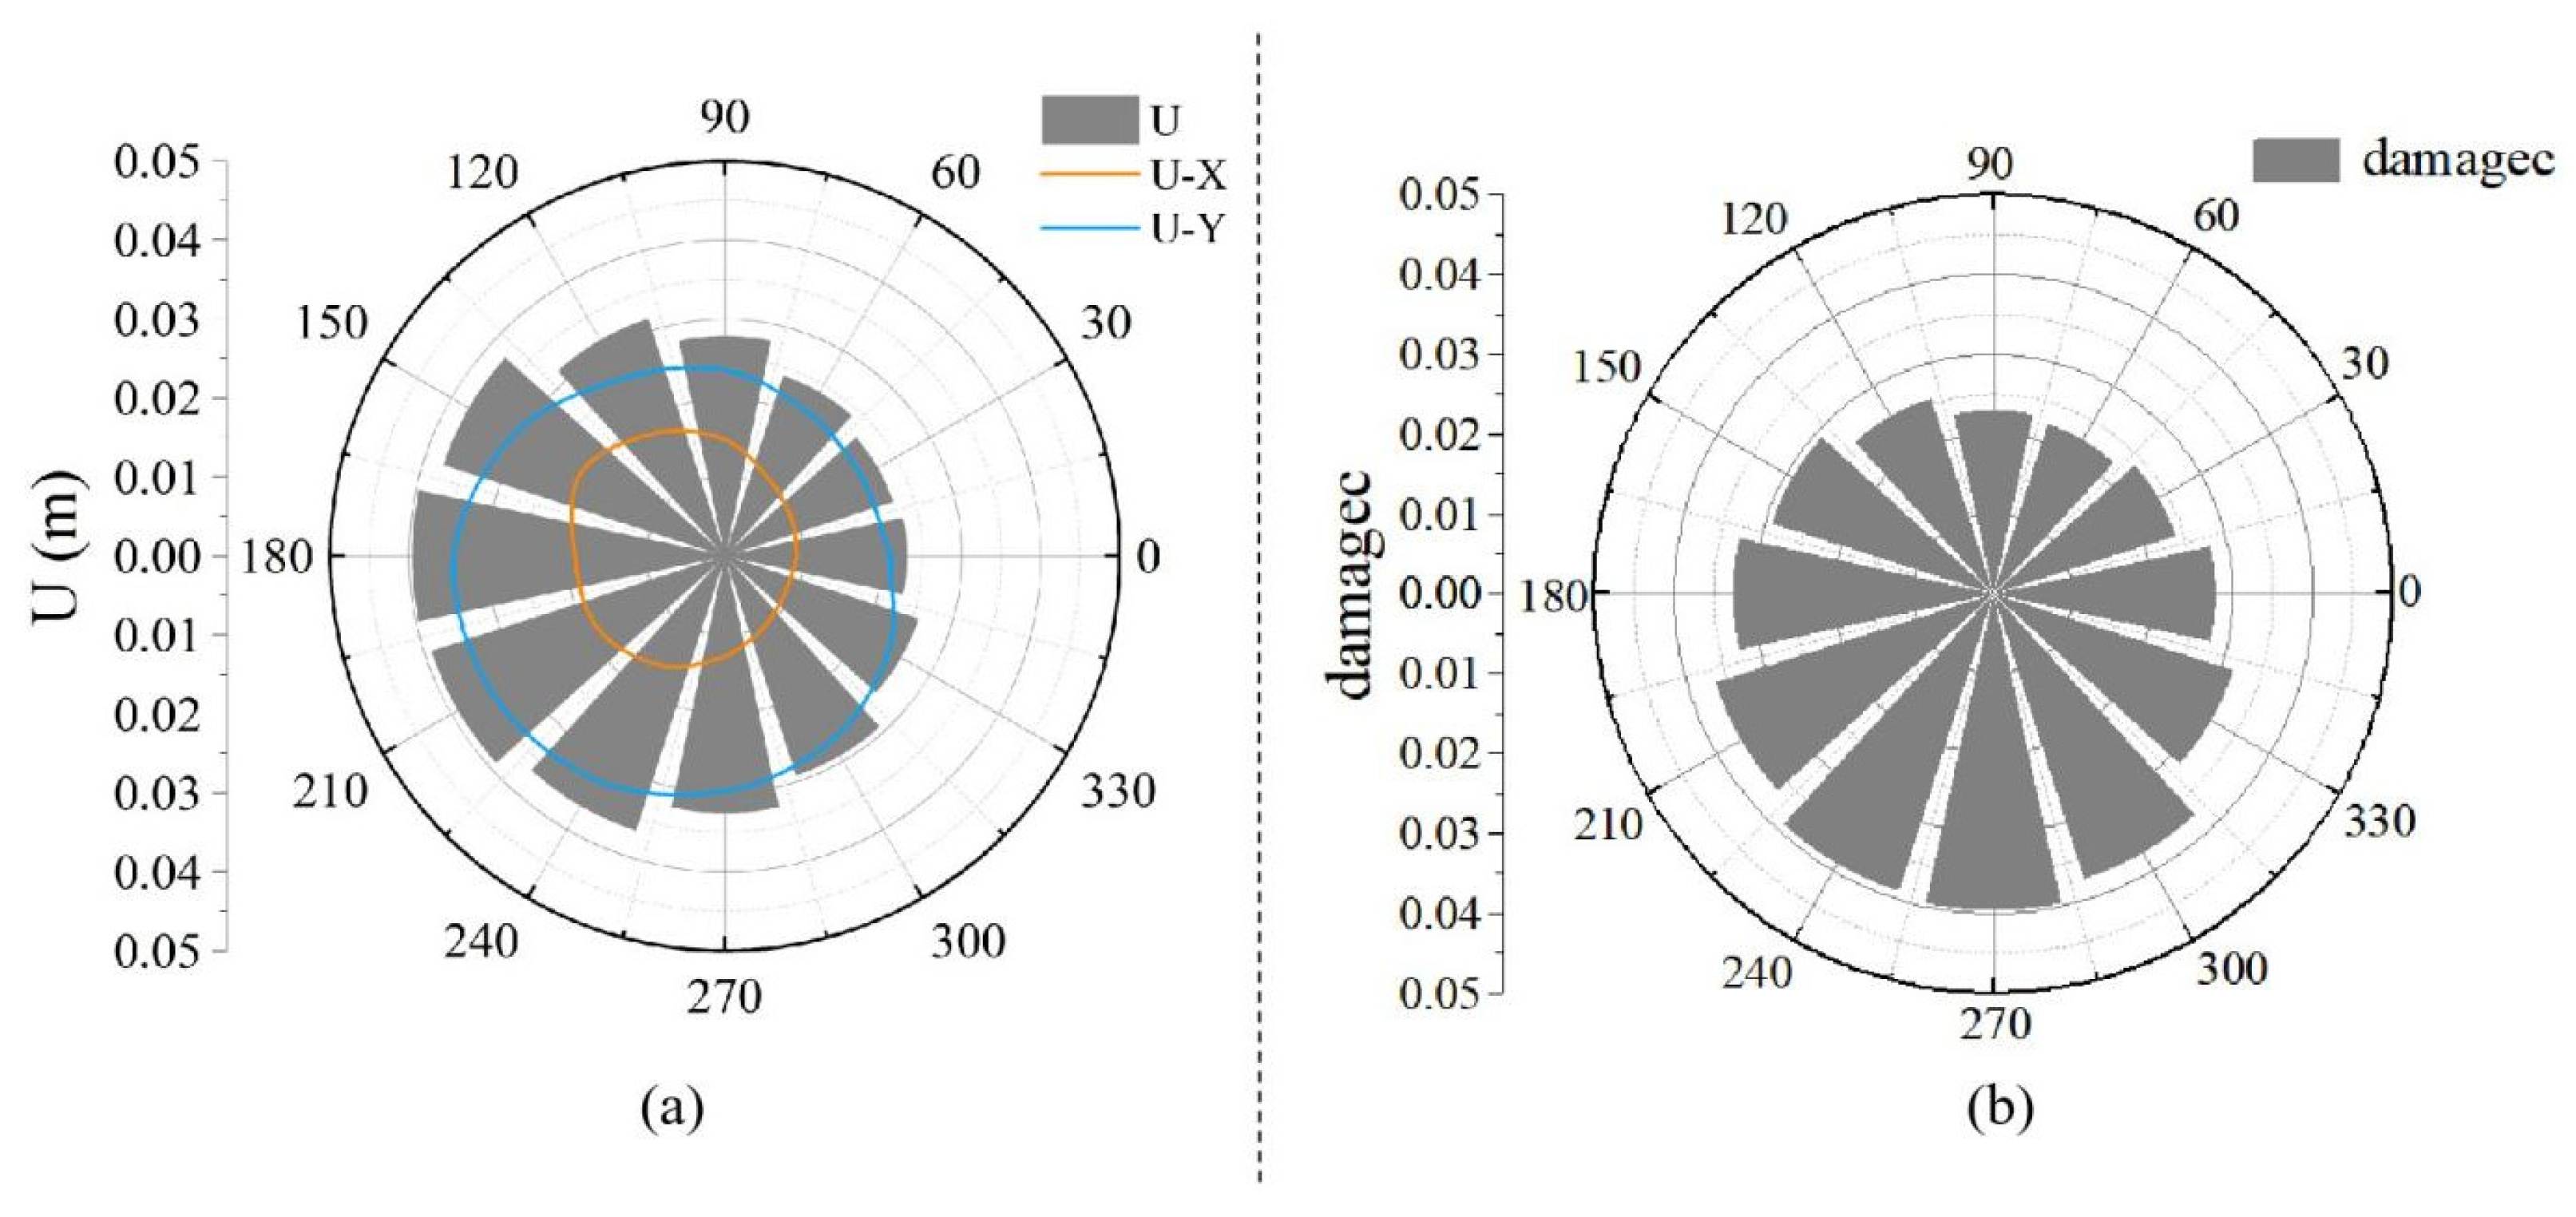
4.3. Displacement Analysis

There is some research value in determining the tunnel’s structural deterioration mechanism and its connection to structural deformation. Chen [29] developed the Sidiroff energy equivalence principle and the Najar damage theory to derive the plastic damage factor of concrete CDPM with higher applicability. By establishing relationships with the lining displacement parameters, structural damage is detected [30], acting as a safety indicator [31]. According to the existing structural state classification criteria for different degrees of damage, when the damage factor D > 0.1, maintenance and reinforcement are required.
Because steel bars are used in conjunction with concrete, whose compressive strength is far greater than its tensile strength, each material will play to its fullest potential. As a result, the examination of concrete damage focuses primarily on compressive damage. According to Figure 10, the compressive damage and displacement response patterns of the curved tunnel are consistent.
There is a correlation between displacement and the tunnel damage coefficient that is positive, according to 27 project investigations. The tunnel damage coefficient increases with displacement. The tunnel damage coefficient is more than 0.1 when the displacement is greater than 76 mm. The tunnel structure needs to be inspected and repaired when the tunnel damage coefficient is more than 0.1. As a result, the lining’s displacement parameters enable real-time monitoring of the tunnel’s deformation. The maintenance will be done when the displacement of the tunnel liner is larger than 76 mm. At the same time, displacement monitoring can be used to determine the extent of tunnel structure damage.

5. Discussion

To obtain the evaluation expressions for the tensile/compressive damage characteristics of these four variables, the first step is to study the tensile/compressive damage variation law for every variable separately. The maximum compressive damage value and the maximum tensile damage area must then be analyzed for each variable’s sensitivity to form a fitting function. Finally, excluding insensitive variables, a multivariate regression analysis method is established to evaluate the entire explicit expression of the tensile/compressive damage of the tunnel for all variables [32].

5.1. Evaluation Coefficient of Curved Tunnel Damage

k b is the evaluation coefficient representing the damage to the tunnel under different surrounding rock properties, used to deal with the tensile and compressive damage of the tunnel structure. k b + is the ratio of the larger area (>0.4) of tensile damage d m a x + on the outer surface of the tunnel to the surface area of the tunnel, indicating the degree of tensile damage. k b is the max-achieved compressive damage d m a x by the tunnel structure, indicating the degree of tunnel compressive damage.
Table 4 lists the relationship between each variable (modulus of elasticity x 1 , Poisson’s ratio x 2 , friction angle x 3 , cohesion x 4 ) and k b ± . Changes in several variables leads k b ± to change, which means that k b ± is different from these variables in the sensitivities, which requires more in-depth research.
When calculating k b ± for different values of E, the variables υ , n , and Φ values’ are 0.1, 0.5 MPa, and 5°, respectively. When calculating k b ± for different values of υ , the variables E, n , and Φ values’ are 5 GPa, 0.5 MPa, and 5°, respectively. When calculating k b ± for different values of Φ , the variables E, n , and υ values’ are 5 GPa, 0.5 MPa, and 0.1, respectively. When calculating k b ± for different values of n , the variables E, Φ , and υ values’ are 5 GPa, 5°, and 0.1, respectively.

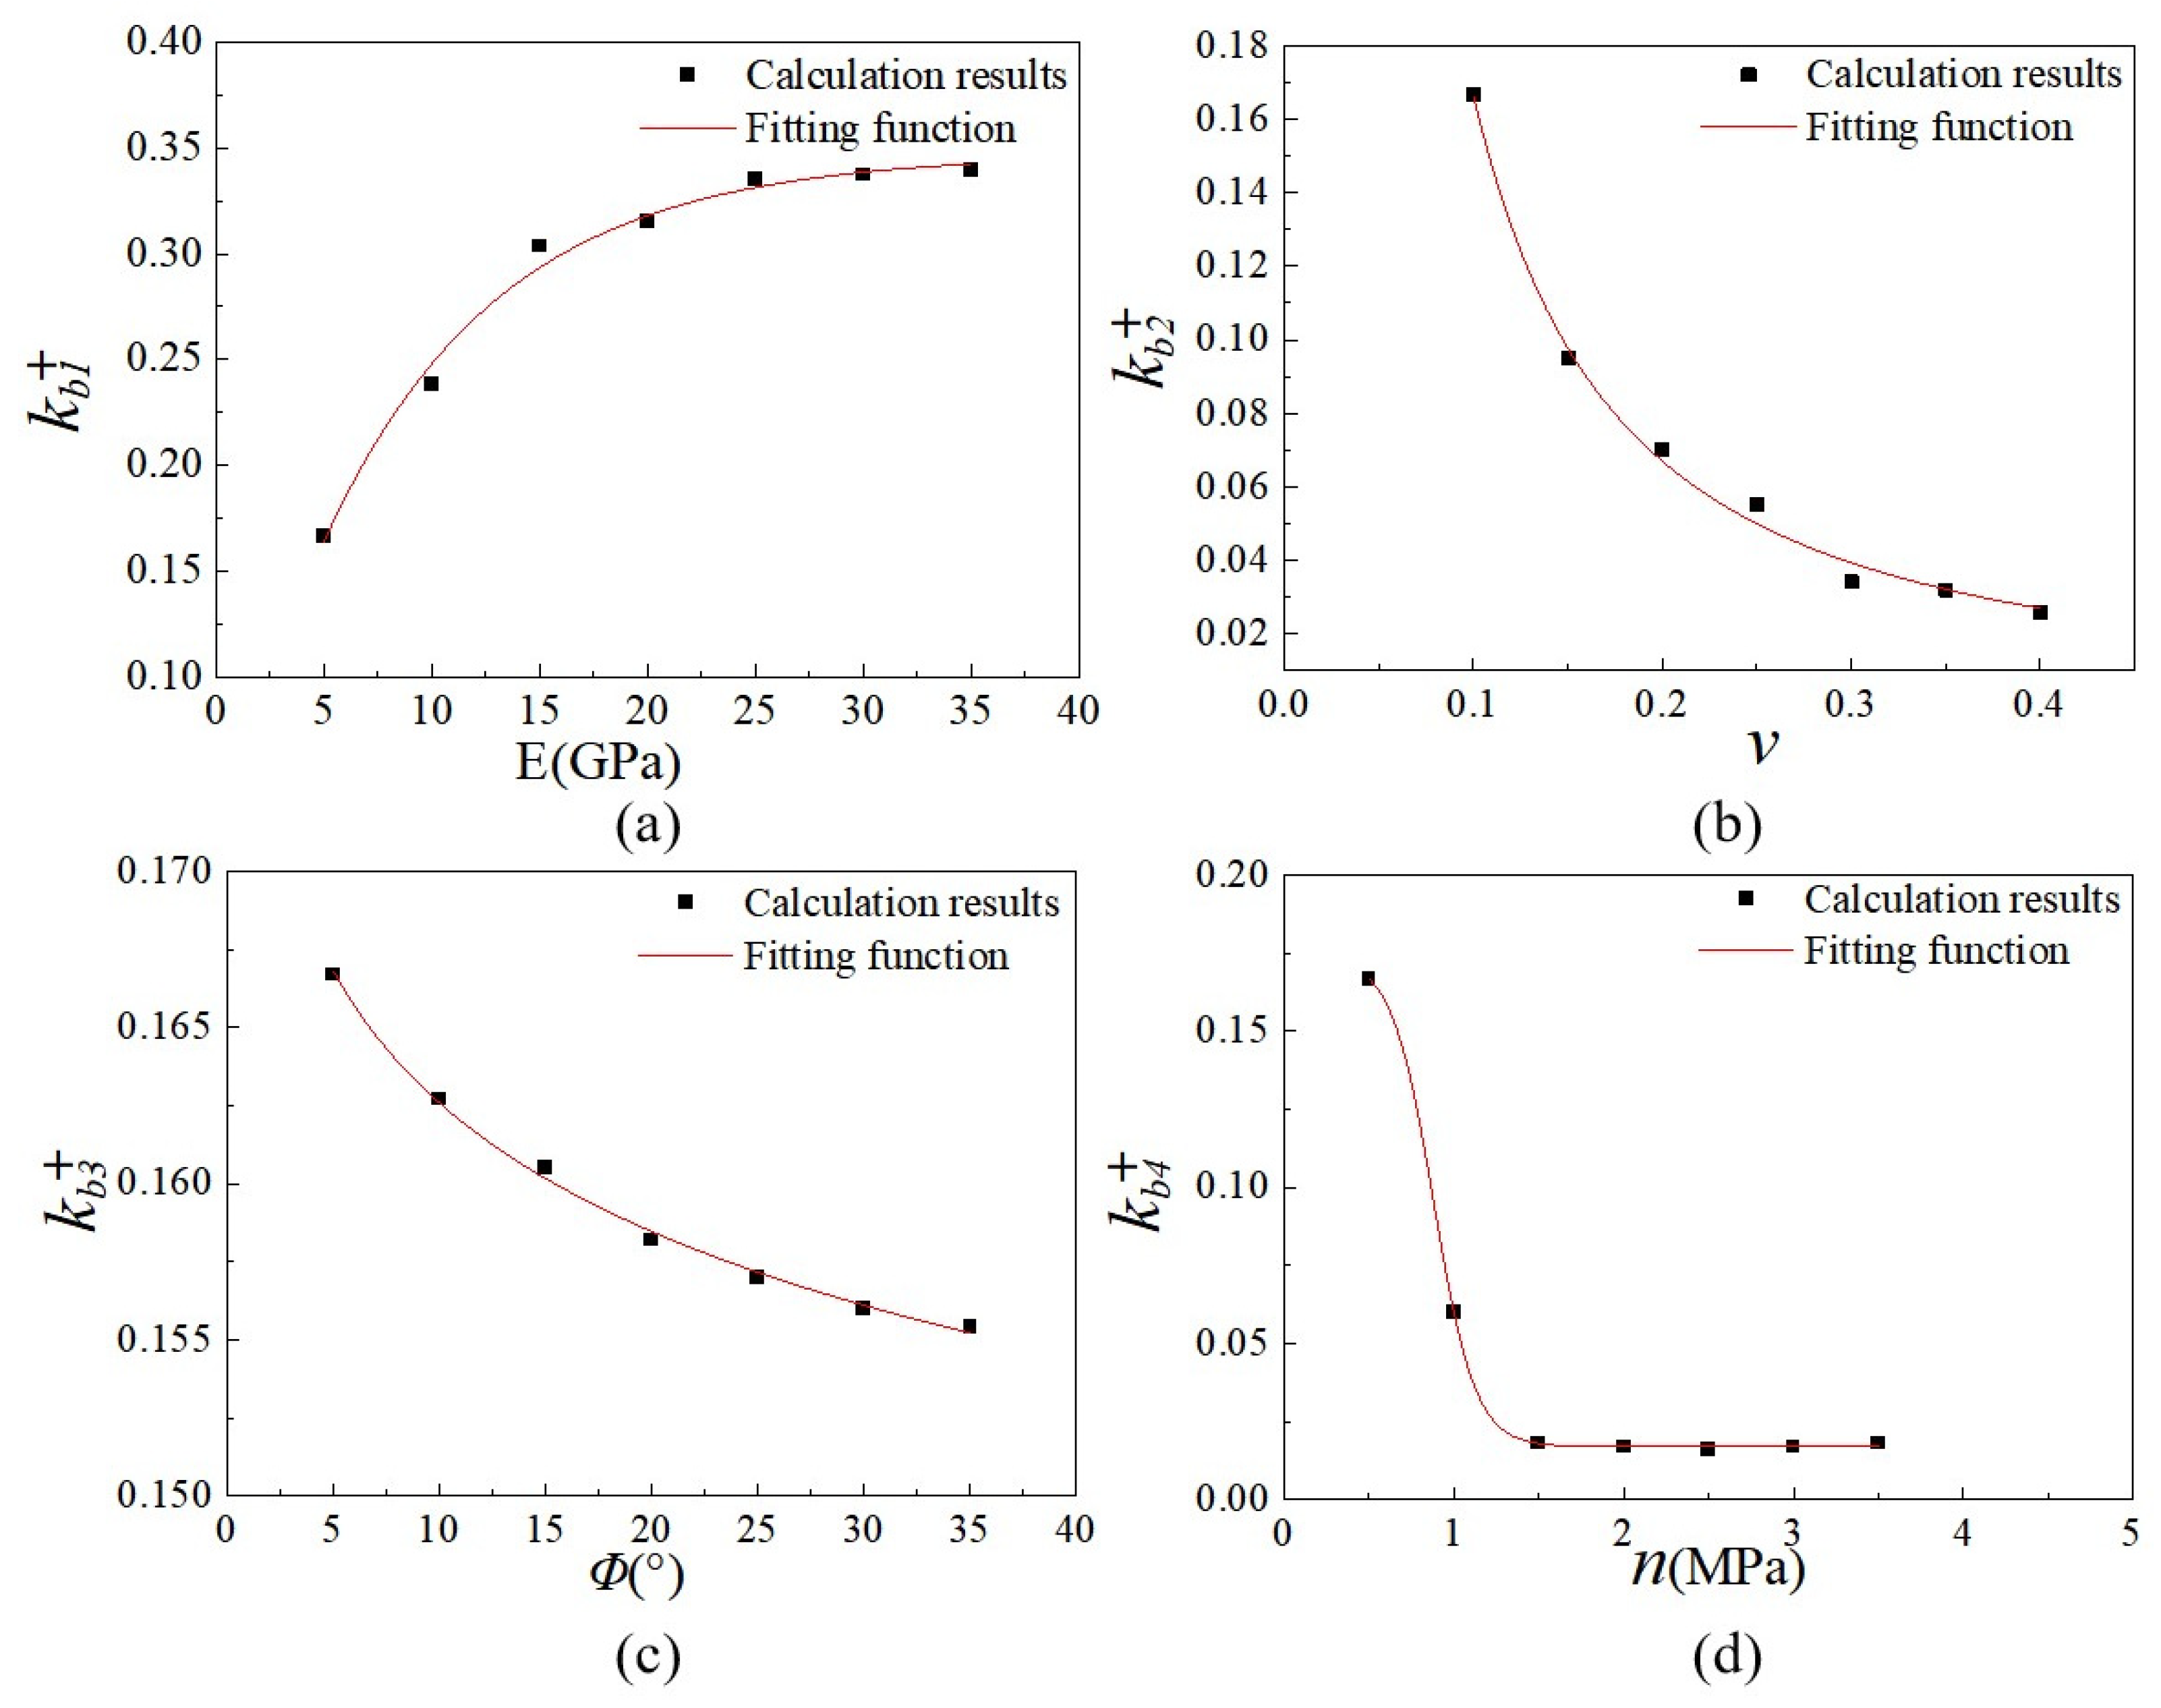
5.2. Sensitivity Analysis of Variables

The subplots in Figure 11 and Figure 12 are plotted from the data in Table 3 and fitted by the following functions as follows:
k b 1 + = 0.34 e x 1 8.14 + 0.35
k b 2 + = 0.01 x 2 1.31
k b 3 + = 0.18 x 3 0.04
k b 4 + = 0.02 + 0.16 1 + e x 3 0.88 0.12
The interdependence coefficients R c o d 2 in Equations (2)–(5) are 0.9905, 0.9952, 0.9972, and 0.9998, respectively, and satisfactory fitting results were obtained.
k b 1 = x 1 + 1.76 0.006 x 1 2 + 1.08 x 1 + 3.69
k b 2 = 0.73 + 0.001 e x 2 0.09
k b 3 = 0.72 x 3 0.01
k b 4 = 0.76 127.46 e x 4 0.07
The interdependence coefficients R c o d 2 in Equations (6)–(9) are 0.9991, 0.9959, 0.9956, and 1, respectively, and satisfactory fitting results were obtained.
Equations (2)–(9) show that tensile damage increases with elastic modulus, with a maximum difference of 0.173 and a change rate of 104%. The tensile damage increases with the decrease of the friction angle and Poisson’s ratio, with a maximum difference of 0.141 and 0.011 and a change rate of 84.5% and 6.8%, respectively. The tensile damage decreases with the increase of adhesive force and tends to a fixed value, with a maximum difference of 0.011 and a change rate of 6.8%.
For compressive damage, the tensile damage increases and then decreases with the increase in elastic modulus, with a maximum difference of 0.056 and a change rate of 7.7%. The compressive damage increases with the decrease of the friction angle and Poisson’s ratio, with a maximum difference of 0.097 and 0.012 and a change rate of 13.3% and 1.6%, respectively. The compressive damage decreases with the increase of adhesive force and tends to a fixed value, with a maximum difference of 0.011 and a change rate of 6.8%.
When n ≥ 1 MPa, the maximum compression damage no longer increases with the increase of cohesion. When the modulus of elasticity reaches 15 GPa, the ultimate tensile damage in the tunnel reaches 0.7850. With the increase of Poisson’s ratio and friction angle, the compression damage increases. Still, with the increase in Poisson’s ratio, the rate of change of the compression damage also increases, and with the increase in friction angle, the rate of change of the compression damage decreases.

5.3. Multivariate Regression

According to k b ± the fitting function of the formula, the evaluation expression of tunnel tensile/compression damage should be constructed as
k b + = k + k 1 k b 1 + + k 2 k b 2 + + k 3 k b 3 + + k 4 k b 4 +
k b = k + k 1 k b 1 + k 2 k b 2 + k 3 k b 3 + k 4 k b 4
Owing to a relationship with x 1 , x 2 , x 3 , and x 4 . Among them, k b 1 + = e x 1 8.14 , k b 2 + = e x 2 0.09 , k b 3 + = x 3 0.01 , k b 4 + = e x 4 0.067 , k b 1 = x 1 + 1.76 0.006 x 1 2 + 1.08 x 1 + 3.69 , k b 2 = e x 2 0.09 , k b 3 = x 3 0.01 , k b 4 = e x 4 0.07 , k , k 1 , k 2 , k 3 , and k 4 are constant terms. Therefore, the above coefficients can be obtained through multiple regression analysis. Then, the evaluation expression of tunnel tensile/compressive damage can be expressed as:
k b + = 0.11 0.33 e x 1 8.14 + 0.008 x 2 1.31 + 0.15 x 3 0.037 + 0.155 1 + e x 4 0.88 0.12
k b = 0.55 + 0.97 x 1 + 1.71 0.006 x 1 2 + 1.08 x 1 + 3.69 + x 2 e 0.09 10 3 + 0.63 x 3 0.009 126.52 e x 4 0.07
Equations (12) and (13) can be used for the siting and design of curved tunnels under the action of EI seismic waves. The surrounding rock layer needs to have a high modulus of elasticity.
Since the initial stress directly effects the damage to the tunnel structure, there is a strong relationship between the tunnel damage and the surrounding rock parameters. By fitting the function curves, the optimum value of the surrounding rock parameters can be determined so that the tunnel achieves the strongest seismic resistance.

6. Conclusions

The following are its primary conclusions:
(1)
Compared with straight tunnels, the curvature of curved tunnels caused the curved tunnels to experience radial deformation and tangential deformation and susceptibility to damage at the arch waist.
(2)
Curved tunnels under different surrounding rock strata have the same special deformation pattern during excitation, i.e., the damage changes in a cyclic manner, and the damage does not co-occur, due to a certain hysteresis of seismic waves in the tunnel.
(3)
The displacement of the curved tunnel is related to its compressive damage. The lining displacement parameter can be used to quantify the extent of damage to the tunnel structure. The extent of tunnel damage can be assessed by continuously monitoring the deformation of the tunnel. The curved tunnel must be strengthened when the displacement is greater than 76 mm.
(4)
Different parameters determine the seismic properties and the degree of damage of the bent body, and they have different effects on tensile and compressive damage. The modulus of elasticity has the greatest effect on tensile damage, while Poisson’s ratio and cohesion have the least effect on tensile damage. Friction angle has the greatest effect on compressive damage, and Poisson’s ratio has a smaller effect on compressive damage.
(5)
The multi-factor assessment formula that was produced directs the surrounding rock reinforcement following the geological circumstances and contributes to the appropriate support for a curved tunnel. The method is generic, although its application conditions have some restrictions.

Author Contributions

Methodology, S.B. and X.F.; data curation, software, L.Y. and Y.X.; validation, S.L.; writing—review and editing, S.B.; funding acquisition, S.L. and F.Y. All authors have read and agreed to the published version of the manuscript.

Funding

This research was funded by the Industry-University-Research cooperation Project of the Jiangsu Province of China (grant number BY2022075) and the Natural Science Foundation of the Jiangsu Higher Education Institutions of China (grant number 18KJB560001). Changzhou Leading Innovative Talents Introduction and Cultivation Project (grant number CQ20220100).

Institutional Review Board Statement

Not applicable.

Informed Consent Statement

Not applicable.

Data Availability Statement

The data used to support the findings of this study are available from the corresponding author upon request.

Conflicts of Interest

The authors declare no conflict of interest.

References

  1. Song, D.; Liu, X.; Chen, Z.; Chen, J.; Cai, J. Influence of Tunnel Excavation on the Stability of a Bedded Rock Slope: A Case Study on the Mountainous Area in Southern Anhui, China. KSCE J. Civ. Eng. 2021, 25, 114–123. [Google Scholar] [CrossRef]
  2. Song, D.; Liu, X.; Huang, J.; Zhang, J. Energy-based analysis of seismic failure mechanism of a rock slope with discontinuities using Hilbert-Huang transform and marginal spectrum in the time-frequency domain. Landslides 2021, 18, 105–123. [Google Scholar] [CrossRef]
  3. Feng, D.; Ren, X.; Li, J. Cyclic behavior modeling of reinforced concrete shear walls based on softened damage-plasticity model. Eng. Struct. 2018, 166, 363–375. [Google Scholar] [CrossRef]
  4. Yu, H.; Li, X.; Li, P. Analytical solution for vibrations of a curved tunnel on viscoelastic foundation excited by arbitrary dynamic loads. Tunn. Undergr. Space Technol. 2022, 120, 104307. [Google Scholar] [CrossRef]
  5. Yan, Q.; Xu, Y.; Zhang, W.; Geng, P.; Yang, W. Numerical analysis of the cracking and failure behaviors of segmental lining structure of an underwater shield tunnel subjected to a derailed high-speed train impact. Tunn. Undergr. Space Technol. 2018, 72, 41–54. [Google Scholar] [CrossRef]
  6. Gong, F.Q.; Luo, Y.; Liu, D.Q. Simulation tests on spalling failure in deep straight-wall-top-arch tunnels. Yantu Gongcheng Xuebao/Chin. J. Geotech. Eng. 2019, 41, 1091–1100. [Google Scholar] [CrossRef]
  7. Xie, J.; Bao, S.-X.; Hu, Y.-F.; Ni, Y.J.; Li, Y.T. Design and experimental research on model soils used for shaking table tests of superstructure-soil-tunnel interaction system. Yantu Gongcheng Xuebao/Chin. J. Geotech. Eng. 2020, 42, 476–485. [Google Scholar] [CrossRef]
  8. Wang, Z.; Yang, J.; Wang, X. 3D Dynamic Response of Portal Section of Elliptical Mountain Tunnel under Action of SH Waves. Tiedao Xuebao/J. China Railw. Soc. 2022, 44, 150–157. [Google Scholar] [CrossRef]
  9. Kang, X.; Jiang, L.; Bai, Y.; Caprani, C.C. Seismic damage evaluation of high-speed railway bridge components under different intensities of earthquake excitations. Eng. Struct. 2017, 152, 116–128. [Google Scholar] [CrossRef]
  10. Zhang, Z.; Jiang, Y.; Liu, M.; Gong, J. Rock pressure of shallow unsymmetrical-loading tunnels considering the cohesion and earthquake action. Zhongguo Kuangye Daxue Xuebao/J. China Univ. Min. Technol. 2018, 47, 780–790. [Google Scholar] [CrossRef]
  11. Zhang, W.; Jiao, Y.; Zhang, G. Analysis of Longitudinal Seismic Response of Large Section Shield Tunnel with Complex Stratum. Constr. Technol. 2019, 48, 48–51. [Google Scholar] [CrossRef]
  12. Park, K.H.; Tontavanich, B.; Lee, J.G. A simple procedure for ground response curve of circular tunnel in elastic-strain softening rock masses. Tunn. Undergr. Space Technol. 2008, 23, 151–159. [Google Scholar] [CrossRef]
  13. Alejano, L.; Rodriguez-Dono, A.; Alonso, E.; Fdez.-Manín, G. Ground reaction curves for tunnels excavated in different quality rock masses showing several types of post-failure behaviour. Tunn. Undergr. Space Technol. 2009, 24, 689–705. [Google Scholar] [CrossRef]
  14. Oucif, C.; Voyiadjis, G.Z.; Rabczuk, T. Modeling of damage-healing and nonlinear self-healing concrete behavior: Application to coupled and uncoupled self-healing mechanisms. Theor. Appl. Fract. Mech. 2018, 96, 216–230. [Google Scholar] [CrossRef]
  15. Ma, S.J.; Chi, M.J.; Chen, H.J.; Chen, S. Implementation of viscous-spring boundary in ABAQUS and comparative study on seismic motion input methods. Yanshilixue Yu Gongcheng Xuebao/Chin. J. Rock Mech. Eng. 2020, 39, 1445–1457. [Google Scholar] [CrossRef]
  16. GB50010-2010; Code for Design of Concrete Structures. Ministry of Housing and Urban-Rural Development of the People’s Republic of China: Beijing, China, 2010; ISBN 1511217966.
  17. Liu, C.; Zhang, D.; Zhang, S. Characteristics and treatment measures of lining damage: A case study on a mountain tunnel. Eng. Fail. Anal. 2021, 128, 105595. [Google Scholar] [CrossRef]
  18. Yan, G.; Gao, B.; Shen, Y.; Zheng, Q.; Fan, K.; Huang, H. Shaking Table Tests on Seismic Response of Tunnel with Longitudinal Cracking Lining. J. Southwest Jiaotong Univ. 2020, 23, 248–262. [Google Scholar] [CrossRef]
  19. Bielak, J. Domain Reduction Method for Three-Dimensional Earthquake Modeling in Localized Regions, Part I: Theory. Bull. Seismol. Soc. Am. 2003, 93, 817–824. [Google Scholar] [CrossRef]
  20. Bielak, J. Domain Reduction Method for Three-Dimensional Earthquake Modeling in Localized Regions, Part II: Verification and Applications. Bull. Seismol. Soc. Am. 2003, 93, 825–841. [Google Scholar] [CrossRef]
  21. Pang, R.; Xu, B.; Zhou, Y.; Song, L. Seismic time-history response and system reliability analysis of slopes considering uncertainty of multi-parameters and earthquake excitations. Comput. Geotech. 2021, 136, 104245. [Google Scholar] [CrossRef]
  22. Pang, R.; Xu, B.; Zhou, Y.; Chen, G.; Jing, M. Stochastic main shock-aftershock simulation and its applications in dynamic reliability of structural systems via DPIM. J. Eng. Mech. 2023, 149, 04022096. [Google Scholar] [CrossRef]
  23. Pang, R.; Xu, B.; Zhou, Y.; Zhang, X.; Wang, X. Fragility analysis of high CFRDs subjected to mainshock-aftershock sequences based on plastic failure. Eng. Struct. 2020, 206, 110152. [Google Scholar] [CrossRef]
  24. Liu, J.W.; Shi, C.H.; Lei, M.F.; Peng, L.M.; Wang, Z.X. Damage mechanism of shield tunnel under unloading based on concrete damage model. J. Cent. South Univ. (Nat. Sci. Ed.) 2021, 123, 105261. [Google Scholar] [CrossRef]
  25. Zhang, Y.J.; Chen, L.; Xie, P.C.; Tang, B.J.; Shen, H.J. Rate dependence of damage factors in ABAQUS concrete damage plasticity model and its realization method. Explos. Shock. Waves 2022, 42, 103103. [Google Scholar] [CrossRef]
  26. Liu, Q.J.; Zhao, M.J.; Wang, L.H. Scattering of plane P, SV or Rayleigh waves by a shallow lined tunnel in an elastic half space. Soil Dyn. Earthq. Eng. 2013, 49, 52–63. [Google Scholar] [CrossRef]
  27. Amorosi, A.; Boldini, D. Numerical modelling of the transverse dynamic behaviour of circular tunnels in clayey soils. Soil Dyn. Earthq. Eng. 2009, 29, 1059–1072. [Google Scholar] [CrossRef]
  28. Zhao, G.; Gardoni, P.; Xu, L.; Shu, F.; Xie, L. Probabilistic seismic demand models for circular tunnels subjected to transversal seismic load. Tunn. Undergr. Space Technol. 2022, 125, 104527. [Google Scholar] [CrossRef]
  29. Chen, Y.; Qiao, C. Derivation method and application of plastic damage factor of ABAQUS concrete. New Mater. New Decor. 2022, 4, 4–6. [Google Scholar] [CrossRef]
  30. Ye, Z.; Liu, H. Investigating the relationship between erosion-induced structural damage and lining displacement parameters in shield tunnelling. Comput. Geotech. 2021, 133, 104041. [Google Scholar] [CrossRef]
  31. Ding, W.; Gong, C.; Mosalam, K.M.; Soga, K. Development and application of the integrated sealant test apparatus for sealing gaskets in tunnel segmental joints. Tunn. Undergr. Space Technol. 2017, 63, 54–68. [Google Scholar] [CrossRef]
  32. Xin, C.L.; Wang, Z.Z.; Yu, J. The evaluation on shock absorption performance of buffer layer around the cross section of tunnel lining. Soil Dyn. Earthq. Eng. 2020, 131, 106032. [Google Scholar] [CrossRef]
Figure 1. Stress–strain relationship of concrete under uniaxial tension and compression.
Sustainability 15 04905 g001
Figure 2. Comparison between the test data and simulation. (a) Tension; (b) compression.
Sustainability 15 04905 g002
Figure 3. Changzhou Metro Line 2.
Sustainability 15 04905 g003
Figure 4. Laboratory indoor experiment. (a) Material and scale model; (b) tunnel model experiment; (c) model experiment method and process.
Sustainability 15 04905 g004
Figure 5. Time history curve and Fourier diagram of seismic wave. (a) Acceleration time-history curve; (b) Fourier diagram.
Sustainability 15 04905 g005
Figure 6. Layout of monitoring points.
Sustainability 15 04905 g006
Figure 7. Curved tunnel-surrounding rock finite element model. (a) Curved tunnel-surrounding rock model grid diagram; (b) local mesh diagram of tunnel model.
Sustainability 15 04905 g007
Figure 8. Tunnel acceleration. (a) Acceleration of measurement point 1; (b) acceleration of measurement point 2.
Sustainability 15 04905 g008
Figure 9. Damage diagram of curved tunnel. (a) Compressive damage; (b) tensile damage.
Sustainability 15 04905 g009
Figure 10. The exit of the curved tunnel. (a) Displacement; (b) compressive damage.
Sustainability 15 04905 g010
Figure 11. Influence of surrounding rock parameters on tensile damage. (a) Influence of elastic modulus on tensile damage; (b) effect of Poisson’s ratio on tensile damage; (c) influence of friction angle on tensile damage; (d) influence of cohesion on tensile damage.
Sustainability 15 04905 g011
Figure 12. Influence of surrounding rock parameters on compression damage. (a) Influence of elastic modulus on compression damage; (b) influence of Poisson’s ratio on compression damage; (c) influence of friction angle on compression damage; (d) influence of cohesion on compression damage.
Sustainability 15 04905 g012
Table 1. Similarity relationship and similarity ratio.
Physical QuantitySimilaritySimilarity Ratio
Geometric propertieslength C L 1:100
Material propertiesdensitySurrounding rock layer C ρ 1:1
Curved tunnel
elastic modulusSurrounding rock layer C E 1:100
Curved tunnel
Poisson’s ratio C μ 1:1
friction angle C φ 1:1
strain C ε 1:1
stressSurrounding rock layer C σ = C E · C ε 1:100
Curved tunnel
Dynamic characteristicsfrequency C f = 1 C t 100
time C t = C L C a 1:100
speed C v = C L C a 10
acceleration C a 1
Table 2. Similarity of the mechanical parameters.
Physical QuantityElastic Modulus
E (GPa)
Poisson’s Ratio
υ
Density
ρ (kg·m3)
Friction Angle
Φ (°)
Cohesion
n (MPa)
Surrounding rock5–350.1–0.421005–350.5–3.5
Lining450.22500--
Table 3. Different surrounding rock parameters for numerical simulations.
ProjectElastic Modulus E
GPa
Poisson’s Ratio υ Friction Angle Φ
°
Cohesion n
MPa
150.150.5
2100.150.5
3150.150.5
4200.150.5
5250.150.5
6300.150.5
7350.150.5
850.150.5
950.1550.5
1050.250.5
1150.2550.5
1250.350.5
1350.3550.5
1450.450.5
1550.150.5
1650.1100.5
1750.1150.5
1850.1200.5
1950.1250.5
2050.1300.5
2150.1350.5
2250.150.5
2350.151
2450.151.5
2550.152
2650.152.5
2750.153
Table 4. Relationship between rock layer parameters and k b .
Parameter Variables and the Value of k b
E (GPa)5101520253035
k b + 0.16670.23810.30360.31550.33530.33730.3393
k b 0.72920.77630.78500.78320.77330.76100.7495
υ 0.10.150.20.250.30.350.4
k b + 0.16670.0950.06910.05510.03410.03190.0258
k b 0.72920.73230.73830.74820.76140.77950.8259
Φ (°)5101520253035
k b + 0.16670.16270.16050.15820.15710.15990.1554
k b 0.72920.73310.7360.73810.73950.74040.7409
n (MPa)0.511.52.02.53.03.5
k b + 0.16670.05980.01790.01790.01790.01790.0179
k b 0.72920.80250.80250.80250.80250.80250.8025
Disclaimer/Publisher’s Note: The statements, opinions and data contained in all publications are solely those of the individual author(s) and contributor(s) and not of MDPI and/or the editor(s). MDPI and/or the editor(s) disclaim responsibility for any injury to people or property resulting from any ideas, methods, instructions or products referred to in the content.

