Article

Drought Stress Restoration Frequencies of Phenotypic Indicators in Early Vegetative Stages of Soybean (Glycine max L.)

1
Gene Engineering Division, National Institute of Agricultural Science, Jeonju 54874, Republic of Korea
2
Department of Plant Resources and Environment, Jeju National University, Jeju 63243, Republic of Korea
*
Author to whom correspondence should be addressed.
These authors contributed equally in this work.
Sustainability 2023, 15(6), 4852; https://doi.org/10.3390/su15064852
Submission received: 27 December 2022 / Revised: 25 February 2023 / Accepted: 7 March 2023 / Published: 9 March 2023
(This article belongs to the Special Issue Study on Influencing Factors of Sustainable Crop Production)

Abstract

:
The damage to crops due to drought is severe, and it is further exacerbated by global warming. Therefore, efforts to breed drought-resistant cultivars are being actively conducted. Various research to develop drought-resistant and sustainable cultivars of soybean (Glycine max L.), the most popular legume crop worldwide, are conducted, but it is biased toward the reproductive stages that are most severely affected by drought. There are few studies on the effect of drought stress on the vegetative stages due to a relatively small effect on the final product, but it is an important factor. Therefore, plants were subjected to 5% soil moisture for 14 days to assess the effect of drought at three different vegetative stages, and we measured the number of nodes of the main stem, the total number of nodes, and the number of pods. Although most of the unstressed soybean plants were dominant against the drought-stressed plants in certain cultivars, side node formation or the total number of nodes and the number of pods were reversed. Our results suggested that investigated response of phenotypic traits might be used as a selection indicator for drought-resistant soybean cultivars with further research and sustainability.

1. Introduction

Drought causes crucial losses to agricultural industries due to prolonged water deficit and a high-temperature environment [1]. Drought stress reduces the growth and reproduction of crops and, in severe cases, they wither to death [2]. The water deficit condition results in photosynthesis reduction by stomata closing, a decrease in carbon fixation efficiency, leaf formation and expansion suppression, and leaf shedding inductions [3,4]. Heat stress secondary to drought also negatively affects plants with consequences on total photosynthesis performance by reducing leaf water potential, leaf area, pre-mature leaf senescence, carbohydrate depletion, and plant starvation [5,6]. An increase in drought occurrences due to global warming has forced the agricultural industry to find out methods for reducing yield loss [7]. Drought stress susceptibility differs depending on crop varieties and species [8]. Thus, plant breeding is the most efficient and sustainable method to combat drought impacts on crops [9].
Like other crops, soybean (Glycine max L.), the most legume-consumed crop worldwide, needs to be supplied with sufficient water and optimal environmental conditions during its vegetative and reproduction periods [10]. To overcome drought’s negative impacts on soybeans through plant breeding, the drought stress response of various soybean varieties should be investigated, and morphological traits for selection for drought-resistant cultivars should be assessed as a phenotypic indicator.
Morphological traits, such as the number of main stem nodes, side stem nodes, and the total number of nodes, start to develop at vegetative growth and have a great influence on the formation of pods [11]. The inhibition in water absorption due to drought stress reduces the development of most plant organs, including the morphological traits at vegetative growth. During the vegetative stage of soybean, the plant accumulates nutrients for growth and flowering, which reflected stem elongation and differentiation of branching-induced nodes to produce pods and the process of synthesizing nutrients through photosynthesis by forming leaves and increasing water and nutrient absorption through the expansion of the root area [12]. Thereby, the onset of drought stress at the vegetative stage causes a substantial decrease in overall growth parameters, such as the formation of plant organs [13].
The damage of drought stress influences both soybean growth and reproduction, and the reproductive stage is the most negatively affected. The reproductive stages begin with flowering and plant maturation for the development of pods and seeds. Drought conditions have been reported to have a more lethal effect in the reproductive stage than in the vegetative growth stage, showing the greatest damage in R4 (reproductive stage 4), which forms flower buds by initiating a decrease in the flowering period [14,15]. The formation of reproductive plant organs relies on the development of morphological traits at vegetative stages. Likewise, the formation of soybean pods and seed fillings, which are the yield components of soybean, fundamentally rely on stem node development [11]. However, the morphological traits tend to be neglected as selection indicators in soybean studies when those were developed and measured at the vegetative growth stages. Moreover, morphological traits at vegetative and reproductive stages are used in the determination of soybean final yield [11].
We treated fourteen days of drought stress in three different early vegetative stages (V2, V3, and V4; vegetative stage) to investigate the effects of drought stress on morphological traits and their final yields in each vegetative stage. Twenty-eight soybean varieties of nested association mapping (NAM) population parents were used, and the drought treatment period was determined by the maximum limit before the permanent wilting point at the environment with under 5% of soil moisture in the experimental site, and the final yielding date when the 90% of the soybean individuals developed a fully matured pod. In most varieties, drought-stressed individuals showed a lag in the occurrence of morphological traits, but pod formation, branching, and node formation were more activated in some varieties under drought treatment in the early vegetative stages. We hypothesized that the morphological traits that start developing in the early vegetative stages of soybean would respond differently depending on the drought-stressed period, and that each would have some certain relationship. Therefore, vegetative drought response characteristics and these characteristics showing unique patterns in several varieties were observed. We found that drought treatment at early vegetative stages activated the development of several morphological traits. We hope our results might contribute to drought-resistant breeding.

2. Results

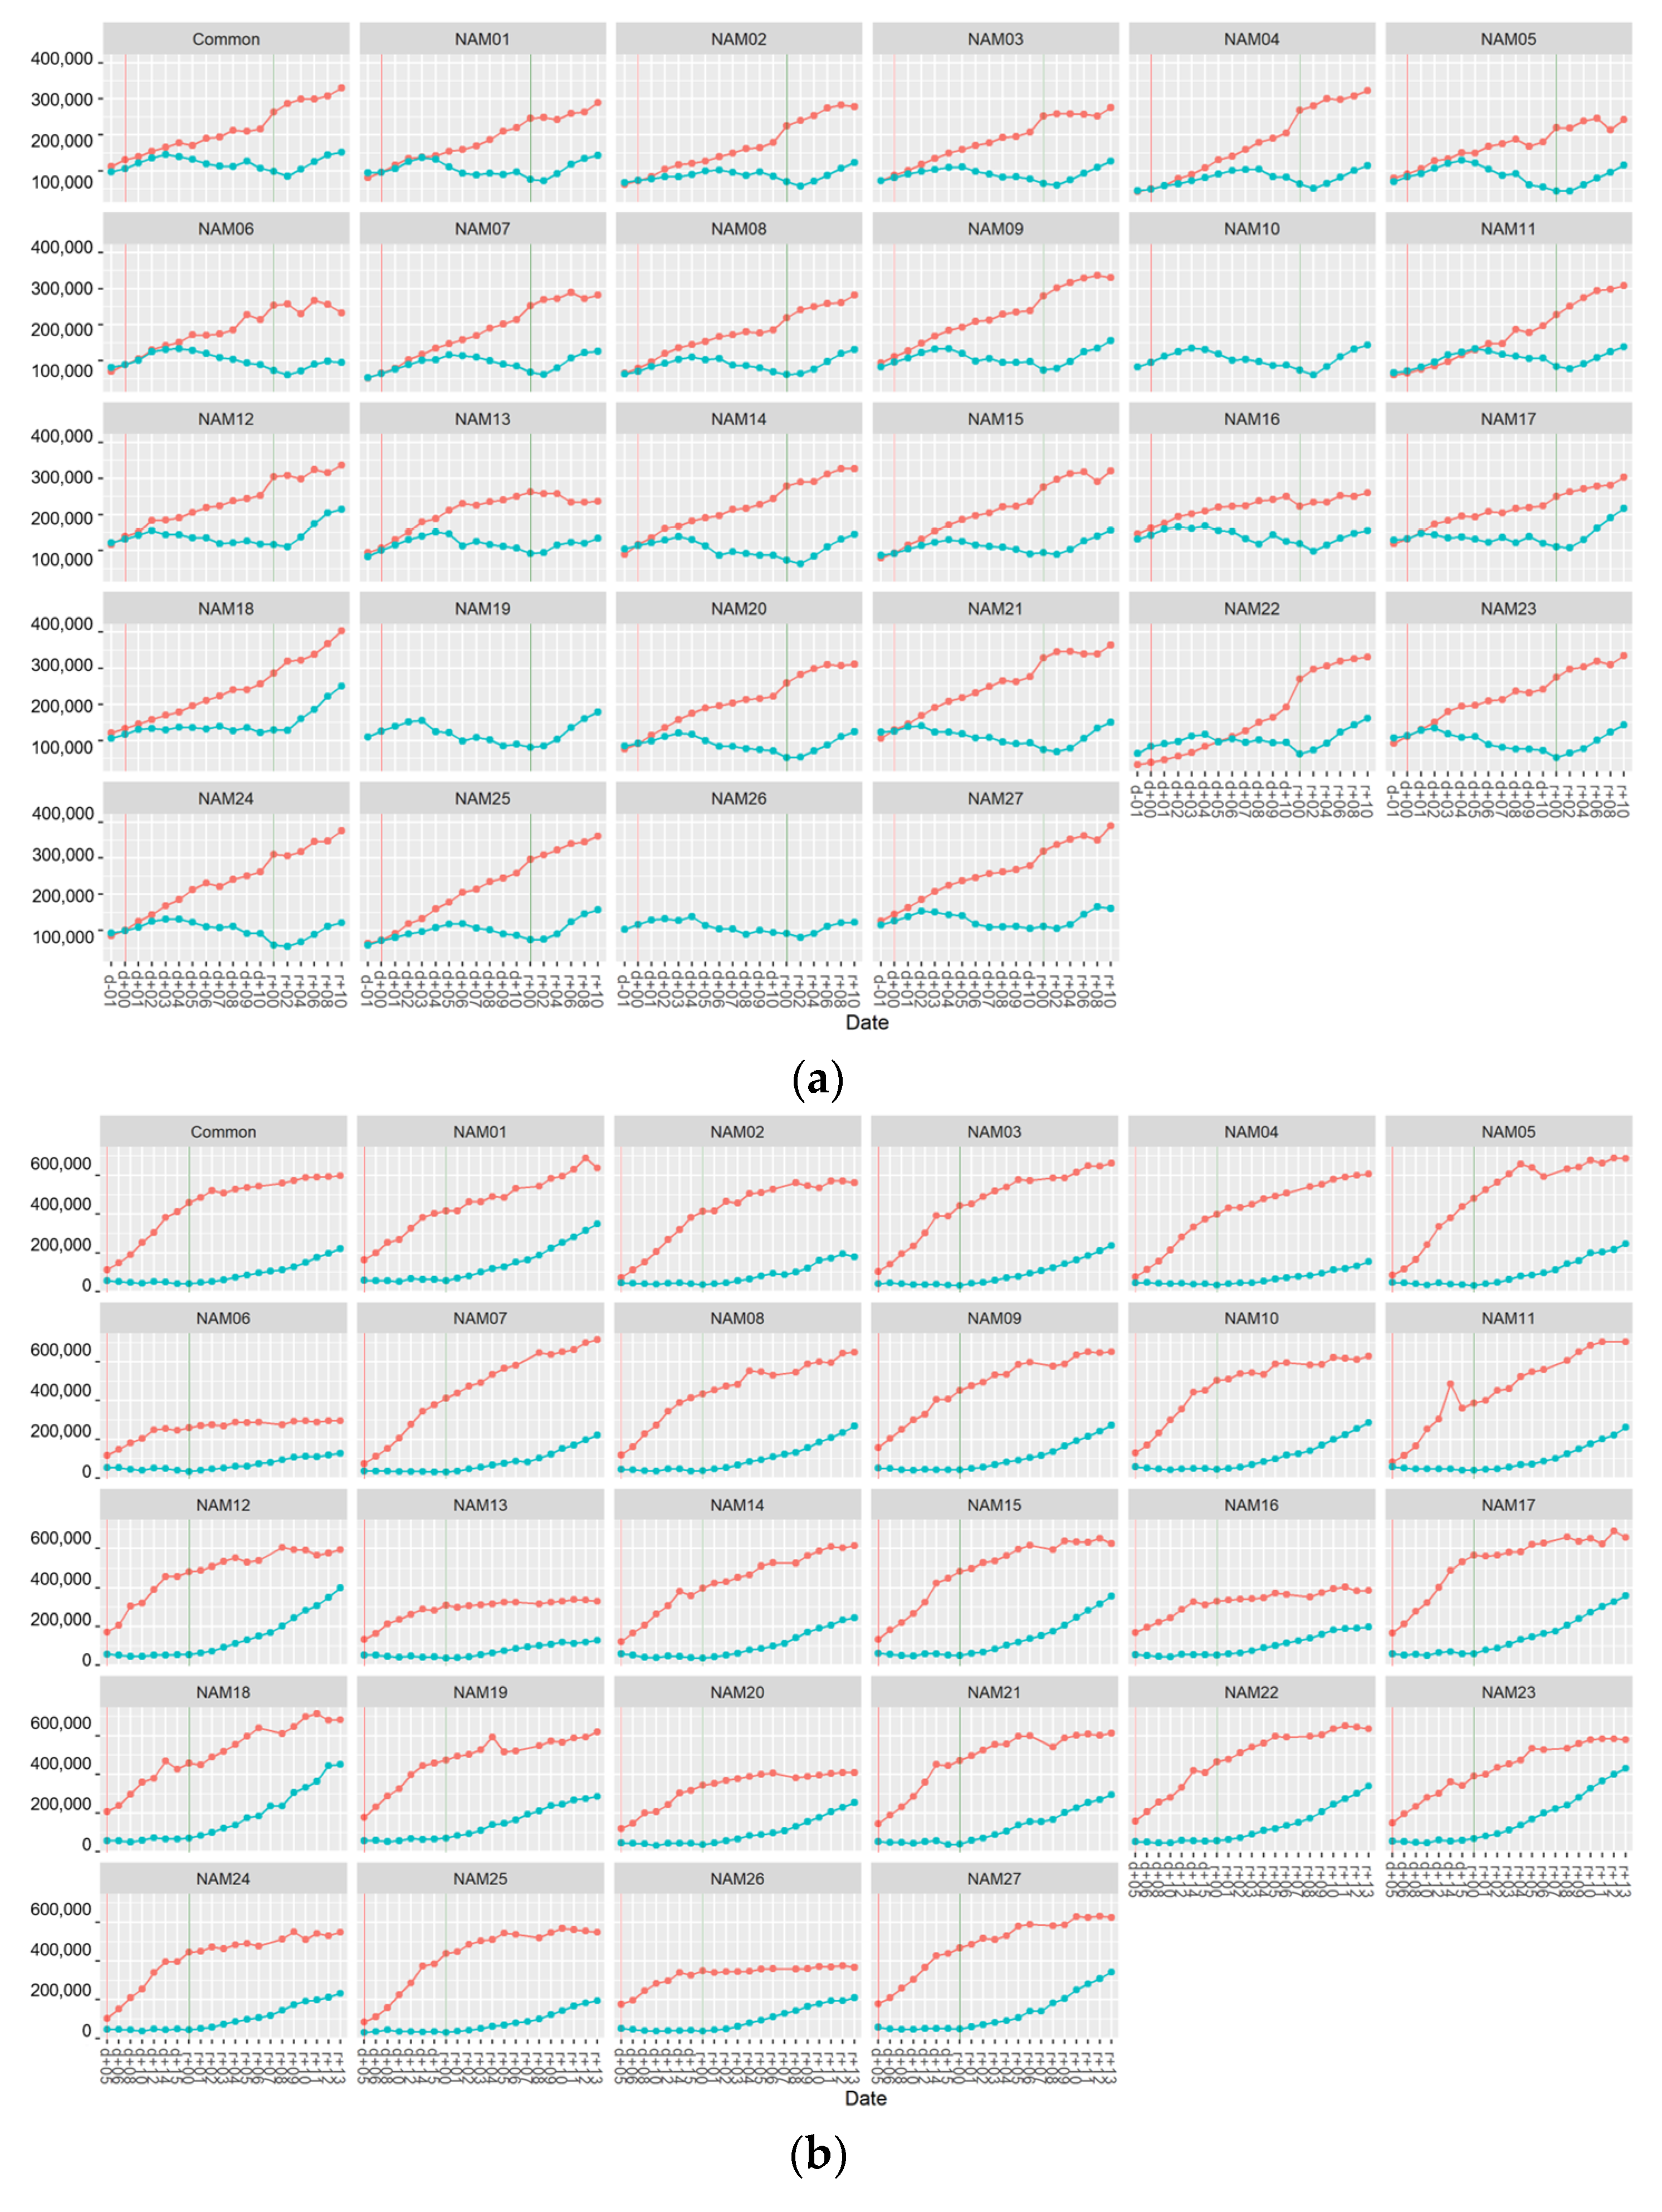
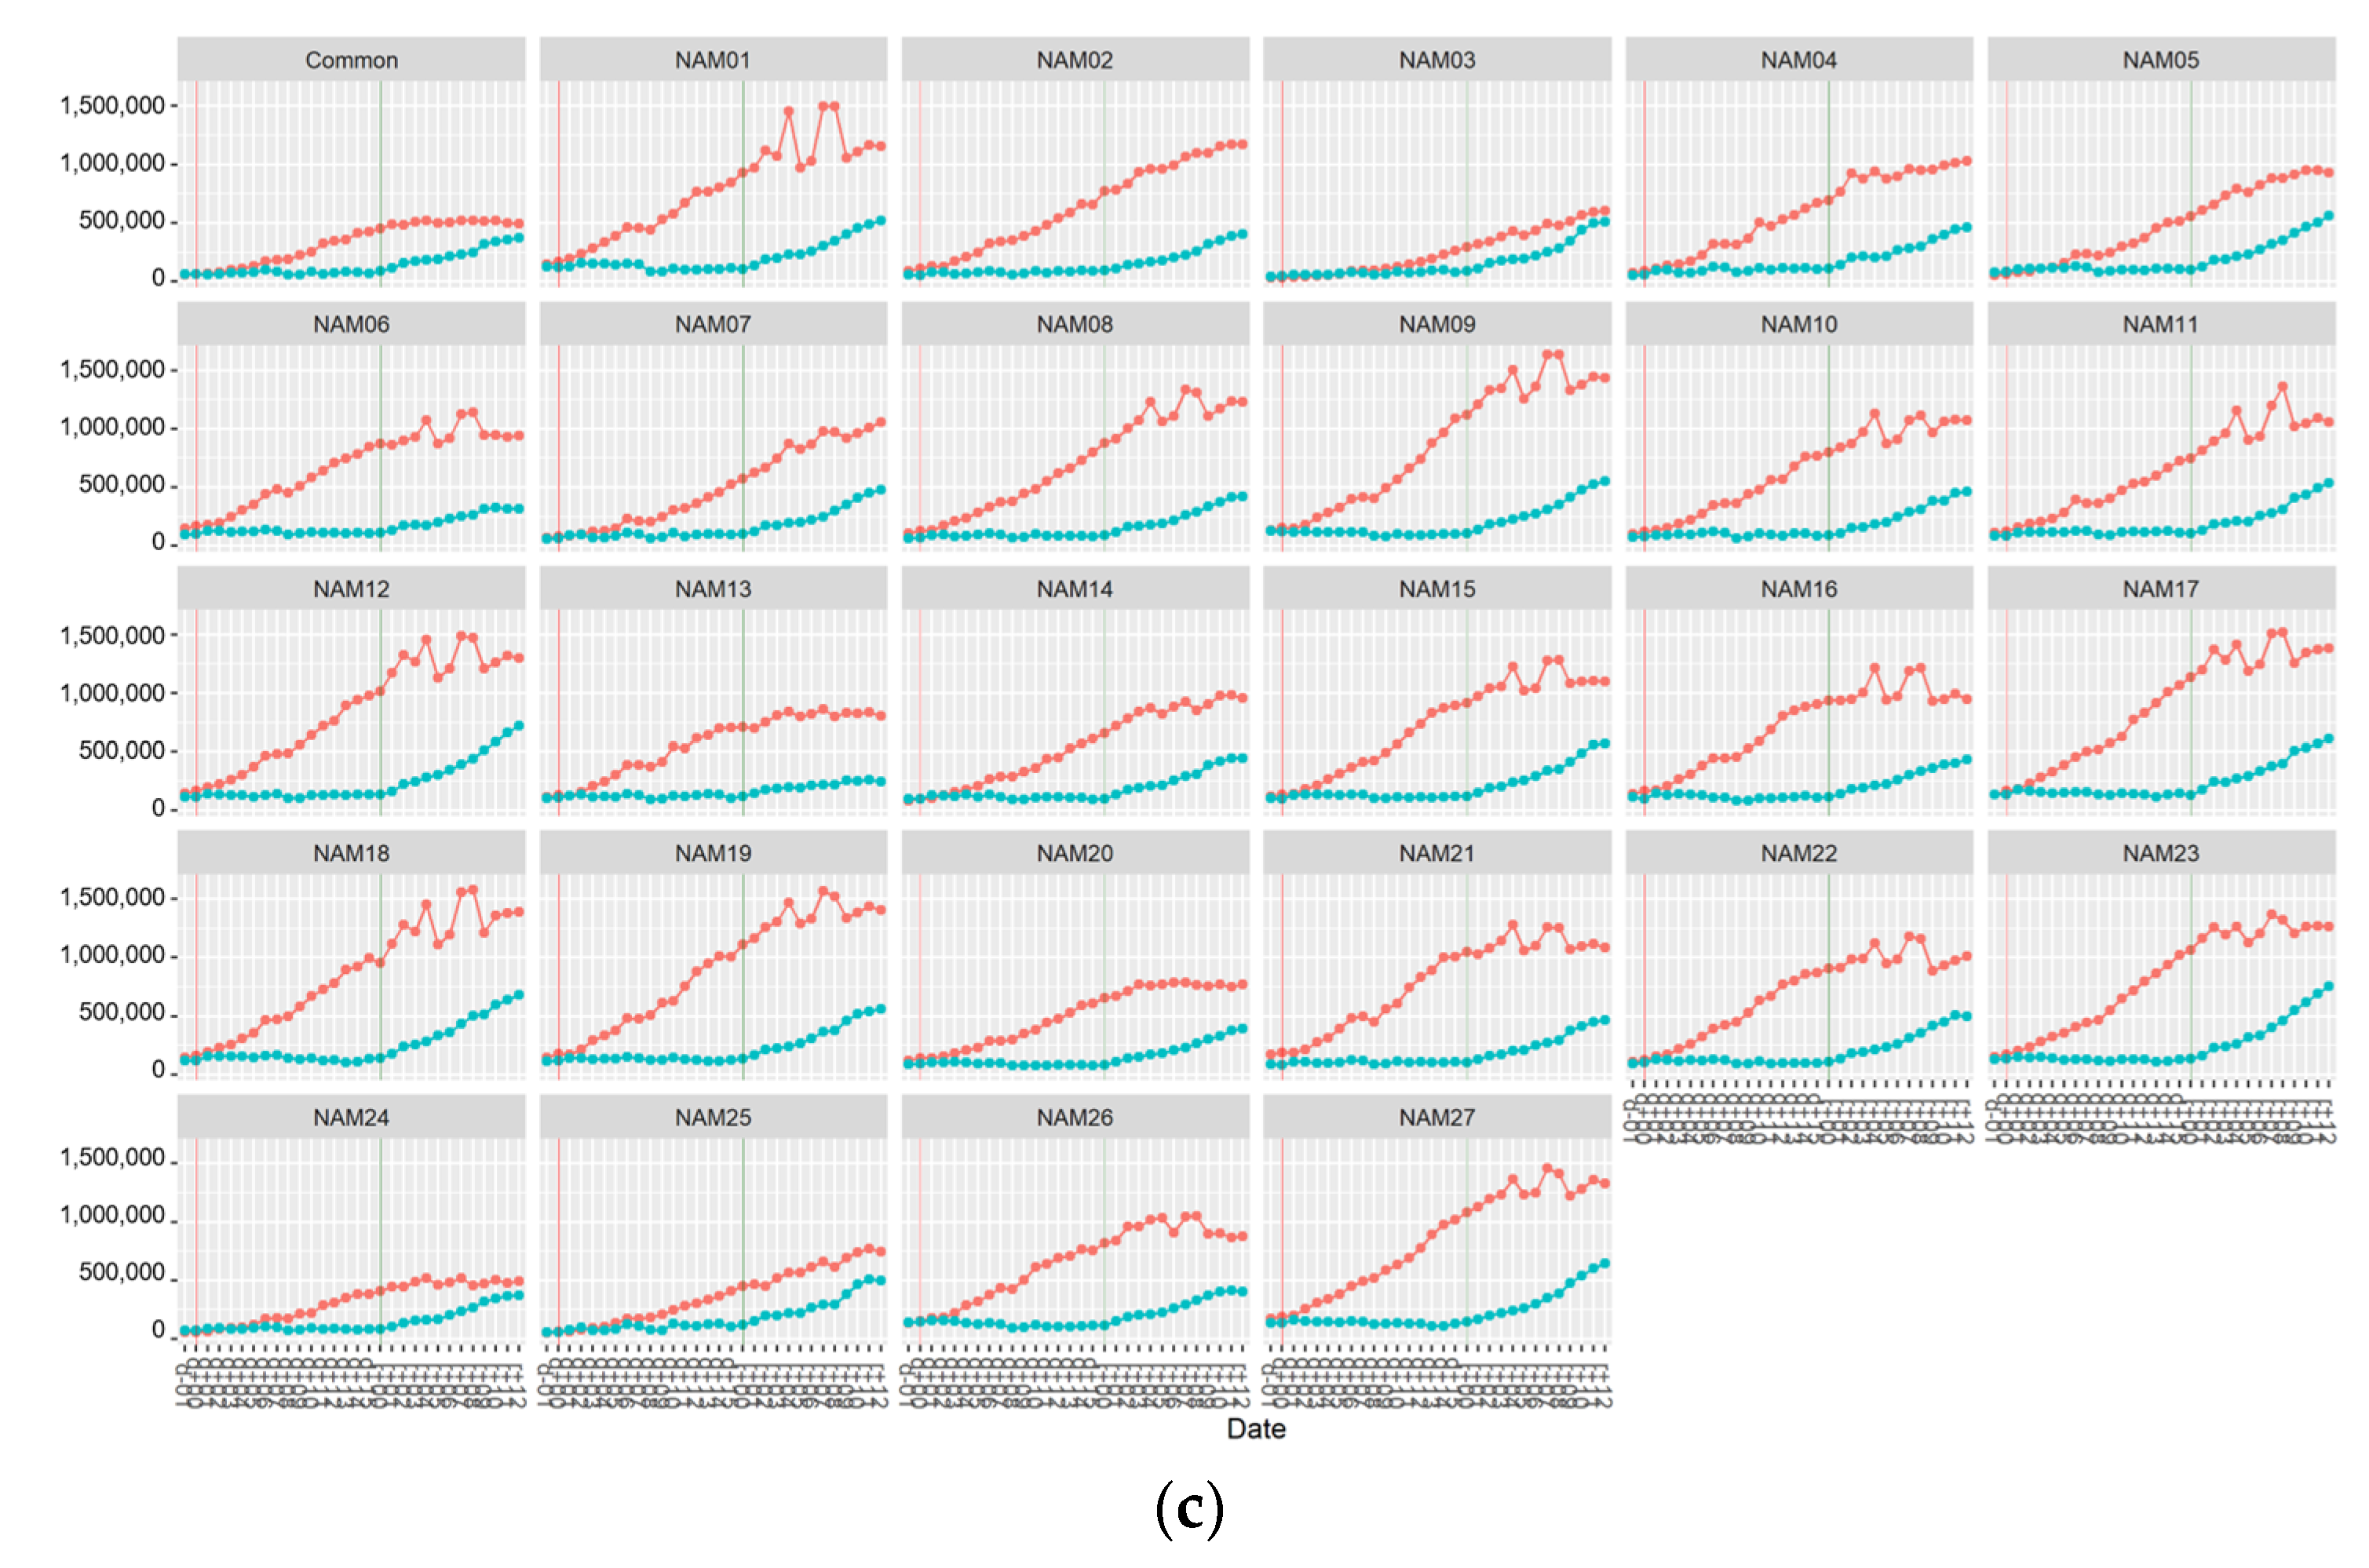
2.1. Morphological Traits

The number of main nodes and total nodes were counted. The pods and area data were visualized as line plots at each drought-treated stage and variety. The missing data were excluded. The NAM population parent varieties are shown in Table 1.

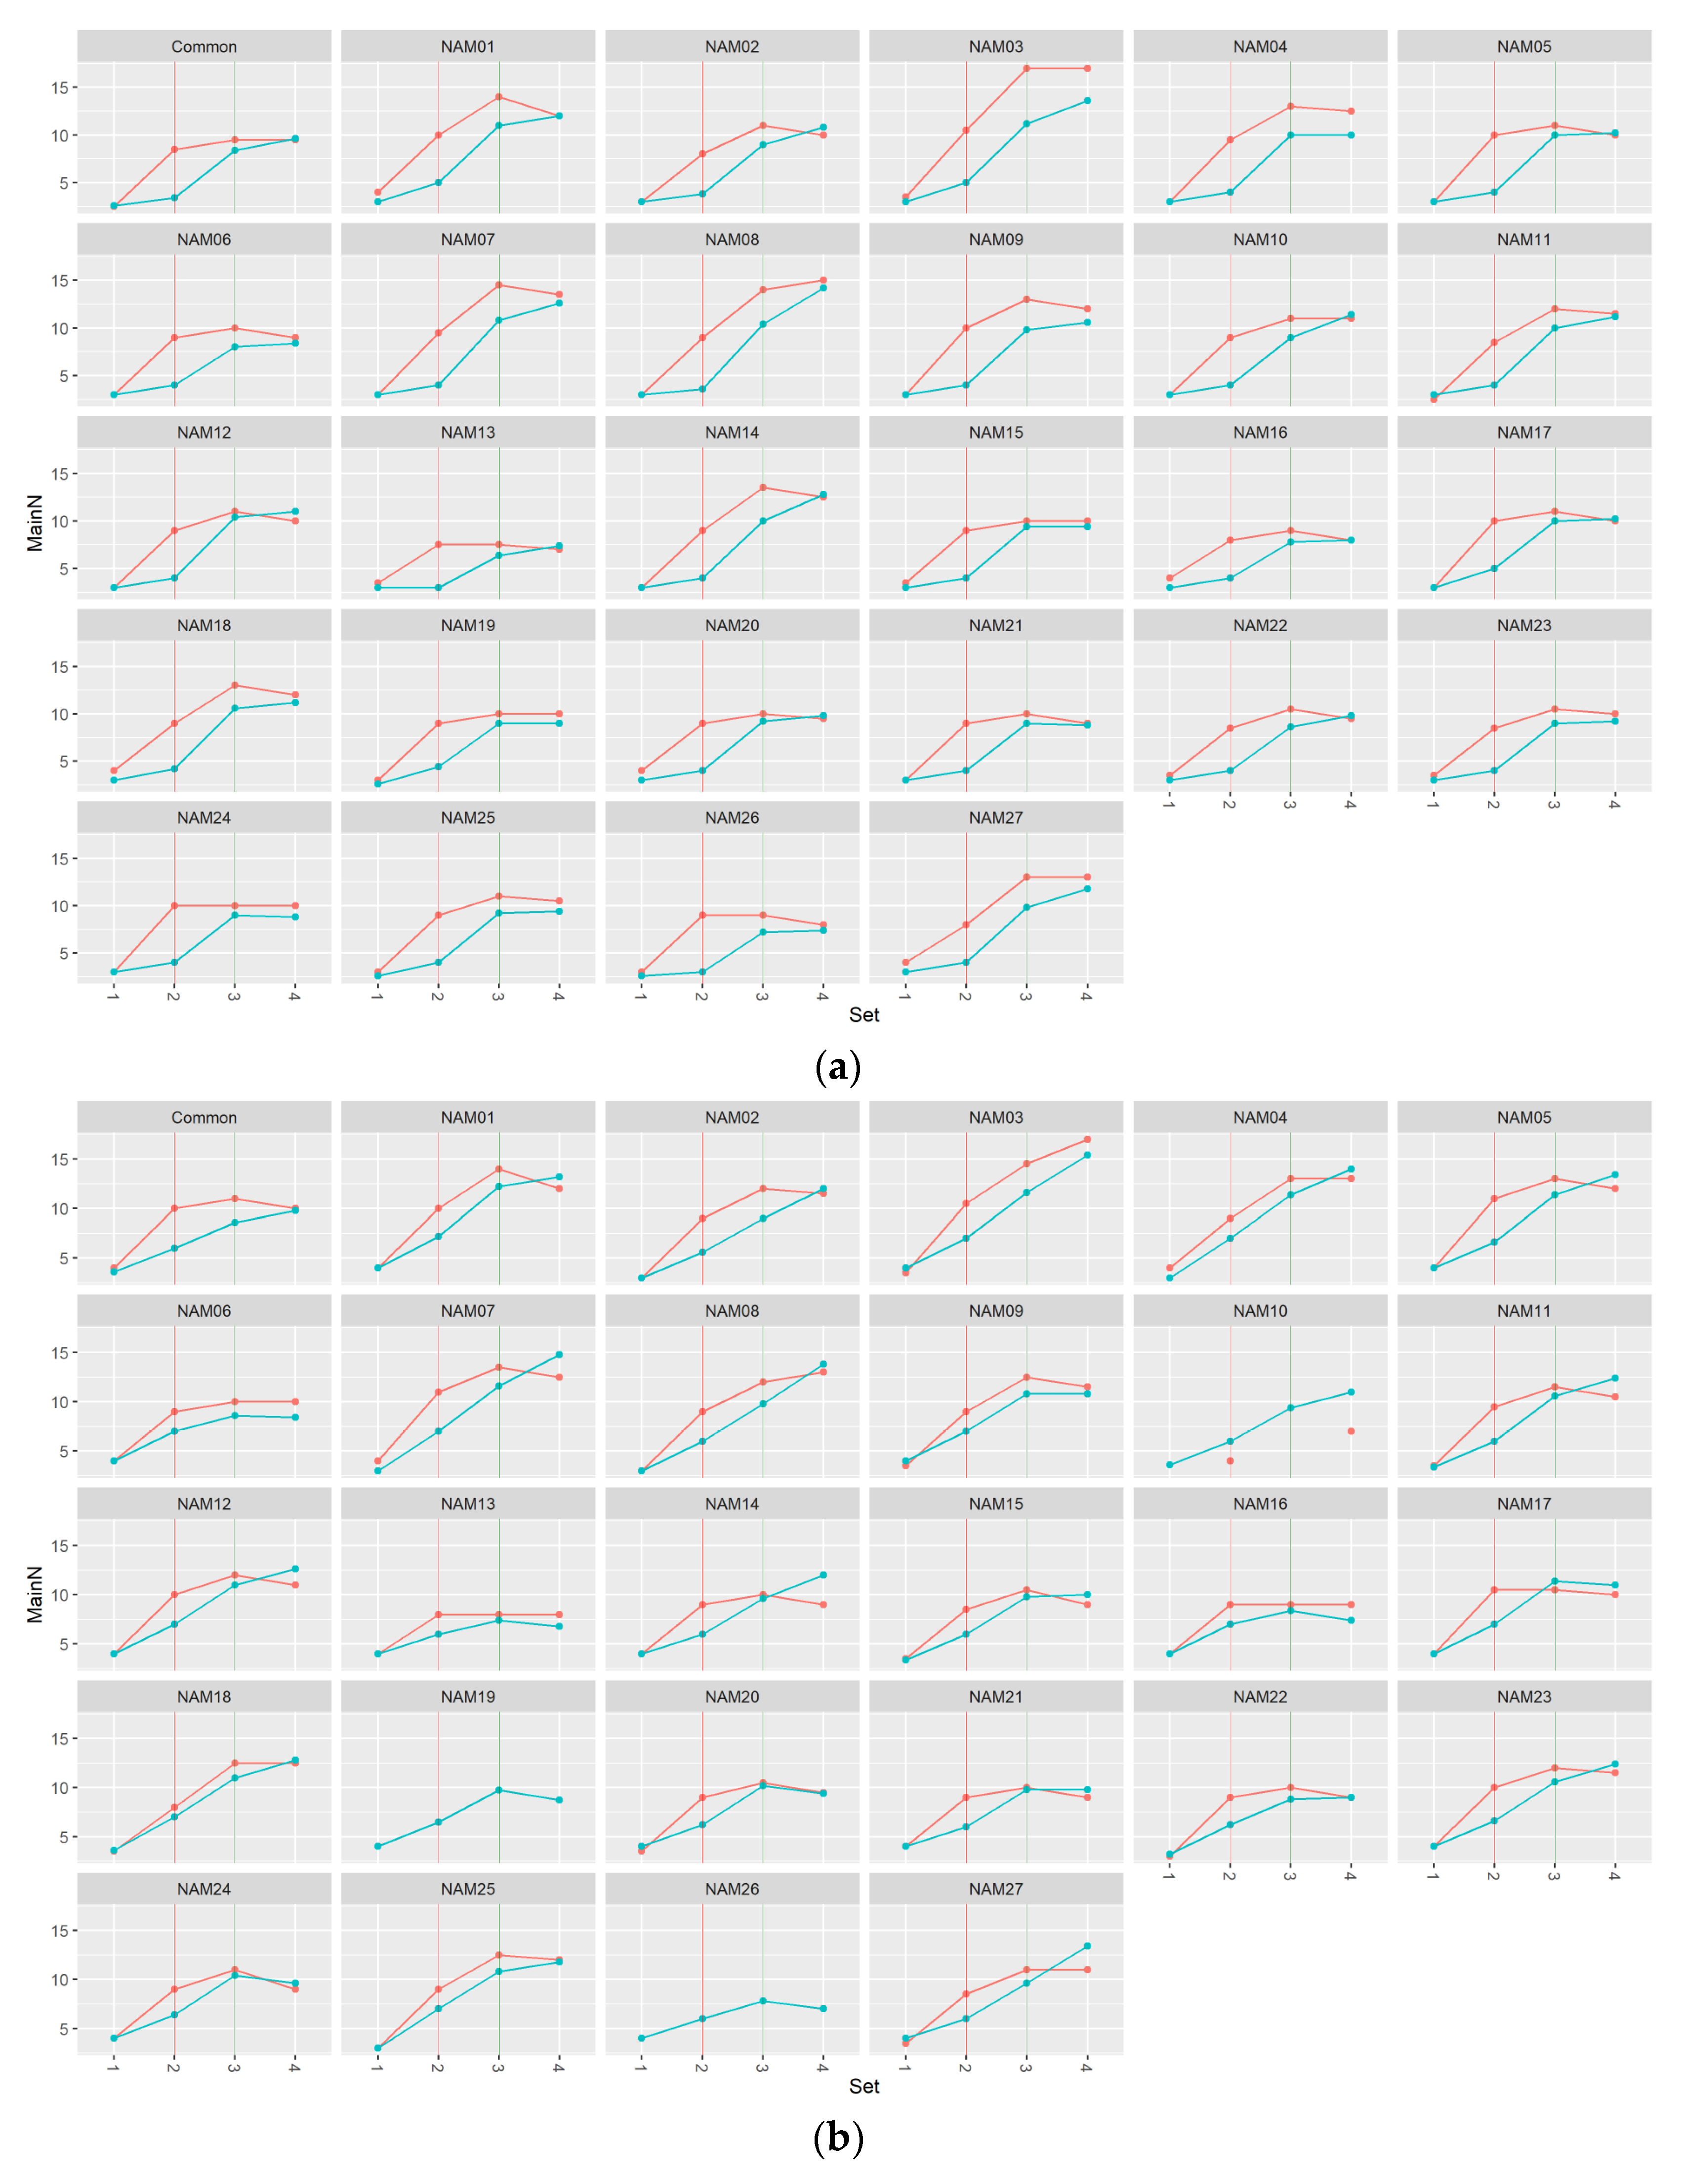
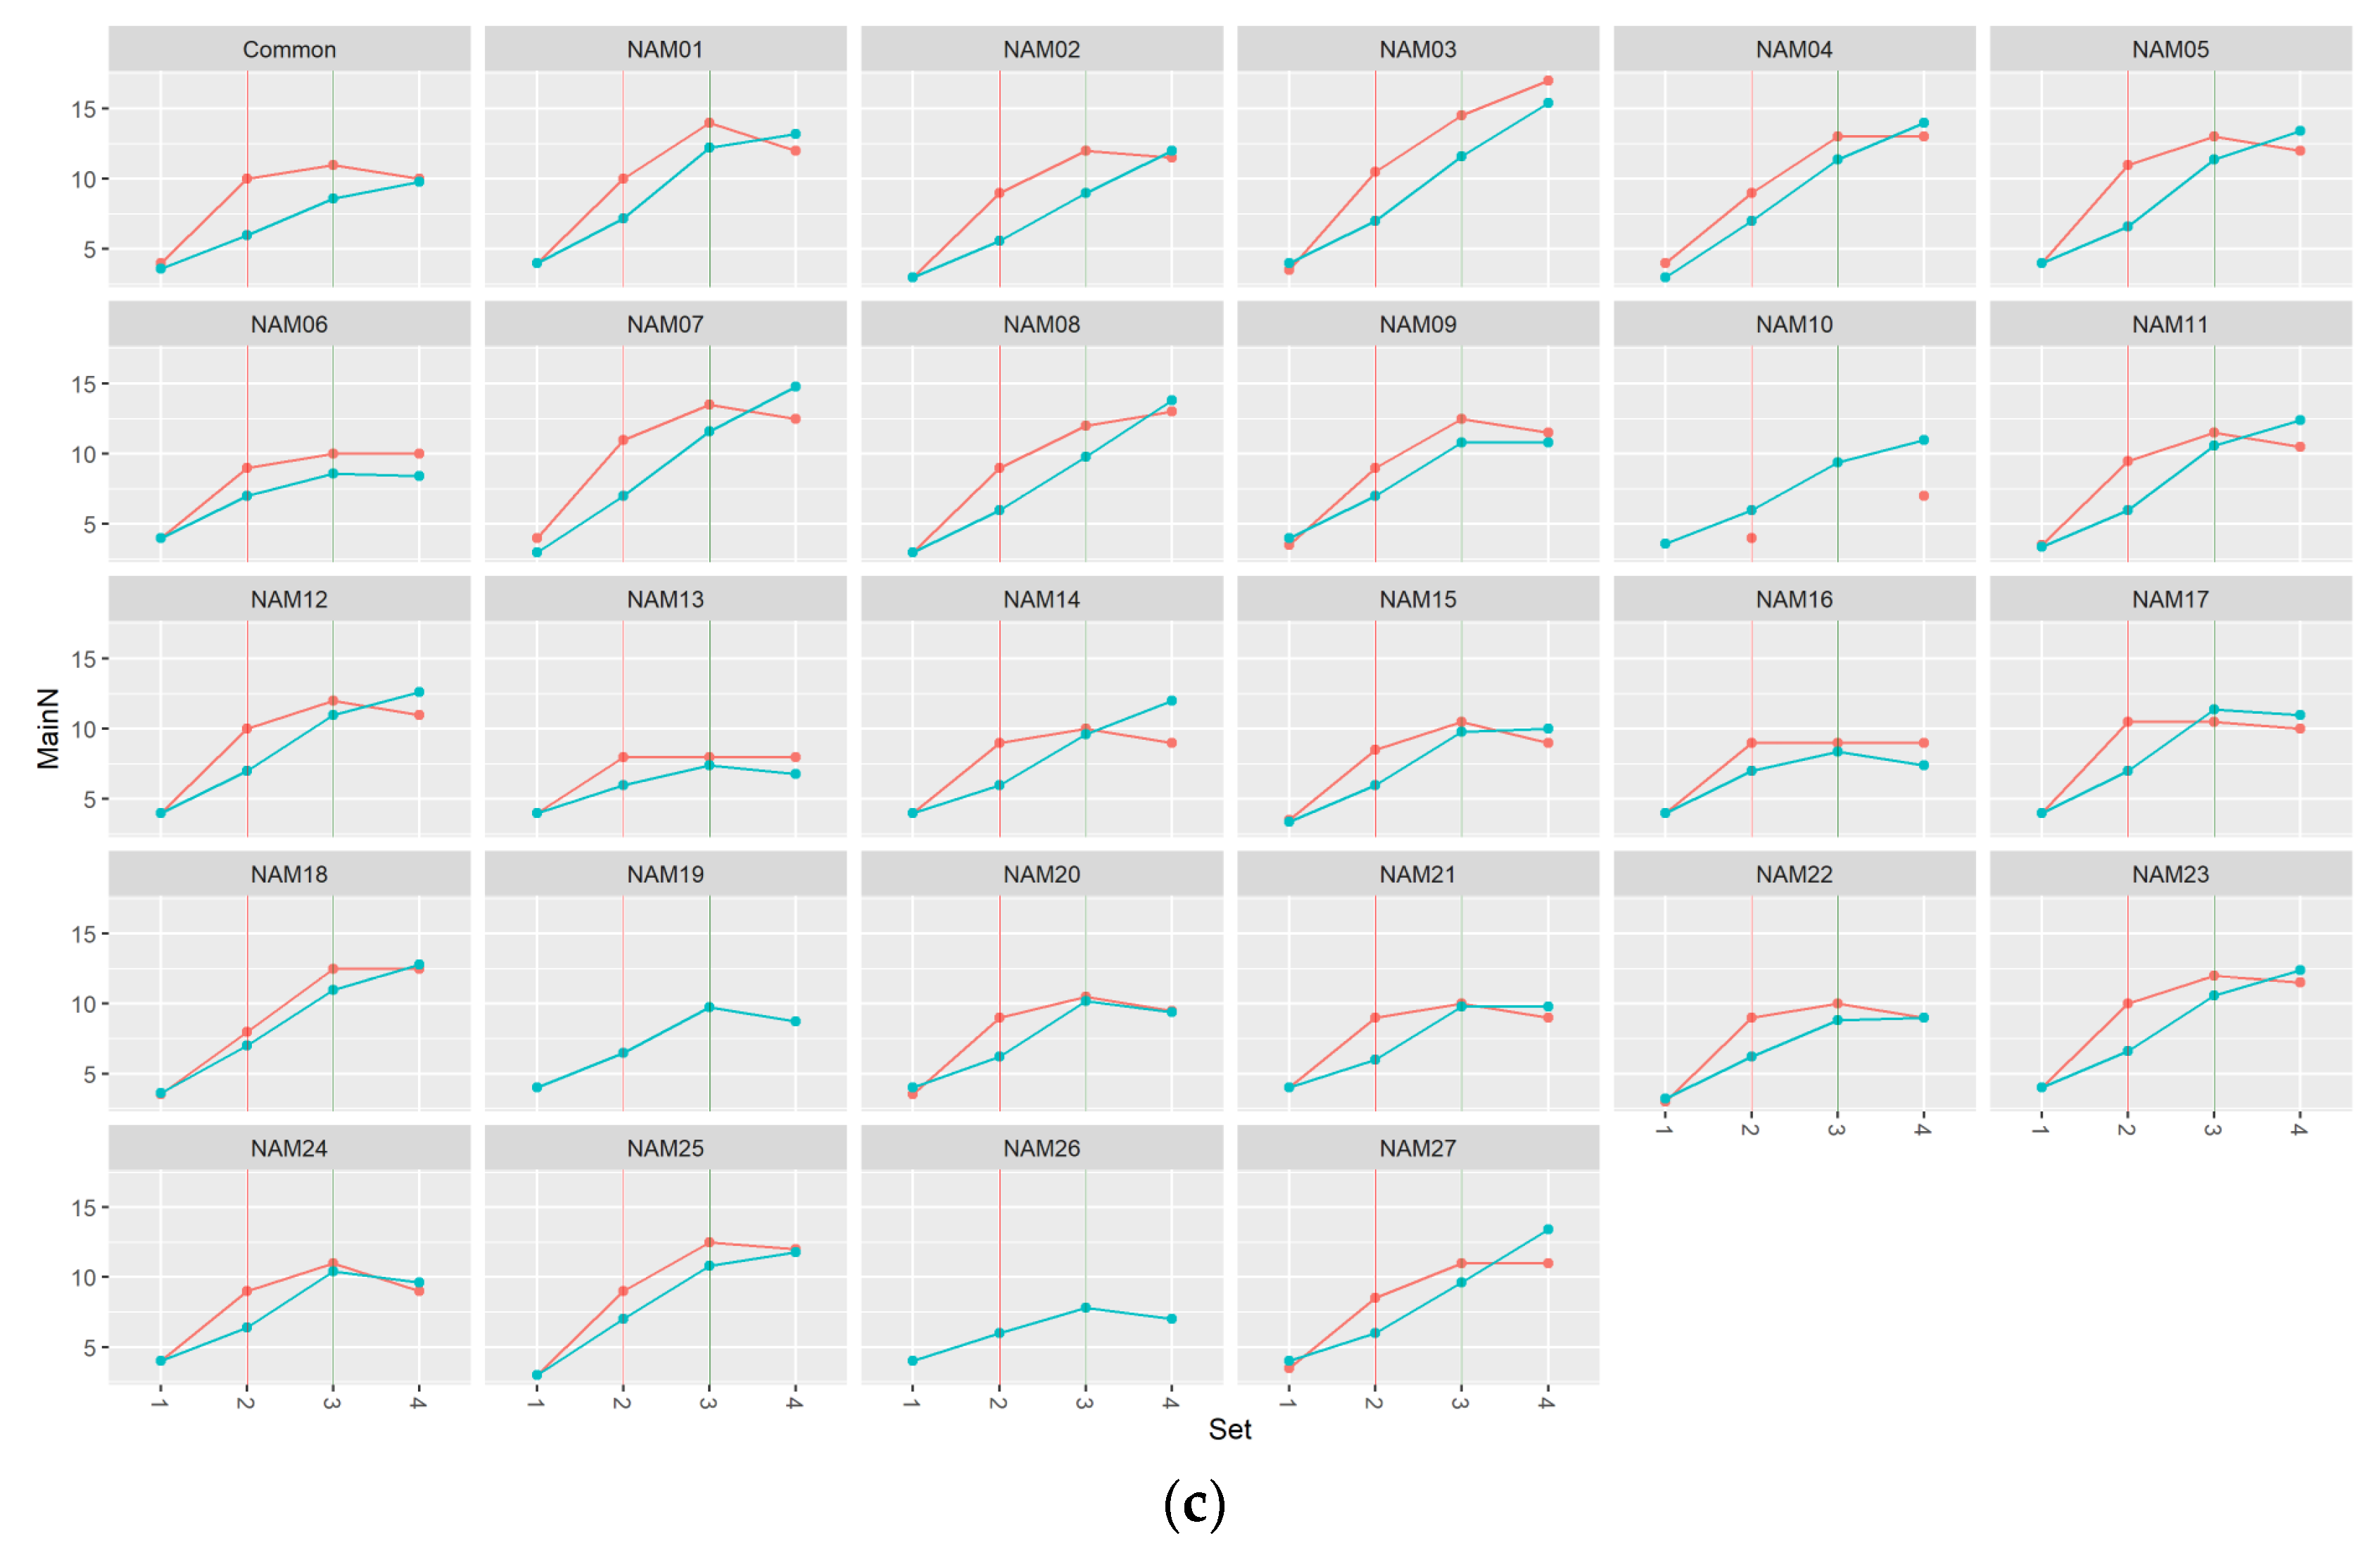
2.1.1. Number of Main Stem Nodes

The number of main nodes were measured in each set. The main stem nodes were more developed in unstressed individuals in most varieties (Figure 1). However, Common, NAM 1, 2, 5, 10, 11, 12, 13, 14, 17, 20, 21, and 22 showed similar or more development of main stem nodes between the unstressed and treated (Figure 1a). In the V3 set, drought-treated individuals of Common, NAM 1, 2, 4, 5, 7, 8, 11, 12, 14, 15, 17, 18, 20, 21, 23, 24, and 27 showed more development (Figure 1b). Due to the missing data, unstressed NAM 10 and NAM 26 were excluded from the dataset. In the V4 sets, the first measuring set was undone, and drought-treated NAM 2, 20, 23, 24, and 27 showed more development of main stem nodes than the unstressed (Figure 1c).

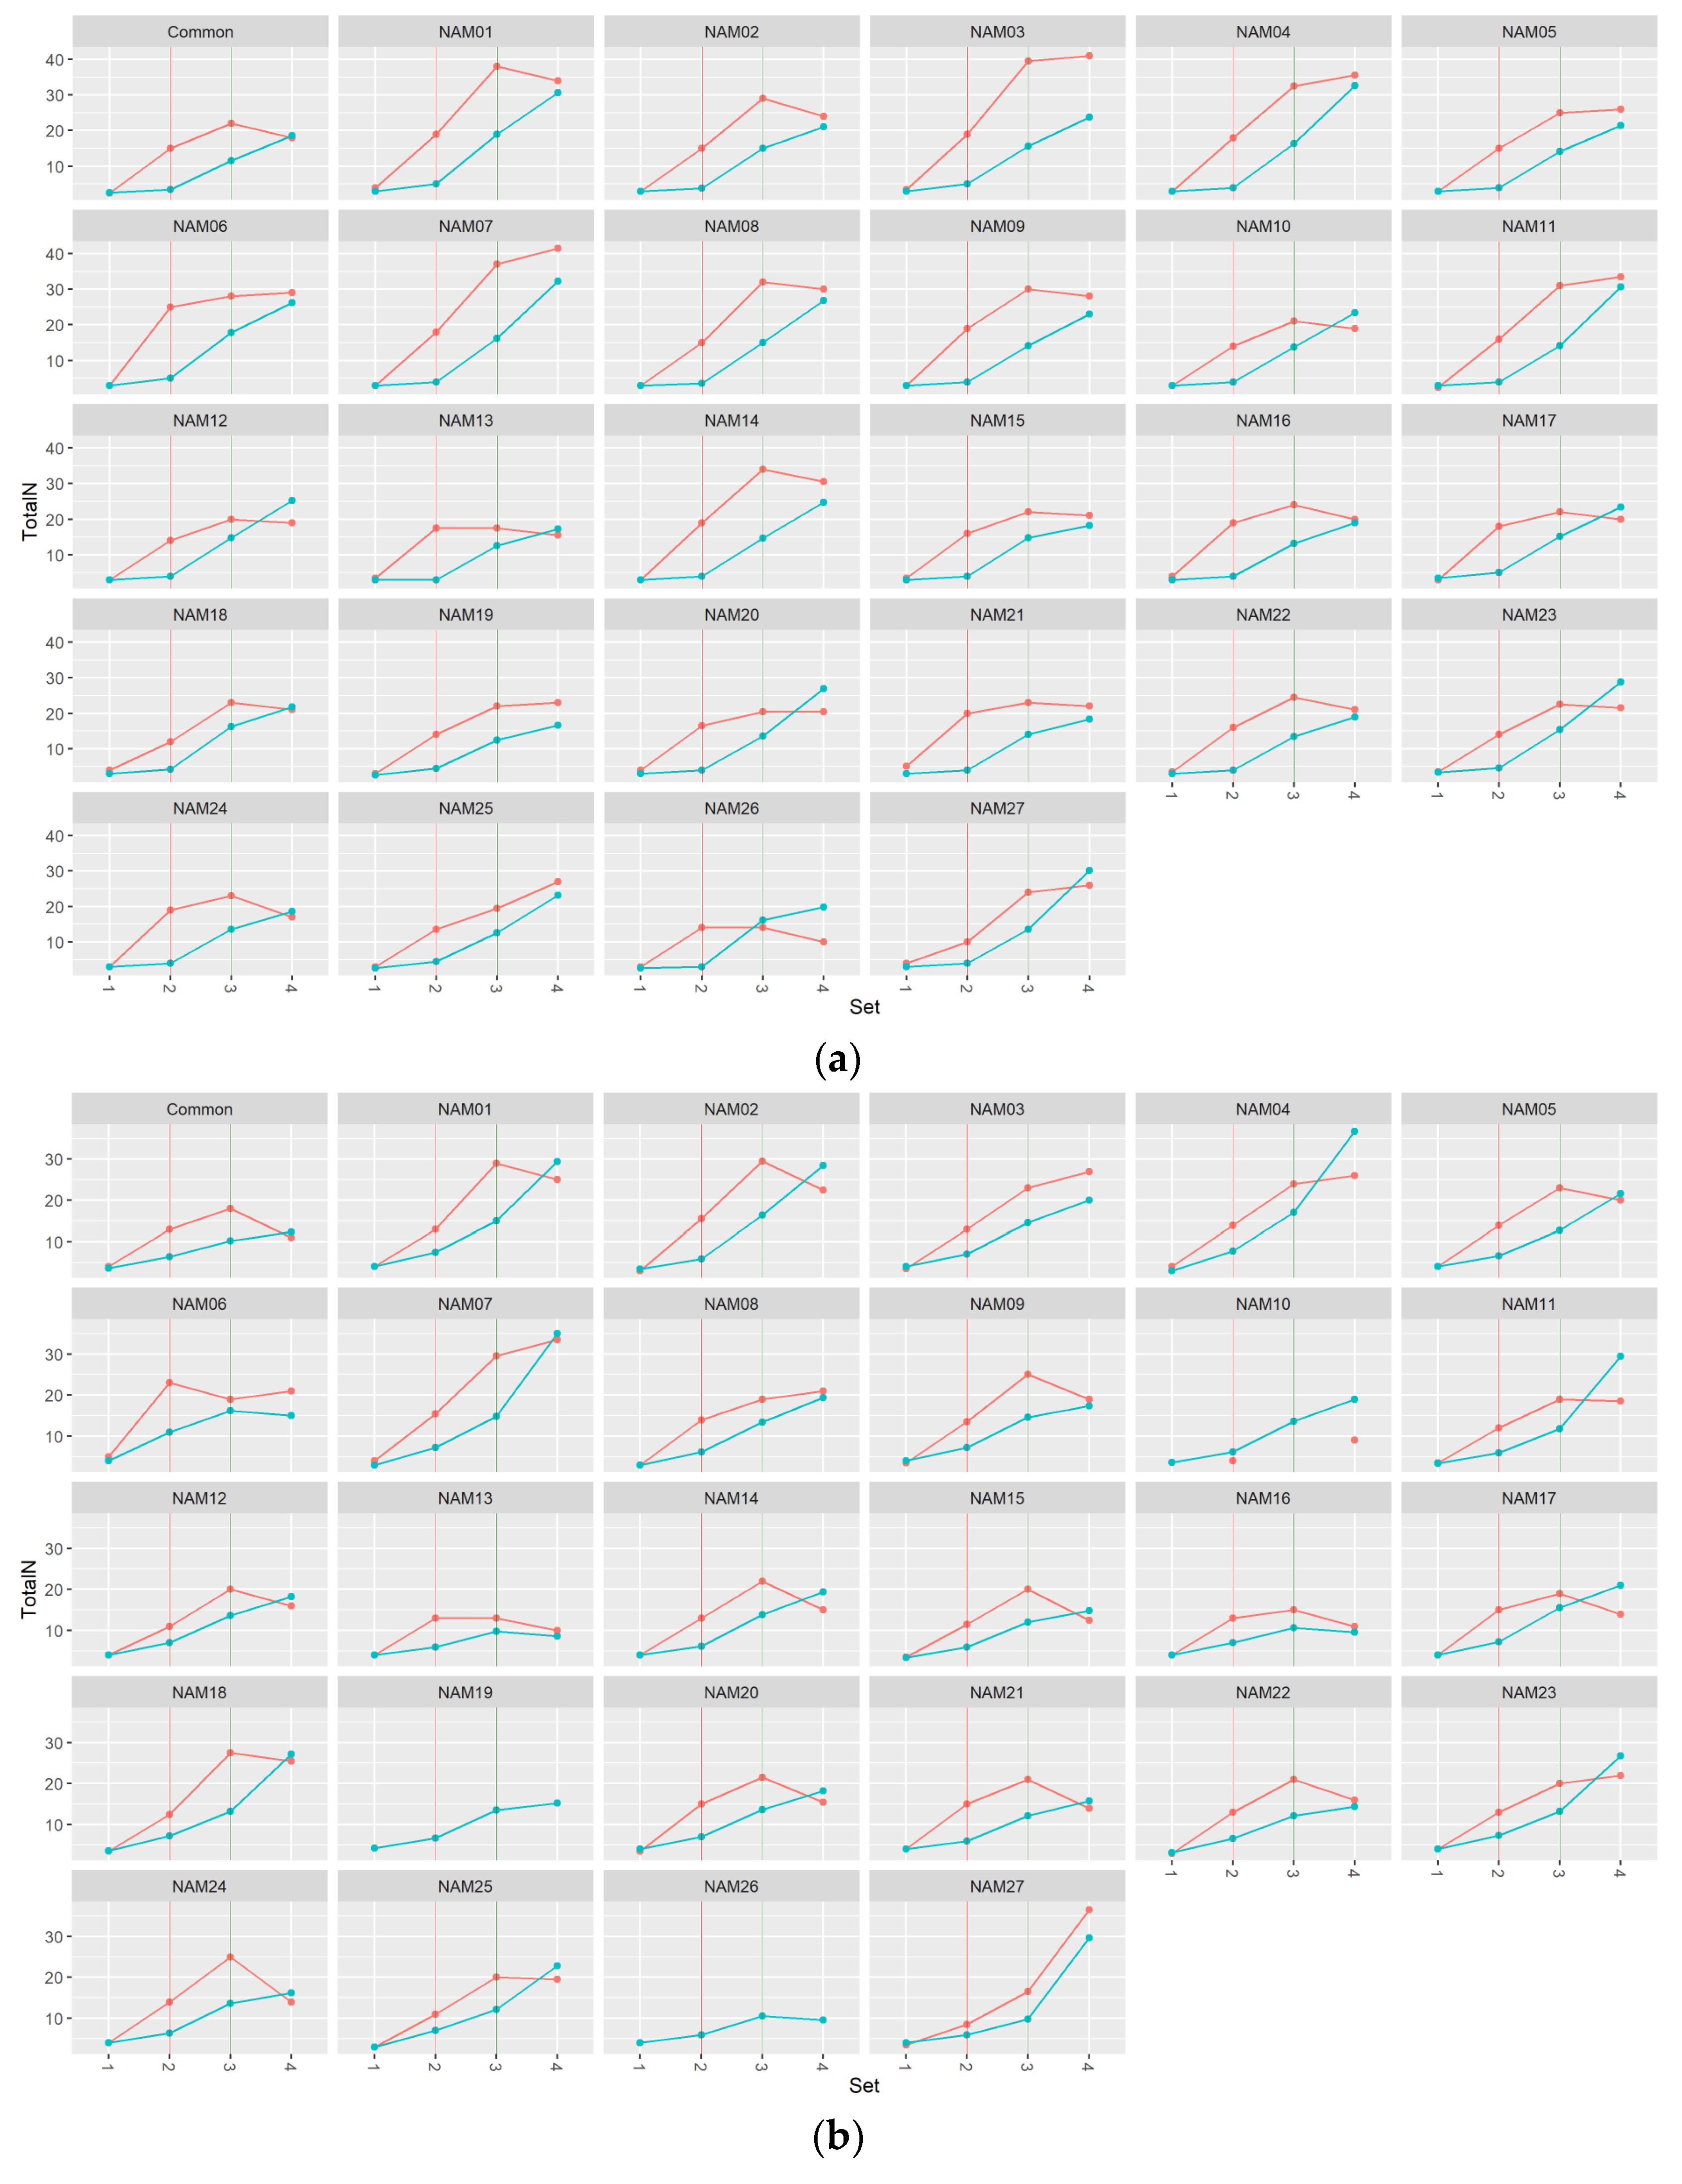
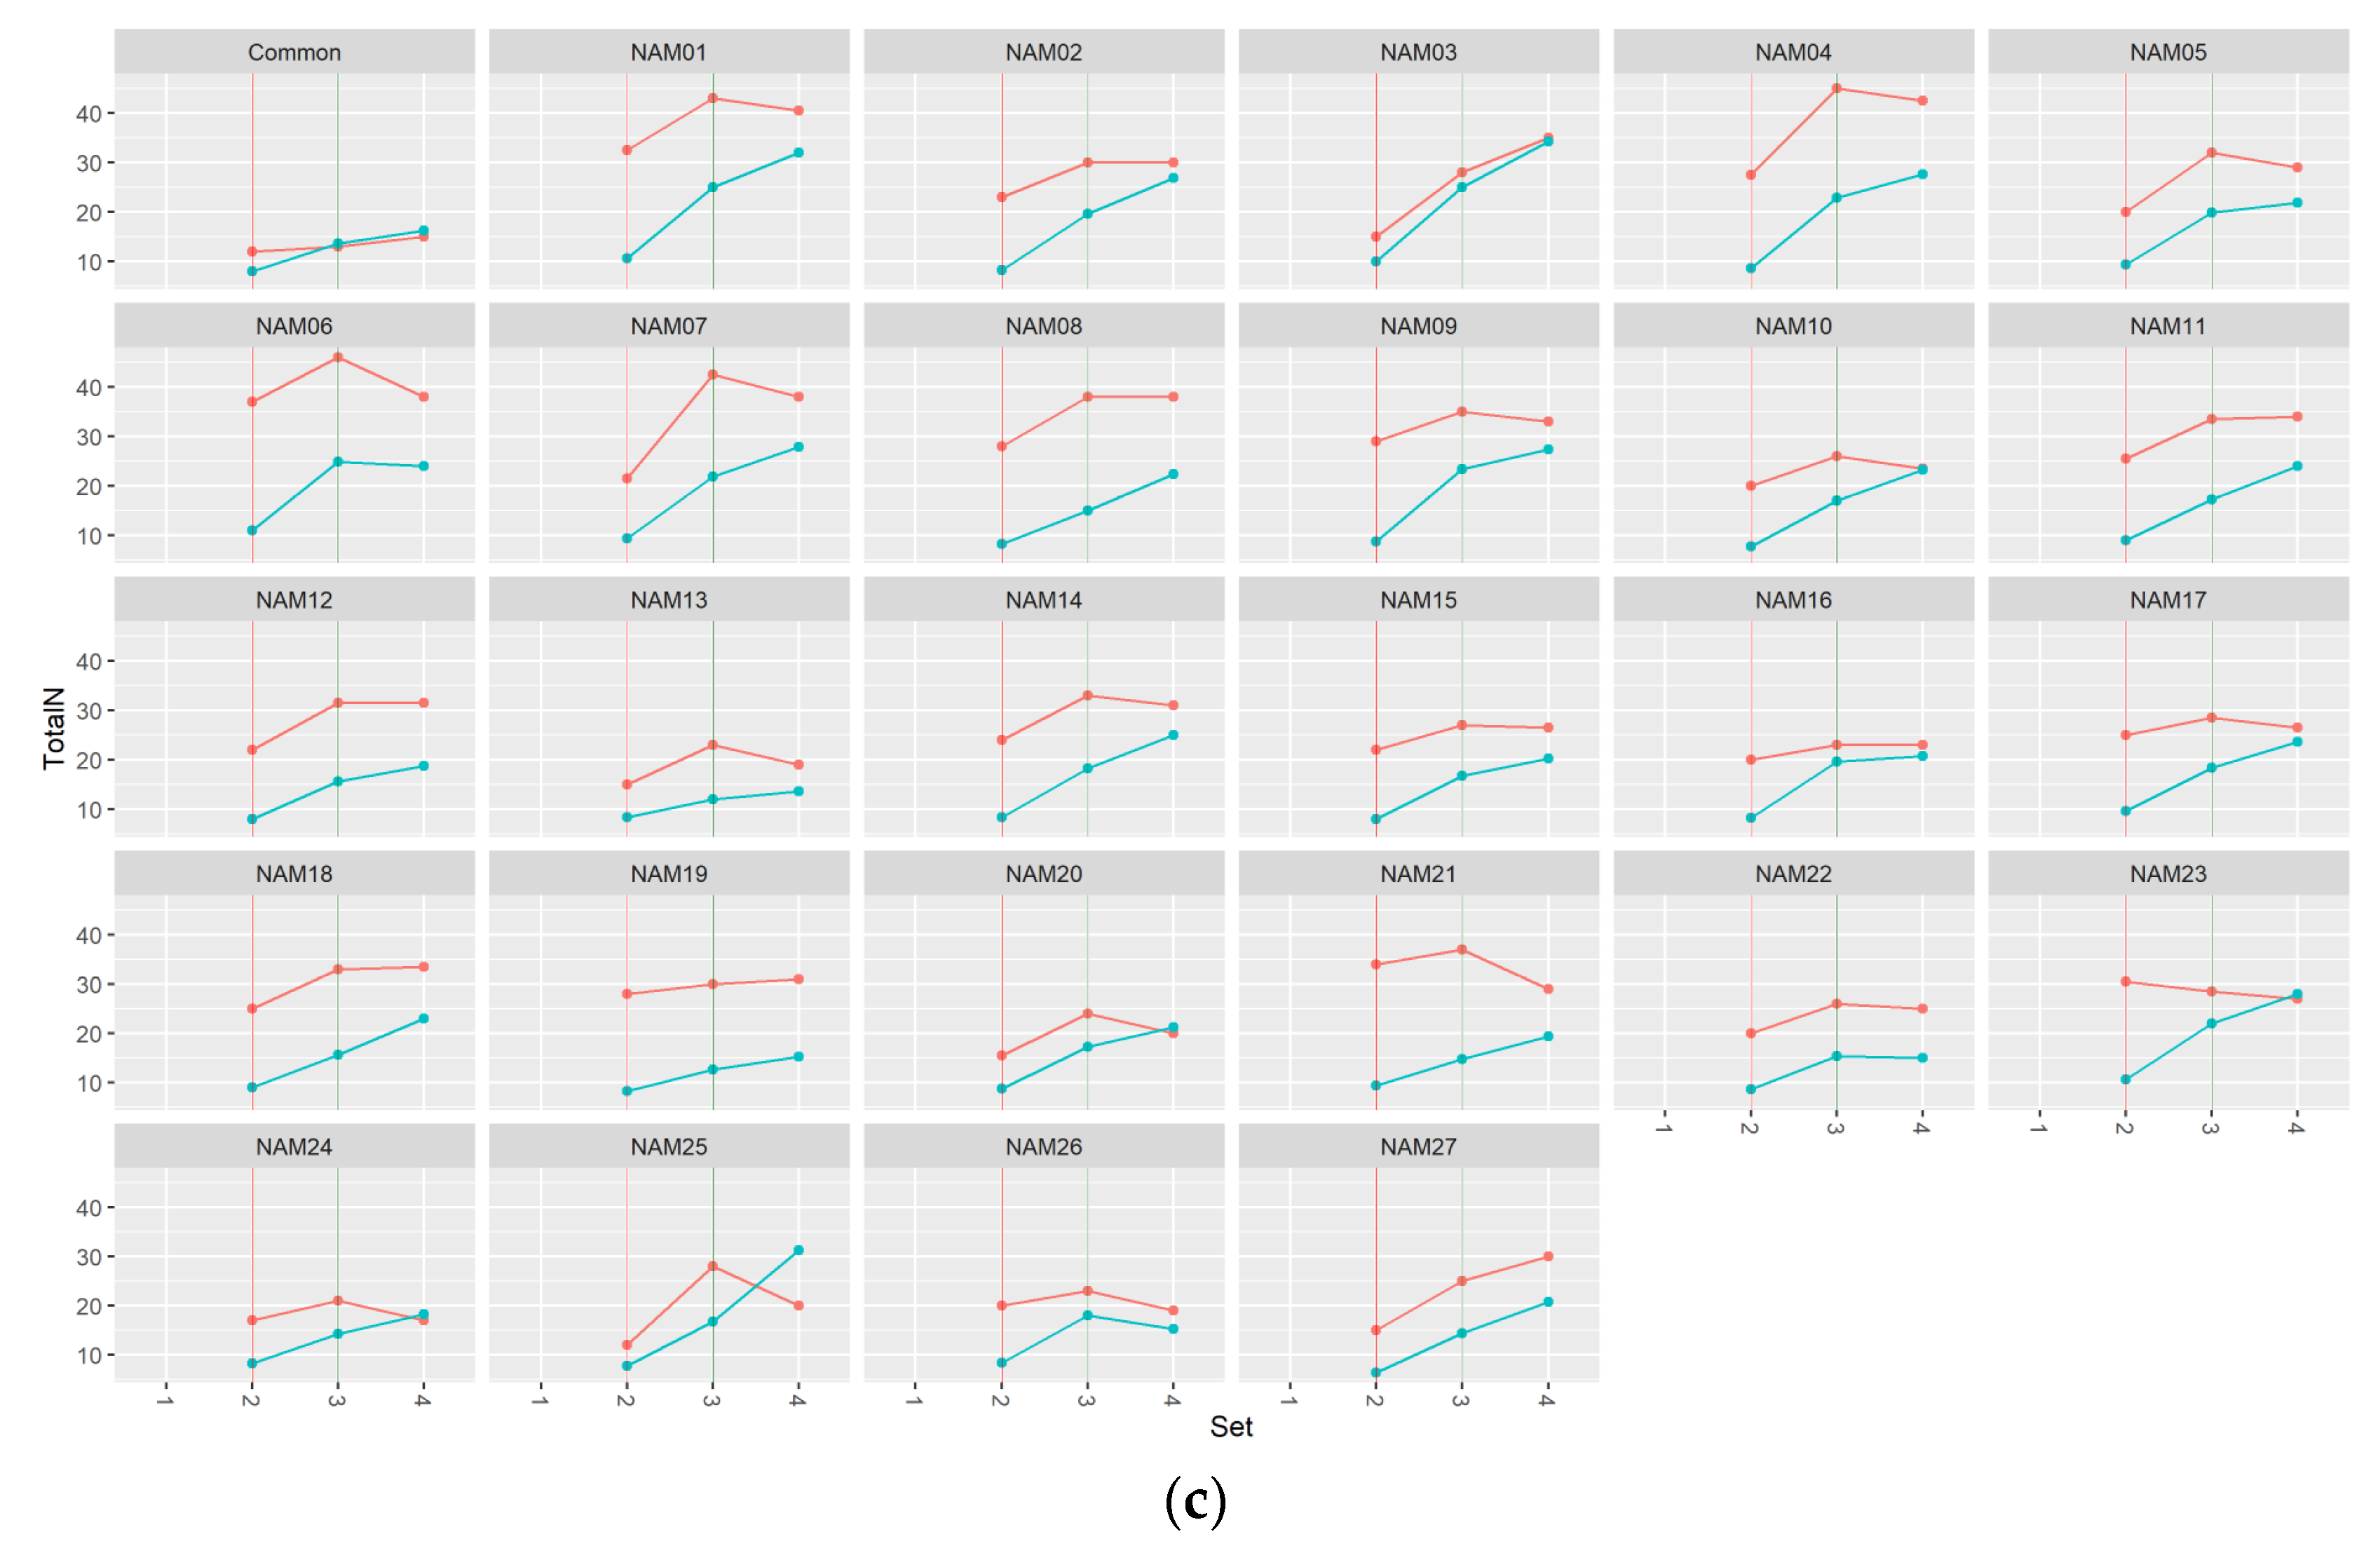
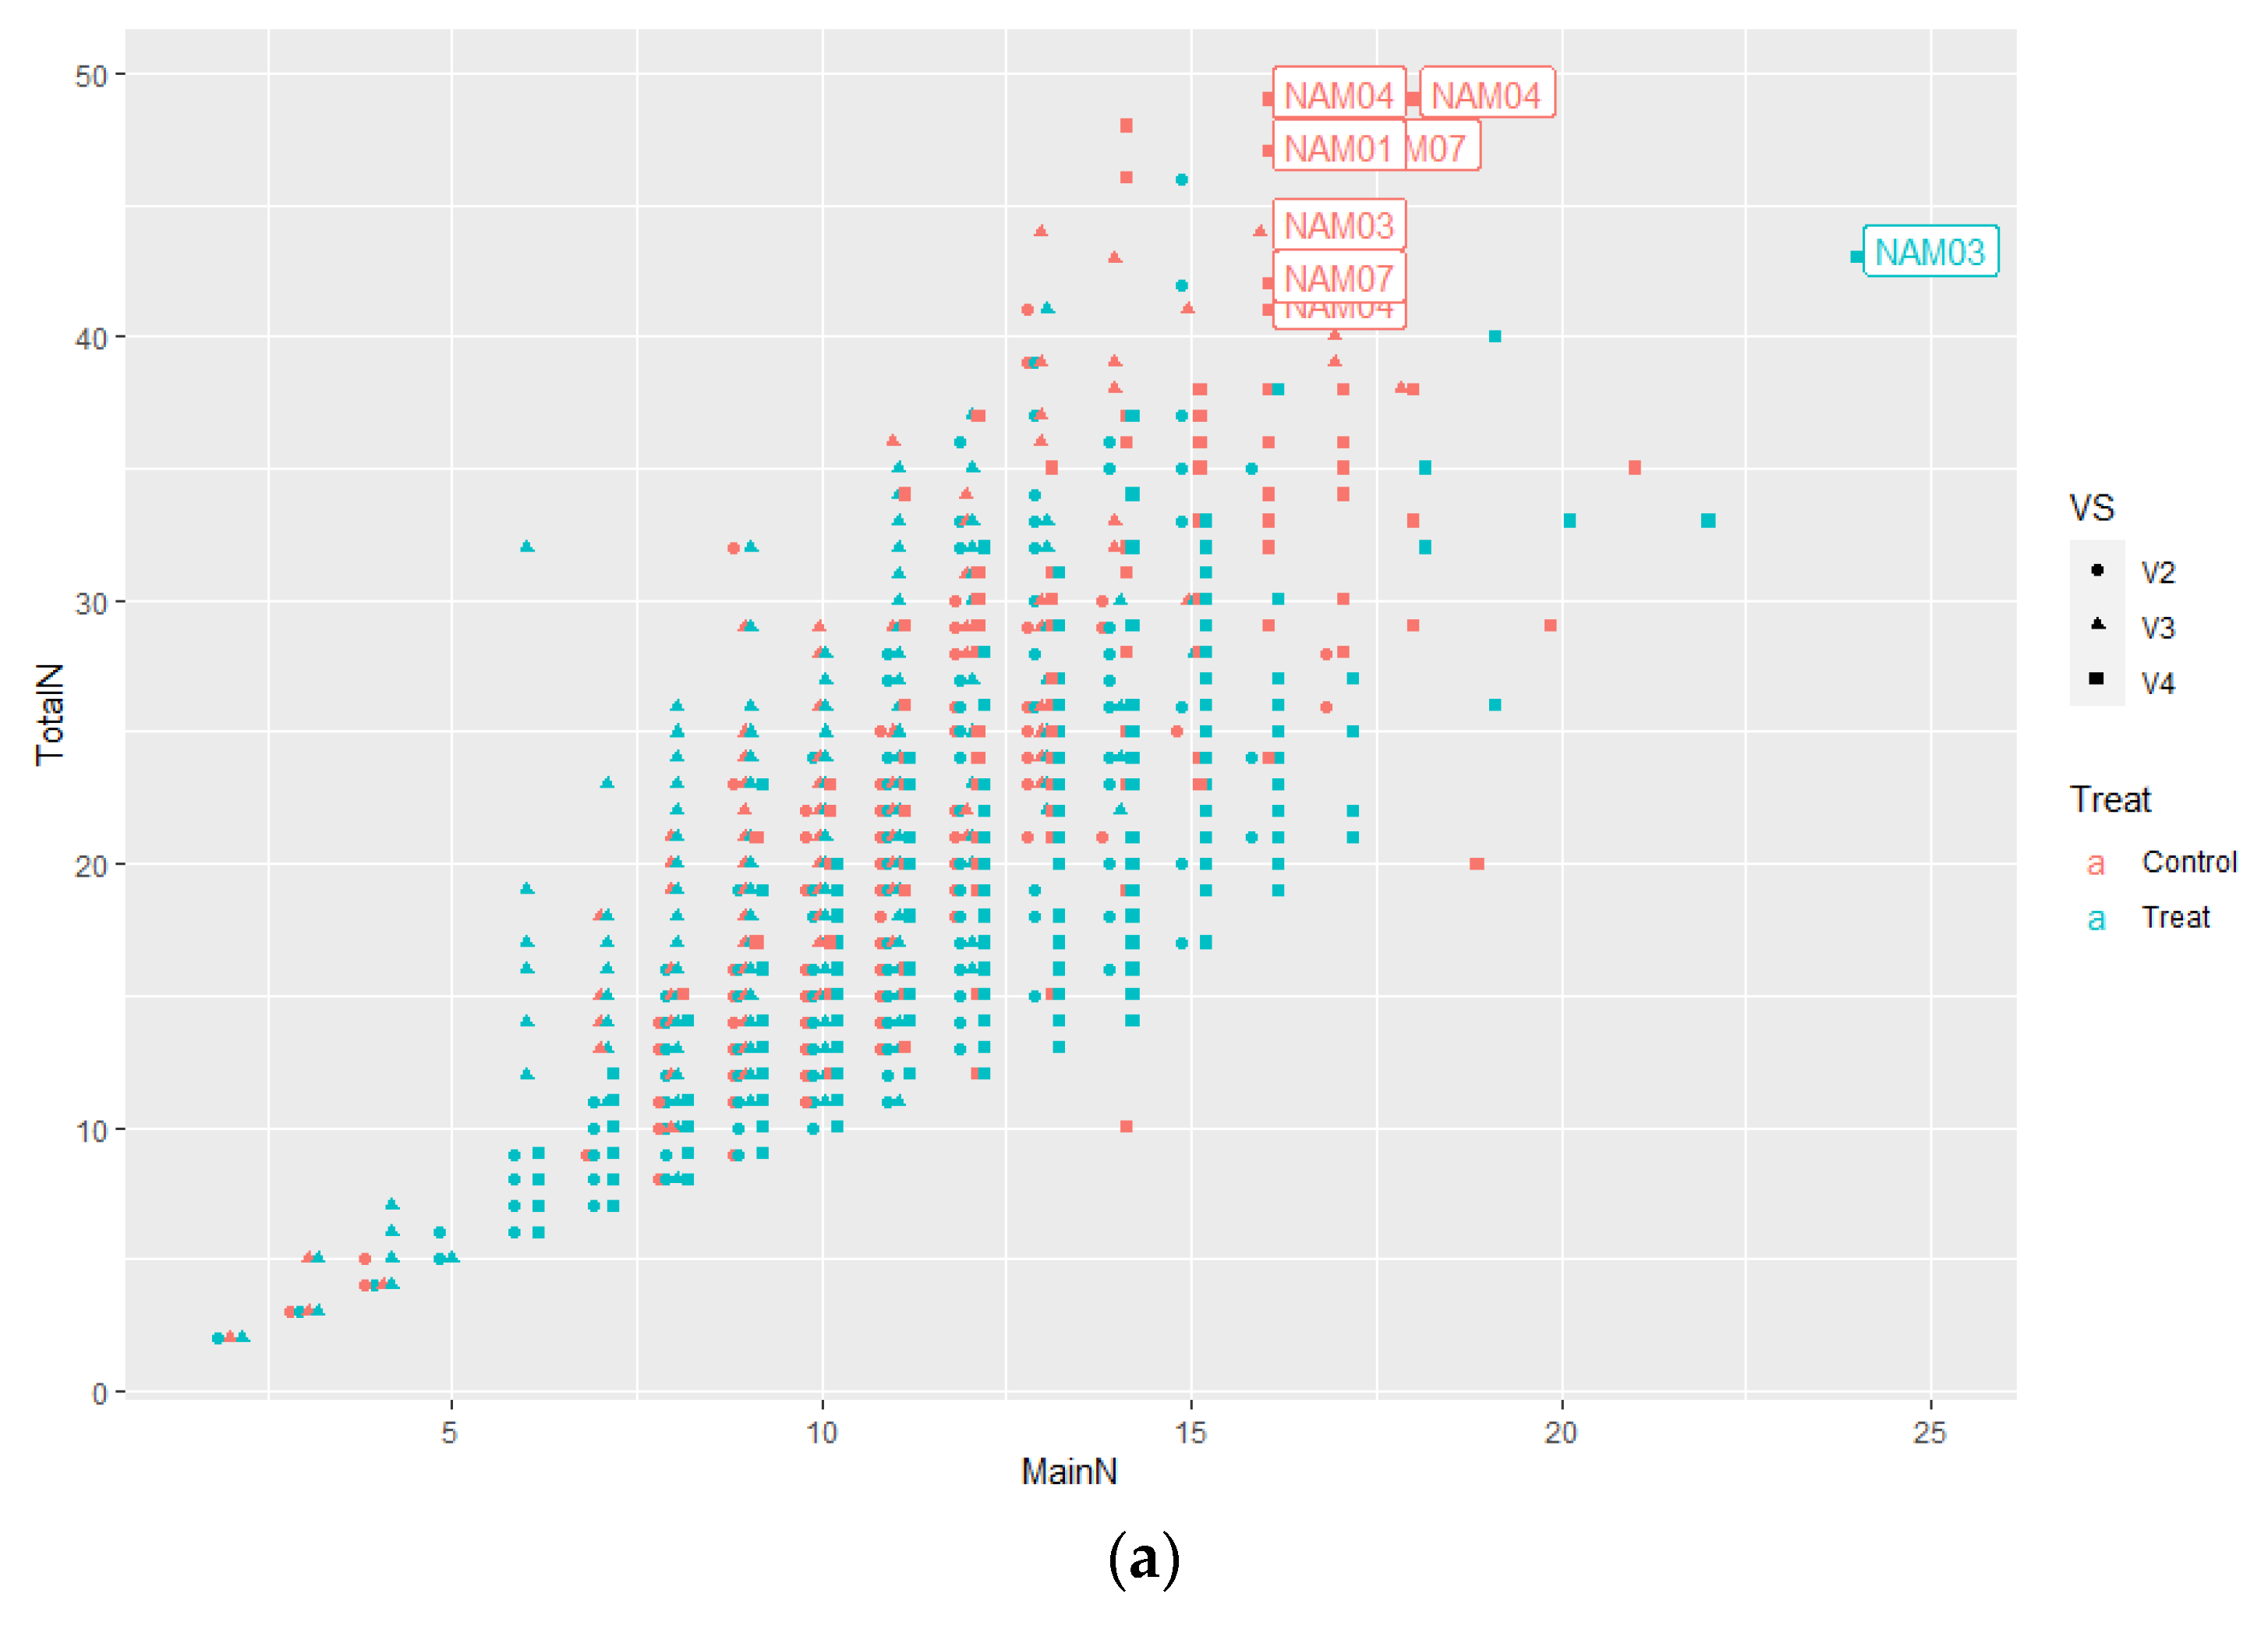
2.1.2. Number of Total Nodes

The number of total nodes showed patterns similar to those of the main nodes. The formation of side nodes could be estimated from the number of total nodes and main nodes. The drought-treated plants of Common, NAM 10, 12, 13, 17, 18, 20, 23, 24, 26, and 27 in the V2 set showed more total node development; therefore, the formation of side nodes in NAM 18, 23, 24, 26, and 27 has been actively progressing (Figure 2a). The number of total nodes of Common, NAM 1, 2, 4, 5, 7, 11, 12, 14, 15, 17, 18, 20, 21, 23, 24, and 25 drought-treated plots in the V3 set stood out. NAM 25 was the only variety in which side nodes were developed, while the main node formation was few (Figure 2b). The number of total nodes, main nodes, and pods were analyzed by matching the values of the individual plant (Figure 3). Both unstressed and drought-treated NAM 13 had developed the least main and total nodes at V4, while the unstressed NAM 1, 3, 4, 7and drought-treated NAM 3 had the greatest number of nodes (Figure 3a). The unstressed NAM 7 developed the greatest number of pods at final yield, and the least developed varieties were NAM 13 and 16 (Figure 3b).

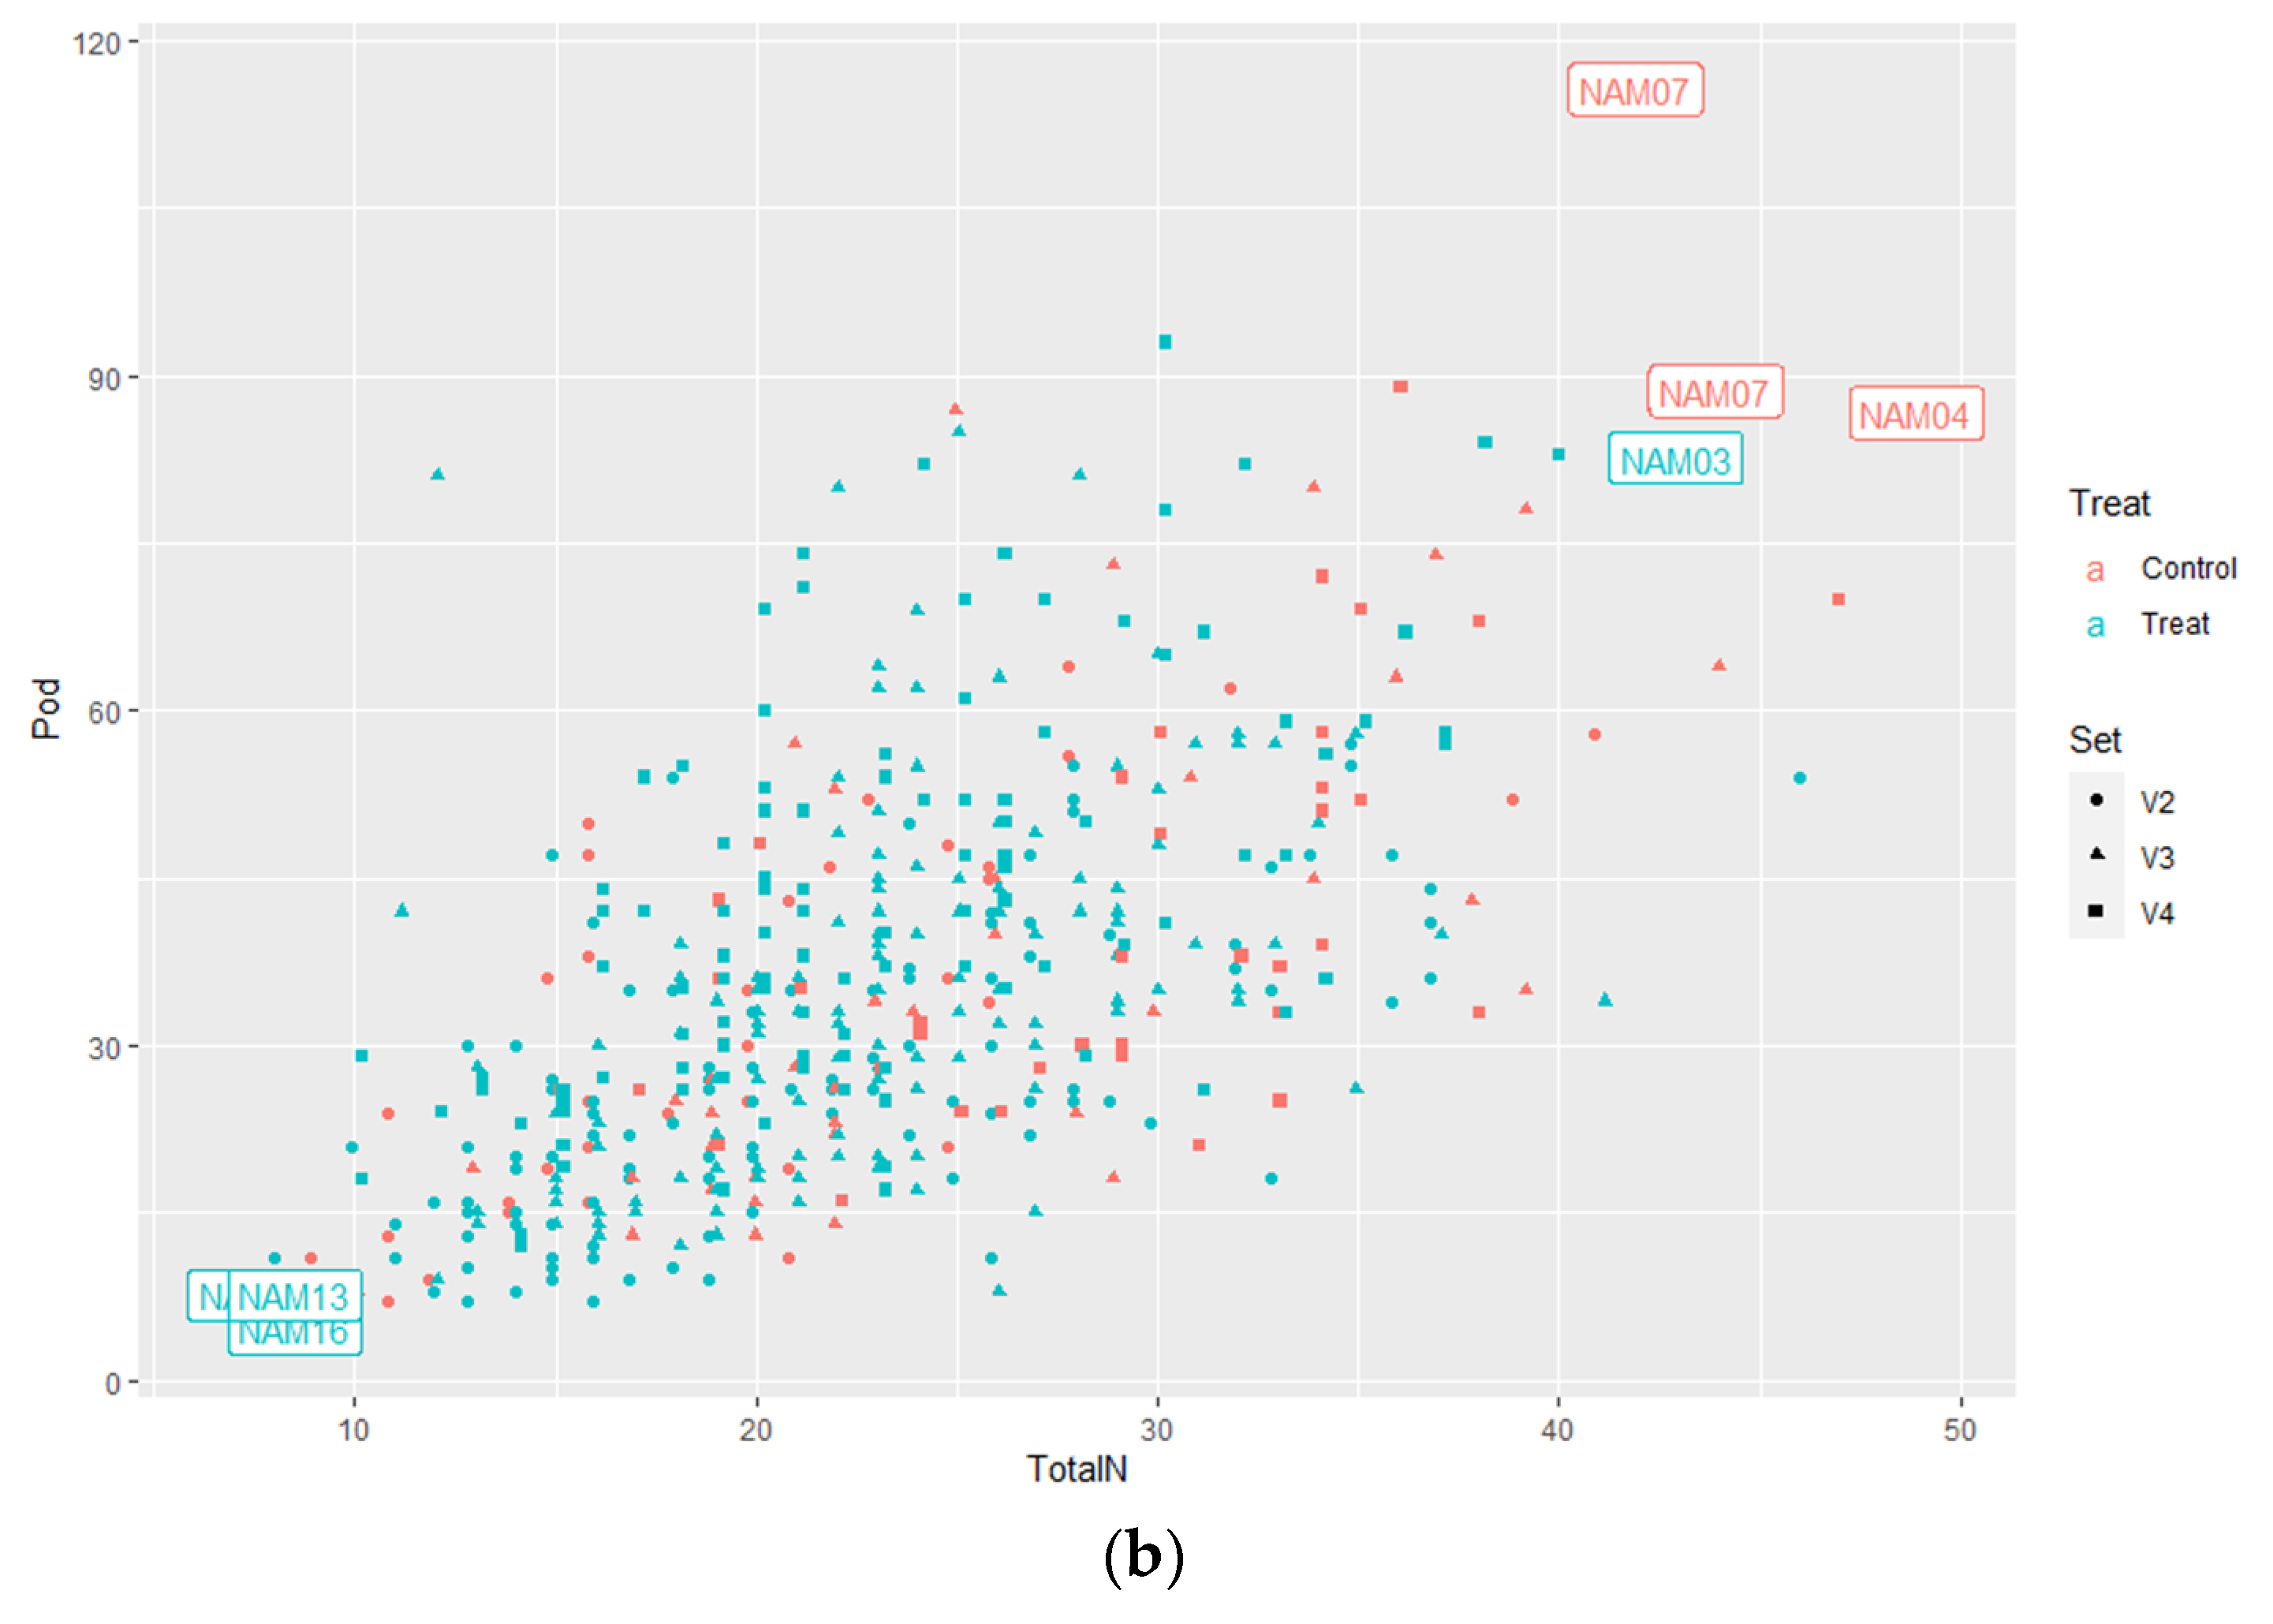
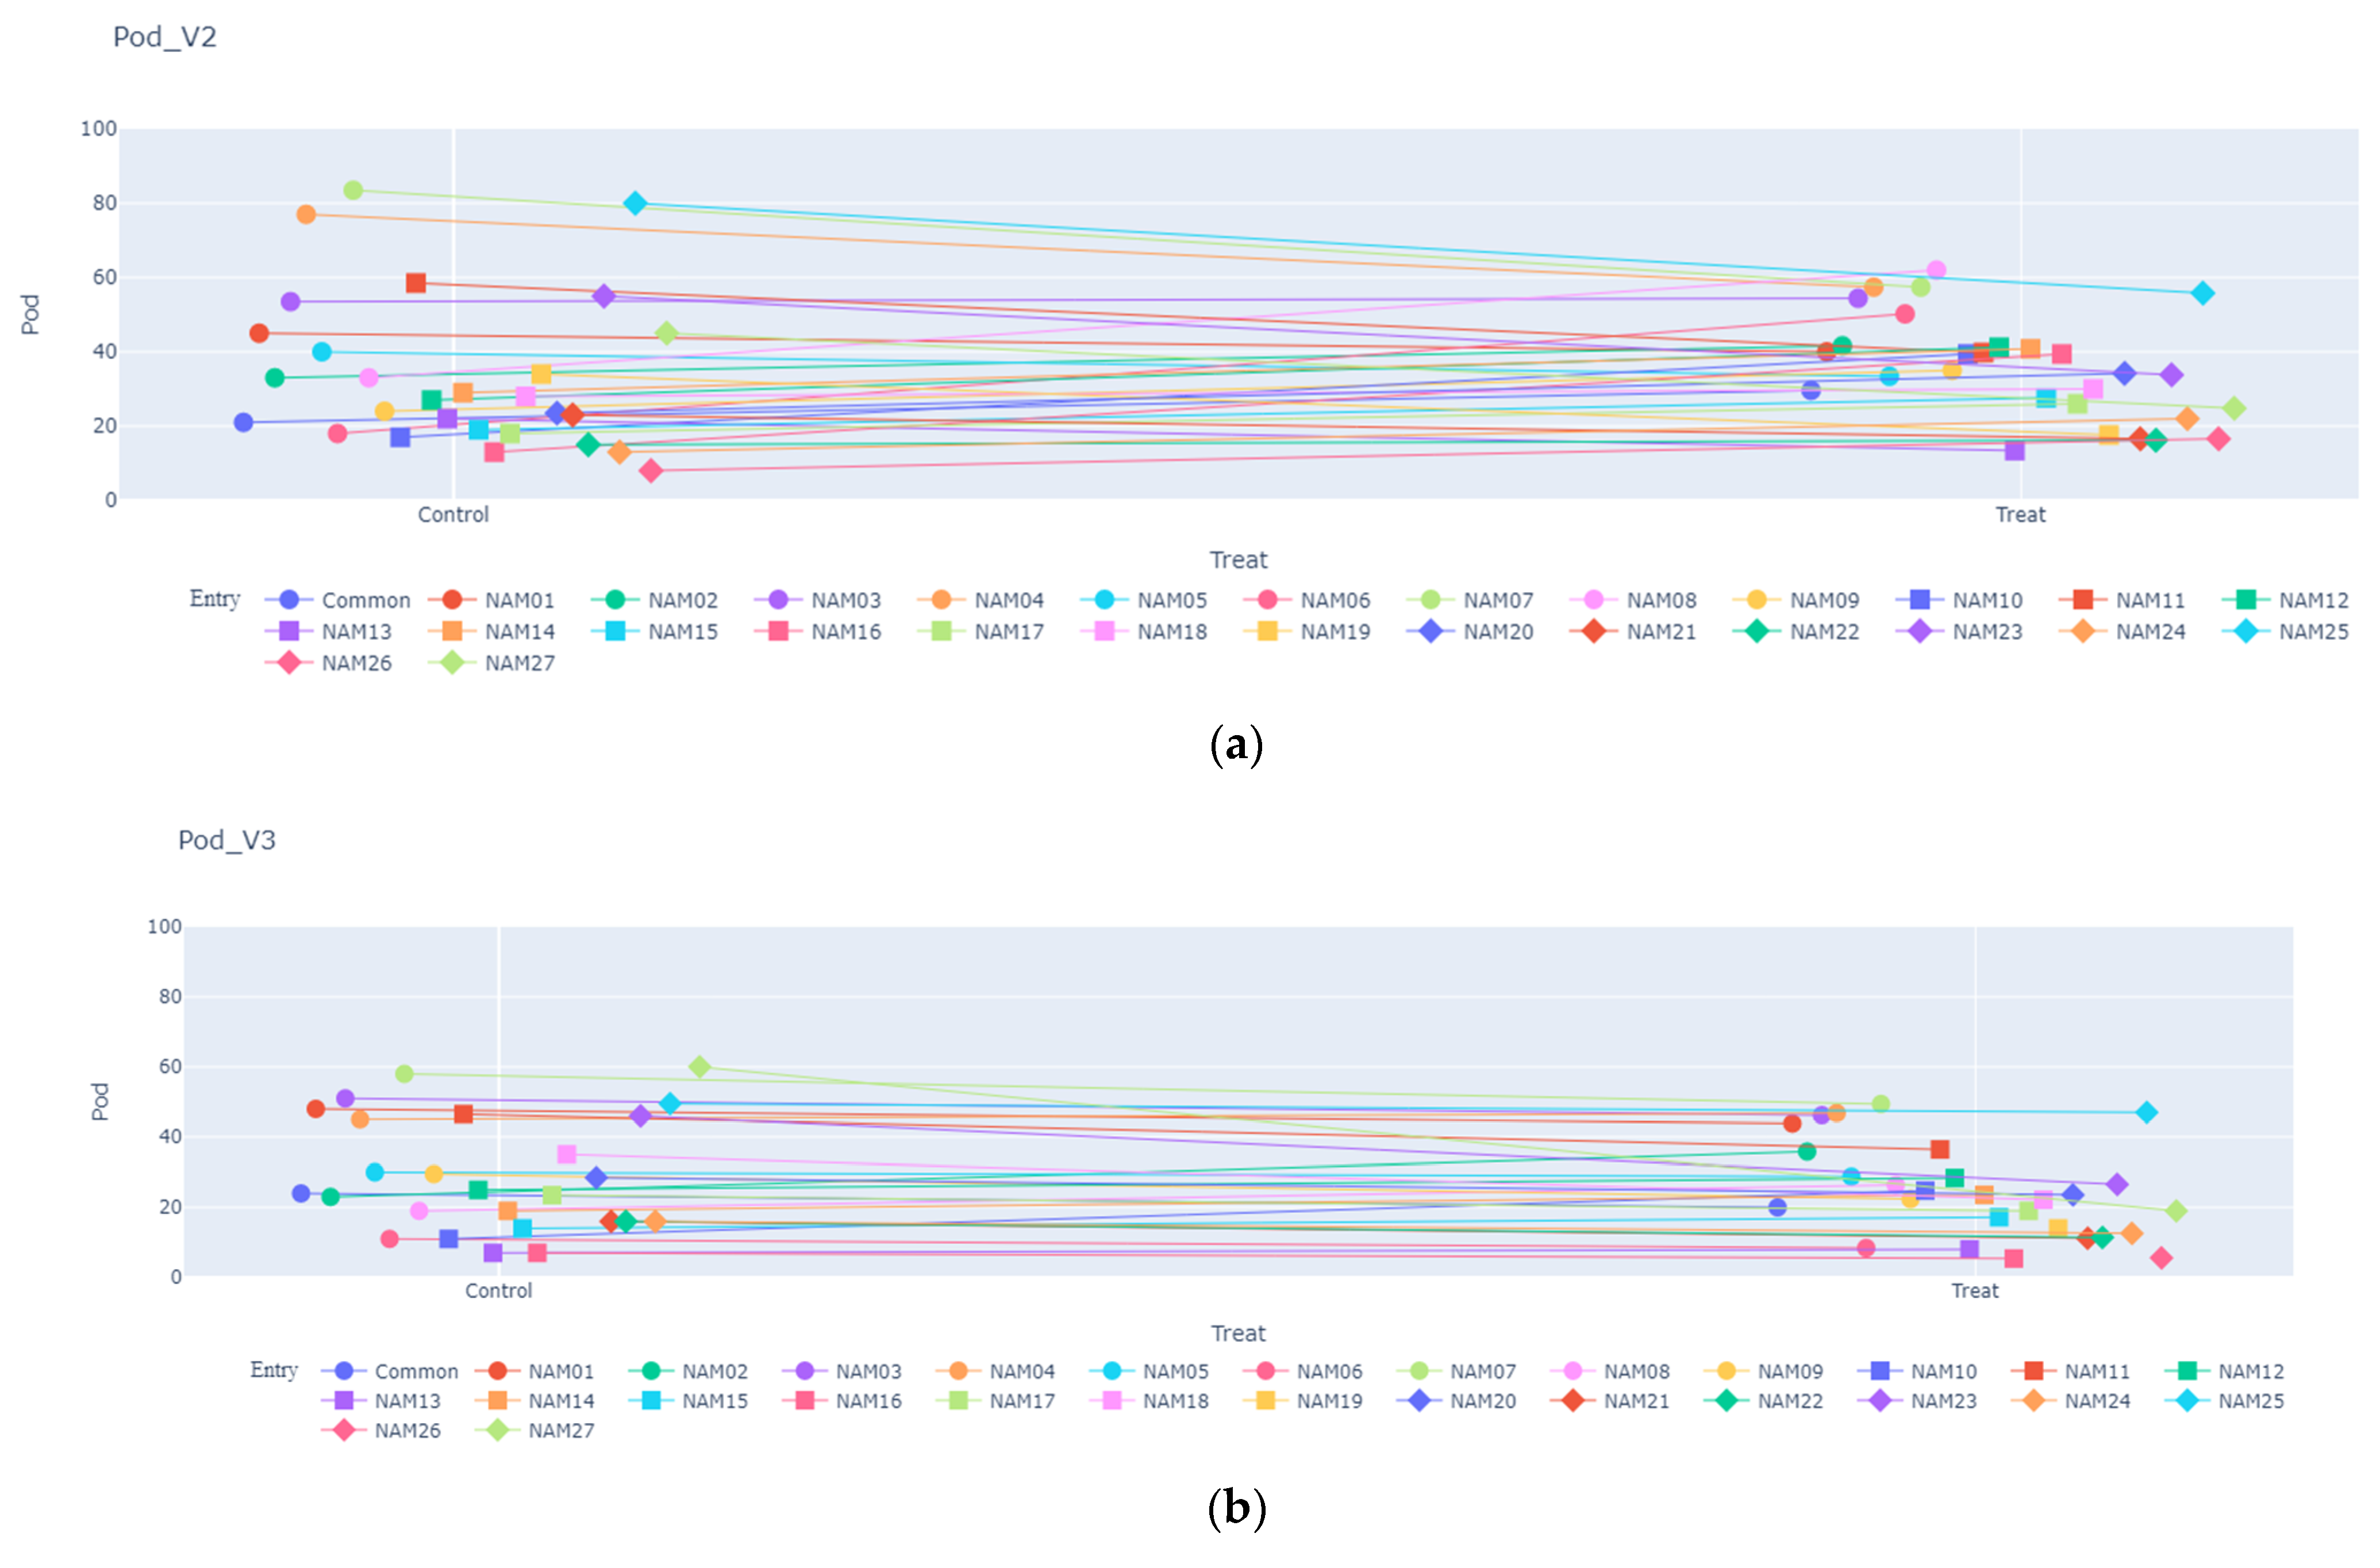
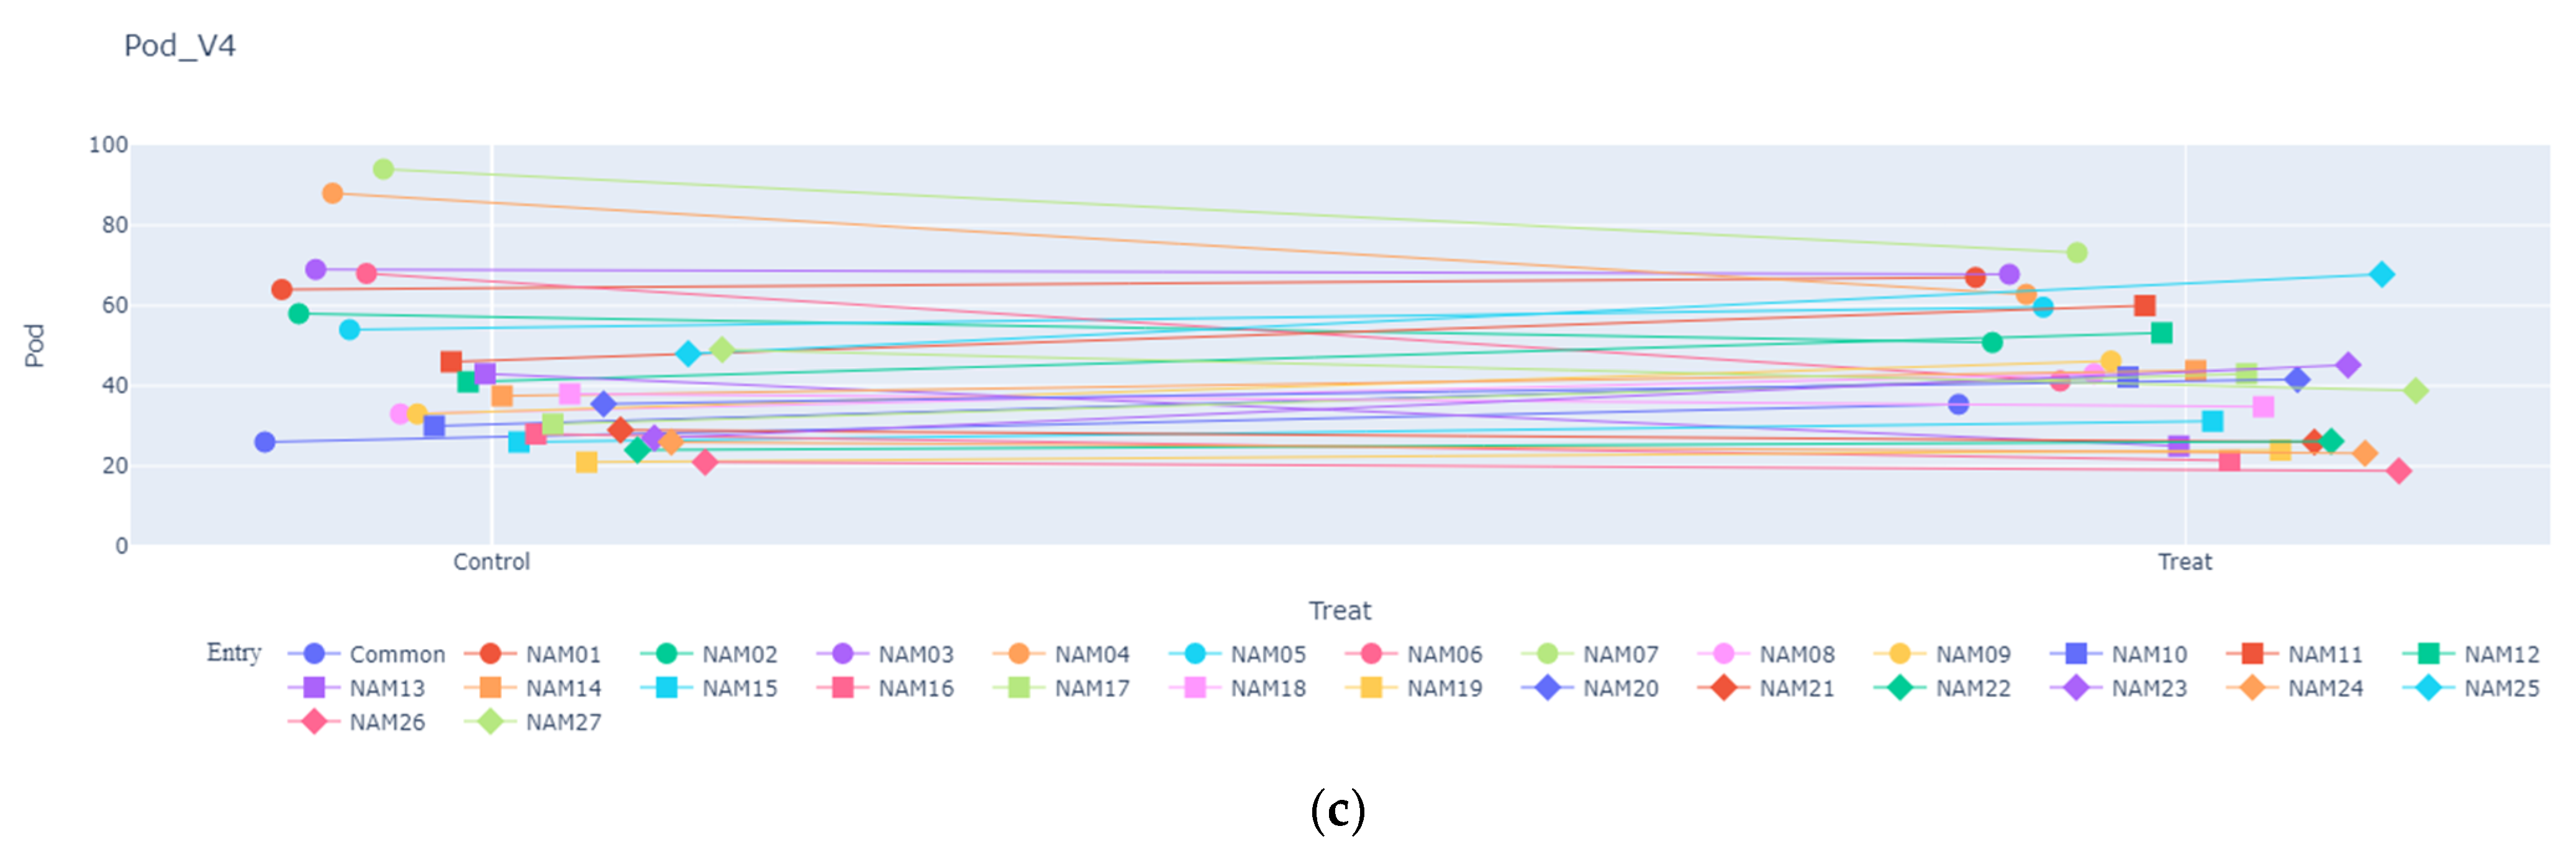
2.1.3. Number of Pods

The pod formation in most varieties did not seem to differ between the unstressed and drought-treated plants (Table 2) among the three different vegetative stages (Figure 4). The extreme values were removed from the dataset.

2.1.4. Area

The data were collected from the imaging chamber. The data were produced by segregating plant areas from the background using color thresholds. Plant area at a vertical angle was measured and visualized to recognize aspects of soybean varieties. The area is the number of pixels in the objected plant. The max values and interval distances between the unstressed and drought-treated plants increased when they were drought-treated later (Figure 5).

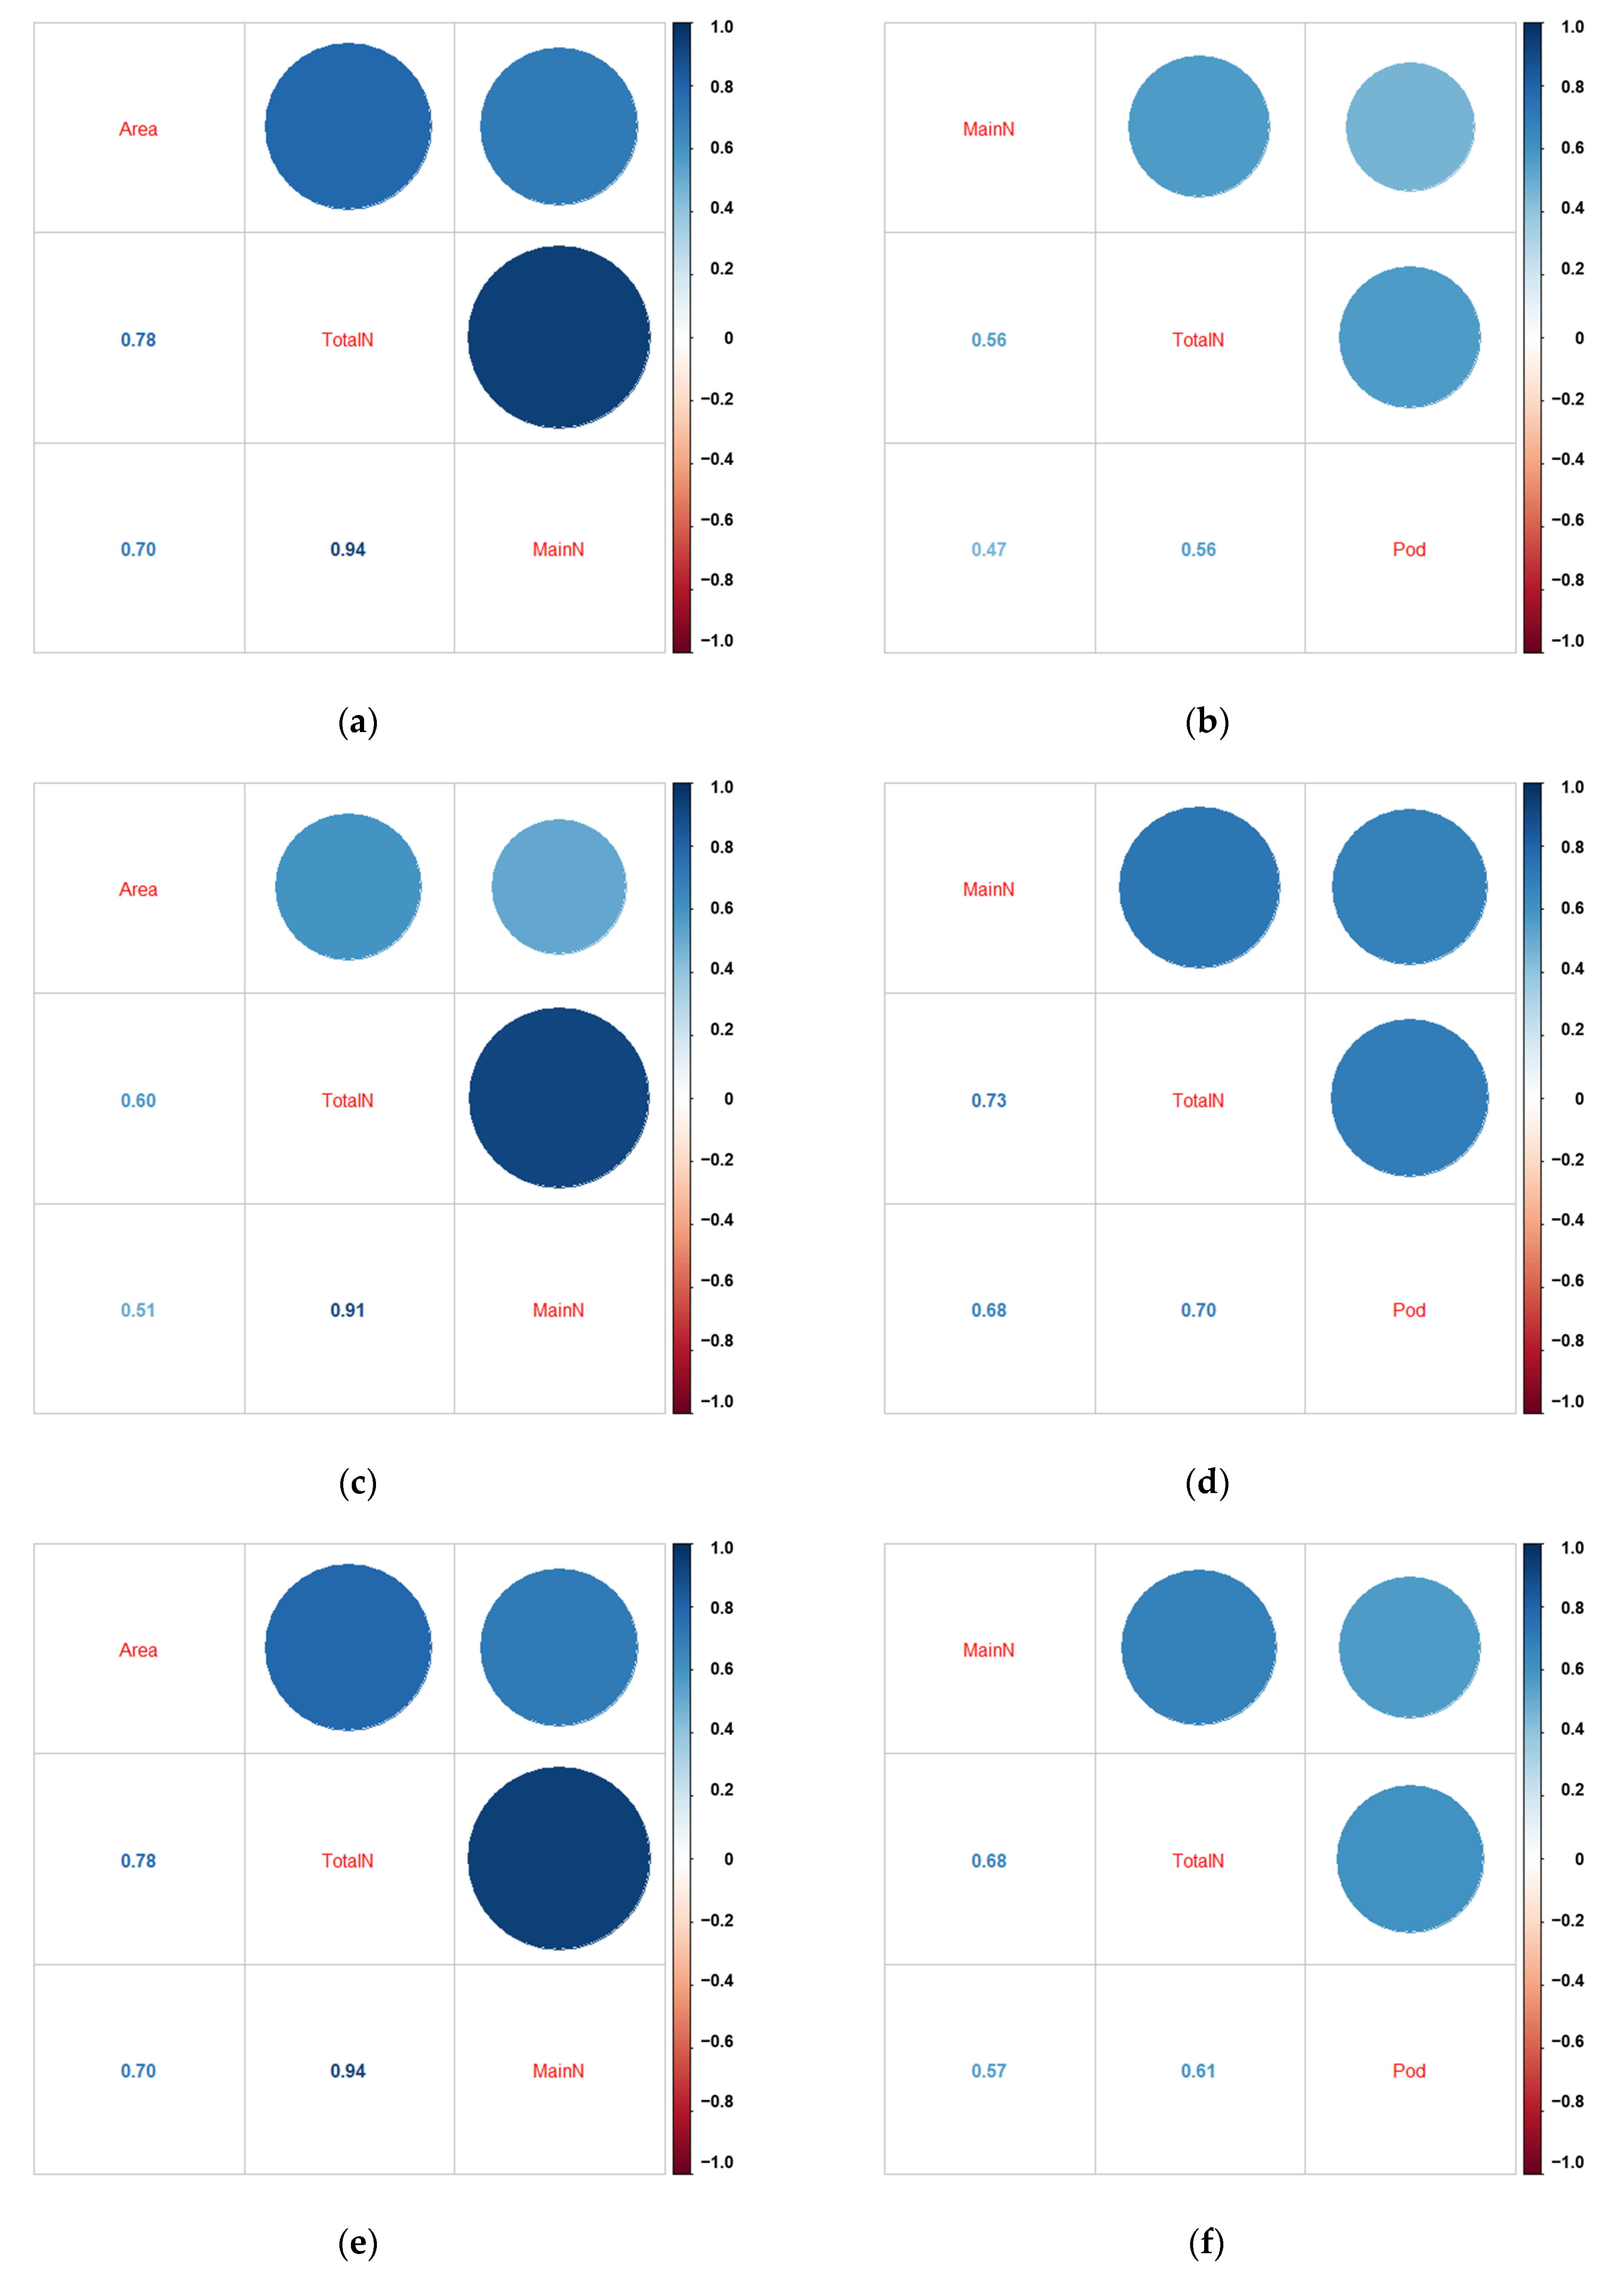
2.2. Statistical Analysis

For data validation and to assess the effects of treatments and varieties, a Kruskal–Wallis analysis of variance was conducted (Table 2). The main nodes seem to be significantly affected by both drought treatment and varieties at all vegetative stages. The lack of influence from variety in total nodes at V2 and V3 occurred by their side branch developments, while there were significant differences by varieties in V4. The total nodes showed drought could not affect the direction of side branch development. This might be due to the resistance acquired from the maturation of soybean plants. The number of pods at V3 and V4 were not affected by treatments and showed diverse results based on their variety. The V2-stressed plants showed different aspects of drought. Moreover, it was possible to show drought influences, but it was impossible to classify their varieties by area data.
Spearman’s correlation coefficient analysis was conducted between the number of main nodes, total nodes, area, and pods (Figure 6). The area showed the highest, but there were medium levels of correlation at V2 (Figure 6a) and V4 (Figure 6e), while the number of pods and nodes showed relatively lower correlations (minimum 0.47 to maximum 0.70).

3. Discussion

The number of nodes and pods was considered to be components for defining yield estimation equations. The results indicated that drought at V2 and V3 affected soybeans by developing side branches, while the drought at V4 inhibited the overall node development. The area, which had medium correlations with the number of nodes (Figure 6), showed the drought treatment was effective enough to decrease the leaf area or height. The formation of nodes seems to vary within each cultivar, depending on the drought-stressed period. The environmental factors, such as temperature, soil moisture, light, and humidity, were controlled in the automated greenhouse during the experiments. Hence, the development of a large number of side nodes in several varieties seems to have resulted from the combination of several uncontrolled factors, such as plant hormone signaling against environmental stresses, or micro-environmental factors such as air, soil pore system, leaf shadings, etc.
Plants respond to drought conditions through the cross-interaction of plant hormones such as abscisic acid (ABA), gibberellin (GA), and trans-zeatin-riboside (ZR) [16]. An increase in the accumulation of ABA, induced in a soil moisture-deficient environment, maintains root growth and increases hydraulic conductivity [17]. To prevent water loss in plant tissues and increases its survival under drought conditions, the ABA signal transmits from the root and regulates stomatal closure and the inhibition of leaf expansion [17]. ABA accumulation in soybean reproductive organs results in pod infertility, which may be one of the most damaging factors in drought stress during the reproductive stage [18]. Moreover, it has been reported that the ZR/IAA (auxin) and ZR/ABA ratios decreased in soybean leaves under drought stress and that the ABA/IAA+GA+ZR ratio was increased, resulting in the inhibition of plant growth [19].
The active growth of drought-damaged plants observed in the current experiment might be explained by Dong et al. (2019) [19]. Compensatory effects of subsequent rehydration after drought treatment, rapid growth in plant height, and an increase in leaf area were reported in proportion to the drought duration and severity. We may expect the main stem and side stem nodes to develop (Figure 1 and Figure 2) due to the weak compensatory effect, as a short period of drought stress treatment results in the formation of more pods in the specific varieties under stress, as shown in Figure 3b and Figure 4.
Muhammad Aslam et al. (2022) reported that drought-induced ABA and other plant hormones activate gene expression cascades that maintain the moisture content of plant leaves with their signaling pathways, thereby activating the expression of resistance genes in plant cells [20]. The growth by compensatory effect seems to be influenced by cytokine expression after a drought.
Cytokine is a well-known plant hormone that plays a negative role in drought stress tolerance by delaying stomatal closure and leaf senescence [21,22], and cytokine biosynthesis is controlled by isopentenyl transferases (IPT). The transgenic plants expressing the IPT gene significantly showed drought tolerance with vigorous growth after drought conditions [21,23]. It has been reported that plant performance improved under drought conditions in IPT-overexpressed Arabidopsis plant [24], and the transpiration rate is increased in young leaves, while the transpiration rate is decreased in aged leaves in IPT-overexpressed tobacco [25]. The cytokine degradative gene expression and the cytokine content decrease during drought in the reproductive stage was reported by Le et al. [26]. However, the expression of the degradative genes during drought in the vegetative stages has not yet been reported. Therefore, compensatory growth of soybean might be assumed by the expression of cytokines after drought stress during the vegetative stages.
The phenotypic data of the soybean population were measured and analyzed. We acquired drought-responsive phenotypic images using the soybean NAM population parents. The patterns of plants against drought stress of each variety were visualized. Different patterns depending on their cultivar seem to be related to genetic variations among cultivars. Several cultivars showed a degree of recovery similar to that of the unstressed group. Moreover, when drought-stressed at the V3 and V4 stages, there were no significant differences in pod production compared to the unstressed group. The recovery close to that of the control after drought treatment is presumed to be due to the expression and interaction of plant hormones.

4. Conclusions

As a result, we confirmed that the different periods of drought stress in early vegetative stages can affect the same variety to develop different phenotypes of the soybean. In addition, it was possible to investigate how drought stress would affect the final yield at each period. We might infer that these results are caused by plant hormones or micro-environmental factors that were uncontrollable. The acceleration of breeding processes of stress resistance varieties is strongly demanded in the current global warming state. However, the combined analysis of genetic data and phenotypic data and more deep studies into plant hormones should be performed. Nevertheless, our results might help in the process of breeding drought-resistant varieties of soybean and might suggest directions for additional studies on plant drought stress.

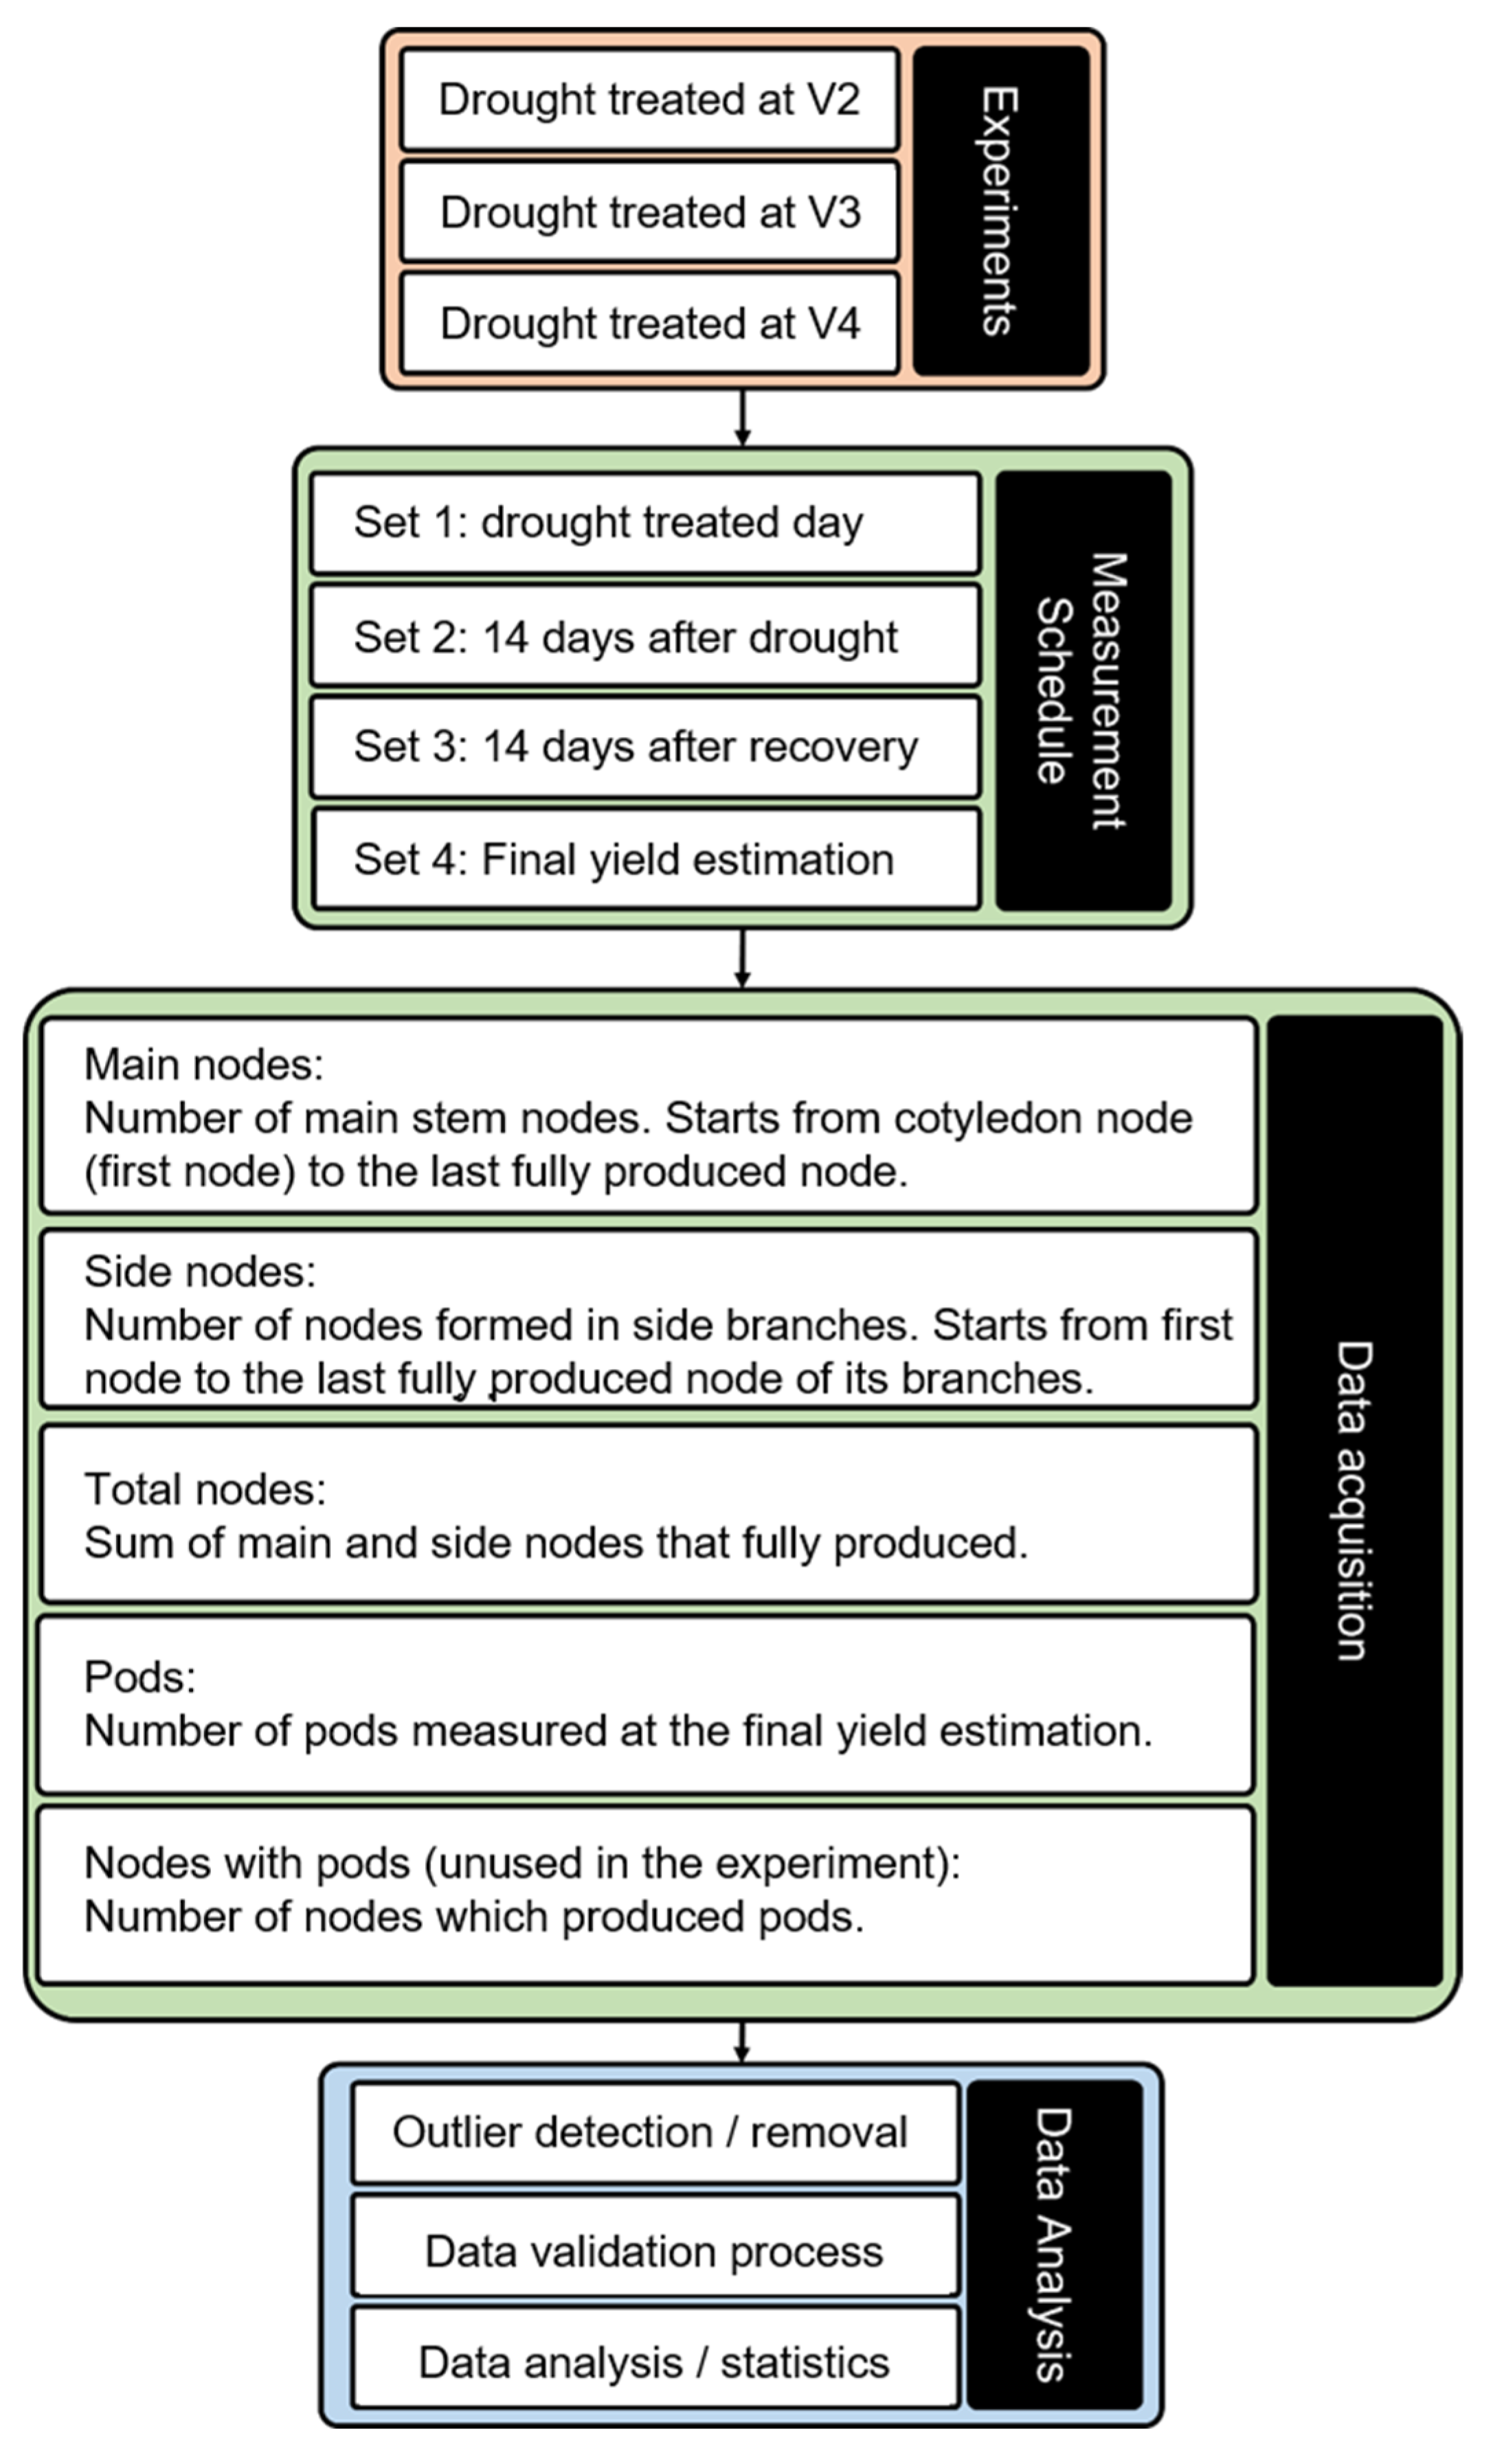
5. Materials and Methods

5.1. Plant Materials

The parents of 28 nested association mapping (NAM) populations of soybean (Glycine max L.), which was provided by RDA (Table 1), were grown until the end of the growth cycle in an automated greenhouse (LemnaTec, Germany) of the Rural Development Administration (RDA). The experiment was conducted into 3 sub-experiments based on the vegetation stages (V2, V3, and V4) of drought treatment. Seven plots of replications consisting of two for the control and five for the treatment composed of randomly placed twenty-eight pots of each variety were created. In total, there was, 1 individual plant in 1 pot, 28 individuals, and 28 varieties per plot. However, 16 varieties of the second plot of unstressed plants were excluded due to the spatial limit of the conveyor belt. Therefore, a total of 180 plant individuals were grown. A soil sensor was placed to monitor soil moisture and soil temperature in the pot of each center of the conveyer belts with random varieties of NAM population planted. The air temperature of the greenhouse was maintained at 28~30 °C during the whole experiment schedule from 21 June 2019 to 3 March 2020. Temperature, light, and humidity were controlled by a self-programmed automatic greenhouse control system. All plants were removed from the conveyor belt to the other greenhouse after the entire imaging schedule ended and then raised until the end of their final harvest.

5.2. Drought Treatments

To identify phenotypic drought responses at early vegetation stages, the experiment consists of 3 sub-experiments. Drought treatment was conducted when 90% of the plants reached the targeted vegetation stage (V2, V3, and V4) of each sub-experiment. The soil moisture of the treated plots was maintained at under 5% for 14 days, which is the maximum limited days on the permanent wilting point under our greenhouse environment. The soil moisture was measured by an auto soil moisture meter WP-700C (MIRAE SENSOR, Korea). However, heavily withered plants were individually watered at 15 mL to prevent their death. Two weeks of a recovery period were given after the drought treatment and all plants were fully watered until the end of their life cycle.

5.3. Measurements

The number of nodes was counted by bare eyes, 4 times in each sub-experiment (Figure 7). Measurement was carried out on the day of the water deficit condition treated (d+00), right after the end of 14 days of drought treatment, 14 days after the recovery period, and the day of final yield estimation. The measured parameters were the number of main nodes, side nodes, total nodes, pods, and the number of nodes with pods. Main node counting started from the cotyledon node as node one to the last node of the main stem that was fully produced. The side nodes were counted from nodes that formed in all branches. Total nodes were estimated from the sum of the main and side nodes. Additionally, pods and the number of nodes formed were counted on the harvesting day to estimate final yields. The final yielding date was determined when 90% of the pods of the soybean individuals were fully matured.

5.4. Image Data

In order to collect the leaf area and plant height, area data from the vertical angle was measured from the images. The images were acquired from an imaging chamber (LemnaTec, Aachen, Germany). The RGB images were taken at a horizontal angle. The image acquisition proceeded once a day, from 15 days before drought treatment to the end of drought treatment. However, the imaging date differed due to facility schedules for its maintenance. Image data acquired in the same number of days elapsed from the drought treatment were used for the analysis. For pre-processing the images, we used an algorithm based on Python 3.8 in order to crop images and remove unwanted objects and backgrounds. Then, plant image data were processed by ImageJ (Ver. 1.52a, National Institutes of Health, Bethesda, MD, USA) to estimate quantified plant area, which features a number of pixels of a plant in the image.

5.5. Statistical Analysis

The hand-measured data were analyzed by R programming (Ver. 4.2.2, R Core Team, 2021). Missing data and outliers were removed from the datasets. The Kruskal–Wallis analysis of variance was conducted [27]. Then, Spearman’s correlation coefficient analysis was performed between the number of nodes and area data, or the number of nodes and the number of pods.

Author Contributions

Conceptualization, K.K.; Methodology, J.K., C.L., J.-E.P., Y.S.C. and K.K.; Software, J.-E.P. and Y.S.C.; Validation, C.L., S.M. and K.K.; Formal analysis, J.K., C.L., J.-E.P., S.M. and Y.S.C.; Investigation, J.K.; Writing—original draft, J.-E.P. and K.K.; Writing—review & editing, C.L., S.M. and Y.S.C.; Project administration, K.K. All authors have read and agreed to the published version of the manuscript.

Funding

This work was carried out with the support of “Cooperative Research Program for Agriculture Science and Technology Development (Project No. PJ01486501)” Rural Development Administration, Republic of Korea.

Institutional Review Board Statement

Not applicable.

Informed Consent Statement

Not applicable.

Data Availability Statement

Data available on request due to restrictions.

Conflicts of Interest

The authors declare no conflict of interest.

References

  1. El Mokhtar, M.A.; Anli, M.; Laouane, R.B.; Boutasknit, A.; Boutaj, H.; Draoui, A.; Zarik, L.; Fakhech, A. Food security and climate change. In Research Anthology on Environmental and Societal Impacts of Climate Change; Information Resources Management Association, Ed.; lgi Global: Hershey, PA, USA, 2022; pp. 44–63. [Google Scholar] [CrossRef]
  2. da Silva, E.C.; Nogueira, R.J.M.C.; da Silva, M.A.; de Albuquerque, M.B. Drought stress and plant nutrition. Plant Stress 2011, 5, 32–41. [Google Scholar]
  3. Lipiec, J.; Doussan, C.; Nosalewicz, A.; Kondracka, K. Effect of drought and heat stresses on plant growth and yield: A review. Int. Agrophys. 2013, 27, 463–477. [Google Scholar] [CrossRef]
  4. Farooq, M.; Hussain, M.; Wahid, A.; Siddique, K.H.M. Drought stress in plants: An overview. In Plant Responses to Drought Stress; Aroca, R., Ed.; Springer: Berlin, Germany, 2012; pp. 1–33. [Google Scholar] [CrossRef]
  5. Fahad, S.; Bajwa, A.A.; Nazir, U.; Anjum, S.A.; Farooq, A.; Zohaib, A.; Sadia, S.; Nasim, W.; Adkins, S.; Saud, S.; et al. Crop production under drought and heat stress: Plant responses and management options. Front. Plant Sci. 2017, 8, 1147. [Google Scholar] [CrossRef] [Green Version]
  6. Bita, C.E.; Gerats, T. Plant tolerance to high temperature in a changing environment: Scientific fundamentals and production of heat stress-tolerant crops. Front. Plant Sci. 2013, 4, 273. [Google Scholar] [CrossRef] [Green Version]
  7. Zhang, R.; Qu, Y.; Zhang, X.; Wu, X.; Zhou, X.; Ren, B.; Zeng, J.; Wang, Q. Spatiotemporal variability in annual drought severity, duration, and frequency from 1901 to 2020. Clim. Res. 2022, 87, 81–97. [Google Scholar] [CrossRef]
  8. Tuberosa, R.; Salvi, S. Genomics-based approaches to improve drought tolerance of crops. Trends Plant Sci. 2006, 11, 405–412. [Google Scholar] [CrossRef]
  9. Bernier, J.; Atlin, G.N.; Serraj, R.; Kumar, A.; Spaner, D. Breeding upland rice for drought resistance. J. Sci. Food Agric. 2008, 88, 927–939. [Google Scholar] [CrossRef]
  10. Ku, Y.S.; Au-Yeung, W.K.; Yung, Y.L.; Li, M.W.; Wen, C.Q.; Liu, X.; Lam, H.M. Drought stress and tolerance in soybean. In A Comprehensive Survey of International Soybean Research—Genetics, Physiology, Agronomy and Nitrogen Relationships; Board, J., Ed.; IntechOpen: London, UK, 2013; pp. 209–237. [Google Scholar] [CrossRef]
  11. Vogel, J.T.; Liu, W.; Olhoft, P.; Crafts-Brandner, S.J.; Pennycooke, J.C.; Christiansen, N. Soybean yield formation physiology–a foundation for precision breeding based improvement. Front. Plant Sci. 2021, 12, 719706. [Google Scholar] [CrossRef]
  12. Kantolic, A.G.; Slafer, G.A. Reproductive development and yield components in indeterminate soybean as affected by post-flowering photoperiod. Field Crops Res. 2005, 93, 212–222. [Google Scholar] [CrossRef]
  13. Xiong, R.; Liu, S.; Considine, M.J.; Siddique, K.H.; Lam, H.M.; Chen, Y. Root system architecture, physiological and transcriptional traits of soybean (Glycine max L.) in response to water deficit: A review. Physiol. Plant. 2021, 172, 405–418. [Google Scholar] [CrossRef]
  14. Desclaux, D.; Roumet, P. Impact of drought stress on the phenology of two soybean (Glycine max L. Merr) cultivars. Field Crops Res. 1996, 46, 61–70. [Google Scholar] [CrossRef]
  15. Kron, A.P.; Souza, G.M.; Ribeiro, R.V. Water deficiency at different developmental stages of Glycine max can improve drought tolerance. Bragantia 2008, 67, 43–49. [Google Scholar] [CrossRef] [Green Version]
  16. Liu, F.; Jensen, C.R.; Andersen, M.N. Hydraulic and chemical signals in the control of leaf expansion and stomatal conductance in soybean exposed to drought stress. Funct. Plant Biol. 2003, 30, 65–73. [Google Scholar] [CrossRef]
  17. Zhang, J.; Smith, D.L.; Liu, W.; Chen, X.; Yang, W. Effects of shade and drought stress on soybean hormones and yield of main-stem and branch. Afr. J. Biotechnol. 2011, 10, 14392–14398. [Google Scholar] [CrossRef] [Green Version]
  18. Liu, F.; Andersen, M.N.; Jensen, C.R. Loss of pod set caused by drought stress is associated with water status and ABA content of reproductive structures in soybean. Funct. Plant Biol. 2003, 30, 271–280. [Google Scholar] [CrossRef] [PubMed]
  19. Dong, S.; Jiang, Y.; Dong, Y.; Wang, L.; Wang, W.; Ma, Z.; Yan, C.; Ma, C.; Liu, L. A study on soybean responses to drought stress and rehydration. Saudi J. Biol. Sci. 2019, 26, 2006–2017. [Google Scholar] [CrossRef] [PubMed]
  20. Muhammad Aslam, M.; Waseem, M.; Jakada, B.H.; Okal, E.J.; Lei, Z.; Saqib, H.S.A.; Yuan, W.; Xu, W.; Zhang, Q. Mechanisms of Abscisic Acid-Mediated Drought Stress Responses in Plants. Int. J. Mol. Sci. 2022, 23, 1084. [Google Scholar] [CrossRef] [PubMed]
  21. Peleg, Z.; Reguera, M.; Tumimbang, E.; Walia, H.; Blumwald, E. Cytokinin-mediated source/sink modifications improve drought tolerance and increase grain yield in rice under water-stress. Plant Biotechnol. J. 2011, 9, 747–758. [Google Scholar] [CrossRef]
  22. Sarwat, M.; Tuteja, N. Hormonal signaling to control stomatal movement during drought stress. Plant Gene 2017, 11, 143–153. [Google Scholar] [CrossRef]
  23. Rivero, R.M.; Shulaev, V.; Blumwald, E. Cytokinin-dependent photorespiration and the protection of photosynthesis during water deficit. Plant Physiol. 2009, 150, 1530–1540. [Google Scholar] [CrossRef] [Green Version]
  24. Tanaka, Y.; Sano, T.; Tamaoki, M.; Nakajima, N.; Kondo, N.; Hasezawa, S. Cytokinin and auxin inhibit abscisic acid-induced stomatal closure by enhancing ethylene production in Arabidopsis. J. Exp. Bot. 2006, 57, 2259–2266. [Google Scholar] [CrossRef] [PubMed] [Green Version]
  25. Synková, H.; Van Loven, K.; Pospíšilová, J.; Valcke, R. Photosynthesis of transgenic Pssu-ipt tobacco. J. Plant Physiol. 1999, 155, 173–182. [Google Scholar] [CrossRef]
  26. Le, D.T.; Nishiyama, R.; Watanabe, Y.; Vankova, R.; Tanaka, M.; Seki, M.; Ham, L.H.; Yamaguchi-Shinozaki, K.; Shinozaki, K.; Tran, L.S.P. Identification and expression analysis of cytokinin metabolic genes in soybean under normal and drought conditions in relation to cytokinin levels. PLoS ONE 2012, 7, e42411. [Google Scholar] [CrossRef] [Green Version]
  27. Kruskal, W.H.; Wallis, W.A. Use of ranks in one-criterion variance analysis. J. Am. Stat. Assoc. 1952, 47, 583–621. [Google Scholar] [CrossRef]
Figure 1. Line plots of the number of main nods in each variety. The x-axis is the measuring set (1: before drought treatment; 2: start of drought treatment; 3: after drought treatment; 4: final yield) and the y-axis is the number of main nodes. Red is unstressed; blue is drought-treated. (a) Drought treatment at V2; (b) drought treatment at V3; (c) drought treatment at V4.
Sustainability 15 04852 g001aSustainability 15 04852 g001b
Figure 2. Line plots of the number of total nods in each variety. The x-axis is the measuring set (1: before drought treatment; 2: start of drought treatment; 3: after drought treatment; 4: final yield) and the y-axis is the number of total nodes. Red is unstressed; blue is drought-treated. (a) Drought treatment at V2; (b) drought treatment at V3; (c) drought treatment at V4.
Sustainability 15 04852 g002aSustainability 15 04852 g002b
Figure 3. Scatter plots of the morphological traits. The x-axis is the number of main nodes; the y-axis is the number of total nodes; red is unstressed; blue is drought-treated. (a) Is the total nodes and main nodes; (b) is the pods and total nodes.
Sustainability 15 04852 g003aSustainability 15 04852 g003b
Figure 4. Line plots of the number of pods in each variety. The x-axis is the unstressed and drought-treated and the y-axis is the number of pods. (a) Number of pods at V2; (b) number of pods at V3; (c) number of pods at V4.
Sustainability 15 04852 g004aSustainability 15 04852 g004b
Figure 5. Line plot of the area in each variety. The x-axis is the imaging date; the y-axis is the number of pixels in the objected plant; the red line is unstressed; the blue is drought-treated. (a) Area data of V2 set; (b) area data of V3 set; (c) area data of V4 set.
Sustainability 15 04852 g005aSustainability 15 04852 g005b
Figure 6. Correlation plots of the morphological traits in each vegetative stage. (a) Correlation plots of area, main nodes, and total nodes at V2; (b) correlation plots of pods, main nodes, and total nodes at V2; (c) correlation plots of area, main nodes, and total nodes at V3; (d) correlation plots of pods, main nodes, and total nodes at V3; (e) correlation plots of area, main nodes, and total nodes at V4; (f) correlation plots of pods, main nodes, and total nodes at V4.
Sustainability 15 04852 g006
Figure 7. Schematic of data acquisition and analyzing progress.
Sustainability 15 04852 g007
Table 1. The soybean varieties used in composing NAM population parents.
NAM NumberVariety
CommonDaepung
NAM 01Bangsa
NAM 02Pungwon
NAM 03Hannam
NAM 04Sowon
NAM 05Galche
NAM 06Somyeong
NAM 07Sinhwa
NAM 08Pureun
NAM 09Taegwang
NAM 10Wuram
NAM 11Danbek
NAM 12PI96983
NAM 13Haman
NAM 14Willians82
NAM 15Saedanbek
NAM 16Daewon
NAM 17Hwanggeum
NAM 18Chungja
NAM 19Chungja 3ho
NAM 20Sochung 2ho
NAM 21Ilpumgeomjung
NAM 22Daeheuk
NAM 23Josangseori
NAM 24Yeunpung
NAM 25Chunal
NAM 26Heukchung
NAM 27Seoritae
Table 2. The Kruskal–Wallis analysis of variance of each vegetative stage for the drought stress treatment.
Vegetative StageVariables (1)dfp (<0.05)
V2Main nodesTreatment1<0.005 * (2)
Varieties27<0.005 *
Total nodesTreatment1<0.005 *
Varieties270.2503
PodsTreatment10.01479 *
Varieties27<0.005 *
AreaTreatment1<0.005 *
Varieties270.9673
V3Main nodesTreatment1<0.005 *
Varieties27<0.005 *
Total nodesTreatment1<0.005 *
Varieties270.7901
PodsTreatment10.6713
Varieties27<0.005 *
AreaTreatment1<0.005 *
Varieties270.3360
V4Main nodesTreatment1<0.005 *
Varieties27<0.005 *
Total nodesTreatment1<0.005 *
Varieties27<0.005 *
PodsTreatment10.6582
Varieties27<0.005 *
AreaTreatment1<0.005 *
Varieties270.2394
(1) Treatment: unstressed and drought-treated; varieties: 28 varieties of NAM population. (2) ‘*’ Statistically different at the <0.05 significance level, Kruskal–Wallis analysis of variance.
Disclaimer/Publisher’s Note: The statements, opinions and data contained in all publications are solely those of the individual author(s) and contributor(s) and not of MDPI and/or the editor(s). MDPI and/or the editor(s) disclaim responsibility for any injury to people or property resulting from any ideas, methods, instructions or products referred to in the content.

