Article

Assessing the Impact of Future Sea Level Rise on Blue Carbon Ecosystem Services on Long Island, New York

Environmental Studies Program, Hamilton College, Clinton, NY 13323, USA
*
Author to whom correspondence should be addressed.
Sustainability 2023, 15(6), 4733; https://doi.org/10.3390/su15064733
Submission received: 4 February 2023 / Revised: 28 February 2023 / Accepted: 3 March 2023 / Published: 7 March 2023
(This article belongs to the Section Environmental Sustainability and Applications)

Abstract

:
Salt marsh ecosystems provide critical climate mitigation ecosystem services through carbon sequestration. Sea level rise (SLR) has variable effects on these ecosystems, both driving marsh migration into upland areas and causing inundation and erosion that reduces marsh extent. How salt marsh carbon sequestration responds to SLR thus represents an important carbon cycle feedback to climate change. Here, we examine the consequences of one meter (1 m) of SLR for salt marsh ecosystem carbon sequestration for Long Island, New York and for the North Fork peninsula in far northeastern Long Island using three different assumptions for salt marsh carbon sequestration rates. For the entirety of Long Island, SLR will reduce future carbon sequestration by 22 million tons of carbon dioxide (CO2) by 2100 under the medium sequestration rate assumption compared to a no-SLR scenario. This represents a net loss of $137.5 billion in carbon sequestration ecosystem service value due to SLR. On the North Fork peninsula, however, SLR increases sequestration by 370,000 tons of CO2 with a medium sequestration rate assumption relative to a no-SLR scenario. However, the magnitude of uncertainty in future carbon sequestration due to different assumptions of carbon sequestration rates is greater than the impact of SLR on carbon sequestration, pointing to the need for the use of field-based measurement of sequestration rates in managing coastal ecosystem response to climate change.

1. Introduction

The urgency of the climate crisis threatens coastal community livelihoods around the world and requires global decarbonization leading to a net-zero-emissions future [1]. Pathways to global net zero emissions necessitate the use of negative emissions technologies that will sequester CO2 from the atmosphere. Coastal ecosystems, including mangrove forests, seagrass meadows, and salt marshes—collectively known as blue carbon ecosystems—are an important source of negative emissions [2]. Carbon burial rates per unit area in blue carbon ecosystems are similar to those of terrestrial forest ecosystems [3,4]. Coastal vegetated ecosystems account for less than 2% of ocean area and less than 5% of land area globally but sequester nearly half of all carbon in marine sediments [5]. With such small land cover, but high rates of carbon burial, protecting coastal vegetated ecosystems can have a disproportionately large impact on increasing carbon sequestration. Globally, tidal wetland ecosystems accumulate 196 million tons of CO2 per year [6]. Conversely, the destruction of blue carbon environments may currently produce emissions of 440 million tons of CO2 per year [7]. For these reasons, accounting for blue carbon ecosystems and changes in their carbon stocks is critical to effective natural and working lands climate mitigation policies at national and subnational scales [8,9].
Because they are positioned along coastlines, blue carbon ecosystems are uniquely impacted by SLR associated with the climate crisis. How blue carbon ecosystems and their carbon mitigation ecosystem services respond to SLR thus represents a key feedback within the global carbon cycle. The impacts of SLR on coastal salt marshes can be variable. Rising sea levels can increase carbon burial in coastal ecosystems, as salt marshes encroach upon terrestrial forest ecosystems, resulting in marsh migration into upland areas [10]. This process of marsh migration increases wetlands’ land cover, leading to both accretion of allochthonous carbon and accumulation of autochthonous carbon in newly created marsh ecosystems [7]. The loss of terrestrial forests with marsh migration, however, can create “ghost forests”, and forest loss, which can reduce the overall carbon sequestration of these areas. Smith and Kirwan (2021) [4] found that carbon stored in tree biomass was greater than organic soil carbon in marsh-forest ecosystems, leading to a net loss of buried carbon as sea levels rise and terrestrial forests are lost to coastal wetlands. However, over longer time periods, as SLR submerges salt marsh vegetation and erodes soils, salt marsh extent may decrease, leading to reductions in carbon storage ecosystem services [11]. The net balance of inundation-induced accretion and marsh migration, erosion-induced losses in marsh extent, and the carbon consequences of upland land conversion will dictate how SLR will affect this vital source of negative emissions. Wang et al. (2021) [6] found globally that climate change is likely to increase carbon accumulation in tidal wetlands, while Warnell et al. (2022) [12] studied the consequences of SLR for salt marshes on the east coast of the United States and found that anticipated SLR will lead to initial expansions of marsh area but will eventually lead to declines in marsh extent.
Coastal planning is key to climate change adaptation; coastal development projects that eliminate or disturb wetland habitats leave communities more vulnerable to the risks of SLR because of the loss of storm-attenuating ecosystem services [13], while restoring wetlands can increase their marshes’ ability to reduce flood damages. Leaving wetland soils undisturbed also ensures that buried carbon remains stored. Coastal communities are facing decisions about how best to prepare for marsh migration and how to cope with losses of coastal ecosystem services [14]. At the same time, subnational climate policymakers are increasingly focused on developing better accounting for carbon stored in natural and working lands and how those carbon stocks are responding to climate change, in order to help them achieve net-zero emissions targets [9]. In all cases, managers need to have access to credible, salient, easy-to-produce, spatially explicit information about coastal carbon ecosystem services to make informed decisions.
We focus this study on Long Island, New York, a low-lying, heavily populated island in the northeastern United States that is uniquely vulnerable to the impacts of SLR (Figure 1). Here, we examine the future net carbon sequestration potential of Long Island’s salt marshes under an anticipated projection of one meter (1 m) of SLR by 2100.

2. Materials and Methods
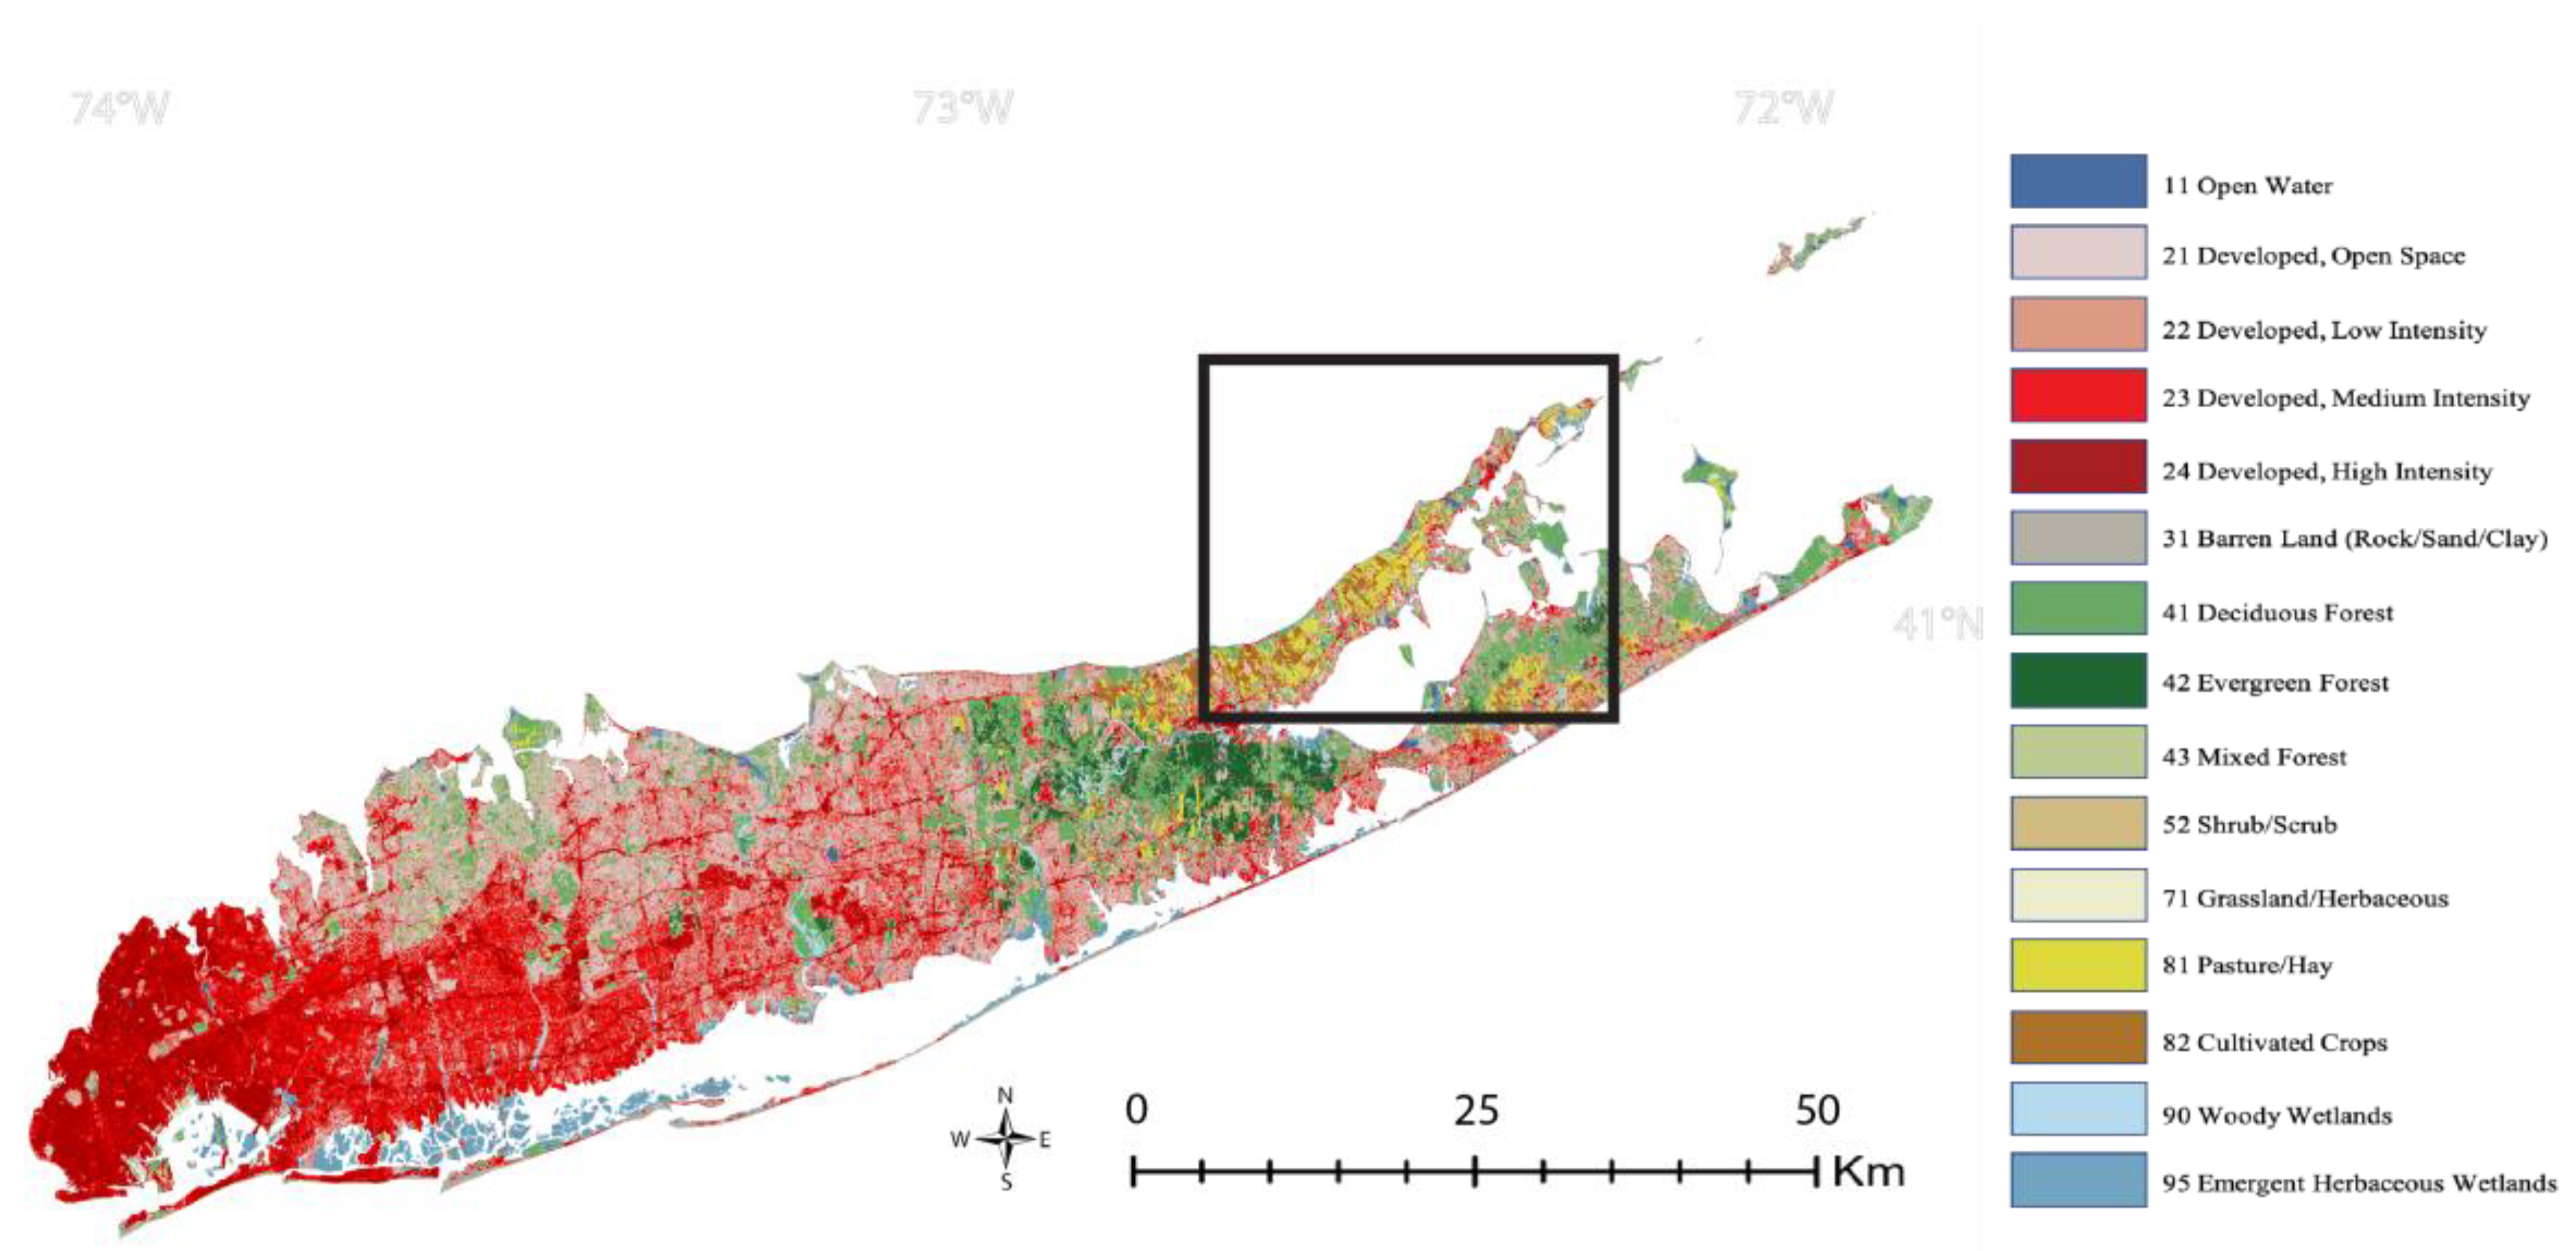
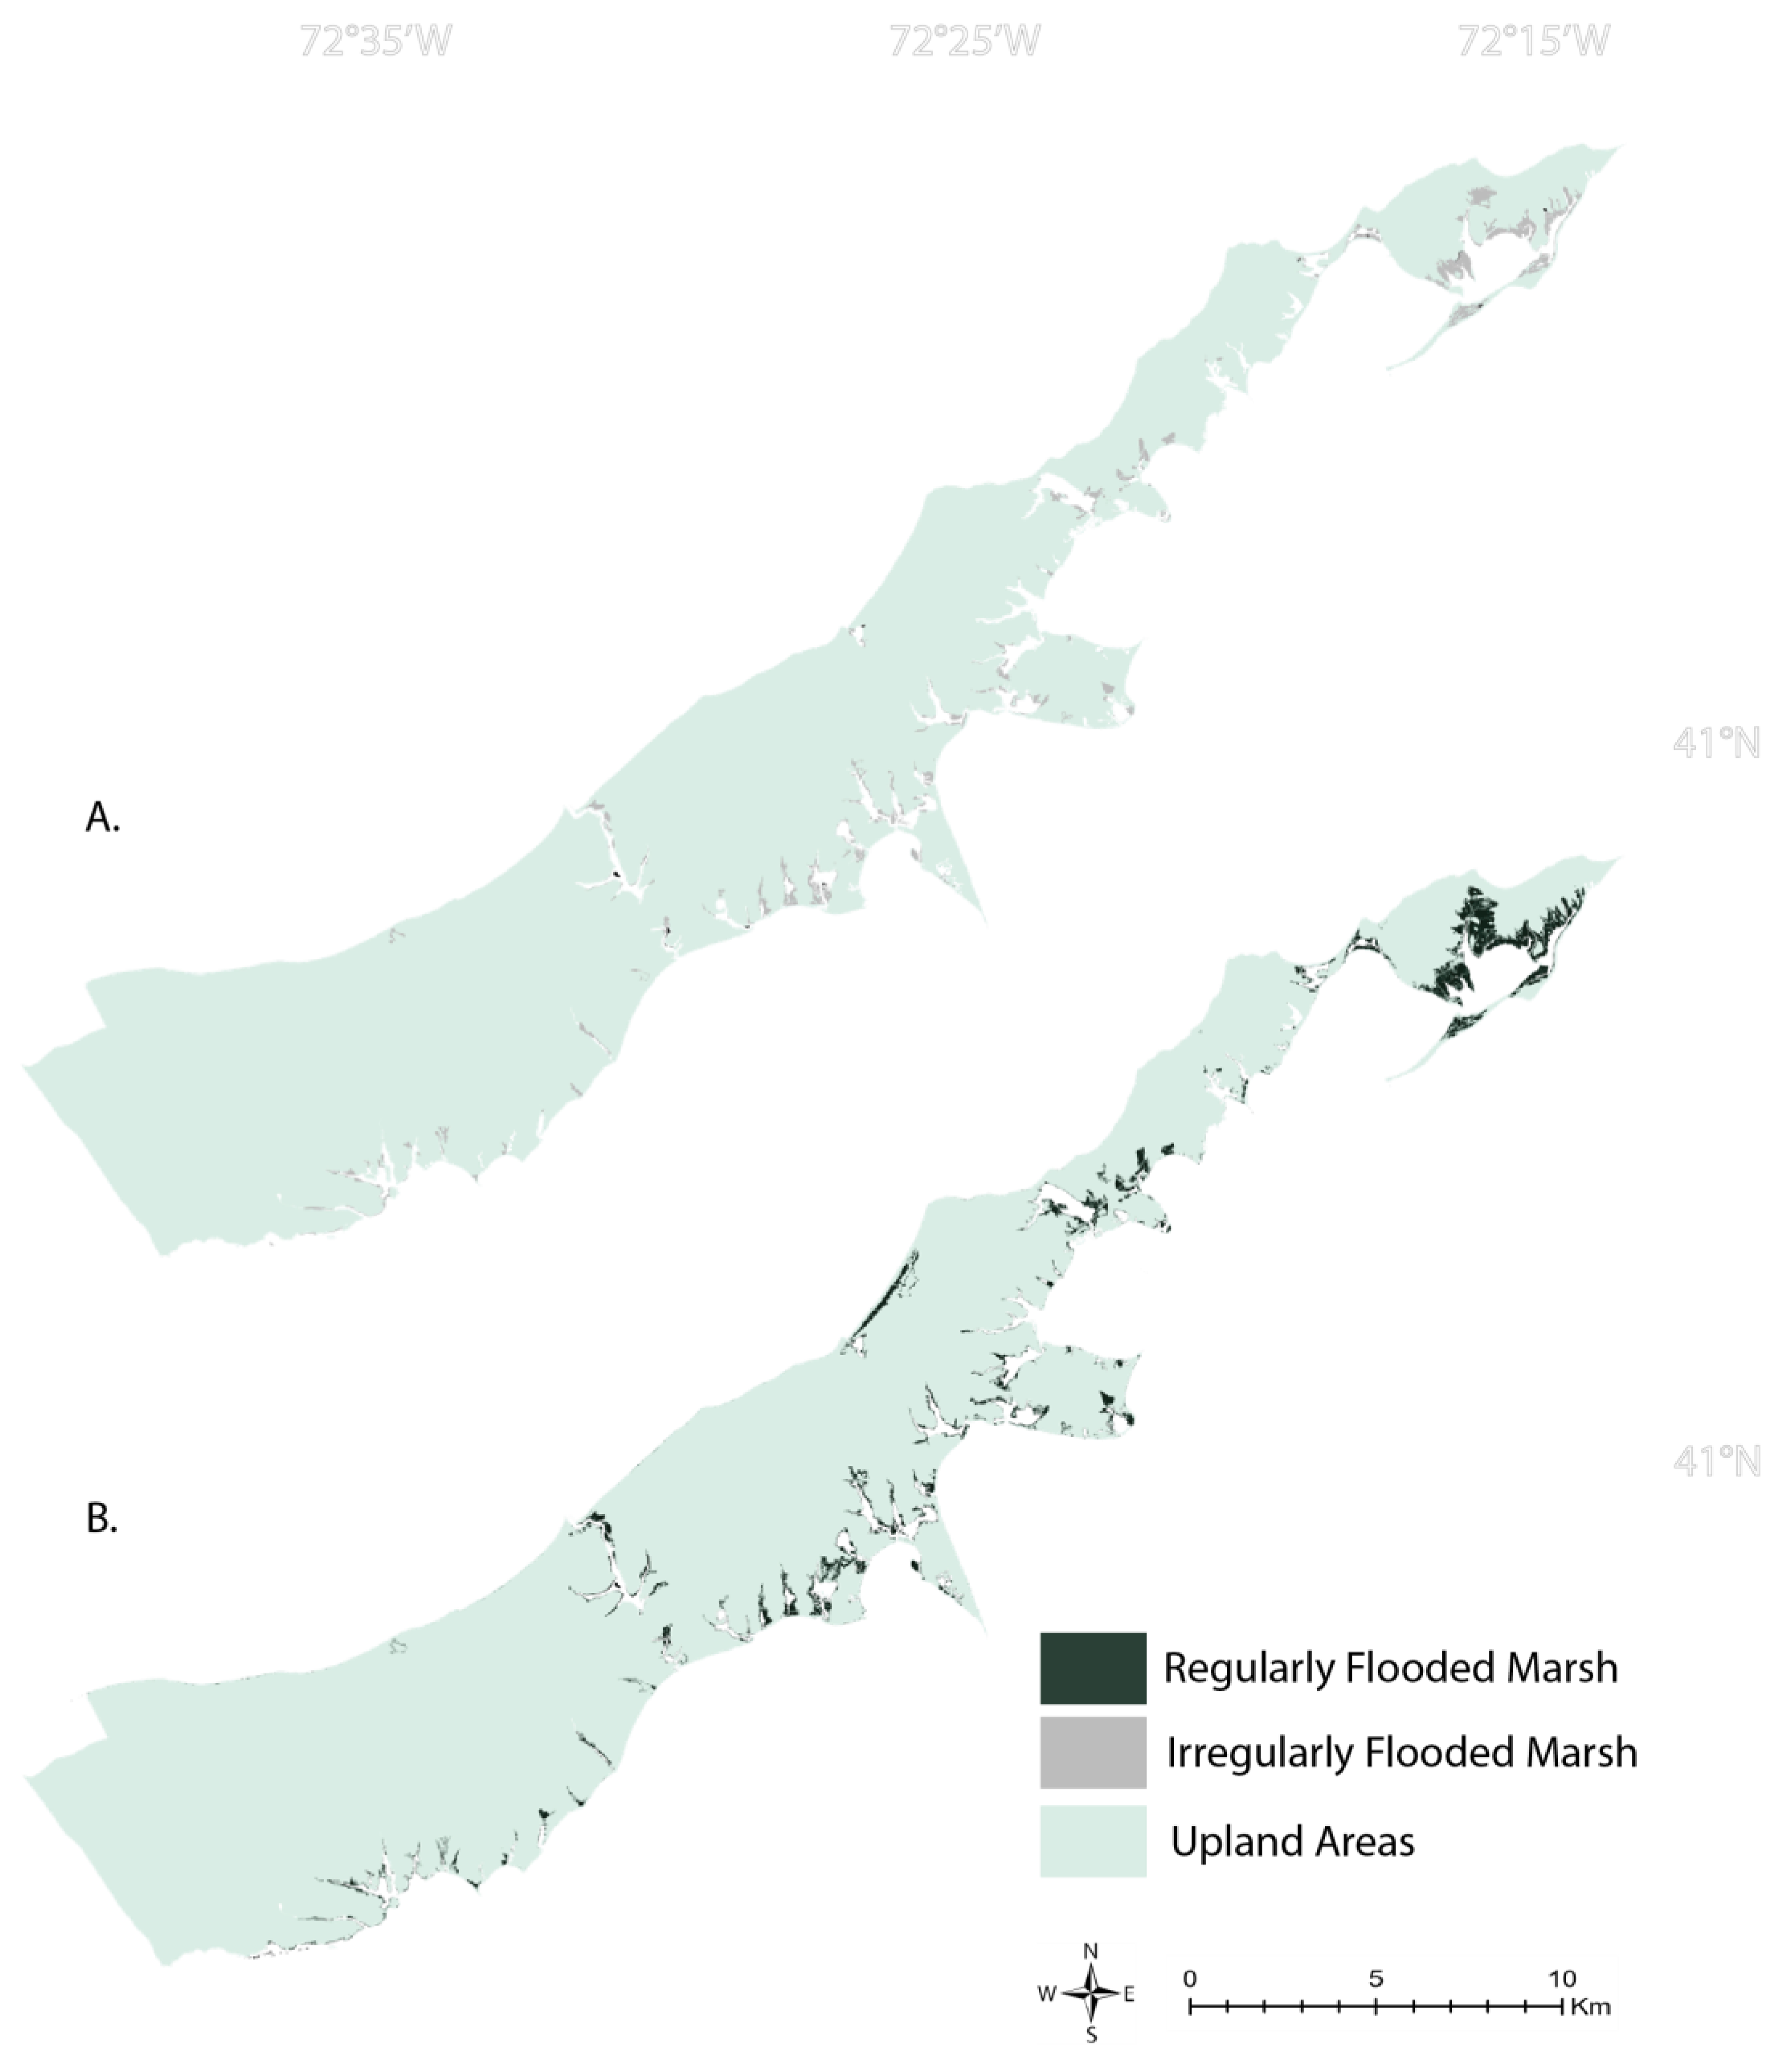
To assess the impacts of sea level rise on salt marsh blue carbon ecosystem services across Long Island, we first used outputs from the Sea Level Affecting Marshes Model (SLAMM v.6.2). SLAMM is a process-based model of land cover changes from SLR due to both inland migration of marshes caused by more frequent inundation and sediment accretion and erosion and loss of regularly flooded marshes. These changes in land cover due to SLR were then used as inputs into a spatially explicit ecosystem service valuation model—the Natural Capital Project’s Integrated Valuation of Ecosystem Services and Tradeoffs (InVEST v3.9) Coastal Blue Carbon model. InVEST’s Coastal Blue Carbon model assesses changes in carbon storage and sequestration over time in areas with changing land cover. Thus, we assessed changes in net carbon sequestration due to changes in marsh cover as a result of SLR on Long Island. To analyze the sensitivity of the effects of SLR to a range of future potential sequestration rates, we used three different assumptions of rates of carbon sequestration per hectare. These three values were taken from Drake et al. (2015) [16]’s measurements at the Wertheim National Wildlife Refuge on the south shore of Long Island. Figure 2 presents an overview of the workflow used in this study.

2.1. Study Area

We defined Long Island as the extent of Nassau and Suffolk Counties in New York State (thus excluding New York City from our analyses). First, we modeled the effects of SLR of 1 m by 2100—a degree of future SLR which is within the mid-range of future climate model uncertainty bound projections—on coastal wetlands on Long Island, New York using SLAMM.

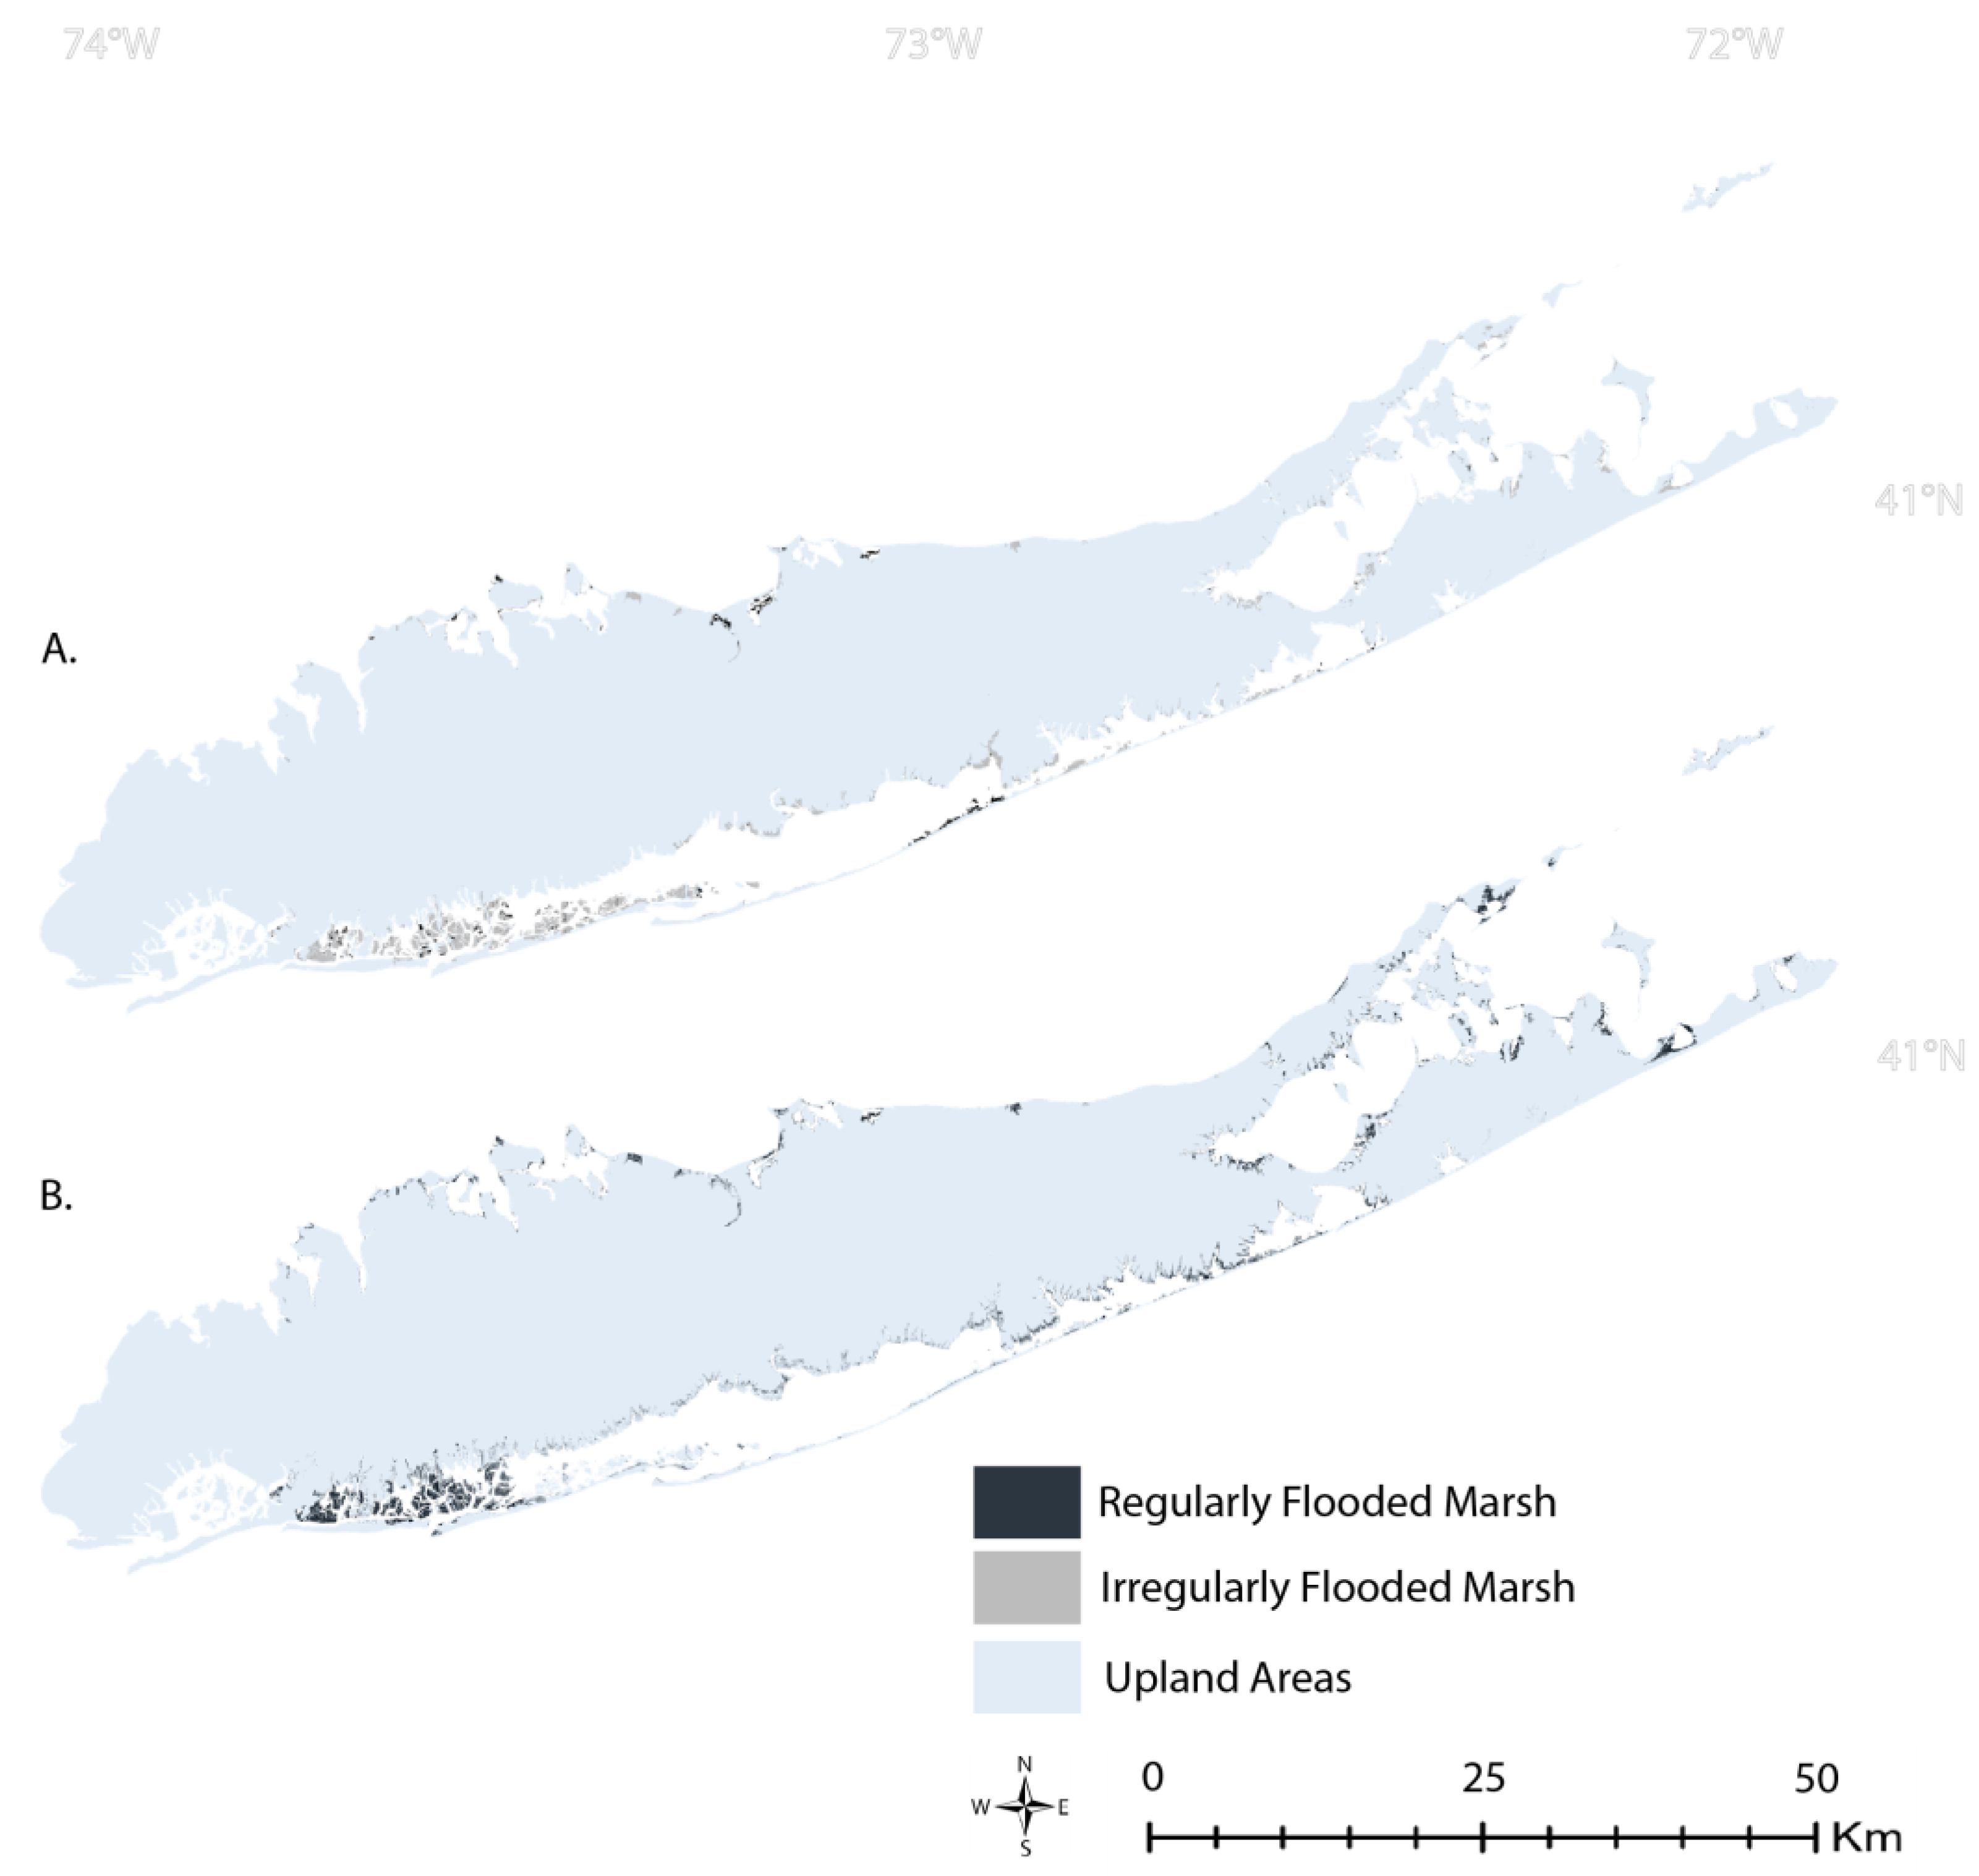
2.2. Sea Level Rise Inputs

SLAMM’s required inputs are a Digital Elevation Model raster, a slope raster calculated from the digital elevation model, an existing land use–land cover raster using land cover classifications from the National Wetlands Inventory, and National Oceanic and Atmospheric Administration (NOAA)-derived tide information. Land cover rasters have a pixel resolution of 30 m. Salinity rasters can also be used to estimate future vegetation change. Using a 2010 sea level baseline, SLAMM then estimates changes in land cover classifications due to inundation, erosion, barrier island overwash, saturation, and accretion processes associated with a given amount and rate of SLR. In 2015, the New York State Energy Research and Development Authority (NYSERDA) commissioned an assessment of SLR impacts on coastal New York State using SLAMM. For 1 m of SLR by 2100, SLAMM generates a land cover raster for 2100 and intermediate snapshot land cover rasters for 2025, 2055, and 2085. SLAMM land cover classification codes—derived from National Wetlands Inventory codes—are shown in Table 1 below. To isolate salt marsh habitats in the 2025, 2055, 2085, and 2100 rasters of Long Island, we generated reclassified SLAMM rasters, which retained only those pixels classified as regularly flooded marsh and irregularly flooded marsh, with all other pixels classified as ‘non-blue carbon’ (see Step 2 in Figure 2).

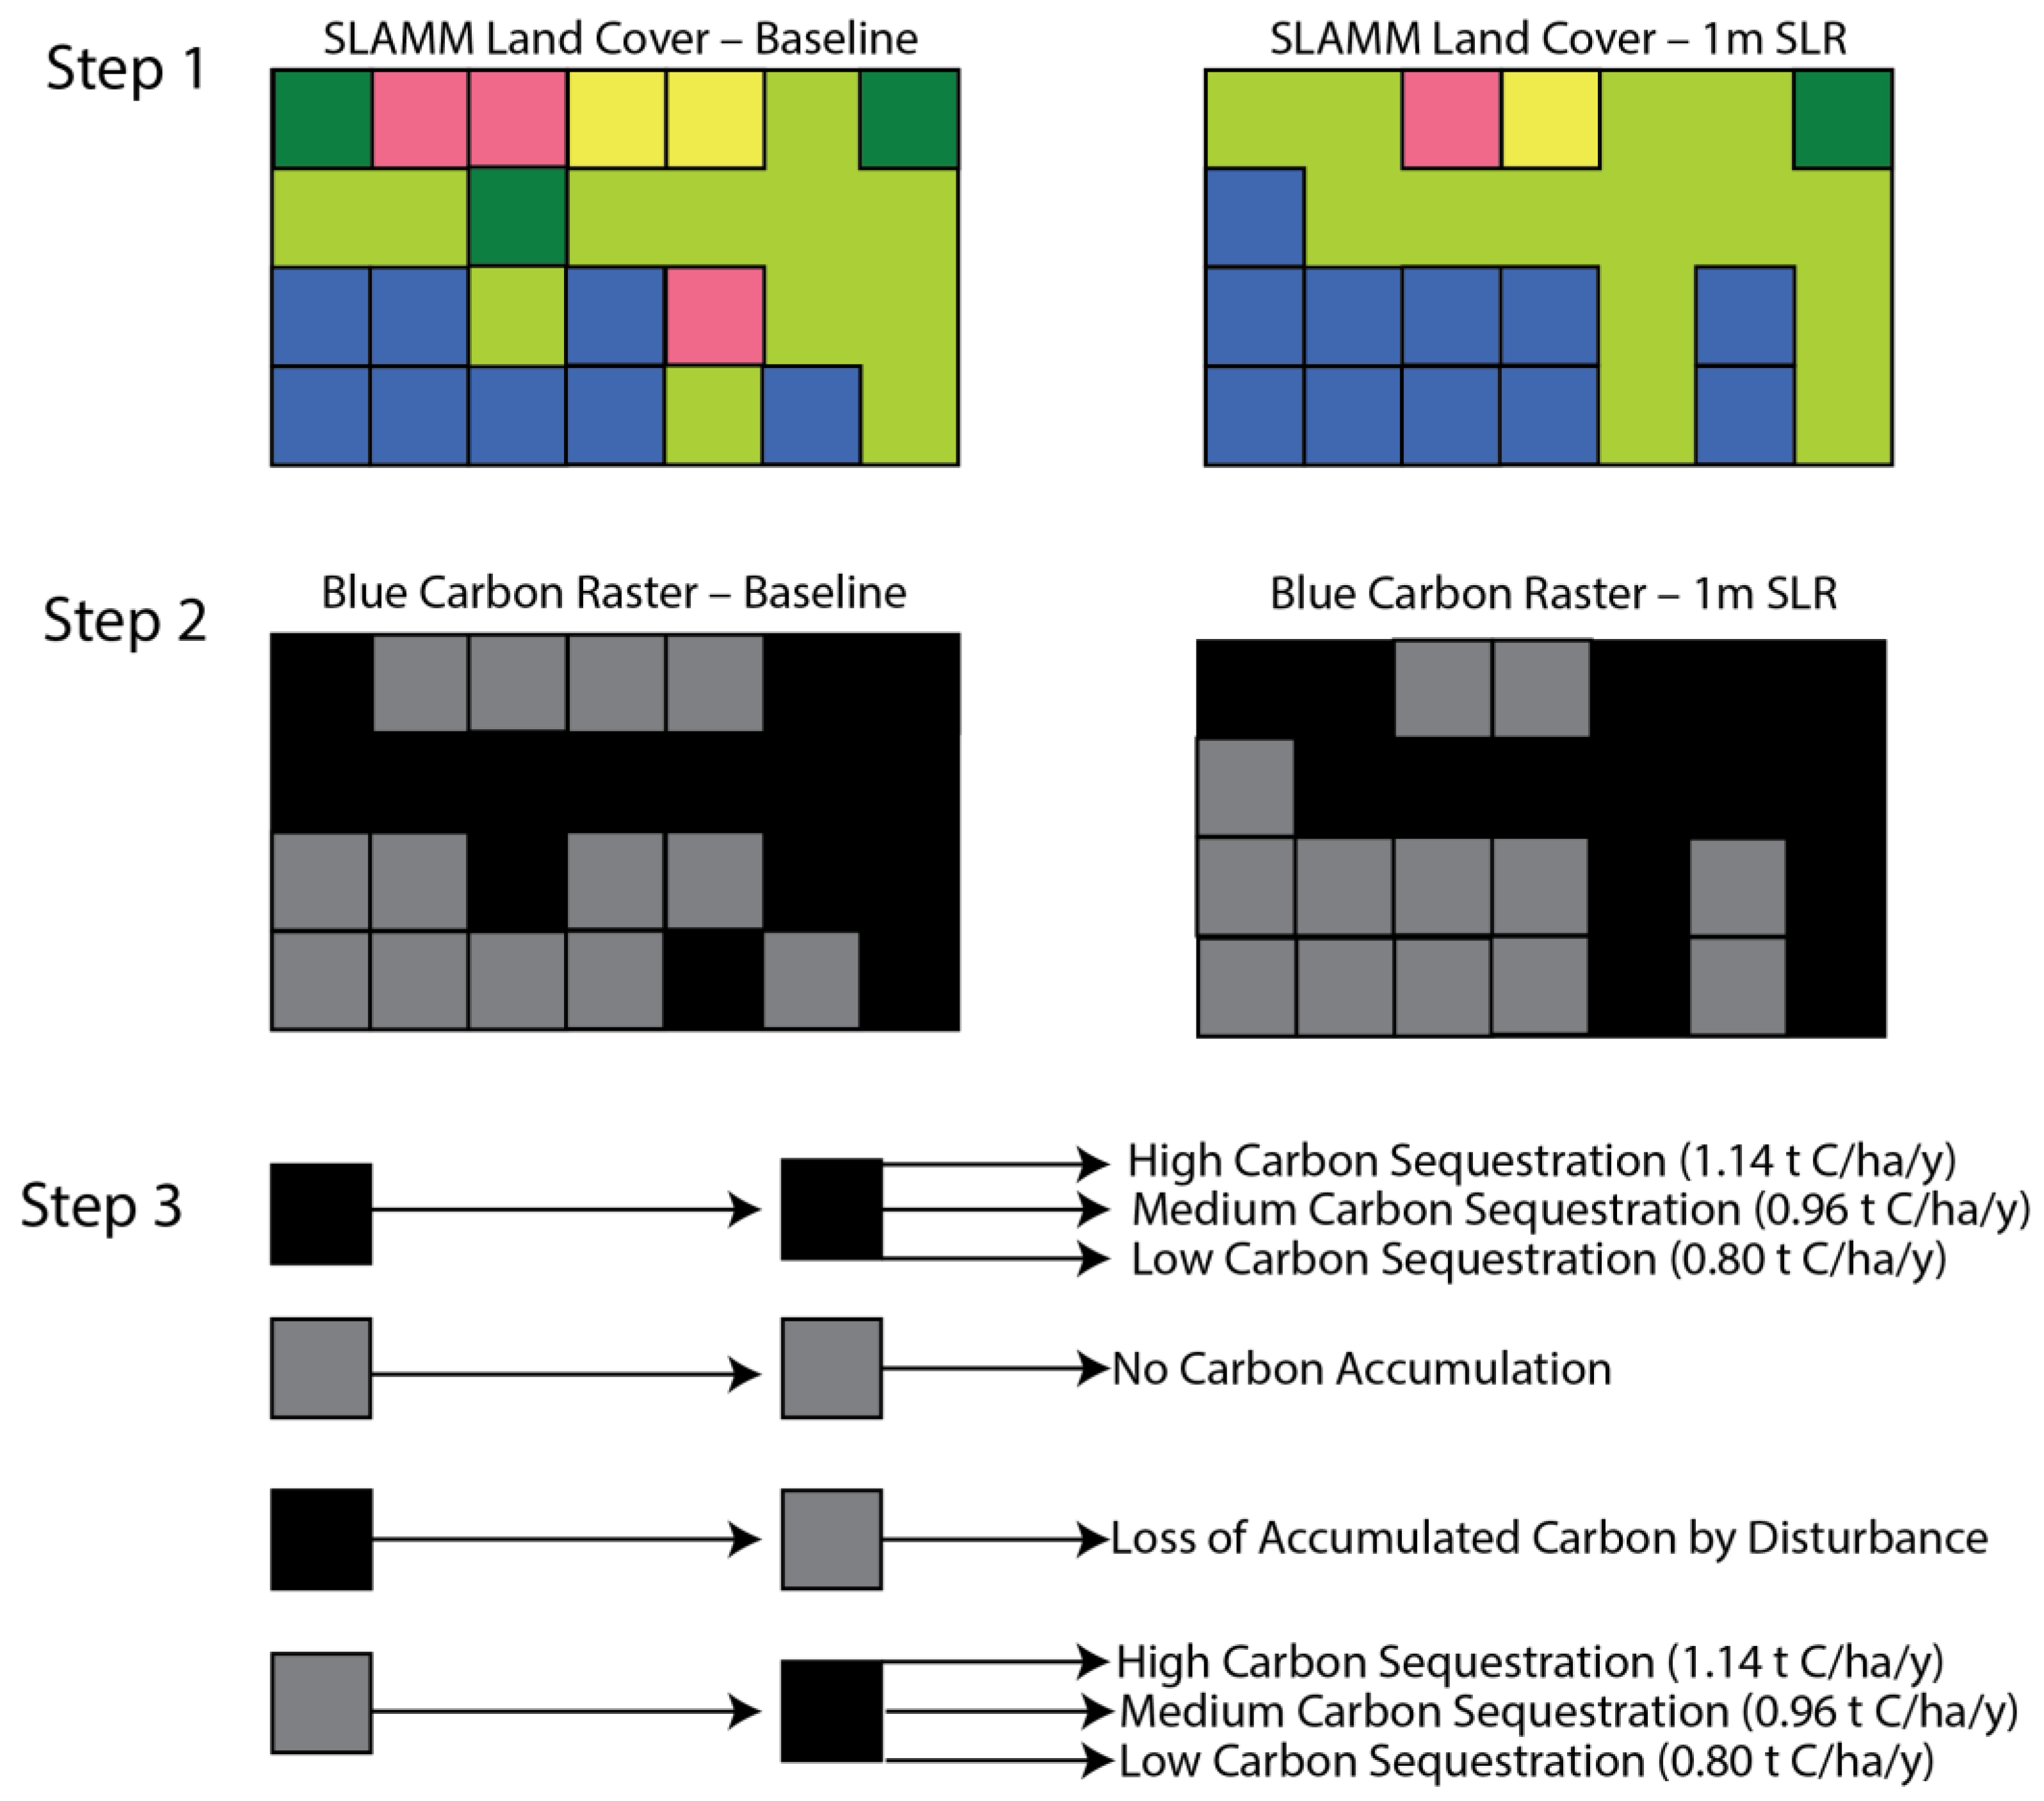
2.3. Coastal Blue Carbon Ecosystem Service Model

To assess changes in carbon sequestration with 1 m of SLR over the 21st century we used the SLAMM output raster files, showing only regularly and irregularly flooded marshes, as inputs into InVEST’s Coastal Blue Carbon (CBC) model. The CBC model takes as inputs land cover raster files, for which the user defines specific land cover classifications as “blue carbon ecosystems”. For each of these land cover classifications, the model takes inputs from a biophysical table of carbon stock values for soil, biomass, and litter fractions, annual sequestration rates in each of those pools, the half-life of carbon stored in each of the pools, and the fraction (between 0 and 1) of carbon lost in disturbances to soil. Our biophysical table is shown in Supplemental Table S1. In our table, following Moritsch et al. [17], we used initial stock values of 0 for all pools, as we are estimating changes in future net sequestration due to SLR. Thus, we are not assessing carbon remineralization from eroded soils in inundated marshes. The CBC model also uses a land use transition table to account for all potential changes in land use as sea level rises (e.g., irregularly flooded marshes becoming regularly flooded marsh, regularly flooded marsh becoming open water, etc.) and establish if carbon is accumulated in the soil, disturbed and released from the soil, or not affected by land use changes driven by SLR. Thus, as soils are inundated and marshes are lost, newly accumulated carbon in those soils can be lost through disturbance.
We modeled three separate values for soil carbon accumulation rates. Drake et al. (2015) [17] measured soil carbon accumulation in protected and non-protected salt marshes at the Wertheim National Wildlife Refuge on the south shore of Long Island using 60 cm deep cores analyzed and sectioned for organic carbon analysis and 137Cs and 210Pb-derived carbon accumulation rates [16]. Based on the results of Drake et al. (2015) [16] we used 0.8 tons carbon (t C) per hectare (ha) per year (y) as a low carbon accumulation rate value, 0.96 t C ha−1 y−1 as a medium accumulation rate value and 1.14 t C ha−1 y−1 as a high accumulation rate value. These values are toward the lower end of global published ranges. Ouyang and Lee (2014) [18], for example, found a global average accumulation rate of 2.4 t C ha−1 y−1. To serve as a control, we also ran a no-SLR projection. For this analysis, we used the initial-condition land cover raster output from SLAMM (representing the baseline sea level) for both the year 2021 and for the year 2100. Each SLR scenario (no-SLR and 1 m SLR) was thus run three separate times through InVEST CBC, with low, medium, and high sequestration rate values. The outputs from the InVEST CBC model runs are spatially explicit rasters, which indicate total net carbon sequestration for each pixel. These output rasters were imported into QGIS analytical software (QGIS v. 3.28) to calculate the total tons of carbon sequestered with and without SLR for both all of Long Island and the North Fork area of interest.

2.4. Net Present Value of Carbon Sequestration
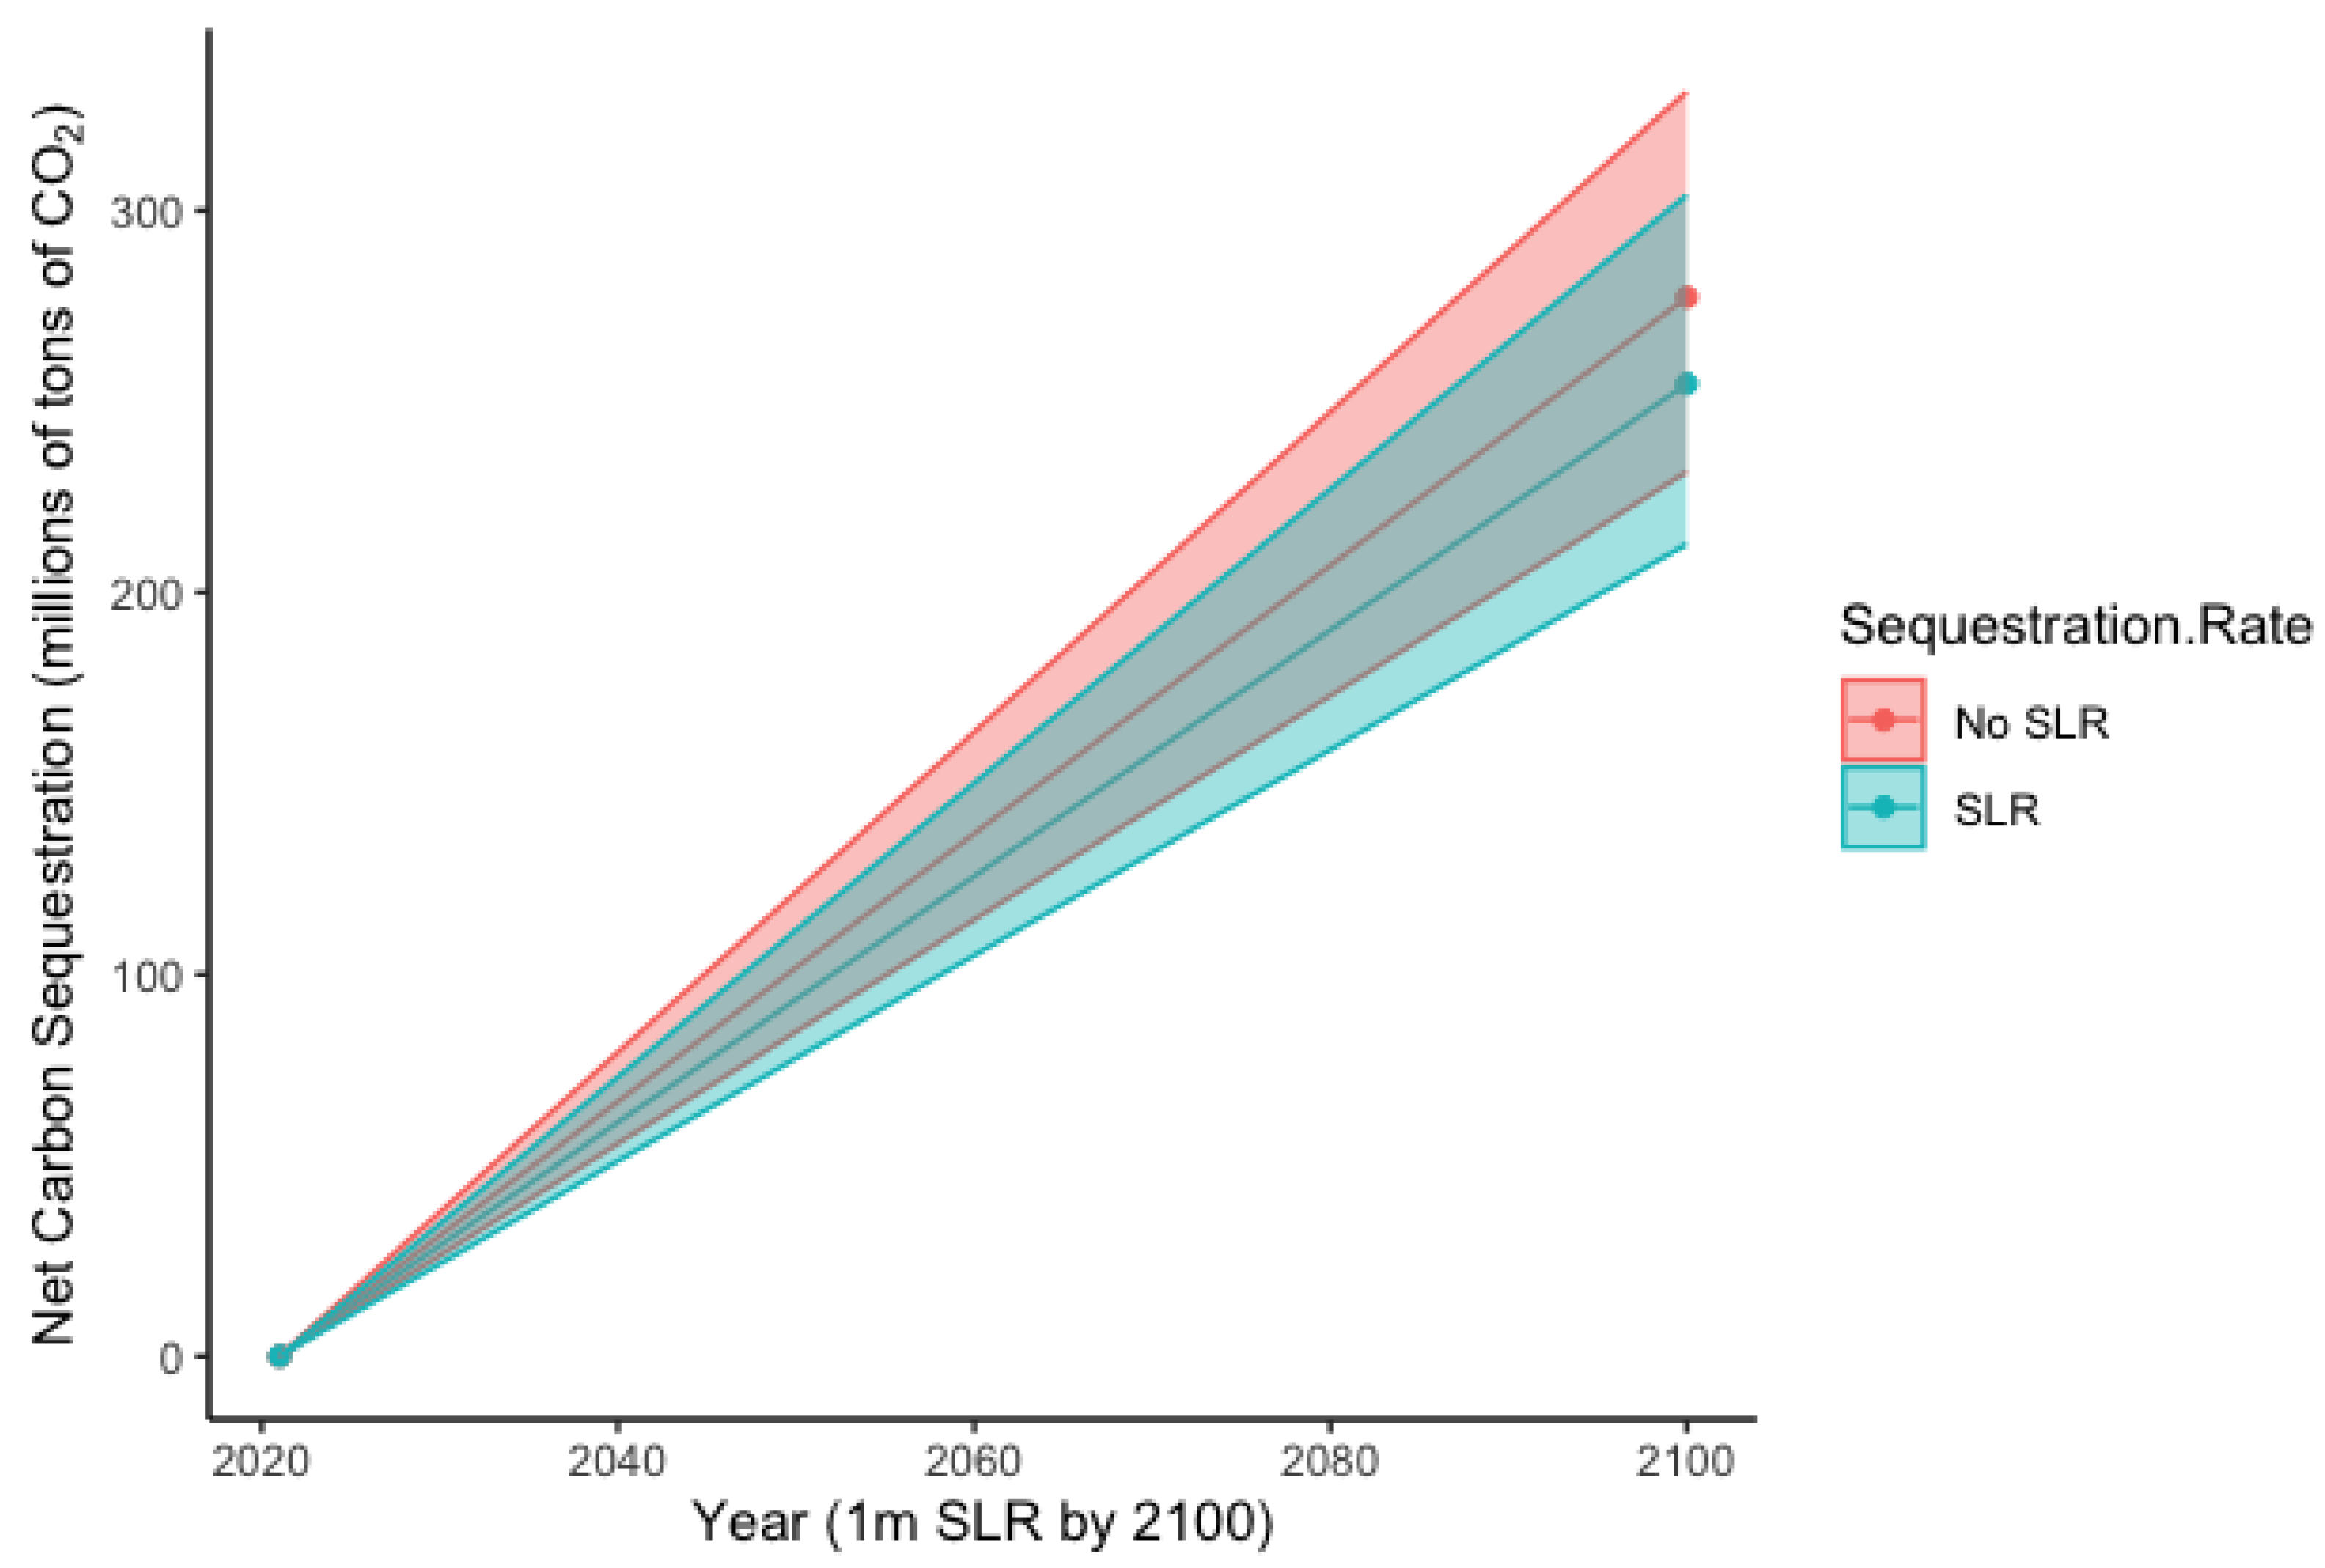
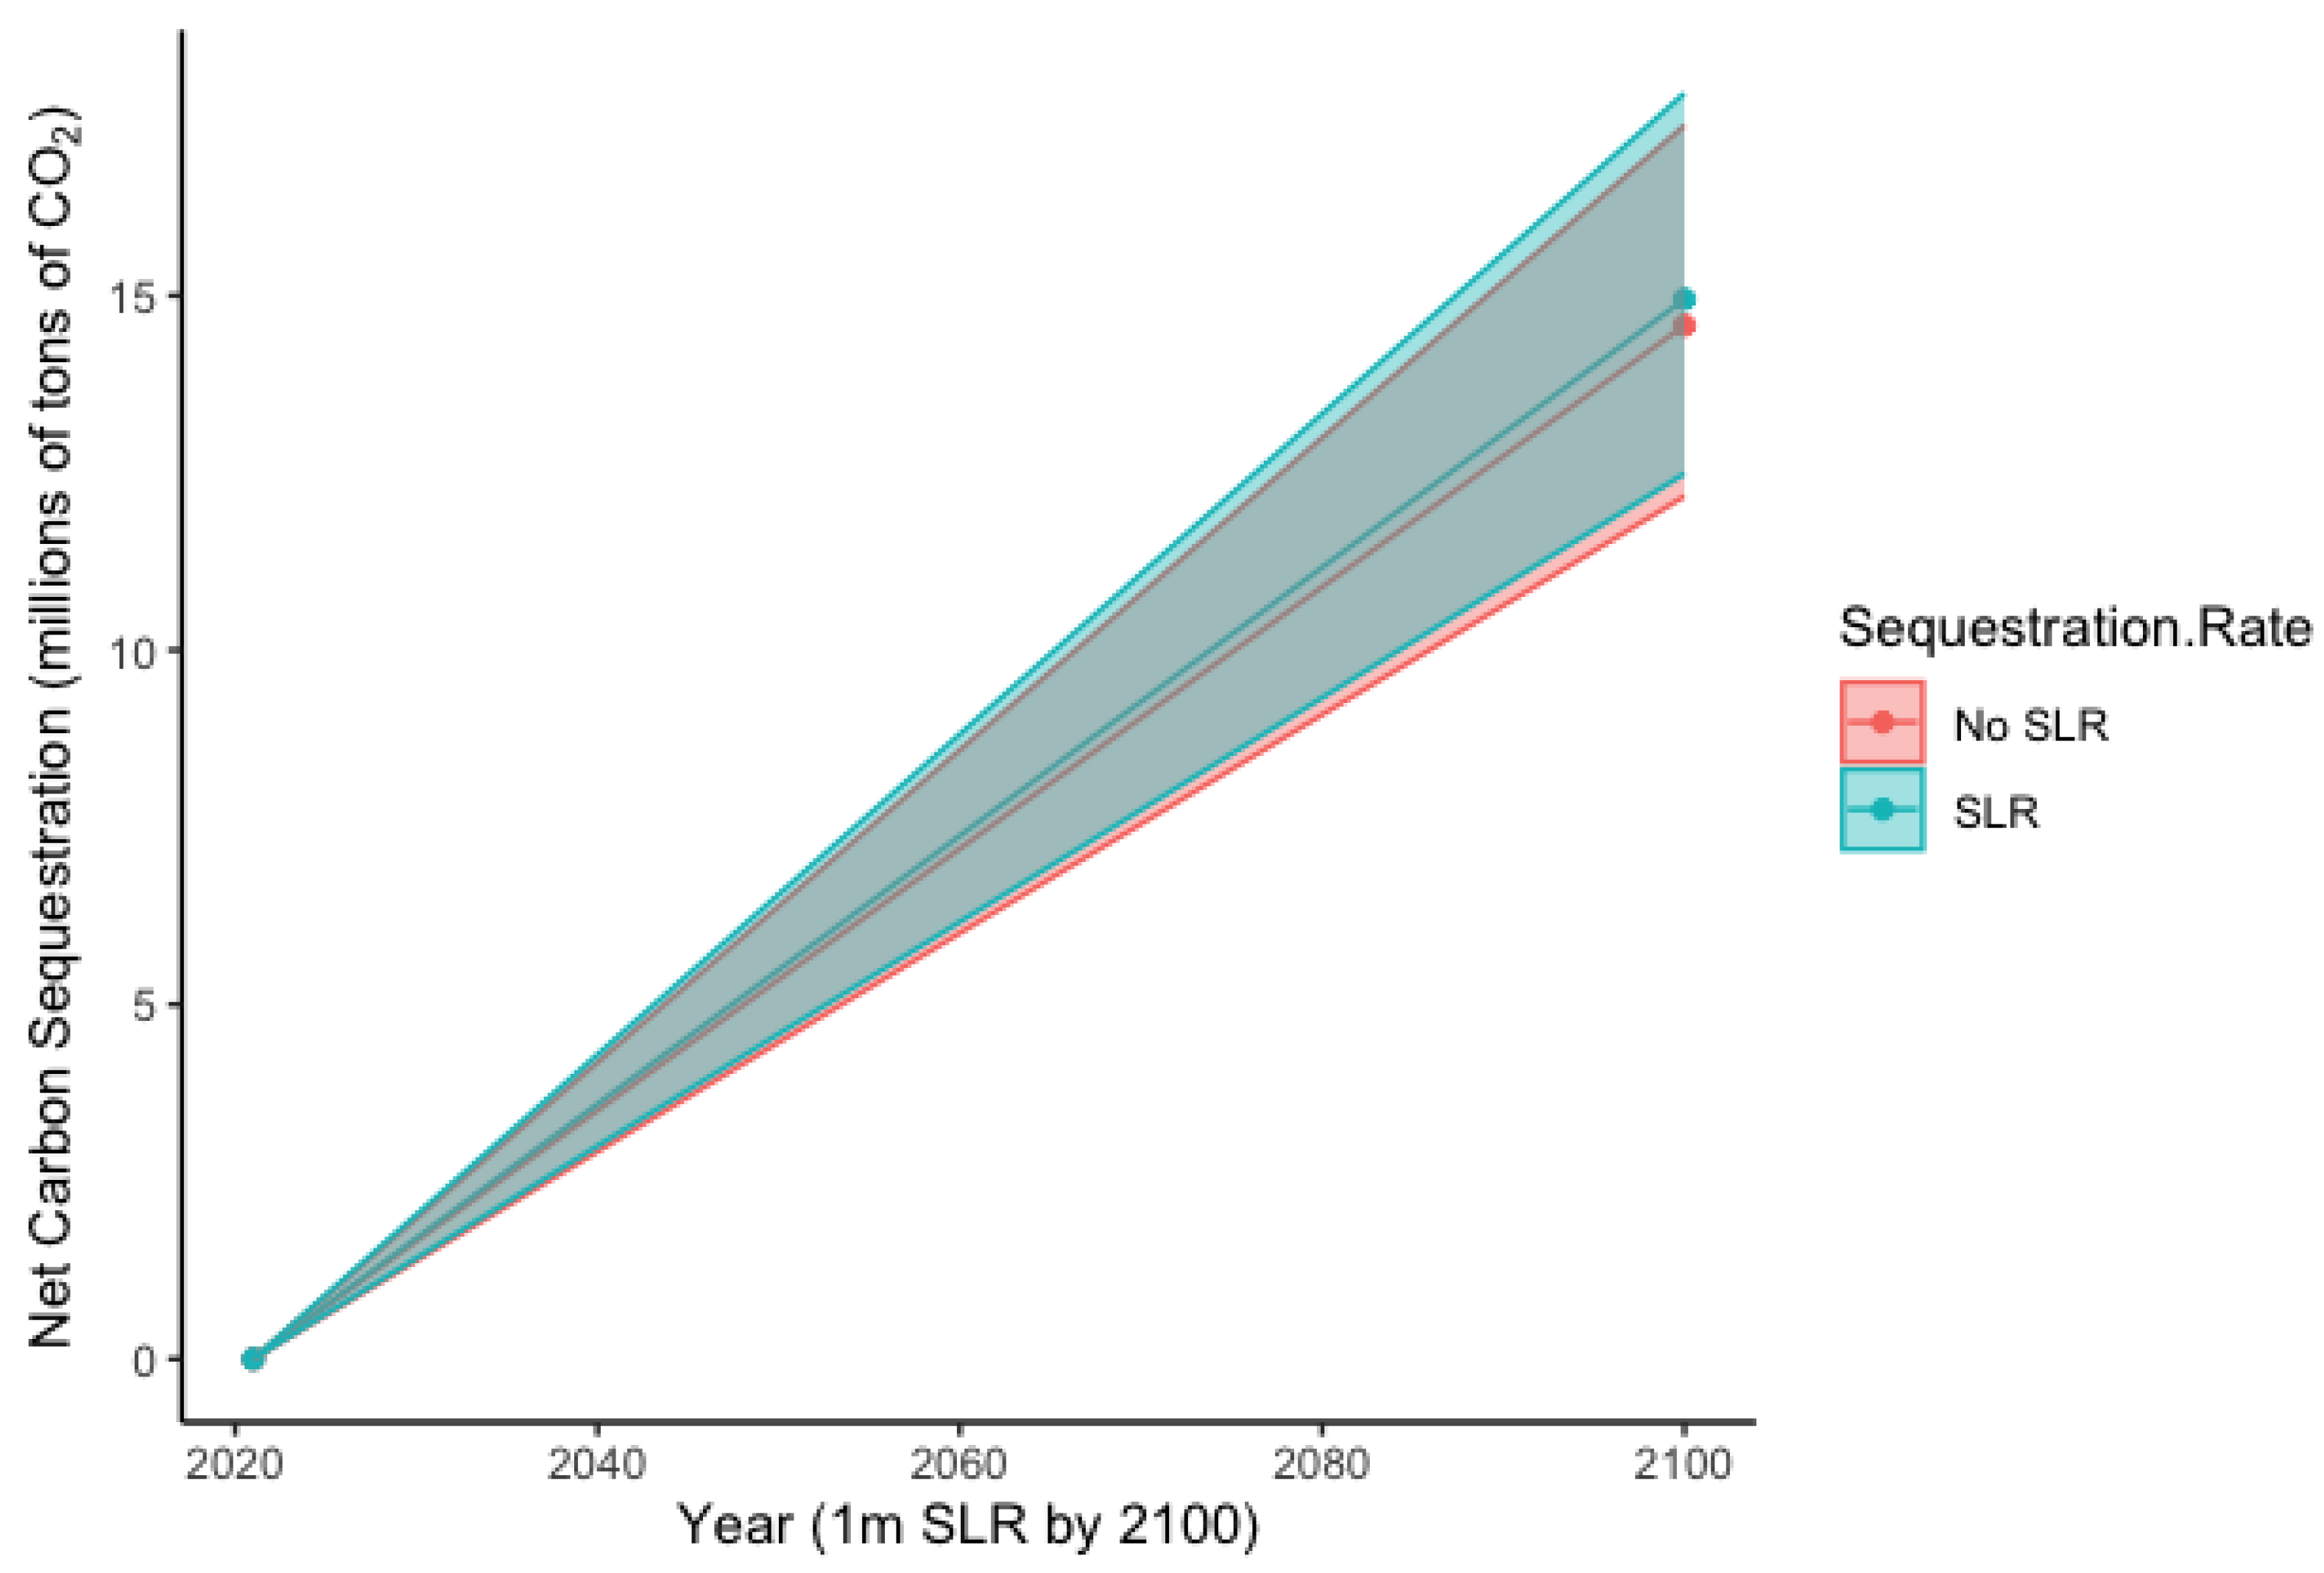
While recent studies have identified the true social cost of carbon as significantly greater than $100/t CO2 [19] and New York State has produced 2022 guidance establishing an average cost of $120/t CO2 [20], here we use an average social cost of carbon of $50 t/CO2, which was a median 2020 value adopted by the Obama Administration Federal Interagency Working Group on the Social Cost of Greenhouse Gases in 2016 [21]. While that group presented a range of SCC values and newer reports are being developed, the $50/t CO2 value entered into wide usage in management circles and represents a conservative figure, closer in value to carbon market payments for abatement. Our results should thus be interpreted as a conservative estimate of the value of the ecosystem services. We assume a 5% discount rate, which is the high-end discount rate used by the Interagency Working Group on the Social Cost of Greenhouse Gases [21].

3. Results

In total, 1 m SLR will reduce total future carbon sequestration on Long Island by 22.6 million tons CO2 by 2100 compared to a no-SLR control, using medium carbon sequestration rate value assumptions (Figure 3). While the spatial extent of regularly flooded (low) salt marshes will increase on Long Island with 1 m of SLR in 2100, the total combined area of all salt marsh will decrease in 2100 relative to the current baseline because of erosion of existing regularly flooded marshes (Figure 4).
On the North Fork peninsula, however, 1 m SLR will actually increase total net carbon sequestration by 370,000 tons CO2 by 2100 relative to a “no-SLR” control under medium carbon sequestration rate values (Figure 5). The spatial extent of regularly flooded (low) salt marshes increases on the North Fork peninsula with 1 m of SLR in 2100. This increase, due to marsh migration into upland areas, is significant enough to increase the total area of salt marsh extent on the North Fork, resulting in increases in net carbon sequestration. (Figure 6). The two areas of interest studied here demonstrate that, depending on geographical location, 1 m SLR can lead to increases or decreases in marsh extent in 2100 and can result in either increases or decreases in net carbon sequestration in a given area.
For both the entirety of Long Island and for the North Fork peninsula, however, the net present value of carbon sequestered in salt marshes decreases with SLR. This was true even as the total area of salt marsh and total carbon sequestration increased for the North Fork with SLR. For all of Long Island, the net present value of future carbon sequestration under medium sequestration rate scenarios with 1 m SLR by 2100 is $317 billion. This is $135.7 billion less than in the no-SLR scenario. Thus, SLR stands to cause a cumulative total of $135.7 billion in lost ecosystem service value from salt marsh climate change mitigation for Long Island by 2100 (Table 2).
For the North Fork peninsula, the net present value of carbon sequestration decreases under 1 m SLR by $2.9 billion relative to no SLR, despite the increase in total net carbon sequestration (Table 3). This discrepancy is due to the fact that much of the carbon sequestration in the North Fork expands in the latter part of the 21st century as new marsh extent is created. While these newly created salt marshes sequester lots of carbon, because these ecosystem services are created far into the future, the net present value declines due to erosion-induced losses of salt marsh extent earlier in the century.
It is important to note that in all scenarios and for both of our regions of interest, SLR decreases the net present value of carbon sequestration ecosystem services.

4. Discussion

There are three key takeaways from our results. First, the magnitude of changes in carbon sequestration in coastal systems due to SLR over the remainder of the 21st century is significantly smaller than the magnitude of the uncertainty in future carbon sequestration due to variability in assumed carbon sequestration rates, even when using a relatively narrow range of sequestration rates that were measured locally. The full range of carbon sequestration rates used in our models—in which all values came from a study on Long Island marshes—is itself relatively small compared to ranges in the literature—value sequestration rates that are widely used by managers.
The use of literature values to estimate carbon sequestration values across wider spatial scales is common in larger-scale greenhouse gas inventories and in some carbon offset protocols in use on the voluntary market [9]. The high degree of uncertainty suggests that any approach to estimating blue carbon inventories within public or private climate mitigation efforts should consider including detailed on-site measurements of carbon sequestration rates over time for the locations and properties in consideration, where possible, to reduce uncertainty.
To the extent that using literature-derived rates is likely to be necessary, increasing the volume of research studies and measurement of coastal salt marsh sequestration rates is greatly needed. Other negative emissions technologies that involve forest management have resulted in significant production of widely used, highly accessible plot level measurements of aboveground carbon sequestration in forested ecosystems. Efforts currently under way for blue carbon, including the Coastal Carbon Atlas [22], need to be accelerated so that end users are able to reduce uncertainty and increase the credibility of blue carbon modeling efforts. Holmquist et al. (2021) [23] highlights ongoing efforts to reduce uncertainty from 1000s of measurements across the United States.
The second key takeaway from our results is that within the same general area of interest, anticipated 21st century SLR can either increase or decrease total net carbon sequestration, depending on available upland areas for marsh migration. While previous studies have found contradictory impacts of climate change on tidal wetland blue carbon, our results highlight that differential effects can be found within nested spatial scales; this confirms Warnell et al.’s (2022) [12] finding that, across the east coast of North America, SLR may initially lead to increases in marsh extent as marshes migrate inland, but will ultimately lead to a reduction in marsh extent due to erosion- and inundation-induced losses of marsh extent. Our results also highlight that, within the same geographic area, some areas are likely to experience gains in marsh extent, even at the end of the century, even if the overall marsh area declines, though we note that local biogeochemical and ecological drivers of marsh change are not directly considered here outside of the SLAMM model. Coastal managers should pay attention to particular areas that may experience expansions of marsh extent, even as they prepare overall for reductions in salt marsh ecosystem service values due to SLR.
The third key takeaway from our results is that, from an economic valuation standpoint, marsh migration caused by SLR is likely to have negative consequences compared to a baseline scenario of no SLR, and that this can be true even if carbon sequestration increases. Salt marsh blue carbon is a vital climate mitigation ecosystem service, and, even as marshes migrate inland and expand in area, the loss of current salt marsh services due to erosion from SLR will negatively affect coastal communities (and all communities). This finding aligns with those of Moritsch et al. (2021) [15], who found that carbon sequestration from avoiding marsh erosion far outweighs sequestration from restoring previously-eroded marshes.

5. Conclusions

The sensitivity of the effects of SLR to varying rates of carbon sequestration highlight the importance of coastal planning. Coastal developments, including paved roads, houses, and other physical structures, can block potential marsh migration routes, leading to increased loss of sequestered carbon and reduced rates of sequestration for the marsh as a whole [24]. Living shorelines initiatives, which use plants, sand, or rocks to stabilize marsh edges, can help reduce edge losses and erosion [25]. Coastal planning that specifically fortifies wetlands with living shorelines initiatives should be the highest priority when attempting to maximize the net present value of blue carbon sequestration. With some degree of marsh retreat and migration inevitable, prioritizing managed retreat to both prevent erosion and increase sequestration rates through marsh migration is the most economically beneficial approach and should be an additional priority for coastal management.

Supplementary Materials

The following supporting information can be downloaded at: https://www.mdpi.com/article/10.3390/su15064733/s1, Table S1: InVEST Biophysical Table.

Author Contributions

Conceptualization, A.L.S. and K.T.; methodology, A.L.S.; software, A.L.S. and K.T.; validation, A.L.S. and K.T.; formal analysis, K.T.; writing—original draft preparation, K.T.; writing—review and editing, A.L.S.; visualization, A.L.S.; supervision, A.L.S.; project administration, A.L.S.; All authors have read and agreed to the published version of the manuscript.

Funding

This research received no external funding.

Institutional Review Board Statement

Not applicable.

Informed Consent Statement

Not applicable.

Data Availability Statement

Data are available from the authors upon reasonable request.

Acknowledgments

We acknowledge the Hamilton College Summer Science Student Fellowship Program for support for this work.

Conflicts of Interest

The authors declare no conflict of interest.

References

  1. IPCC. Climate Change 2021: The Physical Science Basis. Contribution of Working Group I to the Sixth Assessment Report of the Intergovernmental Panel on Climate Change Masson-Delmotte; Zhai, P., Pirani, A., Connors, S., Péan, C., Berger, S., Caud, N., Chen, Y., Goldfarb, L., Gomis, M., Huang, M., et al., Eds.; Cambridge University Press: Cambridge, UK, 2021. [Google Scholar] [CrossRef]
  2. Minx, J.C.; Lamb, W.F.; Callaghan, M.W.; Fuss, S.; Hilaire, J.; Creutzig, F.; Dominguez, M.D.M.Z. Negative emissions—Part 1: Research landscape and synthesis. Environ. Res. Lett. 2018, 13, 063001. [Google Scholar] [CrossRef]
  3. Mcleod, E.; Chmura, G.L.; Bouillon, S.; Salm, R.; Björk, M.; Duarte, C.M.; Silliman, B.R. A blueprint for blue carbon: Toward an improved understanding of the role of vegetated coastal habitats in sequestering CO2. Front. Ecol. Environ. 2011, 9, 552–560. [Google Scholar] [CrossRef] [PubMed] [Green Version]
  4. Smith, A.J.; Kirwan, M.L. Sea-level driven marsh migration results in rapid net loss of carbon. Geophys. Res. Lett. 2021, 48, e2021GL092420. [Google Scholar] [CrossRef]
  5. Duarte, C.M.; Middelburg, J.J.; Caraco, N. Major role of marine vegetation on the oceanic carbon cycle. Biogeosciences 2005, 2, 1–8. [Google Scholar] [CrossRef] [Green Version]
  6. Wang, F.; Sanders, C.J.; Santos, I.R.; Tang, J.; Schuerch, M.; Kirwan, M.L.; Li, Z.A. Global blue carbon accumulation in tidal wetlands increases with climate change. Natl. Sci. Rev. 2021, 8, nwaa296. [Google Scholar] [CrossRef] [PubMed]
  7. Windham-Myers, L.; Crooks, S.; Troxler, T.G. A Blue Carbon Primer: The State of Coastal Wetland Carbon Science, Practice, and Policy; CRC Press: Boca Raton, FL, USA, 2019. [Google Scholar]
  8. Herr, D.; von Unger, M.; Laffoley, D.; McGivern, A. Pathways for implementation of blue carbon initiatives. Aquat. Conserv. Mar. Freshw. Ecosyst. 2017, 27, 116–129. [Google Scholar] [CrossRef]
  9. Wedding, L.M.; Moritsch, M.; Verutes, G.; Arkema, K.; Hartge, E.; Reiblich, J.; Strong, A.L. Incorporating blue carbon sequestration benefits into sub-national climate policies. Glob. Environ. Chang. 2021, 69, 102206. [Google Scholar] [CrossRef]
  10. Fagherazzi, S.; Anisfeld, S.C.; Blum, L.K.; Long, E.V.; Feagin, R.A.; Fernandes, A.; Williams, K. Sea level rise and the dynamics of the marsh-upland boundary. Front. Environ. Sci. 2019, 7, 25. [Google Scholar] [CrossRef] [Green Version]
  11. Rogers, K.; Kelleway, J.J.; Saintilan, N.; Megonigal, P.; Adams, J.B.; Holmquist, J.R.; Lu, M.; Schile-Beers, L.; Zawadzki, A.; Mazumder, D.; et al. Wetland carbon storage controlled by millennial-scale variation in relative sea-level rise. Nature 2019, 567, 91–95. [Google Scholar] [CrossRef] [PubMed]
  12. Warnell, K.; Olander, L.; Currin, C. Sea level rise drives carbon and habitat loss in the US mid-Atlantic coastal zone. PLoS Clim. 2022, 1, e0000044. [Google Scholar] [CrossRef]
  13. zu Ermgassen, P.S.; Baker, R.; Beck, M.W.; Dodds, K.; zu Ermgassen, S.O.; Mallick, D.; Turner, R.E. Ecosystem services: Delivering decision-making for salt marshes. Estuaries Coasts 2021, 44, 1691–1698. [Google Scholar] [CrossRef]
  14. Osland, M.J.; Chivoiu, B.; Enwright, N.M.; Thorne, K.M.; Guntenspergen, G.R.; Grace, J.B.; Swarzenzki, C.M. Migration and transformation of coastal wetlands in response to rising seas. Sci. Adv. 2022, 8, eabo5174. [Google Scholar] [CrossRef] [PubMed]
  15. Dewitz, J. National Land Cover Database (NLCD) 2016 Products: U.S. Geological Survey Data Release; USGS: Washington, DC, USA, 2019. [CrossRef]
  16. Drake, K.; Halifax, H.; Adamowicz, S.; Craft, C. Carbon sequestration in tidal salt marshes of the northeast United States. Environ. Manag. 2015, 56, 998–1008. [Google Scholar] [CrossRef] [PubMed]
  17. Moritsch, M.M.; Young, M.; Carnell, P.; Macreadie, P.I.; Lovelock, C.; Nicholson, E.; Raimondi, P.T.; Wedding, L.M.; Ierodiaconou, D. Estimating blue carbon sequestration under coastal management scenarios. Sci. Total Environ. 2021, 777, 145962. [Google Scholar] [CrossRef] [PubMed]
  18. Ouyang, X.; Lee, S.Y. Updated estimates of carbon accumulation rates in coastal marsh sediments. Biogeosciences 2014, 11, 5057–5071. [Google Scholar] [CrossRef] [Green Version]
  19. Wagner, G. Recalculate the social cost of carbon. Nat. Clim. Chang. 2021, 11, 293–294. [Google Scholar] [CrossRef]
  20. NYS Department of Environmental Conservation. Establishing a Value of Carbon: Guidelines for Use by State Agencies. 2022. Available online: https://www.dec.ny.gov/docs/administration_pdf/vocguid22.pdf (accessed on 24 February 2023).
  21. Interagency Working Group on the Social Cost of Greenhouse Gases. Technical Support Document: Technical Update of the Social Cost of Carbon for Regulatory Impact Analysis-under Executive Order 12866. Environmental Protection Agency. Available online: https://www.epa.gov/sites/default/files/2016-12/documents/sc_co2_tsd_august_2016.pdf (accessed on 3 February 2023).
  22. Coastal Carbon Atlas. Available online: https://serc.si.edu/coastalcarbon (accessed on 31 January 2023).
  23. Holmquist, J.R.; Schile-Beers, L.; Buffington, K.; Lu, M.; Mozdzer, T.J.; Riera, J.; Megonigal, J.P. Scalability and performance tradeoffs in quantifying relationships between elevation and tidal wetland plant communities. Mar. Ecol. Prog. Ser. 2021, 666, 57–72. [Google Scholar] [CrossRef]
  24. Feagin, R.A.; Martinez, M.L.; Mendoza-Gonzalez, G.; Costanza, R. Salt marsh zonal migration and ecosystem service change in response to global sea level rise: A case study from an urban region. Ecol. Soc. 2010, 15, 14. [Google Scholar] [CrossRef] [Green Version]
  25. Watson, E.B.; Raposa, K.B.; Carey, J.C.; Wigand, C.; Warren, R.S. Anthropocene survival of southern New England’s salt marshes. Estuaries Coasts 2017, 40, 617–625. [Google Scholar] [CrossRef] [PubMed]
Figure 1. Existing land cover of Long Island, NY. The 2016 National Land Cover Database land cover classifications are shown for Long Island [15]. The North Fork peninsula study area is shown in the outlined box. Salt marshes are concentrated on the southern shore of Long Island in the Great South Bay and in the Peconic Bay south of the North Fork peninsula.
Sustainability 15 04733 g001
Figure 2. Workflow diagram illustrating steps in the method. SLAMM sea level rise modeling is used to define changes in marsh extent due to SLR. SLAMM rasters are coded as blue carbon ecosystems by land cover classification. The InVEST Coastal Blue Carbon Model then models carbon sequestration in blue carbon ecosystems (salt marsh), shown in black at three different sequestration rates from [16]. The InVEST Coastal Blue Carbon model also measures loss of carbon from salt marshes to sea level rise. Newly created salt marsh pixels due to marsh migration start to accumulate carbon. Non-blue carbon ecosystems (gray) do not accumulate carbon.
Sustainability 15 04733 g002
Figure 3. Future net carbon sequestration in Long Island salt marshes is shown for a scenario with no SLR and a scenario with 1 m SLR by 2100. Lines represent medium carbon sequestration rate assumptions and uncertainty bounds represent high and low carbon sequestration rate values. In 2100, 1 m of SLR results in a reduction in net carbon sequestration of 22.6 million metric tons of CO2 relative to a no-SLR scenario.
Sustainability 15 04733 g003
Figure 4. Extent of irregularly flooded (high) salt marsh (gray) and regularly flooded (low) marsh (black) is shown for current baseline land cover (A) and 1 m of SLR in 2100 (B) for Long Island. The total area of marsh declines in 2100 under 1 m SLR, but the area of regularly flooded marsh expands.
Sustainability 15 04733 g004
Figure 5. Future net carbon sequestration in North Fork Peninsula salt marshes is shown for a scenario with no SLR and a scenario with 1 m SLR by 2100. Lines represent medium carbon sequestration rate assumptions and uncertainty bounds represent high and low carbon sequestration rate values. In 2100, 1 m of SLR results in an increase in net carbon sequestration of 370,000 metric tons of CO2 relative to a no-SLR scenario.
Sustainability 15 04733 g005
Figure 6. Extent of irregularly flooded (high) salt marsh (gray) and regularly flooded (low) marsh (black) is shown for current baseline land cover (A) and 1 m of SLR in 2100 (B) for the North Fork peninsula. The total area of marsh increases in 2100 under 1 m SLR, but the area of irregularly flooded marshes decreases.
Sustainability 15 04733 g006
Table 1. SLAMM land cover classification codes adapted from National Wetlands Inventory codes. Codes 8 and 20 (shown in bold) represent regularly and irregularly flooded marshes, respectively, and were isolated in our SLAMM rasters to analyze change in marsh extent.
CodeSLAMM Land Cover Classification
1Developed Dry Land (upland)
2Undeveloped Dry Land (upland)
3Nontidal Swamp
4Cypress Swamp
5Inland Fresh Marsh
6Tidal Fresh Marsh
7Traditional Marsh/Scrub Shrub
8Regularly Flooded Marsh (Saltmarsh)
9Mangrove
10Estuarine Beach
11Tidal Flat
12Ocean Beach
13Ocean Flat
14Rocky Intertidal
15Inland Open Water
16Riverine Tidal Open Water
17Estuarine Open Water
18Tidal Creek
19Open Ocean
20Irregularly Flooded Marsh
21Not Used
22Inland Shore
23Tidal Swamp
24Blank
25Flooded Developed Dry Land
26Flooded Forest
Table 2. Total net carbon sequestration and net present value of sequestered carbon on Long Island (in 2100 with 1 m of SLR and with no SLR) with high, medium, and low rates of sequestration.
SLR ScenarioSequestration Rate ValueTotal Net Carbon Sequestration 2021–2100
(Millions of Tons of CO2)
Net Present Value
(Millions of USD)
1 mLow212.7$265,000
1 mMedium254.7$317,000
1 mHigh304.0$378,000
No SLRLow231.6$377,900
No SLRMedium277.3$452,400
No SLRHigh331.1$540,100
Table 3. Total net carbon sequestration and net present value of sequestered carbon on the North Fork peninsula (in 2100 with 1 m of SLR and with no SLR) with high, medium, and low rates of sequestration.
SLR ScenarioSequestration Rate ValueTotal Net Carbon Sequestration 2021–2100
(Millions of Tons of CO2)
Net Present Value
(Millions of USD)
1 mLow12.5$18,700
1 mMedium15.0$22,400
1 mHigh17.9$26,720
No SLRLow12.2$19,900
No SLRMedium14.6$23,800
No SLRHigh17.4$28,400
Disclaimer/Publisher’s Note: The statements, opinions and data contained in all publications are solely those of the individual author(s) and contributor(s) and not of MDPI and/or the editor(s). MDPI and/or the editor(s) disclaim responsibility for any injury to people or property resulting from any ideas, methods, instructions or products referred to in the content.

