Article

System Dynamics Modeling for Assessing the Impact of COVID-19 on Food Supply Chains: A Case Study of Kenya and Rwanda

by
Henri E. Z. Tonnang
*,
Bonoukpoè Mawuko Sokame
*,
Mark Wamalwa
,
Saliou Niassy
and
Beatrice Wambui Muriithi
International Centre of Insect Physiology and Ecology, Nairobi P.O. Box 30772-00100, Kenya
*
Authors to whom correspondence should be addressed.
Sustainability 2023, 15(6), 4717; https://doi.org/10.3390/su15064717
Submission received: 27 January 2023 / Revised: 14 February 2023 / Accepted: 21 February 2023 / Published: 7 March 2023

Abstract

:
Disruptions in the food supply chains caused by the COVID-19 pandemic have destabilized the balance between production, supply, transport, distribution, and consumption. Consequently, these disruptions have affected food and nutritional security all over the world. This study proposes a framework for investigating the impact of COVID-19 on food supply chains, considering Eastern Africa as a focus region with Kenya and Rwanda as case studies. A systems thinking approach with three systemic components (food and nutrition, COVID-19 contagion, and human health) was applied. The contagion component was characterized by the susceptible, exposed, infected, recovered, and deceased (SEIRD) epidemiological modeling method. We then applied a causal loop diagram and stock and flow diagrams to map the links and interactions between variables from the contagion, health, and food supply chain components of the whole system. The results reveal that COVID-19 has adversely affected food and nutritional security in Eastern African countries. Key response measures to COVID-19 such as lockdowns, closure of borders, isolation, and quarantining have resulted in labor shortages, increased unemployment rates, loss of income, and the subsequent contraction of economies. The disruption of the food supply chain has negatively impacted the main pillars of food and nutrition security, which are availability, accessibility, utilization, and stability. We suggest direct food supply from local producers to the consuming communities to shorten the food supply chain and therefore enhance food self-sufficiency to reduce the severe effects of COVID-19 on food and nutrition security. Overall, our study provides a useful framework to help design better policies and build more resilient and inclusive food systems during COVID-19 and similar pandemics in the future.

1. Introduction

The global COVID-19 pandemic has triggered devastating health, economic, and food insecurity consequences across the world, mostly among vulnerable groups such as the elderly, women, and disadvantaged populations in informal settlements [1,2,3]. In Africa, poverty, the limited capacity of health care systems, food crises, inequality, and informal economies have led to difficulty in adequately evaluating COVID-19’s impact on the population [4,5]. The stability of food supply chains is crucial in determining the food security of people around the world. The global supply chain operates at a relatively delicate balance between production, inventory, and consumption, whereby a minor disturbance can cause its instability [6,7]. Disruptions in supply chains can result from various factors, including natural disasters, oil price shocks, political instability, or infectious diseases [8]. Evidence from the current COVID-19 pandemic has revealed how a global food crisis could arise from the response to the spread of an infectious disease. Border closures, quarantining, lockdowns, isolation, etc., have led to labor shortages, food supply chain disruption, and the contraction of economies [9,10].
The COVID-19 pandemic is affecting the food system, with negative impacts on all four main pillars of food and nutritional security, which are availability, accessibility, utilization, and stability [11,12,13]. Eastern Africa is majorly affected given the strong negative correlation between food security and economic recession. The pandemic has resulted in changes in consumers’ consumption behavior and patterns, which has drastically increased food prices and subsequently destabilized the food system. Loss of income has exacerbated shifts in consumer demand towards cheaper and less nutritious foods [14,15].
Around the world, there is a highly interconnected relationship of food and nutrition security with the stability of household income during and after lockdown periods and the food system’s capacity to provide foodstuff under social distance constraints along the supply chain. Many studies have overlooked such systemic behavior, which we consider is full of uncertainties; therefore, we opted to apply a complex system analytical approach capable of highlighting and integrating coupling among components [16,17,18,19]. Di Vaio et al. [16] reported that artificial intelligence (AI) is an innovative technology against the effects of COVID-19 pandemic management to support struggling businesses, especially in the agri-food industry, but the study was limited to a theoretical demonstration with no actual evidence based on analytics and case studies. It is also important to point out that AI data-driven methods do not account for the interactions and linkages between system components and elements. On the other hand, some studies on the impact of the COVID-19 pandemic on food and nutrition security have used econometric models [13,20]. However, considering the complexity of the system of food and nutrition security, lockdowns, government measures, and household income under the COVID-19 pandemic [13,21,22], a holistic approach, such as systems thinking and system dynamics, becomes key. In Eastern African countries, the economy is mostly reliant on agriculture, which employs more than half the labor force. Therefore, analyzing food systems with a system dynamics approach becomes even more relevant.
System dynamics is a suitable approach for estimating the impacts of COVID-19 on food and nutritional security in Eastern African countries because it considers the complexity of the food production web, consumption, and distribution with the feedback structure from both the COVID-19 contagion component and the health component [23,24,25]. Several studies have used this approach to evaluate various aspects of COVID-19 impacts [26,27,28,29,30], but none have designed a system with relevant sub-systems, such as the pandemic, the country population dynamics, and movement, with components of health care capacity and food security to thoroughly analyze feedback loops of the whole system and determine the impacts on the food supply chain at country level. For instance, using the system dynamics modeling approach, Li et al. [26] analyzed scenarios of COVID-19 policy making in tourism-dependent countries, focusing on the pandemic and financial support through tourism components. Kozlovskyi et al. [27] studied the effect of COVID-19 on labor migrants and economic growth in The Netherlands, Spain, and Switzerland, and they combined only epidemiological and economic growth sub-systems. Furthermore, Marzouk et al. [28] modeled the COVID-19 impact on the sustainable development goals in Egypt by focusing only on interdependencies among public health activities. The present study embeds the system components of the pandemic, namely contagion, health, and food, into a dynamic and integrated mega-model for whole-scenario analysis to provide a complete view to governments for present and future generations about how COVID-19 is impacting food security, especially in African countries. We provide some insights on key questions that government leaders in the region need answered in the form of evidence-based suggestions for decision making. Although the proposed framework can be applied to each country of East Africa and beyond, due to the limited availability of quality data, our actual case studies are based on two countries: Kenya and Rwanda.
The rest of the paper is organized as follows. The next section describes the methodology, where the assumptions are listed to enable the definition of the boundaries of the simulation experiments. In addition, the data sources and the model are described, as well as the parameter settings and data usage. Section 3 provides the background of the case study countries, and Section 4 discusses the results. The last section concludes and highlights policy recommendations.

2. Materials and Methods

2.1. General Overview

The COVID-19 crisis demonstrates how connected and interdependent the world is across continents, countries, and governments. Although the pandemic is directly affecting health systems, the overall responses to combat the disease are complex. Therefore, there is a necessity to apply a metric that integrates a paradigm shift from linear, reductionist approaches to dynamic and holistic approaches. We used systems thinking and a dynamic framework to characterize the pandemic and visualize how COVID-19 is affecting different components of the system, namely contagion, health, and food. We utilized a generic structure of the susceptible (S), exposed (E), infected (I), recovered (R), and deceased (D) (SEIRD) compartmental modeling approach [24] to capture the contagion component of the whole system. The SEIRD model is a common model largely used to forecast and inform on COVID-19 impacts [31]. We first illustrate the impact of the pandemic as a causal loop diagram and then translate it into stock and flow diagrams for the simulations and scenario analysis.

2.2. Key Assumptions

To develop the model and define the boundaries of the system, a number of assumptions were considered in our framework.
In the contagion component, the probability of the movement of people from one place to another in a given time-step is captured as an independent variable with no reference to time which can be exponentially distributed. This limitation is accounted for by dividing the “infectious” element into exposed, asymptomatic infectious, and infectious symptomatic [24].
  • The population is homogenous and well mixed, with no significant changes to the total population due to births, deaths, or migration.
  • At the initial stage, the disease is assumed to be imported to the country through arriving passengers only.
  • Lockdown reduces the mobility of labor, and this directly increases the number of people unemployed.
  • The infectiousness of an individual is not uniform between exposure and recovery.
  • The infectiousness of asymptomatic individuals is lower than that of symptomatic individuals.
  • Weather and climatic conditions play no role in disease infectiousness in the selected region.
  • The incubation period is 14 days. This is the time it takes patients infected with COVID-19 to show symptoms [24].
  • The recovery rate is represented by a first-order variable, meaning that for a given population of infectious individuals, an exponential decline will occur, while a portion of the population will recover faster than others.
  • Asymptomatic individuals may recover without even going to the hospital. Similarly, this recovery mechanism is applied to the portion of the population who received vaccines.
  • Every phase of the infection has delays; for example, there is a delay in showing symptoms of COVID-19 (delay of asymptomatic recovery = 11 days).
  • The fatality rate is increased by delays in seeking treatment or prior conditions of the patient, such as respiratory diseases.
  • The rate of vaccination in Eastern African countries is still low and undetermined.
  • The current vaccine reduces the severity of disease but not susceptibility.
  • Variants of COVID-19 are not considered. The rate of infection differs among variants.
  • Females and males were influenced differently by COVID-19, which in certain situations, contributed to an increase in gender-based violence [20]. However, we did not account for gender differences.
  • Nutrition security is viewed as the availability of food to nourish the household.

2.3. Datasets

This study relies on multiple input data from a wide variety of domains that include not only clinical and surveillance data, but also administrative, demographic, and socioeconomic data, amongst others. Below is the description of the source of the epidemiology and the social data. Overall, we developed a generic model and used data obtained from Kenya for the scenario analysis and recommendations.
Epidemiology data: We mainly use certified and trustworthy open-source data from the African Center for Disease Control and Prevention (ACDC), the U.S. Centers for Disease Control and Prevention (CDC), the World Health Organization (WHO) [32], and the European Center for Disease Prevention and Control (ECDC). Additional data were extracted from verified sources such as John Hopkins University, the Harvard Dataverse (https://dataverse.harvard.edu/dataverse/2019nco accessed on 23 July 2021), and the ministry of health repository for each country. In some cases, these repositories are updated daily and include the latest available public data on COVID-19 (https://www.statista.com/statistics/1136519/cumulative-coronavirus-cases-in-kenya-by-county/ accessed on 25 July 2021).
Socio-economic and social data: Socio-economic and population data (desegregated by age, sex, and level of vulnerability) were obtained from peer-reviewed literature, reports, and policy documents [33] (https://www.statista.com/statistics/451116/total-population-of-Kenya/ accessed on 21 July 2021).

2.4. Model Implementation and Simulation Experiments

VENSIM 8.2.1 (Ventam Systems, Harvard, USA) was used to develop the causal loop diagram (CLD) and subsequently the stock and flow diagrams to link the contagion, health, and food components in accordance with systems thinking and system dynamics. A simulation time-step of 0.125 was used with Euler’s method of integration to simulate the model over two years (from 2020 when the cases were first reported in the countries of the target region to the end of the year 2021).

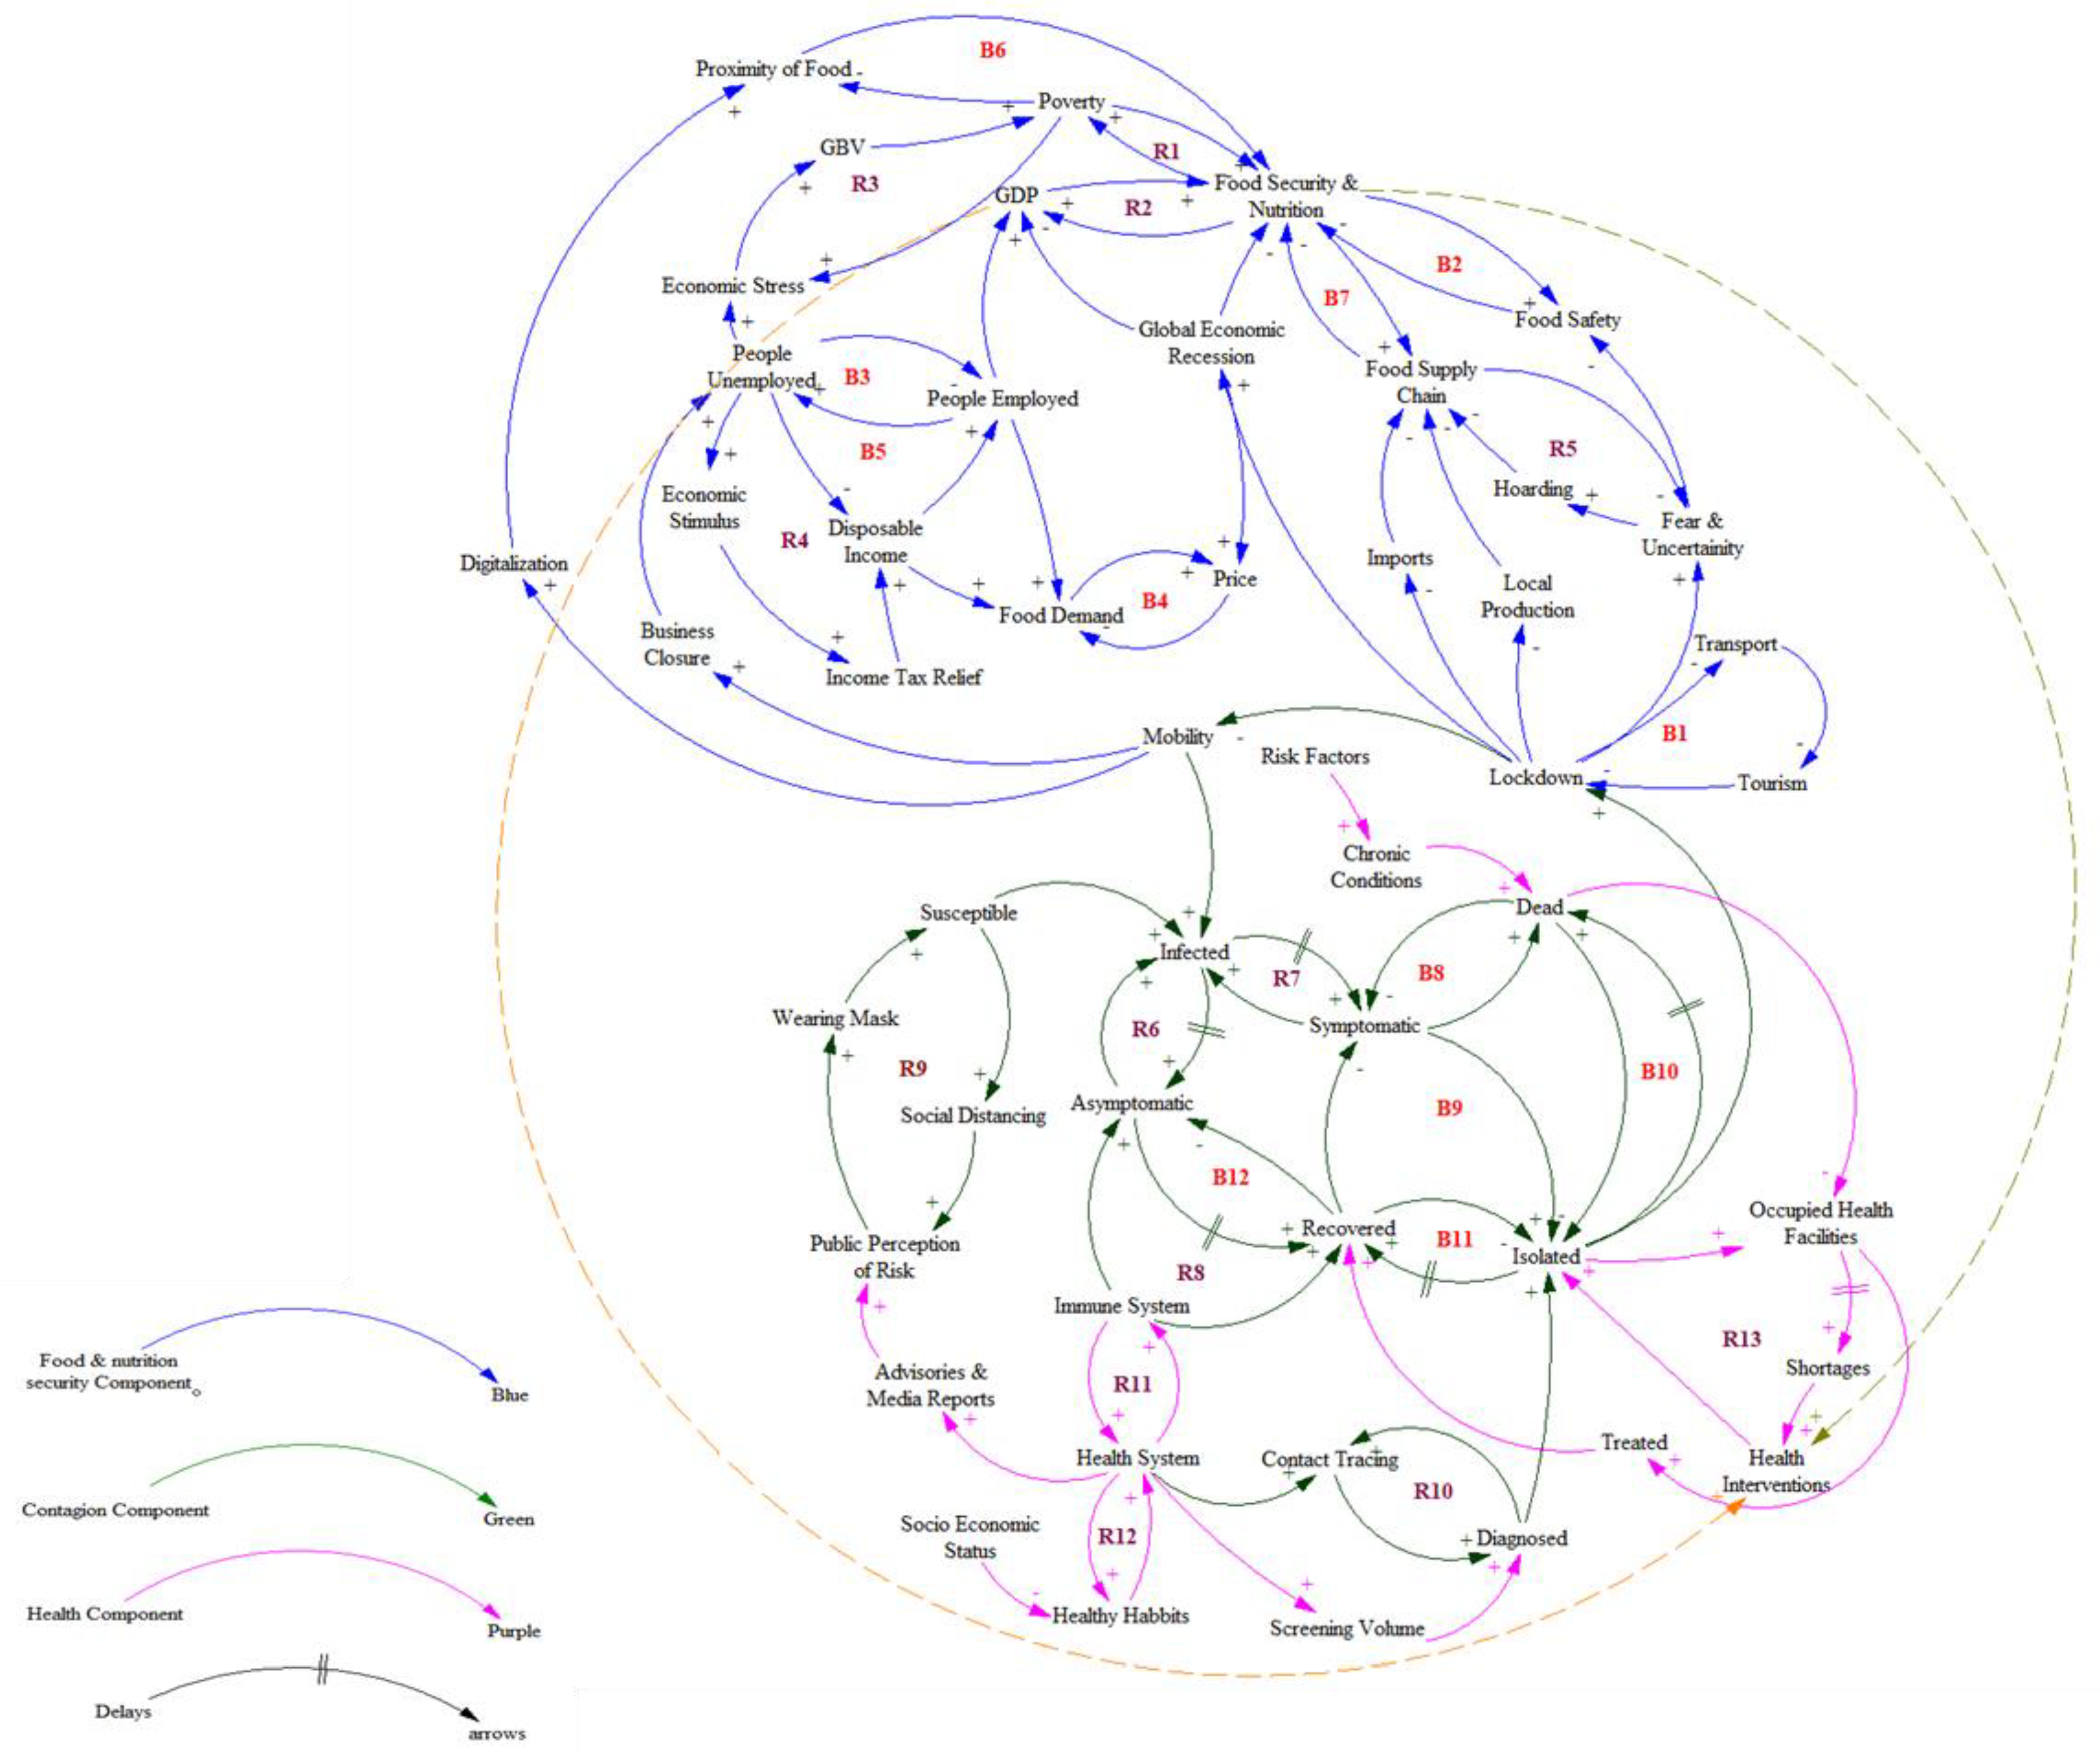
2.5. Causal Loop Diagram (CLD) Elicitation

Fundamental in systems thinking is the understanding and construction of the cause–effect diagram with causality relationships. A causal loop diagram (CDL) was developed to illustrate the interplay among components and elements as well as the feedback loops of the pandemic with the impact on food and nutrition security (Figure 1).
In the CLD, a cause–effect relationship was established between elements with the appropriate polarity defining the nature of the relationships among them [34]. It was first developed for each component of the system (food sub-system in blue, contagion component in dark green, and health component in purple) and then interconnected for the whole system. Causal feedback loops are key in interpreting the CLD, and they have either positive (reinforcing) or negative (balancing) polarity. The interacting system consists of 12 balancing loops (B1-B12) and 13 reinforcing loops (R1-R13) (Figure 1); (i) Food Security component (blue) has 7 balancing loops (B1-B7) and 5 reinforcing loops (R1-R5); (ii) Contagion component (dark green) has 5 balancing loops (B8-B12) and 5 reinforcing loops (R6-R10); (iii) Health component (purple) has 3 reinforcing loops (R11-R13).
The balancing and reinforcing loops for each of the three components are further described in Table 1. The food and nutrition security component is mainly driven by lockdown measures, employment, food prices, and disposable income, leading to low GDP. The contagion component is mostly characterized by the contamination of the virus from one person to another and people’s immune system performance, where one person can change in status (a susceptible person with the virus can manifest the disease or not depending on his/her immune system and can naturally/medically recover or die). The health component is based on government heath interventions as well as temporary heath facilities. The interaction shows how food security is reducing with the COVID-19 pandemic; for example, the lockdown has a negative impact on food security, but the government introduced a reduction in taxes, decreasing the impact on disposable income and thus stabilizing the food insecurity. Vaccination in the health component is used as a policy to reduce susceptible populations, thus decreasing deaths. The CLD includes balancing loops (B) and reinforcing loops (R), which help to clarify how the connected variables create balance and counterbalance.

2.6. Converting the Causal Loop Diagram (CLD) to Stock and Flow Diagrams

2.6.1. The Stock and Flow Diagram for the Contagion Component of the COVID-19 Pandemic

The population in the study regions was stratified into M age groups. Furthermore, the population in each age group was split into sub-groups of susceptible (S), exposed (E), asymptomatic infectious (A), symptomatic infectious (I), hospitalized (H), critical (C), and recovered (R) patients.
People categorized as susceptible (S) are exposed to the virus upon coming into contact with an infectious person. From the beginning, all exposed people are asymptomatic and not infectious. Then, they become infectious but without any symptoms for dEA days, called the latency period [24]. After a period of dAI, the infectious people develop symptoms and move into the group of infectious symptomatic individuals. Considering dEA and dAI together gives the average incubation period (dP). Initially, the people in the infectious symptomatic group are still active in society and continue transmitting the disease. From that group, some will naturally recover and others will have to be hospitalized. Among the hospitalized patients, some will recover after medication and others will become critically ill, requiring ventilation or transition to an ICU facility. Among critical patients, some will recover and the rest will die. We assume that the virus is no longer transmitted by recovered patients or the deceased. A stock and flow diagram of the mechanism is shown in Figure 2.
Appendix A describes the governing equations of the model [24]. We assume that the total population was once susceptible, and those who are vaccinated are eliminated from the susceptible population. Susceptible people are exposed at a rate called the infectious rate, and the pandemic spreads from one population to the other.
The arrows from the red highlighted variables represent policies used by the government to control the pandemic. The incubation period represents the number of days between when a population is infected and when the symptoms start to show. During the initial phase of the COVID-19 pandemic, the incubation period was set to fourteen days (14 days). Exclusion of the incubation period from each infectious group leads to a continuation of virus transmission. From incubation, some of the population can fully recover or become critically ill and be taken to the hospital, which increases the hospital demand. The exposed population is governed by personal protective equipment (PPE) intervention (a1), where masks, hand washing, and sanitizer are used to prevent the spread of the virus. Infection of the asymptomatic and symptomatic individuals is governed by the contact tracing intervention (a2). When the infected individuals are quarantined, there is an advancement of symptoms (a3), and when they become serious (a4), they are hospitalized.
All flows are governed by delays between every stage, which vary based on the nature of the virus, e.g., social distance interventions occur in different places, schools and businesses were closed, and people stayed home, also considering other populations (ps(t), pw(t), pH(t), PO(t)) [24]. At the start of the pandemic, interactions were frequent due to a lack of knowledge of the virus’s transmissibility and hence a lack of usage of PPE and contact tracing.

2.6.2. The Stock and Flow Diagram for the Health Component of the COVID-19 Pandemic

In this section, hospitalized patients (H) can become critical patients (C), recovered patients (R), or deceased (D), and this section can create an overflow of critical patients (CO). Added to these stocks is the incoming demand for hospitals (IDH), which may lead to hospitalization overflow (HO) when there are not enough facilities to receive and take care of all incoming patients (Figure 3). Between these stocks are the flows that distinguish the level of gravity of patients with COVID-19. Incoming demand for hospitals (IDH) could exceed the available hospital facilities where HAR could be admitted, and the overflow (HOR) patients may not find a place at the hospital. Overflow patients can become overflow critical patients or naturally recover. The admitted patients, as their condition worsens, can go to a critical care facility if there are enough facilities; otherwise, the patients become overflow critical patients (CO). The critical patients as well as the overflow critical patients can die or recover (Figure 3). The policy intervention consists of reducing the fraction of people dying as the governments increase hospital facilities to accommodate more patients for treatment and reduce the overflow and critical condition patients.

2.6.3. The Stock and Flow Diagram for the Food Security and Nutrition Component of the COVID-19 Pandemic

COVID-19 has significantly impacted food security in East African countries through a decline of the economy, which reduces the GDP of the countries. Government policies such as lockdowns and social distance requirements triggered economic recessions and disruptions in food value chains. The disruption of food value chains has had heterogeneous impacts on the food security and nutrition status of different segments of the population, with poor people affected more than wealthier people. In East Africa, where a significant population of poor people have large families, the effect is likely to be massive. Figure 4 shows that the population impacted the employment rate (ER) as a result of government policies such as lockdown, which highly influenced the closure of businesses, leading to unemployment. A country’s global domestic product (GDP) as well as food production depend on labor and the employment rate, and unemployment caused by the pandemic influences these production factors. Furthermore, GDP and food production influence household income and food supply, respectively, which in turn affect food prices and demand, respectively, leading to food and nutrition insecurity in the country. The policy intervention here consists of government decisions to break tax value addition (TVA) on food production and lower income taxes while increasing the food supply and subsidizing food prices.

2.7. Case Studies: Kenya and Rwanda

The number of people who tested positive for COVID-19 since the outbreak of the pandemic in Kenya is considerable, and the country ranks 85th in the world and 18th in Africa, with 321,552 confirmed cases and 5587 deaths as of 1 February 2022. Kenya and Rwanda also have some of the highest proportions of vaccinated populations in East Africa, with 20.7% and 53.7% of the population vaccinated, respectively (https://www.health.go.ke/; https://ourworldindata.org/covid-vaccinations?country=RWA/ accessed on 23 July 2021). Food poverty in Kenya and other countries in the region is high as the majority of the population lives below the food poverty level [13]. Rwanda has a projected population of 13 million. The country has witnessed meaningful social and economic development in the past 20 years. Rwanda reported the first COVID-19 case on 14 March 2020, a day after the first recorded case in Kenya. Rwanda’s tactic to combat the pandemic, just as many other East African countries, was to put in place heightened measures to flatten the curve of COVID-19 transmission, including lockdown restrictions, isolation, quarantining, contact tracing, mandatory use of face masks, and testing and treatment (https://www.ingsa.org/covid/policymaking-tracker/africa/rwanda// accessed on 23 July 2021). Overall, the situation seems to have aggravated, prompting the government to deploy a number of measures to mitigate the impact of the pandemic on the livelihoods of the population. The challenge is that the majority of the measures implemented were not derived from a robust framework [35], and their impacts are yet to be assessed. Herein, we apply our proposed framework to assess the impact of COVID-19 in Kenya and Rwanda for two years (2020 and 2021) and propose recommendations.

3. Results

3.1. Reported COVID-19 Cases, Hospitalizations, Recoveries, and Deaths

Figure 5A shows the cumulative number of cases of COVID-19 in Kenya. Real data in Kenya show that cumulative cases are proportional to time (ignoring weather conditions). Using the system dynamics modeling approach, the simulation shows that cases started to increase between July and August 2020 because of the relaxation of the measures imposed at the onset of the pandemic. At a certain time, the number of cases increased at a constant rate, resulting in the reinforcement by the government of certain measures such as curfews and the temporary closure of leisure facilities to reduce the number of cases.
The COVID-19 hospitalization cases are shown in Figure 5B. The model demonstrates that actual data for those who tested positive for coronavirus increase with time; thus, the total infections from every contact sphere were increasing and then dropped at a certain time after some policy interventions were taken into consideration. Such oscillations in the number of positive cases show that the disease transmission in the population is evolving in phases.
In Kenya, the number of recovered cases significantly started to increase in August and September, where the rate is high and continues to increase (Figure 5C), and the death cases have a steep slope with a spontaneous increase (Figure 5D). The number of deaths can further be accounted for in other conditions, such as when the individual has a pre-existing respiratory disease.
In Rwanda (Figure 6), a similar trend as in Kenya was observed; however, the number of recovered cases has a steep slope and reached the optimum after October 2020. This may be explained by the fact that the implementation of the measures to contain the disease were more rigorous in Rwanda than in Kenya, especially at the onset of the disease. COVID-19 in Kenya and Rwanda propagated in phases which comprise the initial phase with a stable period during which the cases were either imported or linked to imported cases, followed by another phase of local transmission.

3.2. Impact of COVID-19 on Food and Nutritional Security

In Kenya, food and nutritional insecurity started to increase in October 2020, which continued up to December 2021 (Figure 7A). At the same time, expenditure rates and food prices that were initially stable became unstable, and the relationship between them became cyclical (Figure 7B).
As the food prices increased, the expenditure rate decreased, which in turn caused food prices to decrease. Concerning food demand and supply, the demand significantly increased with a sigmoid trend between October 2020 and July 2021, whereas the supply significantly decreased with the same trend (Figure 7C).
Although all East African countries reported their first COVID-19 case between March and April 2020, it took time to establish national task forces and teams to begin actual reporting of the cases. It was not until around May/June 2020 that the measures and structures became fully functional. The government of Rwanda (Figure 8) unsuccessfully attempted to stop the spread of COVID-19 through non-pharmaceutical measures and by providing free food to a number of households in the country’s capital, Kigali, which was the epicenter of the COVID-19 pandemic in Rwanda at its onset. The food supply that did not last for a long period later created a shock in food prices, characterized by strong oscillations (Figure 8).

3.3. Sensitivity Analysis

Food and nutrition insecurity is highly influenced by the level of implementation of barrier measures such as the “mobility” of individuals in the population (Figure 9A–D). Figure 9C,D shows the difference when mobility level is excluded from the sensitivity; it has a greater impact on the food and nutritional insecurity. For instance, food and nutritional insecurity tends to reduce to a constant level when the mobility level is high (Figure 9A,B); however, the infection rate tends to increase when the mobility level is high (Figure 9C,D).

4. Discussion

Past studies on the impact of the COVID-19 pandemic on food and nutrition security used econometric models [13,22], which have limitations as they cannot account for interaction among system components and elements and integrate feedback loops. Similarly, other studies used AI, presenting identical limitations [17]. The system dynamics approach is a more flexible tool that allows the integration of the complex web of production, distribution, and consumption of food while taking into account the feedback structures from both the COVID-19 contagion component and the health component. In our study, we customized the development of complex systems with systemic properties, i.e., the potential to respond to impending variations, the connectedness between components, and the system’s ability to respond to sudden perturbations. We observed that the pandemic is spreading in phases. In the context of our approach, phases of growth and consolidation of the number of positive COVID-19 cases are illustrated by an upsurge in potential and connectedness at the expense of resilience. Abrupt declines in connectedness followed by abrupt surges in resilience signal the initiation of phases of release and reorganization. This interchange permits a complex system to recurrently adapt to an altering setting in balancing stability and adaptability [36].
Over the years, the SEIRD model has been used to demonstrate the spread of infectious diseases within populations and has been successfully used to analyze the spread of COVID-19 in Cameroon [37]. The model formulation provides a suitable and flexible candidate to incorporate multiple variables such as mobility and lockdown that constitute key mechanisms to describe the transition between system compartments, as well as estimate values of the reproductive number (R0). The values of R0 are often used to predict and provide insight on the level of the disease spreading among the population of any country or region. The reduction in the value of R0 characterizes low epidemic growth [37]; therefore, the majority of control measures put in place by various governments contributed toward reducing R0, but with consequences for other sectors, as demonstrated in this study.
The COVID-19 pandemic stimulated the implementation of restrictive measures such as lockdown and curfew, enforced by the governments of both Kenya and Rwanda to reduce the spread of the disease. The measures caused an economic recession which translated into the disruption of food supply chains with ramifications for food and nutrition security. For instance, border restrictions and lockdowns constrain the transport of food to markets and slow harvests in some regions, leaving millions of seasonal workers without livelihoods. Food markets and meat processing plants were closed in many localities during the pandemic and people have been dumping or burying perishable products resulting from the disruption of supply chains. Many people in urban regions therefore struggle to access fresh vegetables, fruits, meat, fish, and dairy. The pandemic began at a fragile period when the entire food system was struggling, with the growing population triggering an increase in food demand. Our results reveal that COVID-19 had a negative influence on food and nutritional security. The increase in food and nutrition insecurity in the months of August and September in both countries (Kenya and Rwanda) overlapped with the period of the steep slope in the number of reported cases and the peak of patient hospitalizations. As the infection rate increased, food supply and subsequently food and nutrition security decreased due to disruptions of the food supply chain, which negatively impacted the key pillars of food and nutrition security [13]. Food affordability and accessibility were affected by reduced income and hikes in food prices, whereas food availability was affected by the drop in production and supply levels and the disruption of transportation [38]. The increase in food demand as the infection rate increased can be explained by the introduction of COVID-19 containment policies such as lockdown and social distancing policies, which kept most households indoors due to the closure of schools and businesses and the introduction of remote working, hence increasing their food consumption rate [22]. COVID-19 control measures have had a significant impact on direct contact and therefore transmission but have also caused considerable economic and food insecurity [39].
The outputs of the model reveal that government policy interventions, such as breaking TVA on food production, lowering income tax, helping populations by supplying food and subsidizing food prices, or increasing hospital facilities to accommodate more patients for treatment and reduce the overflow and critical patients, were not enough to contain the impact of the pandemic, as it significantly affected food and nutrition insecurity in the countries under study. In Kenya, Nechifor et al. [13] reported that despite the multiple government measures that have been adopted to reduce the negative impacts of the pandemic on food security and to enable economic recovery at the household, sectorial, and aggregate levels, 1.3% of households still fall below calorie intake thresholds. Therefore, the level of those policies needs to be improved for better coverage of the impact. Furthermore, one needs to understand, and if possible, make explicit in the model, the causes of policy resistance and unintended consequences. Quaife et al. [40] reported that COVID-19 control measures have caused considerable economic and food insecurity in Kenya and other sub-Saharan African countries, and negative and inequitable impacts on economic and food security may mean that control measures are not sustainable in the long term. In Kenya, based on household-level fixed-effects regressions, the income from employment decreased by almost one-third and income from gifts and remittances reduced by more than one-third after the start of the pandemic, in addition to the significantly reduced expenditures on schooling and transportation, in line with school closures and travel restrictions [41].

5. Conclusions and Policy Recommendations

Understanding the interactions between food and nutrition security and COVID-19 is highly complex. However, this is important as COVID-19 has illustrated the multifaceted and interconnected relationships between countries’ sub-systems and components, as well as the consequences resulting from the views, interests, and powers of different actors and stakeholders. Throughout the pandemic, we observed “actions” and “reactions” characterized by social, behavioral, and economical scenarios, which translated into negative impacts on food supply chains, pushing governments to provide mitigation options with diverse effects on the population with no prior guidance. The negative impact of the pandemic on food supply chains further compromised food and nutrition insecurity. Therefore, it is important to ensure the distribution of resources and reinforce infrastructure and food systems to mitigate food crises in the future. In addition to shortening food supply chains, the East Africa region, including our case study countries (Kenya and Rwanda), could establish resilient food systems that mitigate and manage shocks through the creation of food reserves. Food reserves should be established at strategic locations in the region to avoid the interruption of food supply during shortage periods such as drought and pandemics such as COVID-19. Besides food production, other stages of the food value chain such as storage, transport, processing, and retail are also equally impacted by any pandemic. We encourage collaboration among governments in the region to enforce innovations for continued food production and trade within and across countries. Governments should work to provide sufficient road networks and create fully equipped food aggregation and market centers for the commercialization of products.
Beyond the scope of this study, we recommend a food (especially vegetables and fruits) supply chain that directly links the producers and consumers, with limited intermediaries in the value chain. The food would be fresh and produced according to community needs and set standards. Such a direct food supply would meet the nutritional requirements of communities. By producing food locally and stimulating local consumption, there will be cash flow to support other businesses and improve the livelihood of the communities. It will also reduce food processing by operating with reduced food transportation and more direct marketing from farmers to consumers and vice versa. This approach is anticipated to establish communities with sound trust and strong relationships among members. Less food processing and transportation will further provide environmental benefits in terms of reduced pollution, which will lead to cleaner air for better health of the community members. In the past two decades, the internet and the mobile device boom have helped develop the financial sector in the East Africa region. We foresee a future in which digital extension and advisory services will play important roles in the food system and food supply chains. It is important to modernize agriculture with new technologies and deploy information-communication-technology (ICT)-based systems. This may stimulate job creation, especially for young people and women, around the use of ICT-based decision support tools for the de-risking of the agricultural sector by providing real-time backing and enabling farmers to make timely decisions regarding the planting period, selection of the best agricultural practices, and carrying out proper and cost-effective crop management strategies.

Author Contributions

Conceptualization, H.E.Z.T. and B.M.S.; methodology, H.E.Z.T. and B.M.S.; software, H.E.Z.T. and B.M.S.; validation, H.E.Z.T.; investigation, B.M.S.; resources, H.E.Z.T.; data curation, B.M.S.; writing—original draft preparation, B.M.S.; writing—reviewing and editing, H.E.Z.T., B.W.M., B.M.S., M.W., and S.N.; visualization, B.M.S.; supervision, H.E.Z.T. All authors have read and agreed to the published version of the manuscript.

Funding

This research was funded by BioInnovate Africa, International Centre of Insect Physiology and Ecology (icipe), grant number B8401F.

Institutional Review Board Statement

Not applicable.

Data Availability Statement

Data are available on request from the corresponding author.

Acknowledgments

The authors gratefully acknowledge icipe core donors: the Swedish International Development Cooperation Agency (Sida), the Swiss Agency for Development and Cooperation (SDC), the Australian Centre for International Agricultural Research (ACIAR), the Federal Democratic Republic of Ethiopia, and the Government of the Republic of Kenya. The views expressed herein do not necessarily reflect the official opinion of the donors.

Conflicts of Interest

The authors declare no conflict of interest.

Appendix A

MODEL
S—Susceptible
E—Exposed
IR—Infection rate
ISR—Infection Setting Rate
QAR—Quarantine Asymptomatic Rate
IAR—Isolating Asymptomatic Rate
XAR—External arrival of Asymptomatic arrival
ARR—Asymptomatic Recovering Rate
A—Infected asymptomatic
I—Infected symptomatic
H—Hospitalized patients
C—Critical patients
D—Death
R—Recovery
InR—Incubation Rate
QSR—Quarantine Symptomatic Rate
ISR—Isolating Symptomatic Rate
DPR—Disease Progress Rate
SRR—Symptomatic Recovering Rate
QARR—Quarantine Asymptomatic Recovery Rate
QInR—Quarantine Incubation Rate
LARR—Isolated Asymptomatic Recovery Rate
QA—Quarantine asymptomatic
QI—Quarantine symptomatic
LA—Isolated Asymptomatic
LI—Isolated Symptomatic
LInR—Isolated Incubation Rate
QSRR—Quarantined Symptomatic Recovery Rate
QDPR—Quarantined Disease Progress Rate
LSRR—Isolated Symptomatic Recovery Rate
LDRR—Isolated Disease Progress Rate
HRR—Hospitalised Recovery Rate
WR—Worsening Rate
VR—Vaccination Rate
IF—Infectivity
T—Total infection
IncR—Income Rate
HInc—Household Income
ExR—Expenditure Rate
FP—Food Prices
FNI—Food and nutrition Insecurity
FD—Food Demand
FDR—Food Demand Rate
FPr—Food Production
FPR—Food Production Rate
SR—Supply Rate
FS—Food Supply
LE—Labour Employed
ER—Employment Rate
LF—Labour Forces
UR—Unemployment Rate
LU—Labour Unemployed
Equations of the stocks
1. d S d t = ( IR ( t )   V ( t ) )
2. d E d t = IR ( t )   ISR ( t )
3. d A d t = ISR ( t ) + XAR   ( t ) QAR ( t ) IA ( t ) ARR ( t ) InR ( t )
4. d I d t = InR ( t ) QSR ( t ) LSR ( t ) DPR ( t ) SRR ( t )
5. d Q A d t = QAR ( t ) QARR ( t ) QinR ( t )
6. d L A d t = IAR ( t ) LinR ( t ) LARR ( t )
7. d Q I d t = QinR ( t ) + QSR ( t ) QPDR ( t ) QSRR ( t )
8. d L I d t = LInR ( t ) + LSR ( t ) LSRR ( t ) LDRR ( t )
9. d H d t = DPR ( t ) + QDPR ( t ) + LDRR ( t ) HRR ( t ) WR ( t )
10. d C d t = WR ( t ) CCR ( t ) DR ( t )
11. d D d t = DR ( t )
12. d R d t = ARR ( t ) + SRR ( t ) + HRR ( t ) + CCR ( t ) _ QARR ( t ) + LARR ( t ) + QSRR ( t ) + LSRR ( t )
13. d H I n c d t = IncR ( t ) ExR ( t )
14. d G D P d t = GDPR ( t ) IncR ( t )
15. d F P d t = ExR ( t )
16. d F P r d t = FR ( t ) SR ( t )
17. d F S d t = SR ( t ) DR ( t )
18. d F D d t = DR ( t ) × FP
19. d L E d t = ER ( t )
20. d L F d t = ER ( t ) UR ( t )
21. d L U d t = UR ( t )
22. d C C R d t = NCR ( t )
23. d F N I d t = FIC [ State ,   agegrp ]
Equations of the flows
24. IR(t) = IF×T×S(t)
25. ISR (t) = Delay3(IR(t), dEA)
26. 𝑄𝐴𝑅(𝑡) = (𝑓1(𝑡)+𝑓𝑋(𝑡)𝑓4(𝑡))×𝐷𝐸𝐿𝐴𝑌3(𝐼𝑆𝑅(𝑡)+𝐸𝐴𝑅(𝑡),𝑑𝐴𝑄)
27. 𝐿𝐴𝑅(𝑡) = 𝑓2(𝑡)×𝐷𝐸𝐿𝐴𝑌3(𝐼𝑆𝑅(𝑡)+𝐸𝐴𝑅(𝑡),𝑑𝐴𝐿)
28. 𝐼𝑛𝑅(𝑡) = 𝑓𝑆×(1−𝑓1(𝑡)−𝑓2(𝑡)−𝑓𝑋(𝑡))×𝐷𝐸𝐿𝐴𝑌3(𝐼𝑆𝑅(𝑡)+𝐸𝐴𝑅(𝑡),𝑑𝐴𝐼)
29. 𝐴𝑅𝑅(𝑡) = (1−𝑓𝑆)×(1−𝑓1(𝑡)−𝑓2(𝑡)−𝑓𝑋(𝑡))×𝐷𝐸𝐿𝐴𝑌3(𝐼𝑆𝑅𝑖(𝑡)+𝐸𝐴𝑅(𝑡), 𝑑𝐴𝑅)
30. 𝑄𝐼𝑛𝑅(𝑡) = 𝑓𝑆 ×𝐷𝐸𝐿𝐴𝑌3(𝑄𝐴𝑅(𝑡),𝑑𝑄𝑄)
31. 𝑄𝐴𝑅𝑅(𝑡) = (1−𝑓𝑆)×𝐷𝐸𝐿𝐴𝑌3(𝑄𝐴𝑅(𝑡),𝑑𝑄𝐴𝑅)
32. 𝐿𝐼𝑛𝑅(𝑡) = 𝑓𝑆 ×𝐷𝐸𝐿𝐴𝑌3(𝐿𝐴𝑅(𝑡),𝑑𝐿𝐿)
33. 𝐿𝐴𝑅𝑅(𝑡) = (1−𝑓𝑆)×𝐷𝐸𝐿𝐴𝑌3(𝐿𝐴𝑅(𝑡),𝑑𝐿𝐴𝑅)
34. 𝑄𝑆𝑅(𝑡) = 𝑓3(𝑡)×𝐷𝐸𝐿𝐴𝑌3(𝐼𝑛𝑅(𝑡),𝑑𝐼𝑄)
35. 𝐿𝑆𝑅(𝑡) = 𝑓4(𝑡)×𝐷𝐸𝐿𝐴𝑌3(𝐼𝑛𝑅(𝑡),𝑑𝐼𝐿)
36. 𝐷𝑃𝑅(𝑡) = 𝑓h ×(1−𝑓3(𝑡)−𝑓4(𝑡))×𝐷𝐸𝐿𝐴𝑌3(𝐼𝑛𝑅(𝑡),𝑑𝐼𝐻)
37. 𝑆𝑅𝑅(𝑡) = (1−𝑓h)×(1−𝑓3(𝑡)−𝑓4(𝑡))×𝐷𝐸𝐿𝐴𝑌3(𝐼𝑛𝑅(𝑡),𝑑𝐼𝑅)
38. 𝑄𝐷𝑃𝑅(𝑡) = 𝑓h ×𝐷𝐸𝐿𝐴𝑌3(𝑄𝑆𝑅(𝑡)+𝑄𝐼𝑛𝑅(𝑡),𝑑𝑄𝐻)
39. 𝑄𝑆𝑅𝑅(𝑡) = (1−𝑓h)×𝐷𝐸𝐿𝐴𝑌3(𝑄𝑆𝑅(𝑡)+𝑄𝐼𝑛𝑅(𝑡),𝑑𝑄𝐼𝑅)
40. 𝐿𝐷𝑃𝑅(𝑡) = 𝑓h ×𝐷𝐸𝐿𝐴𝑌3(𝐿𝑆𝑅(𝑡)+𝐿𝐼𝑛𝑅(𝑡),𝑑𝐿𝐻)
41. 𝐿𝑆𝑅𝑅(𝑡) = (1−𝑓h )×𝐷𝐸𝐿𝐴𝑌3(𝐿𝑆𝑅(𝑡)+𝐿𝐼𝑛𝑅(𝑡),𝑑𝐿𝐼𝑅)
42. M H I R t = D H i = 0 n DH = Max ( 0 , ( KH i n H σ ))
43. HAR(t) = Min( i n DH σ , M H I R t
44. HAOR(t) = Max(0, i n DH σ M H I R t
45. 𝑊𝑅(𝑡) = 𝑓𝐶 ×𝐷𝐸𝐿𝐴𝑌3(𝐻𝐴𝑅(𝑡),𝑑𝐻𝐶)
46. 𝐻𝑅𝑅(𝑡) = (1−𝑓𝐶)×𝐷𝐸𝐿𝐴𝑌3( 𝐻𝐴𝑅(𝑡),𝑑𝐻𝑅)
47. 𝐷𝑅(𝑡) = 𝑓𝐷 ×𝐷𝐸𝐿𝐴𝑌3(𝑊𝑅(𝑡), 𝑑𝐶𝐷)
48. 𝐶𝑅𝑅(𝑡) = (1−𝑓𝐷)×𝐷𝐸𝐿𝐴𝑌3(𝑊𝑅(𝑡),𝑑𝐶𝑅)
49. 𝐷𝑅(𝑡) = 𝑓𝐷𝑂 ×𝐷𝐸𝐿𝐴𝑌3( 𝐶𝑂𝑅(𝑡)+𝑂𝑊𝑅(𝑡),𝑑𝐶𝐷)
50. 𝐶𝑅𝑅(𝑡) = (1−𝑓𝐷𝑂)×𝐷𝐸𝐿𝐴𝑌3(𝐶𝑂𝑅(𝑡)+𝑂𝑊𝑅(𝑡),𝑑𝐶𝑅)
51. 𝐷𝑅𝐶(𝑡) = 𝐷𝑃𝑅(𝑡)+𝐿𝑆𝑅(𝑡)+𝑄𝐷𝑃𝑅(𝑡)+𝐿𝐴𝑅(𝑖 )
52. d D R C d t = DRC ( t )

Appendix B

DELAY PARAMETERS
Latency period, dLP 3 Days
Incubation period, dIP5 Days
Developing symptoms period, dDP 2 Days
Asymptomatic recovery period, dAP11 Days
Infectious asymptomatic to become serious / hospitalize, dIH5 Days
Symptomatic recovery period, dSP14 Days
Worsening duration, dWD5 Days
Hospitalized patient recovery period, dHP14 Days
Period for critical patient to die, dPD5 Days
Period for critical patients to recover, dPR14 Days
Quarantine period/Isolate asymptomatic, dQIA1 Day
Quarantine period/Isolate symptomatic, dQIS2.5 Days
Quarantine period/Isolate symptomatic to 1 Day develop symptoms, dQISD
Quarantine period/Isolate symptomatic to 2.5 Days become serious, dQISB
Quarantine period/isolate asymptomatic to 10 Days recover, dQIAR
Quarantine period/Isolate symptomatic to 13 Days become serious/hospitalize, dQISBH
SCORES
Food availability score41.8%
Food access score53.2%
Food utilization score58.6%
Food nutritional security (initial)49.0%

References

  1. Al-Ali, N. Covid-19 and feminism in the Global South: Challenges, initiatives and dilemmas. Eur. J. Women’s Stud. 2020, 27, 333–347. [Google Scholar] [CrossRef]
  2. Clapp, J.; Moseley, W.G. This food crisis is different: COVID-19 and the fragility of the neoliberal food security order. J. Peasant Stud. 2020, 47, 1393–1417. [Google Scholar] [CrossRef]
  3. Yazdanpanah, M.; Tajeri Moghadam, M.; Savari, M.; Zobeidi, T.; Sieber, S.; Löhr, K. The Impact of Livelihood Assets on the Food Security of Farmers in Southern Iran during the COVID-19 Pandemic. Int. J. Environ. Res. Public Health 2021, 18, 5310. [Google Scholar] [CrossRef]
  4. Chirisa, I.; Mutambisi, T.; Chivenge, M.; Mabaso, E.; Matamanda, A.R.; Ncube, R. The urban penalty of COVID-19 lockdowns across the globe: Manifestations and lessons for Anglophone sub-Saharan Africa. GeoJournal 2022, 87, 815–828. [Google Scholar] [CrossRef] [PubMed]
  5. Berg, S.v.d.; Patel, L.; Bridgman, G. Food insecurity in South Africa: Evidence from NIDS-CRAM wave 5. Dev. S. Afr. 2022, 39, 722–737. [Google Scholar] [CrossRef]
  6. Tien, N.H.; Anh, D.B.H.; Thuc, T.D. Global Supply Chain and Logistics Management; Academic Publications: Dehli, India, 2019; Volume 162. [Google Scholar]
  7. Tukamuhabwa, B.; Stevenson, M.; Busby, J. Supply chain resilience in a developing country context: A case study on the interconnectedness of threats, strategies and outcomes. Supply Chain Manag. 2017, 22, 486–505. [Google Scholar] [CrossRef] [Green Version]
  8. Song, S.; Goh, J.C.; Tan, H.T. Is food security an illusion for cities? A system dynamics approach to assess disturbance in the urban food supply chain during pandemics. Agric. Syst. 2021, 189, 103045. [Google Scholar] [CrossRef]
  9. Ceballos, F.; Kannan, S.; Kramer, B. Impacts of a national lockdown on smallholder farmers’ income and food security: Empirical evidence from two states in India. World Dev. 2020, 136, 105069. [Google Scholar] [CrossRef]
  10. Swinnen, J.; McDermott, J. COVID-19 and global food security. EuroChoices 2020, 19, 26–33. [Google Scholar] [CrossRef]
  11. Béné, C.; Bakker, D.; Chavarro, M.J.; Even, B.; Melo, J.; Sonneveld, A. Global assessment of the impacts of COVID-19 on food security, Glob. Food Secur. 2021, 31, 100575. [Google Scholar] [CrossRef]
  12. Sánchez, M.V.; Cicowiez, M.; Ortega, A. Prioritizing public investment in agriculture for post-COVID-19 recovery: A sectoral ranking for Mexico. Food Policy 2022, 109, 102251. [Google Scholar] [CrossRef]
  13. Nechifor, V.; Ramos, M.P.; Ferrari, E.; Laichena, J.; Kihiu, E.; Omanyo, D.; Musamali, R.; Kiriga, B. Food security and welfare changes under COVID-19 in Sub-Saharan Africa: Impacts and responses in Kenya. Glob. Food Secur. 2021, 28, 100514. [Google Scholar] [CrossRef] [PubMed]
  14. Liguori, J.; Trübswasser, U.; Pradeilles, R.; Le Port, A.; Landais, E.; Talsma, E.F.; Lundy, M.; Bene, C.; Bricas, N.; Laar, A.; et al. How do food safety concerns affect consumer behaviors and diets in low- and middle-income countries? A systematic review. Glob. Food Secur. 2022, 32, 100606. [Google Scholar] [CrossRef]
  15. Nchanji, E.B.; Lutomia, C.K. Regional impact of COVID-19 on the production and food security of common bean smallholder farmers in Sub-Saharan Africa: Implication for SDG’s. Glob. Food Secur. 2021, 29, 100524. [Google Scholar] [CrossRef] [PubMed]
  16. Di Vaio, A.; Boccia, F.; Landriani, L.; Palladino, R. Artificial Intelligence in the Agri-Food System: Rethinking Sustainable Business Models in the COVID-19 Scenario. Sustainability 2020, 12, 4851. [Google Scholar] [CrossRef]
  17. D’Amore, G.; Di Vaio, A.; Balsalobre-Lorente, D.; Boccia, F. Artificial Intelligence in the Water–Energy–Food Model: A Holistic Approach towards Sustainable Development Goals. Sustainability 2022, 14, 867. [Google Scholar] [CrossRef]
  18. Turner, J.R.; Baker, R.M. Complexity Theory: An Overview with Potential Applications for the Social Sciences. Systems 2019, 7, 4. [Google Scholar] [CrossRef] [Green Version]
  19. Alexander, F.S.; Yaneer, B.-Y. An introduction to complex systems science and its applications. Complexity 2020, 2020, 6105872. [Google Scholar]
  20. Siringi, E.M. Analysis of Economic Effect of COVID-19 Pandemic on the Kenyan Economy. Afr. Rev. 2020, 49, 38–53. [Google Scholar] [CrossRef]
  21. Kansiime, M.K.; Tambo, J.A.; Mugambi, I.; Bundi, M.; Kara, A.; Owuor, C. COVID-19 implications on household income and food security in Kenya and Uganda: Findings from a rapid assessment. World Dev. 2021, 137, 104903. [Google Scholar] [CrossRef]
  22. Sutcliffe, S.; Lau, J.; Barnes, M.L.; Mbaru, E.; Wade, E.; Hungito, W.; Muly, I.; Wanyonyi, S.; Muthiga, N.A.; Cohen, P.J.; et al. COVID-19 impacts on food systems in fisheries-dependent island communities. Ecol. Soc. 2023, 28, 1. [Google Scholar] [CrossRef]
  23. Picchioni, F.; Goulao, L.F.; Roberfroid, D. The impact of COVID-19 on diet quality, food security and nutrition in low- and middle-income countries: A systematic review of the evidence. Clin. Nutr. 2022, 41, 2955–2964. [Google Scholar] [CrossRef]
  24. Venkateswaran, J.; Damani, O. Effectiveness of testing, tracing, social distancing and hygiene in tackling COVID-19 in India: A system dynamics model. arXiv 2020, arXiv:2004.08859. [Google Scholar] [CrossRef]
  25. Kazancoglu, Y.; Ozbiltekin-Pala, M.; Sezer, M.D.; Ekren, B.Y.; Kumar, V. Assessing the Impact of COVID-19 on Sustainable Food Supply Chains. Sustainability 2022, 14, 143. [Google Scholar] [CrossRef]
  26. Li, S.; Ma, S.; Zhang, J. Building a system dynamics model to analyze scenarios of COVID-19 policymaking in tourism-dependent developing countries: A case study of Cambodia. Tour. Econ. 2022, 29, 13548166211059080. [Google Scholar] [CrossRef]
  27. Kozlovskyi, S.; Bilenko, D.; Kuzheliev, M.; Lavrov, R.; Kozlovskyi, V.; Mazur, H.; Taranych, A. The system dynamic model of the labor migryant policy in economic growth affected by COVID-19. Glob. J. Environ. Sci. Manag. 2020, 6, 95–106. [Google Scholar]
  28. Marzouk, M.; Azab, S.; Elshaboury, N.; Megahed, A.; Metawie, M.; El Hawary, M.; Ghaith, D.; Bayoumi, A. Modeling COVID-19 effects on SDGs using system dynamics in Egypt. Environ. Sci. Pollut. Res. 2022, 29, 59235–59246. [Google Scholar] [CrossRef]
  29. Jia, S.; Li, Y.; Fang, T. System dynamics analysis of COVID-19 prevention and control strategies. Environ. Sci. Pollut. Res. 2022, 29, 3944–3957. [Google Scholar] [CrossRef]
  30. Shukla, A.; Tomer, N.; Singh, P. System Dynamics Modeling to Understand the Impact of Covid-19 on Indian Economy. Manag. Dyn. 2021, 21, 2. [Google Scholar] [CrossRef]
  31. Tonnang, H.; Greenfield, J.; Mazzaferro, G.; Austin, C.C.; WG, R. COVID-19 Emergency public health and economic measures causal loops: A computable framework. SSRN 2020. [Google Scholar] [CrossRef]
  32. Health Policy and Systems Research: A Methodology Reader. Available online: https://apps.who.int/iris/handle/10665/44803 (accessed on 23 July 2021).
  33. Situation Analysis of Children and Women in Kenya 2017. Available online: https://www.unicef.org/kenya/reports/situation-analysis-children-and-women-kenya-2017 (accessed on 21 July 2021).
  34. Sokame, B.M.; Tonnang, H.E.Z.; Subramanian, S.; Bruce, A.Y.; Dubois, T.; Ekesi, S.; Calatayud, P.-A. A system dynamics model for pests and natural enemies interactions. Sci. Rep. 2021, 11, 1401. [Google Scholar] [CrossRef]
  35. Turner, C.; Aggarwal, A.; Walls, H.; Herforth, A.; Drewnowski, A.; Coates, J.; Kalamatianou, S.; Kadiyala, S. Concepts and critical perspectives for food environment research: A global framework with implications for action in low- and middle-income countries. Glob. Food Secur. 2018, 18, 93–101. [Google Scholar] [CrossRef]
  36. Hannah, S.; Carlos, G.-P.; Nico, S.; Wolfgang, C. QtAC: An R-package for analyzing complex systems development in the framework of the adaptive cycle metaphor. Ecol. Model. 2022, 466, 109860. [Google Scholar] [CrossRef]
  37. Whegang, Y.S.; Tonnang, Z.E.H.; Choukem, S.P. Modelling and projections of the COVID-19 epidemic and the potential impact of social distancing in Cameroon. J. Public Health Afr. 2022, 12, 1479. [Google Scholar] [CrossRef]
  38. Impacts of COVID-19 on Food Security and Nutrition: Developing Effective Policy Responses to Address the Hunger and Malnutrition Pandemic. Available online: https://www.researchgate.net/publication/344863122_Impacts_of_COVID-19_on_food_security_and_nutrition_developing_effective_policy_responses_to_address_the_hunger_and_malnutrition_pandemic (accessed on 27 December 2022).
  39. Arndt, C.; Davies, R.; Gabriel, S.; Harris, L.; Makrelov, K.; Robinson, S.; Levy, S.; Simbanegavi, W.; van Seventer, D.; Anderson, L. Covid-19 lockdowns, income distribution, and food security: An analysis for South Africa. Glob. Food Secur. 2020, 26, 100410. [Google Scholar] [CrossRef]
  40. The Impact of COVID-19 Control Measures on Social Contacts and Transmission in Kenyan Informal Settlements. Available online: https://bmcmedicine.biomedcentral.com/articles/10.1186/s12916-020-01779-4 (accessed on 12 January 2023).
  41. Janssens, W.; Pradhan, M.; de Groot, R.; Sidze, E.; Donfouet, H.P.P.; Abajobir, A. The short-term economic effects of COVID-19 on low-income households in rural Kenya: An analysis using weekly financial household data. World Dev. 2021, 138, 105280. [Google Scholar] [CrossRef]
Figure 1. A causal loop diagram for visualization of the interconnectivity among variables of food and nutrition security, health, and COVID-19 contagion components. Arrows show the relationships between variables and (−, +) denote the polarity of the relationship. The biggest circle drawn by the dotted line connects health and food and nutrition insecurity components.
Sustainability 15 04717 g001
Figure 2. General stock and flow diagram for the contagion component in Eastern African countries (policy interventions in red and information arrows connecting the policy interventions to the flows in blue).
Sustainability 15 04717 g002
Figure 3. General stock and flow diagram for the health component in Eastern African countries (policy interventions in red color and information arrows connecting the policy interventions to the flows in blue).
Sustainability 15 04717 g003
Figure 4. General stock and flow diagram for the food and nutrition security component in Eastern African countries (policy interventions in red color and information arrows in blue).
Sustainability 15 04717 g004
Figure 5. Reported COVID-19 cases (A), hospitalizations (B), recoveries (C), and deaths (D) in Kenya.
Sustainability 15 04717 g005
Figure 6. Reported COVID-19 cases (A), hospitalizations (B), recoveries (C), and deaths (D) in Rwanda.
Sustainability 15 04717 g006
Figure 7. Impact of COVID-19 on food and nutrition security in Kenya: food and nutrition insecurity (A), food price (B) and food supply and demand (C).
Sustainability 15 04717 g007
Figure 8. Impact of COVID-19 on food and nutrition security in Rwanda food and nutrition insecurity (A), food price (B) and food supply and demand (C).
Sustainability 15 04717 g008
Figure 9. Model sensitivity analysis: food and nutritional insecurity (A,B) and infection rate (C,D).
Sustainability 15 04717 g009
Table 1. COVID-19 causal loops by system component.
LOOP DESCRIPTIONIMPLICATION
FOOD SECURITY AND NUTRTION COMPONENT
B1Lockdown–transport–tourism–lockdownLockdown impacts transport, which reduces tourism
B2Food security and nutrition–food safety–food security and nutritionLow rate of food safety reduces food security and nutrition
B3People employed–people unemployed–people employedEmployment rate reduces unemployment and vice versa
B4Price–food demand–priceHigh food demand escalates prices and vice versa
B5People employed–people unemployed–disposable income–people employedDisposable income is negatively affected by unemployment
B6Food security and nutrition–poverty–proximity of food–food security and nutritionPositive proximity of food results in high food security and nutrition
B7Food security and nutrition–food supply chain–food security and nutritionDisrupted food supply chain reduces food security and nutrition and vice versa
R1Food security and nutrition–poverty–food security and nutritionPoverty negatively impacts food security and nutrition
R2Food security and nutrition–GDP–food security and nutritionHigh GDP increases food security and nutrition and vice versa
R3Economic stress–GBV–poverty–economic stressGBV increases poverty, which impacts economic stress
R4People unemployed–economic stimulus–income tax relief–disposable income–people employed–people–unemployedUnemployment induces tax relief, thus increasing disposable income
R5Food supply chain–fear and uncertainty–hoarding–food supply chainFear and uncertainty give rise to hoarding behavior, hurting the food supply chain
CONTAGION COMPONENT
R6Asymptomatic–infected–asymptoticExponential growth of infected individuals in the population
R7Infected–symptomatic–infectedUpsurge in number of deceased and isolated individuals
R8Immune system–asymptomatic–recovered–immune systemStrong immune system increases the number of asymptomatic individuals
R9Susceptible–social distance–public perception–wearing mask–susceptibleWearing masks and social distancing increase the number of susceptible individuals
R10Contact tracing–di agnosed–contact tracingContact tracing increases the number of diagnosed individuals
B8Symptomatic–deceased–symptomaticSymptomatic individuals after a time delay could die
B9Recovered–symptomatic–isolated–recoveredRecovered individuals reduce the number of symptomatic individuals
B10Isolated–deceased–isolatedAfter delay, a group of isolated individuals died, contributing to increase the number of deceased individuals
B11Recovered–isolated–recoveredAfter delay, a group of isolated individuals recovered
B12Asymptomatic–recovered–asymptomaticAfter delay, a group of asymptomatic individuals recovered
HEALTH COMPONENT
R11Immune system–health system–immune systemDecent health system enhances immune system
R12Healthy habits–health system–healthy habitsHealthy habits increase the number of individuals with a strong immune system
R13Health intervention–isolated–occupied health facilities–shortage–health interventionsMore health interventions increase the number of isolated individuals and occupied health facilities, contributing to shortages
Disclaimer/Publisher’s Note: The statements, opinions and data contained in all publications are solely those of the individual author(s) and contributor(s) and not of MDPI and/or the editor(s). MDPI and/or the editor(s) disclaim responsibility for any injury to people or property resulting from any ideas, methods, instructions or products referred to in the content.

