Article

Evaluation of Sustainable Development of the Urban Ecological Environment and Its Coupling Relationship with Human Activities Based on Multi-Source Data

College of Water Conservancy and Hydropower Engineering, Sichuan Agricultural University, Ya’an 625014, China
*
Authors to whom correspondence should be addressed.
Sustainability 2023, 15(5), 4340; https://doi.org/10.3390/su15054340
Submission received: 28 December 2022 / Revised: 22 February 2023 / Accepted: 22 February 2023 / Published: 28 February 2023

Abstract

:
Combining the travel modes of human activities, fully mining multi-source data, and analyzing the relationship between the urban ecological environment and human activities are important topics in urban ecological environment planning. Human activity indicators were constructed based on the data of POI points, OSM road network, and residential areas. Machine learning models such as support vector regression machine, extreme gradient boosting regression, polynomial regression, and random forest regression were combined with remote sensing images to construct an urban ecological environment indicator system. These models were used to conduct regression analysis of urban ecological environment indicators and human activity indicators in Chengdu, China. The research shows that the three indicators of human activities all show a trend of increasing in the center and gradually decreasing in the surrounding areas, while the sustainable urban ecological environment indicators show the opposite trend. On the relationship between urban ecological environment and human activities, XGB has the best effect; the correlation between the street vitality index and the urban function mixing index and the sustainable urban ecological environment is stronger, and the correlation between the walkability measure index of the residential area and the sustainable urban ecological environment is even worse.

1. Introduction

With the rapid development of the urban economy, some problems affecting the good development of the city have become prominent, and the lives of the people have been seriously disturbed. The ecological environment problem of the city must be solved. Although the urban area accounts for only 2% of the total land area, the exhaust gas emitted by the city accounts for 78% of the total emissions and 60% of the total domestic water consumption [1]. At present, the urban population of developing countries has accounted for more than 65% of the total urban population in the world. According to relevant data surveys, there are more than 600 million people without a fixed residence in these developing countries, as many as 1.1 billion people cannot breathe fresh air, and tens of millions of people die every year due to water pollution problems.
China is in the transitional stage of the transition to a market economy. It not only faces the same common problems as other cities in the world, such as environmental pollution, but also has its own special series of problems. The sustainable development path is the only choice for the future development of the city. It is a specific response to social and economic problems such as the rapid urban population growth, vicious economic growth, and serious ecological environment pollution. The United Nations Commission on Environment and Development defines sustainable development as “not only fulfilling the needs of the present, but also without jeopardizing the satisfaction of future generations”. Its core connotation is to highlight that human beings should make effective use of ecological resources in the course of social and economic development, ensure that development is carried out on the premise of not harming the enjoyment of ecological resources by future generations, and ultimately promote the harmonious development of human beings in the future [2]. Human activities simulated urbanization and economic development from 2000 to 2014 and found that there were both positive and negative interference between human activities and urban ecological environment.
Due to the lack of diversified means and channels to obtain data, traditional urban research can only analyze urban development planning through field observation, questionnaire, summary of current situation maps, and so on. With the progress of science and technology, the development of all kinds of sensors, the attention paid by many technology companies to the value of data, and the improvement of human awareness of the urban ecological environment, researchers can obtain massive information through various means. Not only is the data information detailed, the data type is rich, which plays an important role in promoting the study of urban ecological environment. The in-depth development of the era of large data for fine analysis of urban ecological environment and the structured, targeted development provides ample data. Mobile phone signaling data, car track data, interest point data, and bus card swipe data all provide sufficient guarantee for the development of urban spatial planning and human activity interaction research.

2. Background

The development of cities all over the world has successively manifested “the phenomenon of depletion based on ecological environment resources”; therefore, the issue of sustainable urban development has become a hot topic of research by scholars. At the same time, researchers have found that the development of urban ecological environment is inextricably linked with human activities. According to the differences in research content and perspectives, the development of theoretical research can be roughly divided into the following three stages.

2.1. Demographic and Social Psychological Research Phase

Beginning in the 1930s, in the process of urban development, scholars have mainly studied a single city or a number of cities in a specific area. In addition, the research at this stage mainly uses empirical analysis methods to analyze the urbanization process, demographic characteristics of cities at this stage, and the social and psychological problems in the economic and social development of cities in specific geographical locations [3,4]. On the basis of these studies, with the improvement of sociological and behavioral research methods, the research in the 1960s and 1970s paid more attention to the research on the instability of urban human activities [5,6,7,8]. The discussion in this period, on the one hand, is due to the fact that the development of the city is in the golden period, and the main aspects of the contradiction are concentrated on the psychological problems in the development of the city and the human activities in the formation of the city. On the other hand, the common problem in these studies is that they did not realize the long-term development power of the city, and they did not foresee the possibility of the decline of urban development caused by the ecological environment problem.

2.2. Emergence of Contradiction

From the mid-1970s to the mid-1980s, the long-term extensive development of cities has resulted in the lack of late-mover advantages in the economic and social development of these cities. The characteristics of the theoretical research on urban development at this stage are as follows: first, it begins to focuses on empirical and normative research on groups, rather than on the development of single cities; second, it starts to study the distortion of economic structure and the imbalance between the development of resource-based cities and the development of ordinary cities caused by the extensive development of cities; third, it starts to shift from urban development itself to the study of economic relations on a global scale, from the psychological factors within the community in a single city to the study of its relationship to exploitation by interest groups [9,10].

2.3. Conflict between Resources, Environment and Economic Development

The 1980s has been the mature stage of the development theory of resource-based cities. With the rapid economic development of cities, the contradiction between resources and the environment in economic development has become increasingly prominent. Therefore, in recent years, some researchers have begun to focus on the contradiction between urban development and the sustainability of resources and the environment [11].
To sum up the above, humans do not only have strong interests in economic development; they also have direct experience with the quality of the sustainable urban ecological environment. While meeting the ever-increasing demands of people’s material lives, people are increasingly concerned about environmental protection. Human activities play a significant role in the development of urban ecological environments, with the advancement of science and technology and the deepening of the concept of environmental protection [12]. Traditional urban ecological environment study results are generally too one-sided and rough due to objective causes such as data loss, low accuracy, and only a little amount of data due to a lack of diverse data gathering methods and channels [13]. The deepening of the big data era provides beneficial data assistance for refined analysis and organized investigation of the sustainable urban ecological environment. This article examines the relationship between “ecological environment” and “human activity” from two perspectives, utilizing a machine learning model to do so. Not only can we uncover the relationship between the two to provide better decision-making and suggestions for the survival and development of human society; we can also, under the national urban development strategy and as a matter urgency, provide important scientific basis for the construction of the urban ecological environment. In comparison to traditional data gathering methods, Internet multi-source data activities can assist cities with more complicated analysis and evaluation in a variety of ways [14,15]. Cell phone signaling data, for example, can be used to track the temporal and spatial distribution features of a population in real time [16]. The point of interest concept introduces a novel approach to identifying urban functional regions and assessing the health of cities [17]. Characterizing the characteristics of cities from several perspectives has become the basis for the research on urban issues, thanks to the peculiarities of multi-source data. Furthermore, the growth of machine learning is distinct from traditional research methodologies, and its low-cost, quick, and efficient qualities are only used to the study of complicated urban problems [18]. Li Zhixuan utilized a convolutional neural network technique to determine the green vision rate of street view photos in order to find a link between inhabitants’ mental health and their green vision rate. However, due to the data collection method, it is hard to compare the intensity of environmental awareness in different space/time situations [19,20]. In conclusion, the present research has made significant progress, but there are certain flaws, such as the lack of multi-source data types, which leads to a single result, and the lack of model comparison, which reduces the credibility of the conclusion.
This study constructs a residential area walkability index, a street vitality index, and an urban function mixing degree index, which are all strongly connected to human activities, using POI locations, OSM (OpenStreetMap) road network, and residential area data. It establishes a remote sensing ecological index as an urban ecological environment indicator using remote sensing images. The link between urban ecological environment and human activities is shown using a combination of four common machine learning regression models in order to better assist in the development of cities and human existence.
In conclusion, the relationship between the urban ecological environment and human activity is a comprehensive and complicated problem. How to accurately, efficiently, and quickly obtain the data of ecological environment changes at various spatiotemporal scales is the key to its research. As a result, from multi-source geospatial large data combined with the urban ecological environment—from two visual angles, i.e., “ecological” and “people”—regression analysis was conducted to treat urban ecological environment and human activities and, simultaneously, the coupling relationship between them.

3. Study Area and Data Source

3.1. Study Area

Chengdu, China’s Sichuan Province, was chosen as the research region for this work. Chengdu has strengthened its investment in ecological civilization and committed itself to the development of urban ecological civilization in recent years. The link between urban ecological civilization and human activity is the analysis of the sustainable urban ecological environment and human activities against the backdrop of urgency. Chengdu is divided into 12 municipal districts, 3 counties, and 5 county-level cities, with a total size of 14,335 km2 and a built-up area of 949.6 km2 under its control. It has a permanent population of 16,581,000 people and a city population of 12.3379 million people, with a 74.41% urbanization rate. Figure 1 illustrates this.

3.2. Data Source

(1)
POI data, a total of 16 industry categories and more than 370,000 points (September 2020), is shown in Figure 2a–d.
(2)
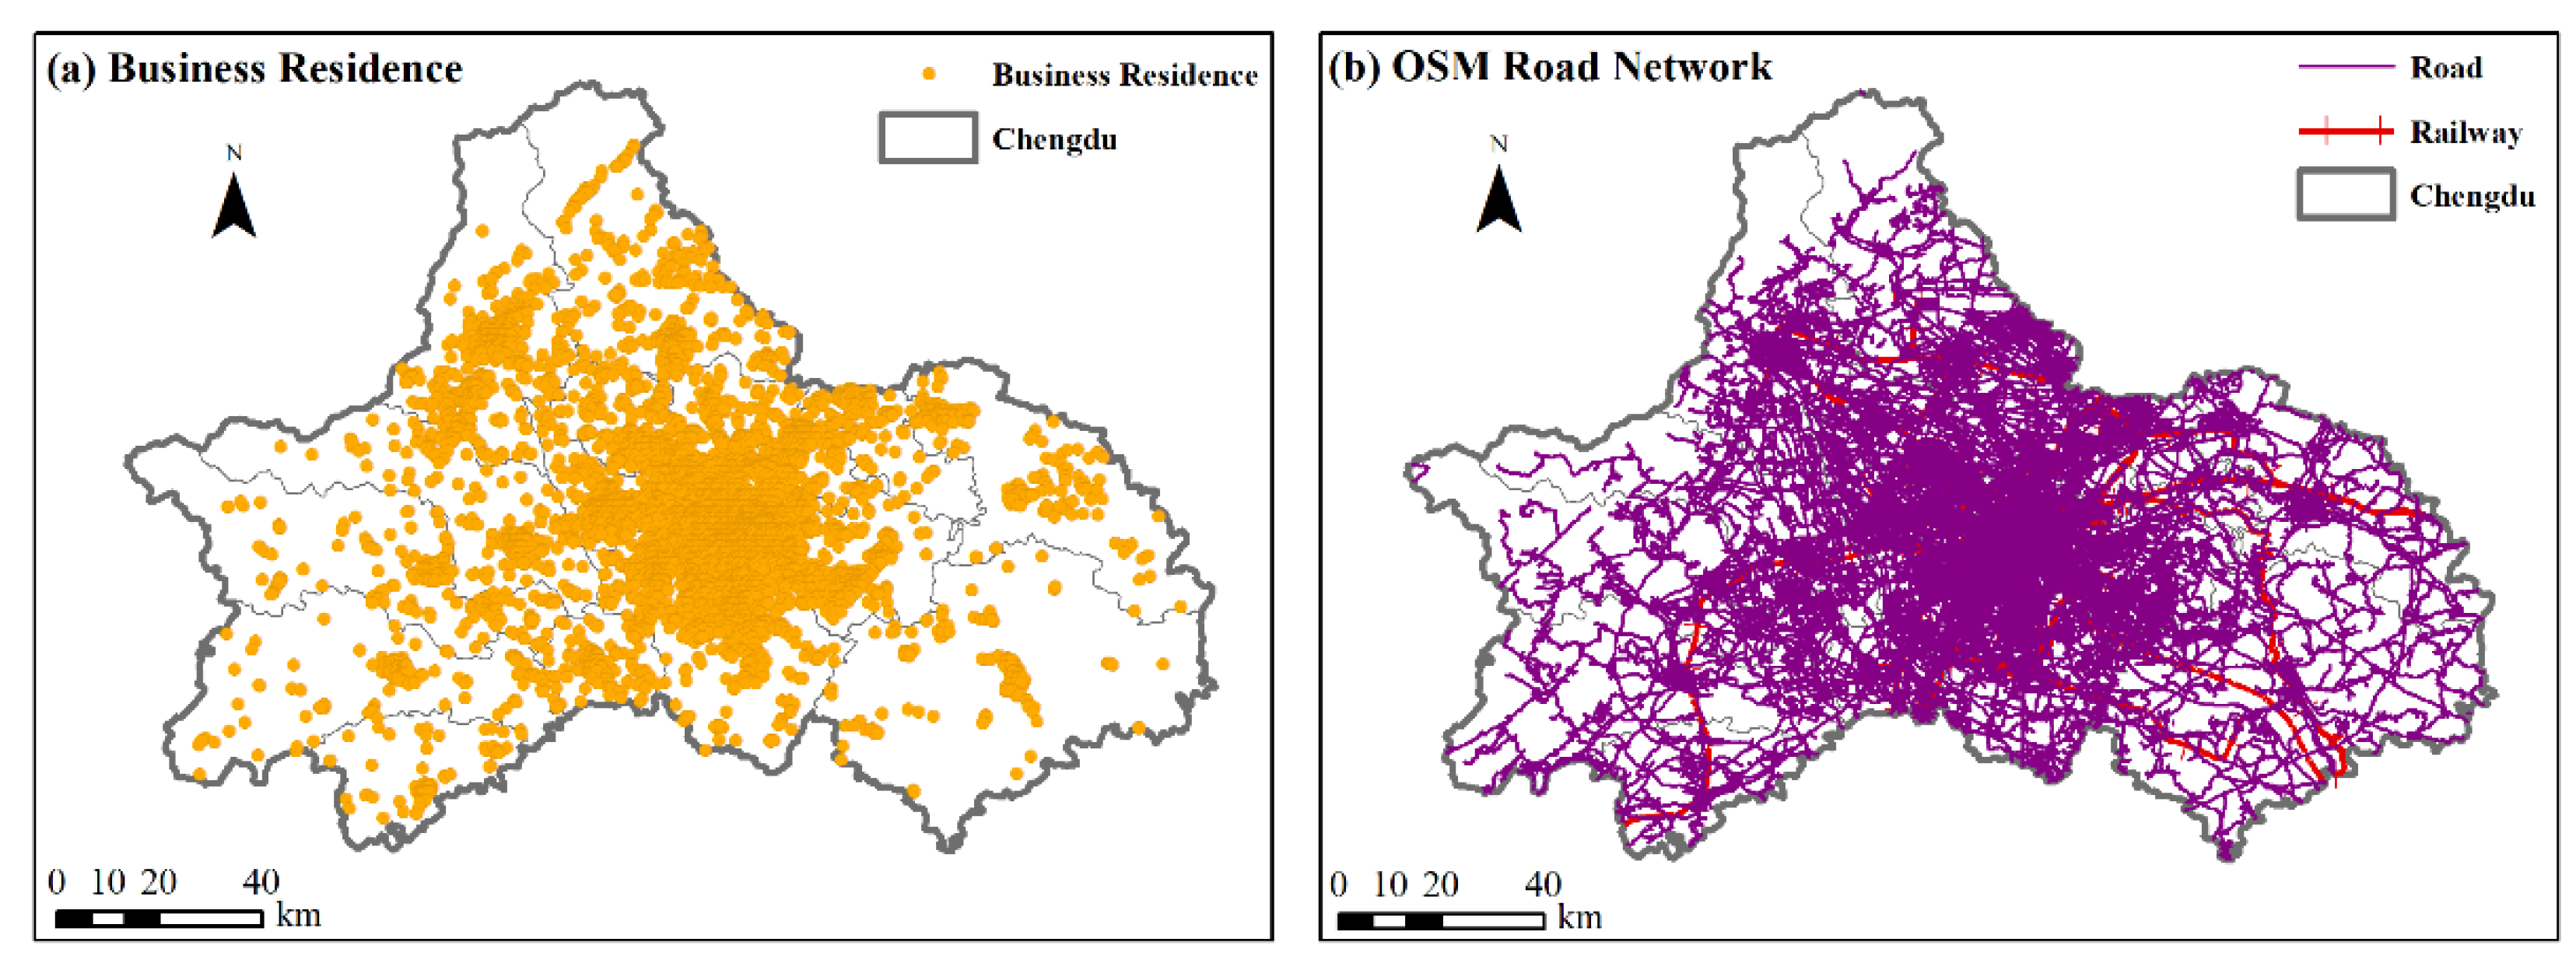
Residential area data were screened out from POI points as “residential area” and the data were cleaned, as shown in Figure 3a.
(3)
Road network data (2020) were collected from the OSM website after collated and checked, as shown in Figure 3b.
(4)
The remote sensing image of Chengdu in September 2020 obtained by Landsat 8 is shown in Figure 1.

4. Human Activity and Urban Ecological Environment Index

Three indicators are recommended for the building of the human activity assessment index: the residential walkability index, the street vitality index, and the urban function mixing index.

4.1. Residential Walkability Index

The residential walkability index is calculated using the walking attenuation rule to determine the walking distance from daily supporting amenities to the residential area [21]. The term “walking attenuation” refers to the fact that the number of supporting facilities that can be accessed by human walking decreases as distance increases. The surrounding areas of the planning and construction of residential areas, according to the “Planning and Design Standards for Urban Residential Areas (2019),” primarily include five types of supporting facilities, namely, public management and public service facilities, commercial service facilities, municipal public facilities, transportation stations, and community and convenient service facilities [22]. The first-level indicators for generating the walkability measure index of residential areas are the five supporting amenities listed above. As presented in Table 1, suitable secondary and tertiary indicators are summarized based on the appropriate POI sites.
According to the official website’s (walkscore.com accessed on 1 October 2022) walkable distance attenuation legislation, y is the distance attenuation rate and x is the distance from each supporting facility to the residential area, as shown in Table 2. In normal conditions, an adult’s standard walking pace is 80 m/min, and the greatest distance covered in five minutes at this speed is 0.4 km, with no attenuation. The farthest distance traveled in 20 min is 1.6 km, and according to the cubic curve function, this process decays fast until it reaches 12% decay. The maximum distance covered in 30 min is 2.4 km; then it rapidly decreases to 0 km. The influence of infrastructure beyond 2.4 km, on the other hand, is not taken into account.
The influence of road intersection density and block length should also be considered when constructing the real walkability index, in addition to the supporting amenities around the residential area. The more road crossings there are, the more roadways are available for citizens to stroll on, resulting in more street dynamism. In addition, small roadways are thought to be more traffic-friendly than large ones. As a result, the impact of road intersection density and block length on the pedestrian measure index must be considered. As indicated in Table 3, these two factors are separated into six categories, with different attenuation rates computed for each grade.
To begin, network analysis is used to calculate the OD cost distance, and the distance between them is estimated using the residential area as the starting point and Table 1 data as the ending point, respectively. Second, attenuation law function in Table 2 is used to calculate the distance attenuation rate for each supporting facility. Finally, we determine the fundamental walkability index for each residential area. Following that, the number of road intersections located within 2400 m of each residential area is filtered out, the density of road intersections is calculated, and the street and residential areas are spatially connected to determine the block length of each residential area and calculate the final residential walkability index using Equation (1).
B = K × 1 α × β
B—the final residential walkability measure index; K—the base walkability measure index;   α —the road intersection density decay rate; β —the block length decay rate.

4.2. Street Vitality Index

The vitality of the streets is a critical component of urban development design. The more active the urban environment is, and the more plentiful and frequent human activities are, the higher the street vitality that is described. Therefore, street vitality is an important part of the intensity of human activities.
Unlike previous social media and cell phone signaling data, this research builds three first-level indicators and eight second-level indicators based on the street’s own characteristics and quantifies several aspects that influence its vitality [23], as shown in Table 4. By standardizing the secondary indicators and removing the effects of inconsistent outline quantities, then using the entropy weighting method to determine the weights to obtain the weights of each secondary indicator, and again using the same method to determine the weights of each primary indicator, the vitality index of each street was finally determined.

4.3. Urban Functional Mix Index

The more varieties of varied supporting facilities in a city within a specific range, as well as the more complicated urban functions, the higher the degree of mixing [24]. It is often used to measure the complexity of a system. Information entropy is the most common strategy utilized. Information entropy is a measure of the amount of information generated before and after the information is formed. The information entropy of a system will be bigger if the situation in the system is more complicated, and lower if the situation in the system is simpler. The formula for calculating information entropy is as follows:
S x = i = 1 n p x i log p x i
S x —information entropy; p x i —the probability of occurrence of event xi.
Chengdu, Sichuan Province, China, is divided into a grid of 500 m × 500 m, and then the POI points are spatially connected to the grid so that all POI points correspond to the grid so as to obtain the number of POI points under each grid, and finally to calculate the information entropy of the grid by using Formula (2).

4.4. Remote Sensing Ecological Index

Many researchers have utilized and evaluated the remote sensing ecological index (RSEI), which is now the most widely used remote sensing analytic approach for evaluating the ecological environment. Human activities have a significant impact on the quality of the sustainable urban ecological environment. It is required to pick indicators directly connected to human production activities for study in order to acquire the quality of the sustainable urban ecological environment. The four RSEI index components (greenness, humidity, heat, and dryness) are all key variables that humans can instinctively detect when it comes to the quality of the ecological environment [25]. The following is the formula:
RSEI = f NDVI , Wet , LST , NDBSI

4.4.1. Greenness Index

The normalized difference vegetation index (NDVI) is undoubtedly the most widely used vegetation index, and it is closely related to plant biomass, leaf area index, and vegetation coverage. Therefore, NDVI is used to represent the greenness index, and the formula is as follows (4):
NDVI = ρ 2 ρ 1 ρ 2 + ρ 1

4.4.2. Humidity Index

The tasseled cap transform is a data compression and de-redundancy technique whose brightness, greenness, and humidity components are all precisely proportional to surface physical properties, so it has been widely used in ecological monitoring. The humidity index in this study is represented by the humidity component “wet”, whose expression is because the humidity component is strongly connected to the humidity of vegetation and soil (5).
Wet = 002626 ρ 3 + 0.2141 ρ 4 + 0.0926 ρ 1 + 0.0656 ρ 2 0.7629 ρ 5 0.5388 ρ 7
In Equations (4) and (5), ρi (i = 1,...,5,7) is the reflectance of the corresponding bands of the ETM+ image, respectively.

4.4.3. Heat Index

The surface temperature, which is used to determine the heat index, may be estimated using the Landsat user manual’s model and the most recent updated calibration parameters, such as those of Chander (http://landsathandbook.gsfc.nasa.gov (accessed on 15 October 2022)); [26,27].
L 6 = gain × DN + bias
T = K 2 ln K 1 L 6 + 1  
In the formula, L6 is the radiation rate of the 6-band pixel of ETM+ thermal infrared at the sensor; DN is the pixel gray value, gain and bias are the gain value and bias value of the 6-band, respectively, which can be obtained from the image header file, T is the temperature value at the sensor, and K1 and K2 are calibration parameters: K1 = 606.09 W/(m2·sr·μm), K2 = 1282.71 mK.
To obtain the surface temperature LST, the temperature T obtained by Equation (7) must be adjusted for radiance [28]:
LST = T 1 + φ T ρ ln ε
In the above formula, φ is the central wavelength of the ETM+ 6 band ( φ = 11.45 μm; ρ = 1.438 × 10⁻² mK), ε is the surface specific radiation rate, and its value can be found in the reference [28].

4.4.4. Dryness Index

The IBI building index represents the dryness index, but there is still a significant amount of bare soil in the regional environment, which causes the surface to “dry”, thus the dryness index (NDBSI) can be synthesized by the two. It is created by combining the building index IBI and the soil index SI:
NDBSI = IBI + SI / 2
In the above formula:
IBI = { 2 ρ 5 / ρ 5 + ρ 2 ρ 2 / ρ 2 + ρ 1 + ρ 4 / ρ 4 + ρ 5 2 ρ 5 / ρ 5 + ρ 2 + ρ 2 / ρ 2 + ρ 1 + ρ 4 / ρ 4 + ρ 5
SI = ρ 5 + ρ 1 ρ 2 + ρ 3 / ρ 5 + ρ 1 + ρ 2 + ρ 3
In Equations (10) and (11), ρi (i = 1,...,5) is the reflectance of the corresponding bands of the ETM+ image, respectively.
Using principal component analysis and spatial coordinate rotation, we focus the key feature information on one or two principle components, then compute the initial RSEI′ using the principal components with the highest contribution value:
RSEI = 1 PC k NDVI , Wet , LST , NDBSI
Among them, PCk represents the feature after dimension reduction through principal component analysis. By normalizing RSEI′, the remote sensing ecological index RSEI can be obtained.
RSEI = RSEI RSEI min RSEI max RSEI min
The RSEI ranges from 0 to 1, with higher values indicating higher ecological quality.

4.5. Regression Model

This paper uses four common machine learning regression models to investigate the relationship between urban ecological environment and various indicators of human activities: polynomial regression (PLR), random forest regression (RFR), extreme gradient boosting regression (XGB), and support vector regression machine, (SVR) [29].
The PLR is a dimensional representation of linear regression. The original data is mapped to the high-dimensional space by establishing the coefficients of the independent variables, and then the regression results are derived via linear regression in the high-dimensional space. This is the quadratic polynomial regression equation that was employed in this study.
y i ^ = k 0 + w 1 x 1 + w 2 x 2 + w 3 x 3 + w 4 x 1 2 + w 5 x 2 2 + w 6 x 3 2 + w 7 x 1 x 2 + w 8 x 1 x 3 + w 9 x 2 x 3
Among them, k0 represents the intercept, y i ^ is the predicted value of the ith sample data, and w is the coefficient.
The core of RFR is to establish a series of regression decision trees and calculate their mean as the regression result. The calculation formula is shown in (15) and (16):
s x , θ t , t = 1 , 2 , 3 T  
s ¯ x = 1 T t = 1 T s x , θ t  
Among them, x∈X is the feature vector, T is the number of decision trees, θ is a random variable, and s is the regression decision tree constructed.
XGB creates a prediction score on each leaf node, which is the weight of the leaf node, as an enhanced gradient boosting tree technique. This weight is the regression result of all the samples that fall on the node on the regression tree and is represented by fk(xi). If XGB needs to create K regression trees, the overall model’s prediction result for sample i is:
y i ^ k = k k f k x i
Among them, fk represents the kth regression tree, and xi represents the feature vector corresponding to sample i.
SVR is a method for achieving the effect of regression by transforming a dataset that cannot be separated in low-dimensional space into high-dimensional space by increasing the dimension, establishing a hyperplane by utilizing the higher dimension, and seeking the shortest distance between all sample points and the hyperplane. For the training sample dataset D, we make the error between the predicted value f(x) and the real value y as small as possible. The expression for dataset D is:
D = x 1 , y 1 , x 2 , y 2 , , x m , y m
For a sample space, the linear equation expression of the divided hyperplane is:
f x = w T x + b  
Among them, w is the normal vector of the hyperplane, which determines the direction of the hyperplane, and b is the displacement.
Among the above regression models, PLR is easy to understand and fast to model. It is the basis of many powerful nonlinear regression models and is highly interpretable. The advantages of RFR are that the sample features are randomly sampled, the generalization ability is strong, and it is not easy to overfit. The optimal result is obtained through mean calculation. XGB can break through the limitations of the lifting tree itself so as to achieve the purpose of fast calculation speed and strong calculation performance; at the same time, it can effectively prevent over-fitting, and the loss function results are more accurate, which can achieve parallel optimization. The advantages of SVR are that it has a wide range of use, strong robustness, and a small number of support vectors can determine the result, which can eliminate a lot of redundancy in the data and simplify the regression problem. The four models are implemented in the scikit-learn package under the Python language, and the optimal hyper parameters are obtained by drawing the learning curve, and each regression evaluation standard is obtained.

5. Result Analysis

5.1. Result Analysis of Human Activity Index and Urban Ecological Environment Index

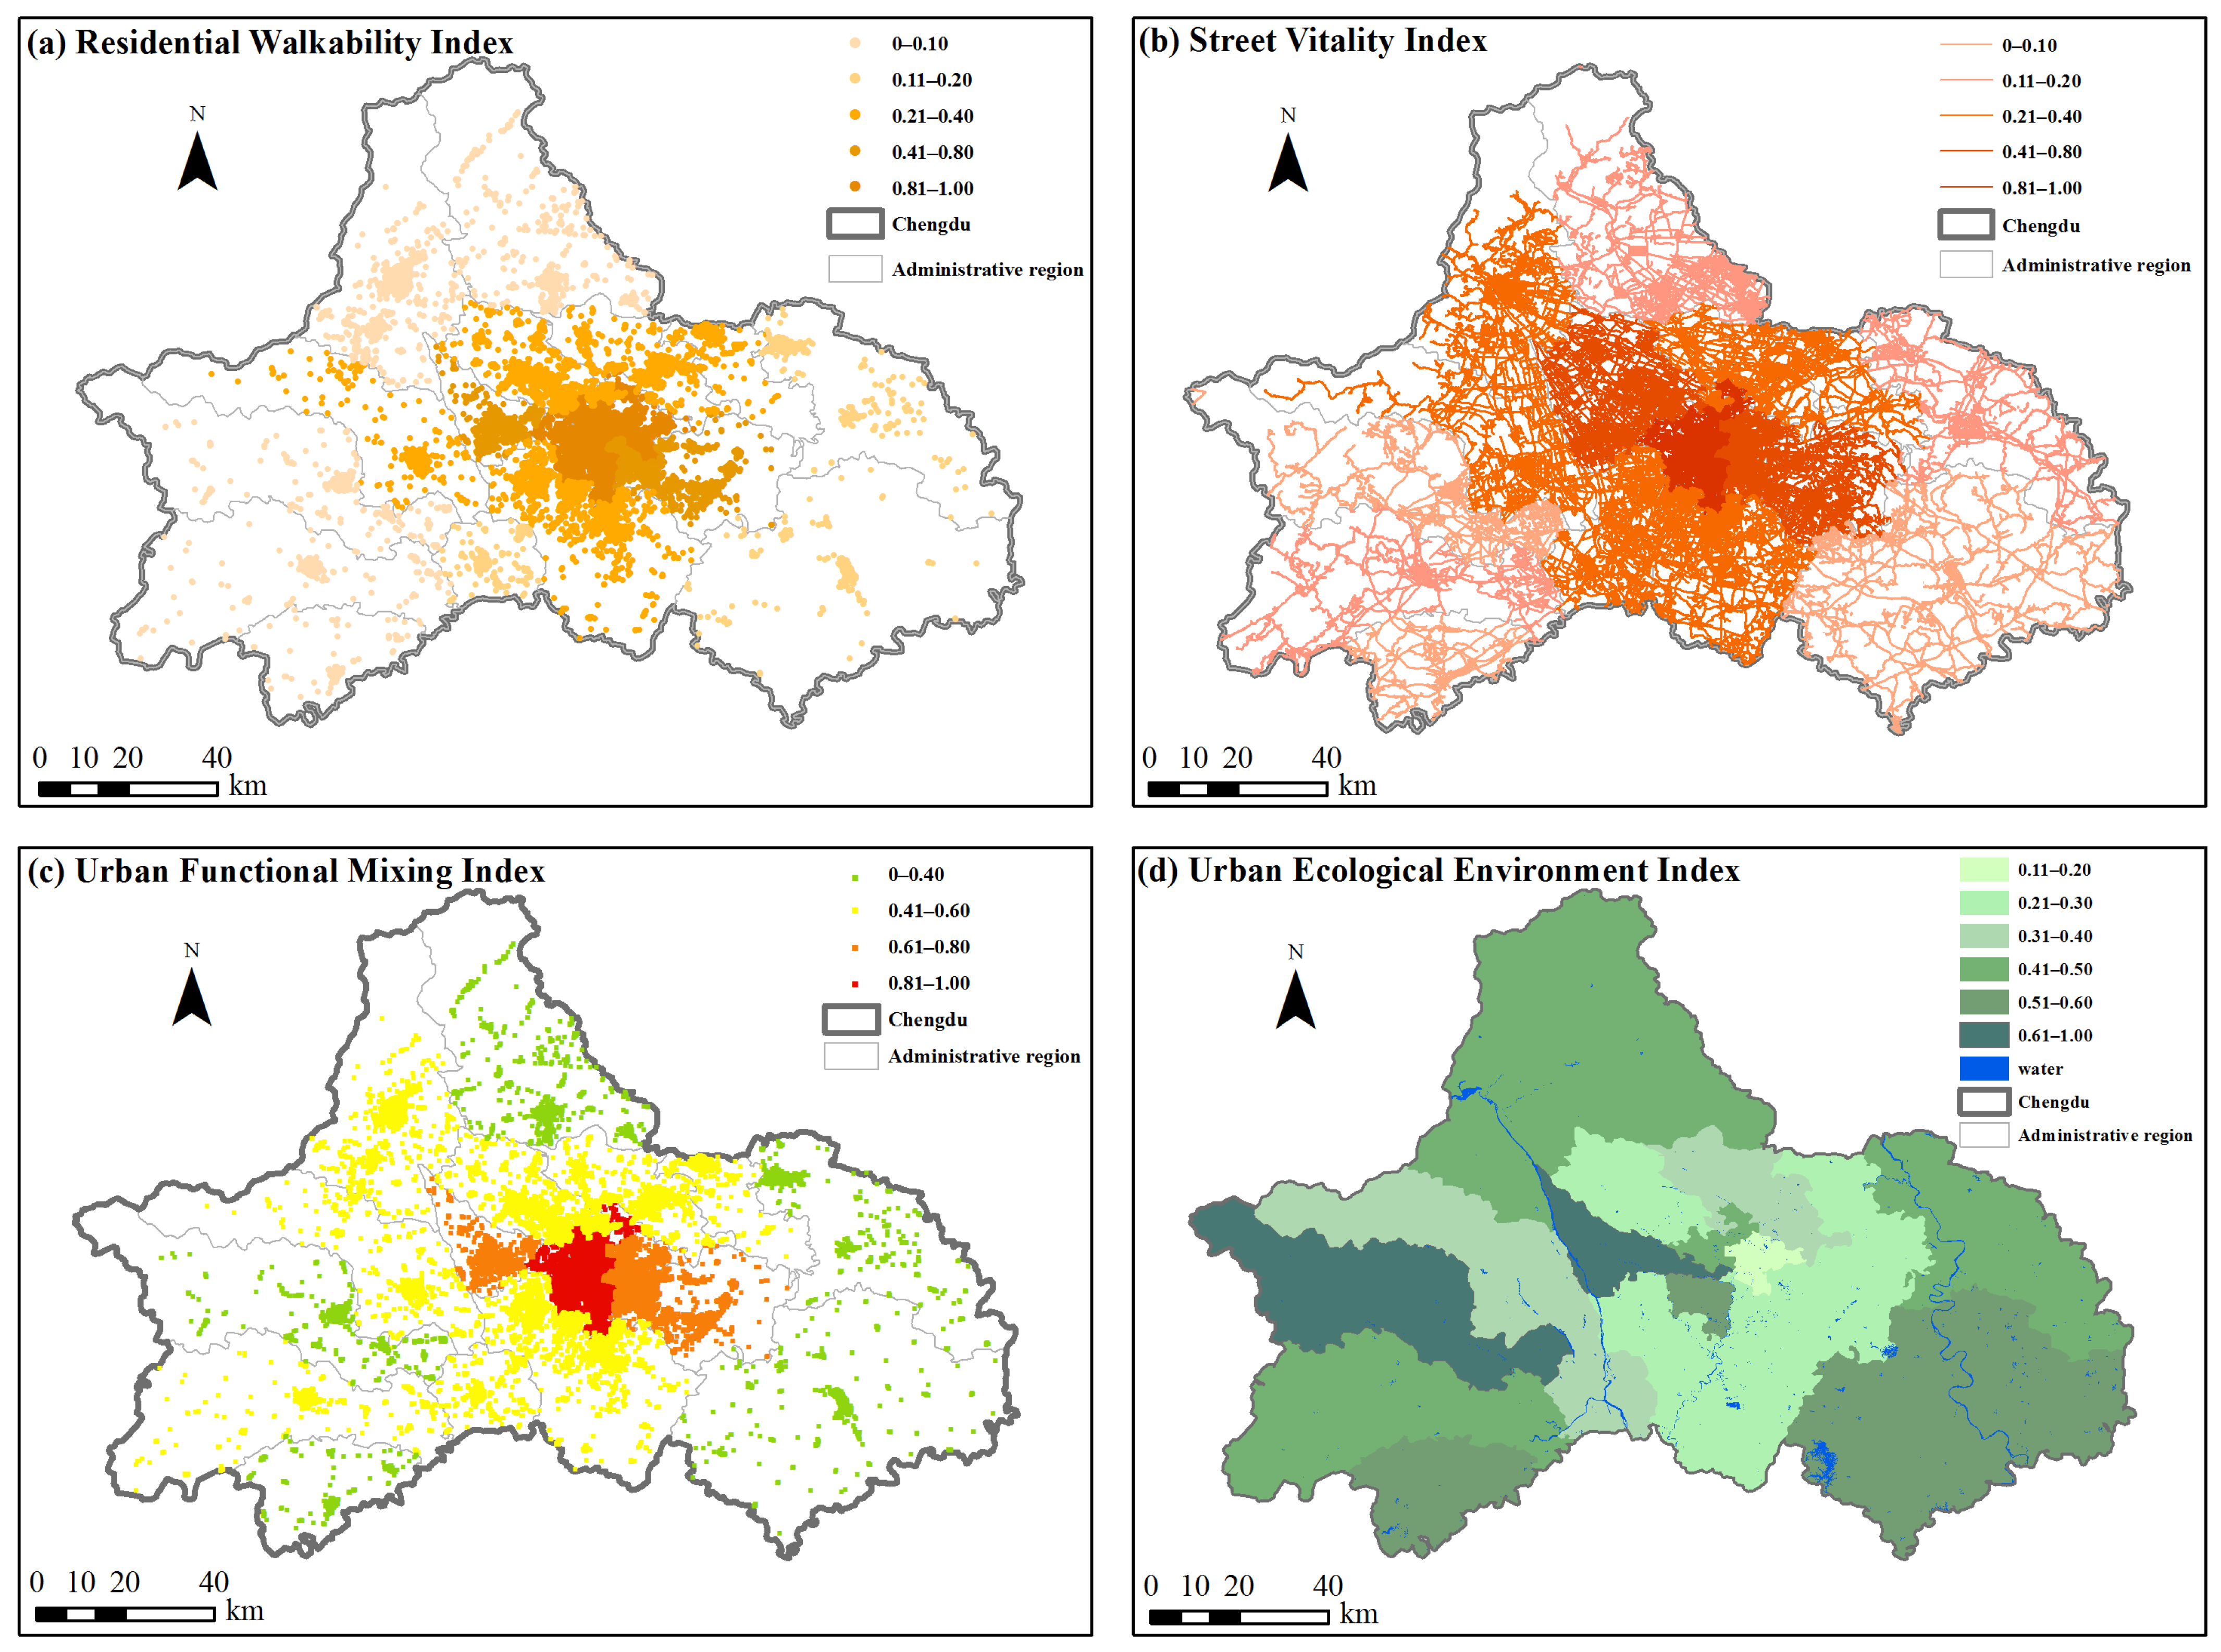
Residential districts in the center of Chengdu have a higher walkability score than those on the outskirts. Figure 4a illustrates the development of the walkability index for the entire residential area as a circular pattern that disperses from the center to the edges. The street vitality index in the first ring Road of Chengdu is the highest, the second ring begins to weaken, and the third ring is generally lower. The overall street vitality is spatially uneven, showing a trend of higher status from north of Jinjiang to Pidu District, and lower status in the northwest and east, as shown in Figure 4b. The second ring road in Chengdu has the best index of urban functional mixing degree, and some areas between the second ring road and the third ring road also perform better, while most areas outside the third ring road have an index of urban functional mixing degree that is too single, as shown in Figure 4c. According to Figure 4d, Chengdu’s urban ecological environment index is low in the city center and gradually rises in the outlying areas. Overall, the three human activity indices showed a tendency of increasing in the center and progressively decreasing to the surroundings, but the sustainable urban ecological environment indices exhibited the inverse trend.
The Figure 5 shows the results of the examination of the indicators’ numerical status in each district and county of Chengdu. The distribution of residential walkability index, street vitality index, and urban functional mixing index can be divided into high value area and low value area. Areas with high values included Jinniu, Qingyang, and Wuhou districts. Low readings were recorded in the Xinjin District, Dayi County, Pujiang County, Chongzhou City, and Qionglai City areas. Through Figure 5 and combined with Figure 1, geographical location found that the high value area is dispersed throughout the central city; whether it be educational institutions, urban construction projects, medical and health care facilities, or cultural endeavors, they are all closely grouped together, and the population is dense, the traffic is accessible, the urban environment is rich, and the intensity of human activity is high. Low-value regions are scattered around the major urban area, and since they lack the population, infrastructure, and services necessary for rapid urban growth, they are unable to develop economically. As a result, the intensity of human activity in these places is relatively low. In addition, the distribution of the sustainable urban ecological environment index revealed that, in contrast to the city center, most of Chengdu is prioritized to have hills, forest land, and wetland, complex terrain, traffic inconvenient, corresponding service life and the scarcity of public facilities, unsustainable population necessary life services, making the ecological environment quality better; however, Wuhou District and Qingyang District, which are the center of Chengdu, have the worst ecological environment quality.

5.2. Analysis of Regression Results

Consider the sustainable urban ecological environment index as the goal vector Y and the human activity index data as the feature vector X. According to the street scale, the average value of each index in the street is extracted, and the following conclusions are obtained by combining with the machine learning regression model. The final regression results are produced, as shown in Table 5, and the generalization error of the model is decreased by modifying the dataset’s parameters. According to the overall study, the four models all perform similarly on this dataset and produce solid regression results. For R2, mean absolute error (MAE), and root mean square error (RMSE) performance on all datasets, XGB outperformed the other three models, but the findings of PLR are somewhat better than those of the other three models in terms of mean square error (MSE) performance. Therefore, the best model for regression on this dataset is XGB, followed by PLR.
It can be seen from the polynomial regression coefficient that, as shown in Equation (20), the negative correlation feature with the strongest impact on the sustainable urban ecological environment is x1x3, and its regression coefficient is −3.9818; the strongest positive correlation feature is x12, and its regression coefficient is 4.2868. In addition, the characteristic variables that play a negative role in the sustainable urban ecological environment index are x1x3, x1, x3, x22, and x1x2; the characteristic variables that play a positive role are x12, x2x3, x32, and x2, (x1 is the street vitality index, x2 is the urban function mixing index, x3 is the walkability measure index of residential area).
y = 4.2878 x 1 2 0.8127 x 2 2 + 0.6537 x 3 2 0.0823 x 1 x 2 3.9878 x 1 x 3 + 2.3846 x 2 x 3 1.6432 x 1 + 0.1910 x 2 0.9194 x 3 + 0.7050
When a feature has a significant impact on the outcome of the data after being randomly added to with noise, this indicates that the feature’s relevance is high; otherwise, it indicates that it is low. The residential walkability measure index, which is 0.5136, is the most significant component of the RFR, while the street vitality index, which is just 0.2143, is the least significant. The walkability measure index of residential areas, which is 0.5668, is likewise the most significant characteristic in XGB. As indicated in Table 6, there is not much of a difference between the street vitality index and the urban function mixing index. Thus, the correlation between the street vitality index, the urban function mixing index, and the sustainable urban ecological environment index is stronger; the correlation between the sustainable urban ecological environment index and the walkability index of residential areas is even worse in the regression analysis of the sustainable urban ecological environment index and various indicators of human activities.
According to the distribution of standardized residuals (Std), they are represented by “poor” (Std > 2.5∪Std < −2.5), “general” (2.5 > Std > 1.5∪−1.5 < Std < −2.5), “good” (1.5 > Std > 0.5∪−0.5 < Std < −1.5), and “excellent” (0.5 > Std > −0.5), respectively. As shown in Table 7, it is found by counting the proportion of each residual level. PLR and XGB have the same proportion of excellent and good levels and are higher than RFR and SVR. RFR and XGB have a 4.2% higher ratio of good grades than PLR and SVR, and XGB has the highest ratio of good grades. Therefore, the prediction results of XGB and PLR are better than RFR and SVR.
The four models can better predict the distribution of the sustainable urban ecological environment; that is, the central urban area increases from low to the surrounding rings. However, in places where human activities are less impacted, the sustainable urban ecological environment would be disrupted by other variables, leading to poor forecast accuracy, while the prediction accuracy is better in areas with heavy human activities.

6. Conclusions and Recommendations

6.1. Conclusions

This paper takes Chengdu, Sichuan Province, China, as the research area, makes full use of the multi-source data ubiquitous on the Internet, establishes an index system to obtain the sustainable urban ecological environment index and the index data affecting human activities, and then uses a variety of machine learning models to carry out regression analysis on the two.
(1)
In general, the three indicators of human activity all show a trend of being high in the center and gradually decreasing in the surrounding areas, while the indicators of urban ecological environment show the opposite trend, influenced by population distribution, resource allocation, and topographical factors;
(2)
By comparing the results of the four regression models in this dataset, XGB outperforms the other models;
(3)
By comparing the characteristic importance of each index to the sustainable urban ecological environment in the regression analysis, it is found that the correlation between the street vitality index and the urban function mixture index and the sustainable urban ecological environment is stronger, and the correlation between the walkability measure index of the residential area and the sustainable urban ecological environment is poor.

6.2. Recommendations

(1)
Due to the limited data selected at the present stage of this paper, future research can analyze the cross-time scale changes of ecological environment in Chengdu;
(2)
The change of urban ecological environment is not only the result of human activities, so it should be analyzed together with other factors such as climate, culture, and economy in the future research.
With the continuous development of sensors, the acquisition of data is more diverse and detailed. Strengthening the management and control of human activities can help improve the quality of the sustainable urban ecological environment, and then better serve the protection of the sustainable urban ecological environment. In order to give a more scientific reference and foundation for the better development of the sustainable urban ecological environment, future research will combine the study of the sustainable urban ecological environment with data from several sources that have temporal and geographical dimensions.

Author Contributions

Conceptualization, J.Z. and L.L.; methodology, J.Z.; software, L.L.; validation, Y.W. and K.T.; formal analysis, J.Z.; investigation, L.L.; resources, Y.Z.; data curation, J.Z.; writing—original draft preparation, J.Z.; writing—review and editing, Y.W.; visualization, L.L.; supervision, Y.Z.; project administration, K.T.; funding acquisition, J.Z. and M.H. All authors have read and agreed to the published version of the manuscript.

Funding

This research was funded by the Sichuan Province Natural Science Foundation of China grant number 2022NSFSC1123 and the Key research base of Social Sciences in Sichuan Province, Tuojiang River Basin High-quality Development Research Center Project grant number TJGZL2022-23.

Institutional Review Board Statement

Not applicable.

Informed Consent Statement

Not applicable.

Data Availability Statement

The data used to support the findings of this study are available from the corresponding author upon request.

Acknowledgments

This study was supported by the Sichuan Province Natural Science Foundation of China (2022NSFSC1123) and the Key research base of Social Sciences in Sichuan Province—Tuojiang River Basin High-quality Development Research Center Project (TJGZL2022-23). The funders had no role in study design, data collection and analysis, decision to publish, or preparation of the manuscript.

Conflicts of Interest

The authors of this study declare that they have no conflict of interest.

References

  1. World Observatory. Transforming Cities—For People and the Planet; World Observatory: Beijing, China, 2002. [Google Scholar]
  2. United Nations Commission on Environment and Development. Our Common Future; United Nations Commission on Environment and Development: Nairobi, Kenya, 1987. [Google Scholar]
  3. Burgess, E.W. The Growth of the City: An introduction to a Research Project. Urban Ecol. 1925, 18, 85–97. [Google Scholar]
  4. Clark, C. The Condition of Economic Progress; Macmillan: London, UK, 1940. [Google Scholar]
  5. Gill, A.M. Enhancing social interaction in New Resource Towns: Planning Perspectives. J. Econ. Soc. Geogr. 1990, 81, 348–363. [Google Scholar] [CrossRef]
  6. Innis Harold, A. The Cod Fisheries: The History of an International Economy; Yale University Press: New Haven, CT, USA, 1940; University of Toronto Press: Toronto, ON, Canada, 1954. [Google Scholar]
  7. Ronbinson, I.M. Nuriel Driver Memorial Lecture. 1981: The mists of time. Can. J. Occup. Ther. 1962, 48, 145–152. [Google Scholar] [CrossRef] [PubMed]
  8. Warren, R.L. The Community in America; Rand Mc Nally College Publishing: Chicago, IL, USA, 1963. [Google Scholar]
  9. Bradbury, J.H. Towards an Alternative Theory of Resource Based Town Development in Canada. Econ. Geogr. 1979, 55, 147–166. [Google Scholar] [CrossRef]
  10. O’Faircheallaigh, C. Economic base and Employment Structure 1957 in Northern Territory Mining Towns. CSIRO 1988, 29, 221–236. [Google Scholar]
  11. Mélanie, J.; Gleeson, T.; Rogers, N.; Stark, C. The Energetic North: Developmet Gains and Growing Pains, Cairns, Queensland. Australian Agricultural and Resource Economics Society. Aust. Commod. 2009, 16, 11–13. [Google Scholar]
  12. Deng, M. Spatio-temporal Analysis Methods for Multi-modal Geographic Big Data. J. Geo-Inf. Sci. 2020, 22, 41–56. [Google Scholar]
  13. Liu, Y.; Zhan, Z.; Zhu, D.; Chai, Y.; Ma, X.; Wu, L. Incorporating Multi-source Big Geo-data to Sense Spatial Heterogeneity Patterns in an Urban Space. Geomat. Inf. Sci. Wuhan Univ. 2018, 43, 327–335. [Google Scholar]
  14. Liu, Y.; Yao, X.; Gong, Y. Analytical Methods and Applications of Spatial Interactions in The Era of Big Data. Acta Geogr. Sin. 2020, 75, 1523–1538. [Google Scholar]
  15. Yue, W.Z.; Zhang, J.M.; Liu, Y.; Zhang, W. Measuring Urban Development Intensity Based on The Integration of Multi-Source Spatial Data. Acta Ecol. Sin. 2019, 39, 7914–7926. (In Chinese) [Google Scholar]
  16. Hai, X.; Liu, Y.; Zhao, P.; Zhang, H. Using Mobile Phone Data to Estimate the Temporal-Spatial Distribution and Socioeconomic Attributes of Population in Megacities: A Case Study of Beijing. Acta Sci. Nat. Univ. Pekin. 2020, 56, 518–530. (In Chinese) [Google Scholar]
  17. Gu, Y.; Jiao, L.; Dong, T.; Wang, Y.; Xu, G. Spatial Distribution and Interaction Analysis of Urban Functional Areas Based on Multi-source Data. Geomat. Inf. Sci. Wuhan Univ. 2018, 43, 1113–1121. (In Chinese) [Google Scholar]
  18. Zhao, P.; Cao, Y. Identifying Metro Trip Purpose Using Multi-source Geographic Big Data and Machine Learning Approach. J. Geo-Inf. Sci. 2020, 22, 1753–1765. (In Chinese) [Google Scholar]
  19. Hu, L.; He, S.; Han, Z.; Xiao, H.; Su, S.; Weng, M.; Cai, Z. Monitoring Housing Rental Prices Based on Social Media: An Integrated Approach of Machine Learning Algorithms and Hedonic Modeling to Inform Equitable Housing Policies. Land Use Policy 2019, 82, 657–673. [Google Scholar] [CrossRef]
  20. Li, Z.; He, Z.; Zhang, Y.; Jin, S.; Wang, X.; Zhu, J.; Liu, S. Impact of Greenspace Exposure on Residents’ Mental Health: A Case Study of Nanjing City. Prog. Geogr. 2020, 39, 779–791. (In Chinese) [Google Scholar] [CrossRef]
  21. Weng, M.; Li, L.; Su, S. Spatial Data Analysis Case-Based Experimental Tutorial; Science Press: Beijing, China, 2019. [Google Scholar]
  22. Ministry of Housing and Urban-Rural Development of the People’s Republic of China. GB50180-2018 Standards for Planning and Design of Urban Residential Areas; Ministry of Housing and Urban-Rural Development of the People’s Republic of China: Beijing, China, 2018. (In Chinese) [Google Scholar]
  23. Cheng, P.G.; Chen, Y.; Zhu, X.Y. Evaluation of Urban Ecological Environment and Its Relationship with Human Activities Based on Multi-Source Data; Geomatics and Information Science of Wuhan University: Wuhan, China, 2021. [Google Scholar] [CrossRef]
  24. Miaoyi, L.I.; Yan, M.A.; Sun, X.; Wang, J.; Dang, A. Application of Spatial and Temporal Entropy Based on Multi-source Data for Measuring the Mix Degree of Urban Functions. City Plan. Rev. 2018, 42, 97–103. (In Chinese) [Google Scholar]
  25. Xu, H. A Remote Sensing Urban Ecological Index and Its Application. Acta Ecol. Sin. 2013, 33, 7853–7862. (In Chinese) [Google Scholar]
  26. Chander, G.; Markham, B.L.; Helder, D.L. Summary of current radiometric calibration coefficients for Landsat MSS, TM, ETM+, and EO-1 ALIsensors. Remote Sens. Environ. 2009, 113, 893–903. [Google Scholar] [CrossRef]
  27. NASA. Landsat 7 Science Data Users Handbook. 2014. Available online: http://landsathandbook.gsfc.nasa.gov (accessed on 1 October 2022).
  28. Nichol, J. Remote sensing of urban heat islands by day and night. Photogramm. Eng. Remote Sens. 2005, 71, 613–621. [Google Scholar] [CrossRef]
  29. Breiman, L. Random Forests. Mach. Learn. 2001, 45, 5–32. [Google Scholar] [CrossRef] [Green Version]
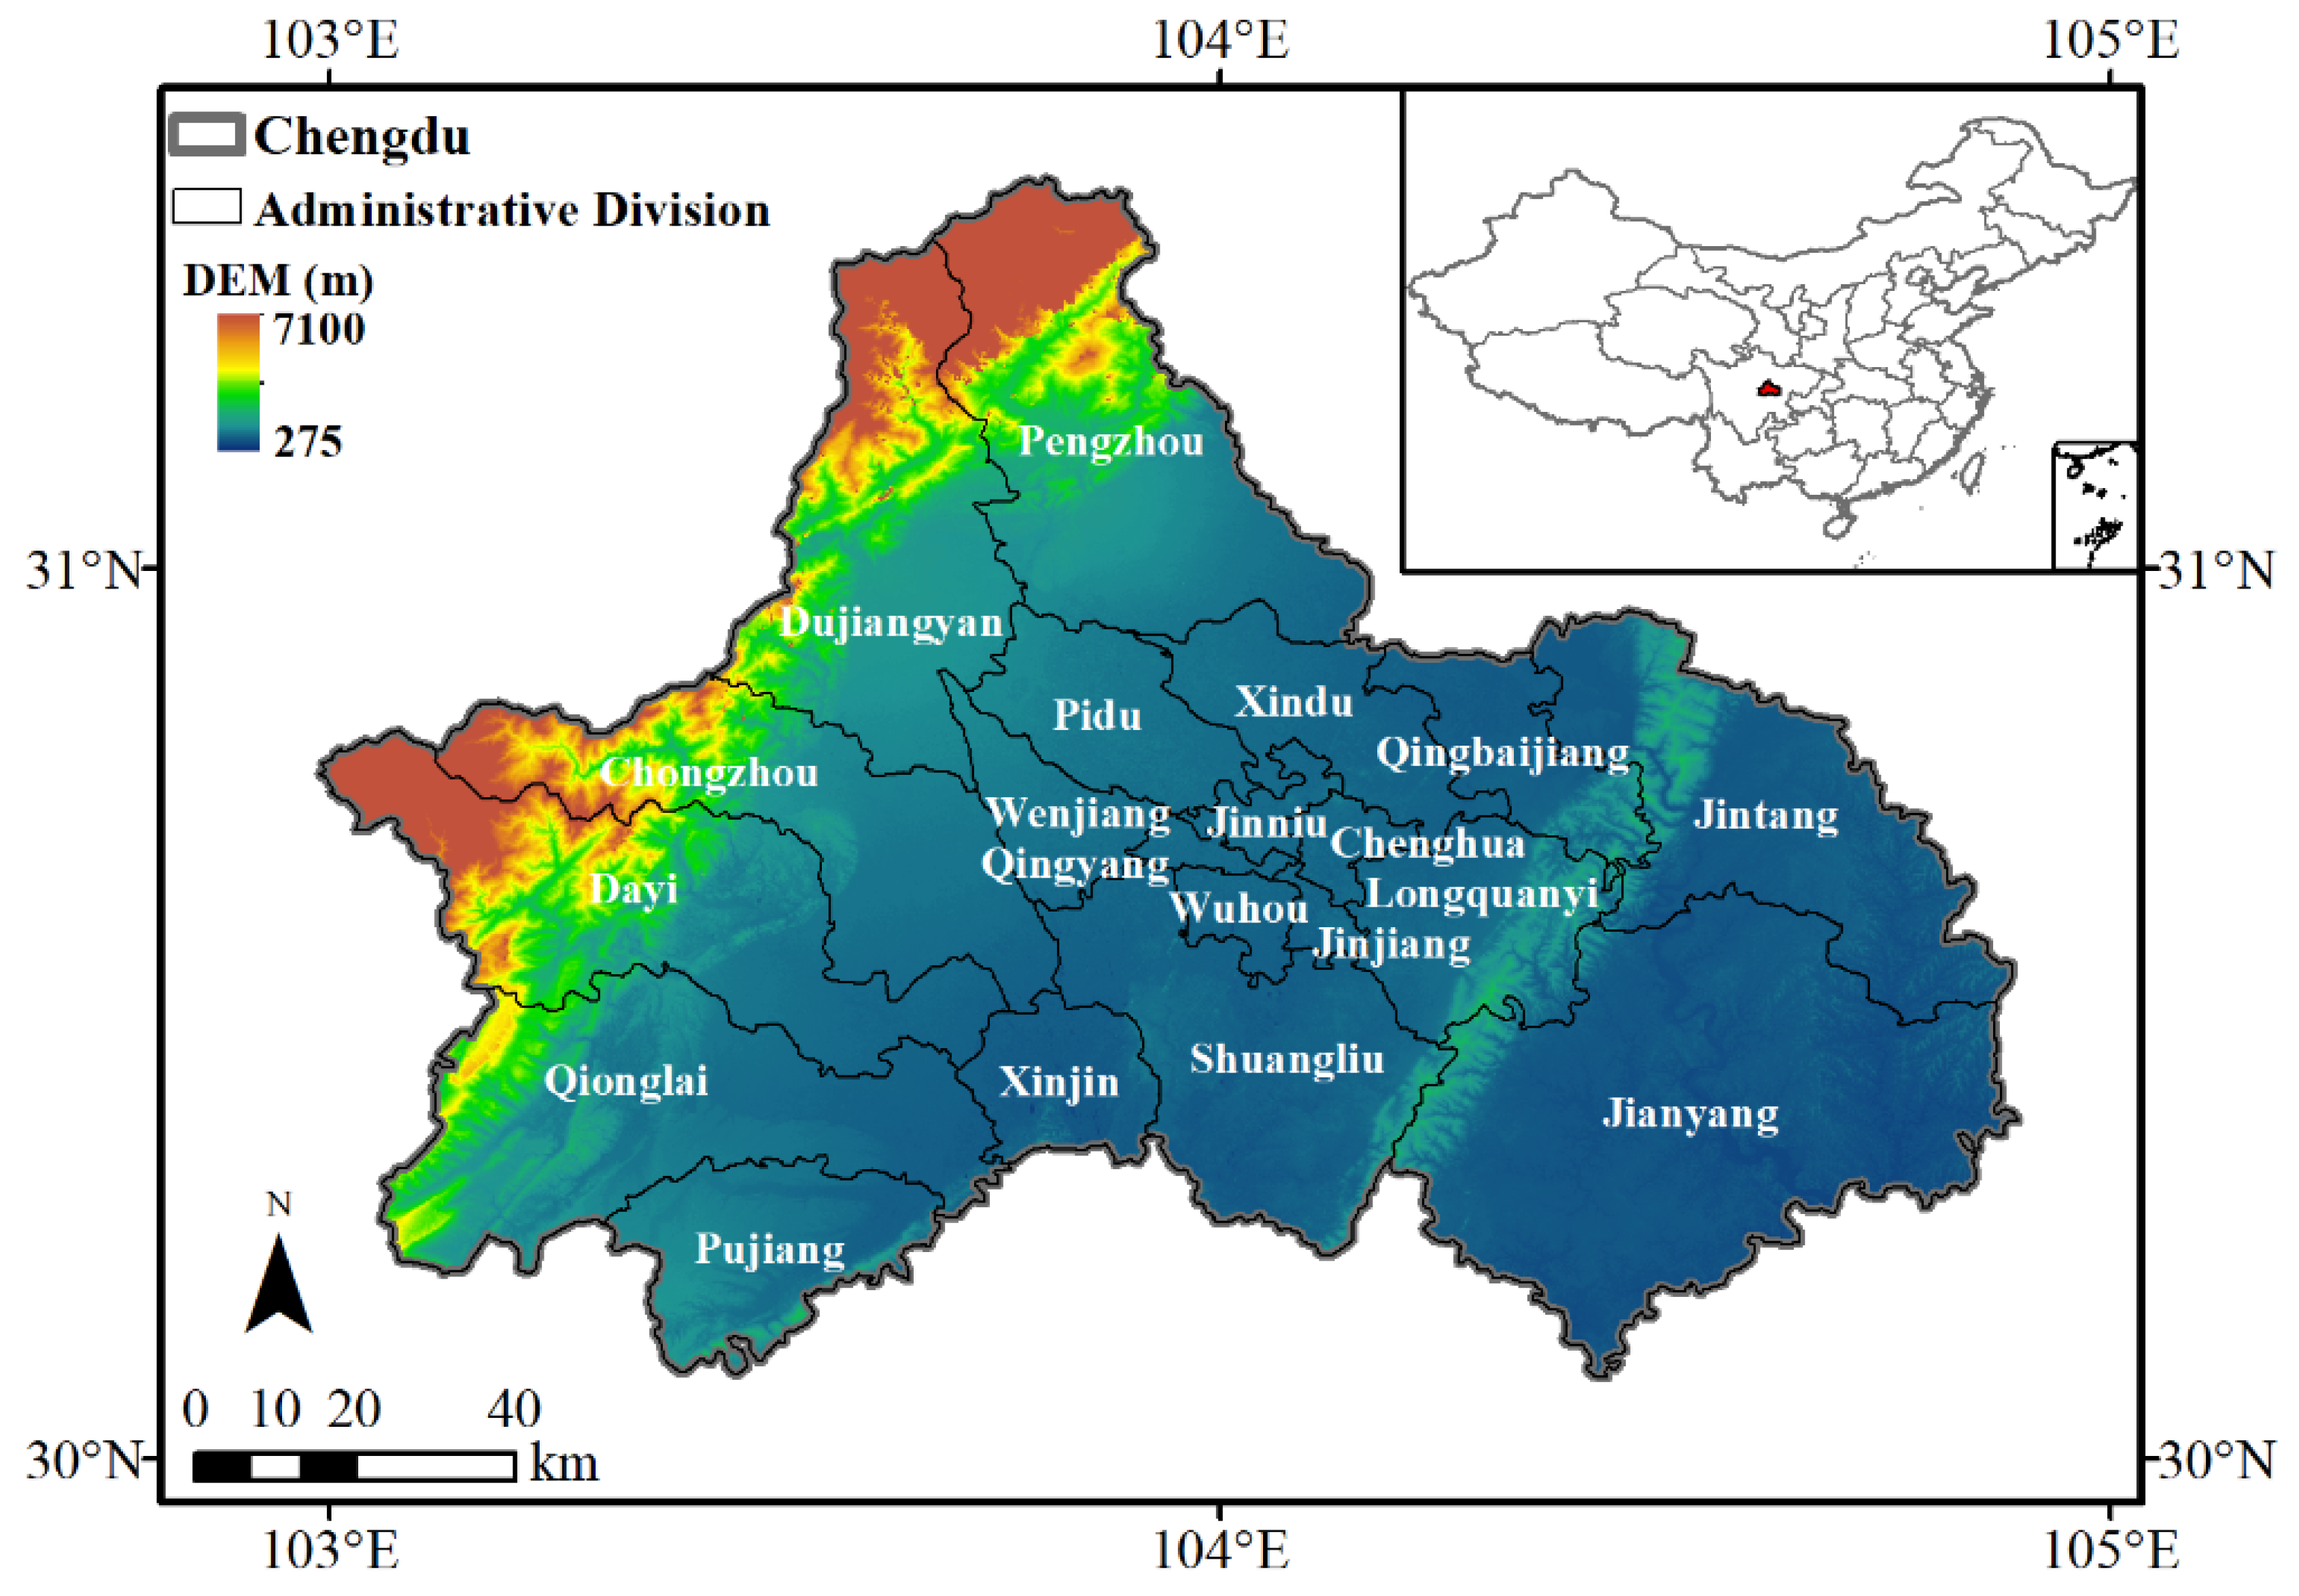
Figure 1. The research area of Chengdu, Sichuan Province, China.
Sustainability 15 04340 g001
Figure 2. The POI of different indicators.
Sustainability 15 04340 g002
Figure 3. The residential area data and road network data.
Sustainability 15 04340 g003
Figure 4. Distribution of each index in Chengdu.
Sustainability 15 04340 g004
Figure 5. Index values of each district and county in Chengdu.
Sustainability 15 04340 g005
Table 1. Table of supporting facilities around the residential area.
First-Level IndicatorsSecondary IndicatorsThree-Level Indicators
Public Administration and Public Service FacilitiesEducation and TrainingMiddle School, Elementary School, Kindergarten
Medical and Health FacilitiesHospitals, Pharmacies
Sports FacilitiesFitness Centers, Sports Venues
Government agenciesPublic Procuratorate and Law Institutions
Business Services FacilitiesShopping PlacesShopping Malls, Vegetable Markets, Supermarkets, Shops
GourmetCatering Facilities
FinanceBank, ATM, Postal Service
Communication Business HallsTelecom, China Mobile, and China Unicom Business Outlets
Municipal UtilitiesPublic Transport FacilitiesParking Areas
Tourist AttractionsPublic Parks
Transportation Stations and Community Service Public Transport FacilitiesRail Transit Stations, Bus Stops
Convenience Service FacilitiesShopsConvenience Stores
Living Servicelogistics Companies, Post Offices
Leisure and EntertainmentCinemas, Dance Halls, Internet Cafes, Game Venues, Leisure Squares
Table 2. Distance Attenuation Rules.
Arrival Distance (km)The Law of Distance DecayRemark
0–0.4y = 1No attenuation
0.4–1.6y = −1153.6558x3 + 419.4604x2 − 395.9706x + 201.1086When at 1.6 km, it quickly decays to 12%
1.6–2.4y = −92.8x3 + 566.6x2 − 1153.1x + 786.6Attenuation is 0 when reaching 2.4 km
>2.4 0Facilities beyond 2.4 km have no influence on attenuation
Note that, despite being a piecewise function, the distance decay function is continuous at the piecewise point.
Table 3. Walking index attenuation ratio of road intersection density and block length.
Intersection Density (Units/km2)Attenuation Rate (%)Block Length (100 m)Attenuation Rate (%)
≥2000Less than or equal 1200
150–2001120–1501
120–1502150–1652
90–1203165–1803
60–904180–1954
<605More than 1955
Table 4. Street vitality index evaluation index.
First-Level IndicatorsSecondary IndicatorsRemark
Space Syntax StructureConnectivity
Control ValuesAssisted by computer software for quantitative analysis
the Global Depth
POI Mixing DegreePOI Points DensityDensity of POI points on both sides of the street
Total POI PointsThe number of POI points on either side of the street
Properties of the streets themselvesLengthThe length of the streets themselves
Connection Points DensityDensity of the number of road intersections in a certain range
Number of bus stopsNumber of bus stops on both sides of a street
Number of subway stationsNumber of subway stops on both sides of a street
Table 5. Index evaluation of each regression model.
Regression ModelsTraining Set R2Testing Set R2All Datasets R2MSEMAERMSE
PLR~~0.6900 0.0090 0.0722 0.0925
RFR0.7012 0.6966 0.6777 0.0091 0.0738 0.0965
XGB0.7527 0.6828 0.7474 0.0092 0.0650 0.0845
SVR0.6670 0.6640 0.6742 0.0091 0.0740 0.0950
“~”: no data display.
Table 6. The feature importance of each regression model.
Regression ModelsFeature Importance
Street Vitality IndexUrban Function Mixing IndexWalkability Index of Residential Areas
RFR0.21430.4820.5136
XGB0.33210.31110.5668
SVR~~~
“~”: No data display.
Table 7. Residual grade statistics of prediction results of each model.
Machine Learning ModelsResidual Level
PoorGeneralGoodExcellent
PLR0.90%10.90%44.10%44.10%
RFR0.00%12.40%39.30%48.30%
XGB0.90%2.50%48.30%48.30%
SVR0.00%14.60%41.30%44.10%
Disclaimer/Publisher’s Note: The statements, opinions and data contained in all publications are solely those of the individual author(s) and contributor(s) and not of MDPI and/or the editor(s). MDPI and/or the editor(s) disclaim responsibility for any injury to people or property resulting from any ideas, methods, instructions or products referred to in the content.