Article

Measuring the Soundscape Quality in Urban Spaces: A Case Study of Historic Urban Area

1
Department of Human Geography, University of Tehran, Tehran 1417853933, Iran
2
Department of Urban Design, Faculty of Architecture and Urban Planning, University of Art, Tehran 1136813518, Iran
*
Author to whom correspondence should be addressed.
Sustainability 2023, 15(5), 4255; https://doi.org/10.3390/su15054255
Submission received: 31 December 2022 / Revised: 1 February 2023 / Accepted: 7 February 2023 / Published: 27 February 2023
(This article belongs to the Section Sustainable Urban and Rural Development)

Abstract

:
The goals of a good soundscape are to create a sense of place, provide comfort to the users, and encourage intractability in a public space. At the same time, many public areas in cities are having problems due to the weakness in creating the opportunity for people to attend. Therefore, knowing the importance of the subject, this study has measured the aspects of the sonic environment and investigated its effect on the attendance of 15 Khordad Street, District 12, Tehran. The results of this study showed that attendance in urban spaces based on the aspects of the sonic environment focuses on the quality of the surrounding environment as a source of sound. By assessing the perceptual and sensory aspects of sounds in the environment, it is possible to understand the effects of sound on the behaviors, activities, and overall pleasantness of the space for the users. Based on the three statistical communities related to the study, among the key findings, we show that the majority of attendance to the case area was for the purpose of studying, shopping, and work, and despite the fact that this case study is a historic area, people are less willing to attend it. This street, part of which is designed as a pedestrian area, encourages individualism, and not bringing friends and family along is reinforced by unpleasant psychological effects. Since nowadays the problems of the sonic environment are expanding in cities, and noise pollution in some parts of Tehran is considered a major environmental problem, the findings of this study have taken a step to increase urban sustainability and try to improve the main criteria and results, which were to rationally evaluate the existing situation of attendance in urban spaces affected by the qualities of the sonic environment, to promote the policy and strategic city planning for city managers.

1. Introduction

The ever-increasing pace of urban life and rapid developments in urban population growth trends, along with poor urban planning and management, have led to the rise in formidable challenges to the public health of the urban public, especially in developing countries [1,2,3,4]. Still, changes on a global scale are more rapid and alarming, with significant impacts on human health during the past century [5]. This process continues in the present century so it is predicted that by 2050 almost 68% of the world’s population will live in cities [6]. With continued growth and redevelopment within cities, urban planners are now responsible for designing cities that enhance the quality of the sonic environment [7,8,9].
The sonic environment, including acoustic ecology and diversity, has been neglected in urban design and planning [10,11,12]. The qualitative aspects of sound are considered critical factors for healthy cities [13,14]. Many reports have stated that due to rapid urbanization and industrialization, noise pollution has been gradually growing and adversely affects mental and physiological health [15,16,17]. Traffic and transport noise pollution in particular is a big environmental problem in cities that is not limited to a city; it is considered a larger problem affecting city lifestyle in modern environments [18,19,20].
High noise levels are harmful to people’s activities which need concentration. The International Organization for Standardization (ISO) defines noise as any acoustic phenomenon which is perceived as annoying and disturbing. The World Health Organization (WHO) has a standard of 70, 50, and 35 decibels (dB) for residential areas and hospital rooms in the daytime [21]. Meanwhile, the range of 60 to 91 dB has been recorded in the studied area in District 12 of Tehran, 15 Khordad Street. The growth in population, the increase in motor vehicles, production workshops, and commercial land uses are among the factors that cause unpleasant sounds and noise pollution in this area.
This study focuses on the importance of urban soundscape components which influence the rate of people’s attendance, their experience, and satisfying users in a public open space (POS). Then, this study helps to optimize the soundscape for city sustainability. This is followed by an applied study of 15 Khordad Street, a part of the noisiest district in Tehran, and the data are collected through a questionnaire of three groups of users in the study area, regarding the development for satisfying dimensions. Finally, this paper suggests some recommendations for developing user satisfaction with urban open spaces based on the soundscape and its application in urban design and planning.

2. Literature Review

The diverse bodies of soundscapes literature have been reviewed in this study to define the indicators of people’s attendance in a POS. According to the soundscape definition by the International Organization for Standardization [22,23], the soundscape cannot be restricted to acoustical determinations only [24]. The cultural significance, sense of place, connecting humans to nature, interactions with landscape perceptions [25], the social context [26], visual context [27], and individual differences [28] need to be included as indicators described in the soundscape context.

2.1. Sonic Environment and Urban Soundscape

Soundscapes are defined as “any acoustic field of study” including the acoustic elements of the actual environments or more abstract environments such as musical compositions [29]-p7. Several studies assessed environmental noise as a potential health concern that detracts from human well-being and other values [30,31]. Some organizations such as the World Health Organization [13] and European Environment Agency [32] have warned about the effects of noise, such as hearing loss and metabolic effects. Other studies identified evidence of links between the quality of the sonic environment and sleep disturbance, heart disease, and biological mechanisms related to cardiovascular, mental illness, hypertension, and health in vulnerable groups [14,33]. There is some strong evidence that human health and well-being are impaired when exposed to degraded soundscapes [21,34]. It is important to note that most studies have been on the effects of noise, but not focused on people’s attendance in a POS and raising issues of rights to access a healthy acoustic environment.
A sonic environment is based on a mixture of diverse sounds such as anthrophony, biophony, and geophony [35]. Anthrophony or human-generated sounds include motorized transportation, such as sounds from industrial and domestic machines, air travel and road noise due to friction, the sounding of bells, sirens, alarms, and human voices. Sometimes, these sounds are subjectively deemed noise by a listener [25]. Biophony includes the sounds produced by non-human living organisms such as insects, amphibians, frogs, birds, and other animals [36,37,38] and geophony is related to weather changes and climatic conditions such as waves, earthquakes, lightning, rain, and wind [39]. The phonic identity is considered a significant part of urban areas [11] that depends on the characteristics of the sonic environment furnishing, material, space, and shape. Therefore, sounds are an essential part of cities to create a sense of place [40,41]. The literature review has highlighted the noise impact, such as evaluating the impact of the sounds of human activities, testing the soundscape effect on walkability, human health, and sense of place variables [18,42], and examining the sound quality in an urban space [43,44].

2.2. Social Interaction and People Attendance in POS

In urban studies, the presence of people, walking, and the livability of a POS bring life to the streets, so lively streets contribute to the growth in public life and a safer urban environment [45]. There are three distinct groups of human activities in public spaces including social, optional, and necessary, and two types of activity (socially interactive and solitary) that are important to the quality of the city [46]. The successful urban space may promote many social activities, and favorite options could increase opportunities to participate in communal activity, so people spend more time in the space [47]. As these experiences are repeated, POSs become vessels to carry positive communal meanings.
Neighborhood attendance promotes walking and is considered a key concept for sustainable urban development, regardless of the inhabitants’ demographic variables such as age group and gender [48,49].
A growing body of literature has been found on the association study of particular variables with attendance in urban spaces. Some research illustrates the positive effects of green spaces and the naturalness of the built environment on the satisfaction of stakeholders in urban spaces. In the natural areas of cities, plazas, markets, parks, and waterfronts, people from different cultural groups can come together in a supportive context of mutual enjoyment [50,51]. Other researchers have stated that these criteria are related to urban space attendance and POS pleasantness along with built environments, social conditions, and individual reactions: calmness and convenience, social presence, spending leisure time, the number of people present in a POS for desirable activity, interactions and social relations, and social convergence or divergence are among the activities that encourage attendance and create identity [52,53,54].

2.3. People Attendance Based on the Sonic Environment

Landscape effects including functional and aesthetic aspects have been revealed to be in close relationship with the soundscape experience [55]. The integration of aesthetic and sociological aspects of the sonic environment is a main aim of the urban soundscape concept [11]. There is also a lack of studies examining the behavioral responses to soundscapes in a specific environment, such as urban commercial zones (Bazar). The sonic environment affects the pleasantness of a public space even when the participants in the experiment focused on visual designs and were kept unaware of the sound [56]. The other key objectives of the urban soundscape concept are those such as familiarity with what is heard, level of social interaction, and frequency of use of the public space [46]. The physical characteristics of the auditory landscape can vary strongly from aspects of behavioral patterns and perception, and it needs frequent testing to substantiate the relationship between specific soundscape features [57].
The main objective includes providing the listener with a sense of place that plays an important inspiration role and needs paying attention to the component of the sonic environment such as attractive and repulsive sounds, sound path orientation, dominant ambient sound, rich, and saturated feelings based on the sonic environment. Controlling noise and decreasing the feeling of confusion in the space are the other objectives [58,59,60,61]. Additionally, how humans perceive environmental quality based on soundscapes raises important resource considerations [25].
Sonic environments have a relationship with the attendance level [35]. Calleri et al. [62] found that the soundscape affects the perceived social presence. Noise effects that represent intrusions into the desired recreation experiences of people have a negative impact on the degree to which user enjoyment is achieved.
Figure 1 shows the indicators and variables affecting the quality of the sonic environment. Considering the above, this study mainly focuses on studying a practical unanswered problem such as understanding the association between the soundscape and people attendance in a POS. Therefore, the soundscape approach, which considers environmental sound as a resource, can be most effective when applied in the urban planning and design process.

3. Methodology

3.1. Method

Based on the literature review, the indicators and variables have been extracted. These indicators and variables are shown in Figure 1. Based on these variables, we adjusted our questions. In order to collect the data, a structured questionnaire was used. Questionnaire distribution was performed in specific points and by cluster sampling method between 9:00 a.m. and 5:00 p.m. In this study, three groups of space users were included as participants in the research: a. merchants and tradesmen, itinerant sellers, and peddlers: due to their constant presence in the space, they have complete information with the auditory and visual environment; b. citizens and residents of 15 Khordad Street are regular customers, and because of their presence in this area, they are more familiar with the audio and visual space and are influenced by it. Regular customers and buyers generally refer to this range frequently with the aim of using commercial spaces at different times and for major and minor purchases; and c. passersby and tourists: the historic area of central Tehran is visited by tourists both those who are first-time visitors (mostly foreign) and those who are returning (mostly domestic tourists and travelers). The sample size was estimated to be 96 people through Cochran’s formula [63] for unknown conditions and according to the conditions of COVID-19 with a probability of 90% confidence. Each of the three groups consisted of 96 people.
The validity of the questionnaire was conducted through content validity. The reliability of the questionnaire was measured by Cronbach’s alpha coefficient and its value was 0.761, which shows that the internal correlation between the variables is very high. To measure each of the variables in the questionnaire, a five-level Likert scale (from very low being equal to 1 to very high being equal to 5) was used. The collected data were analyzed through SPSS software. For the overall evaluation of the indicators and variables, the percentage of satisfaction, mean, and variance, and also for the relationships between the indicators and research variables, one-way analysis of variance (ANOVA) and regression were used.

3.2. Case Study

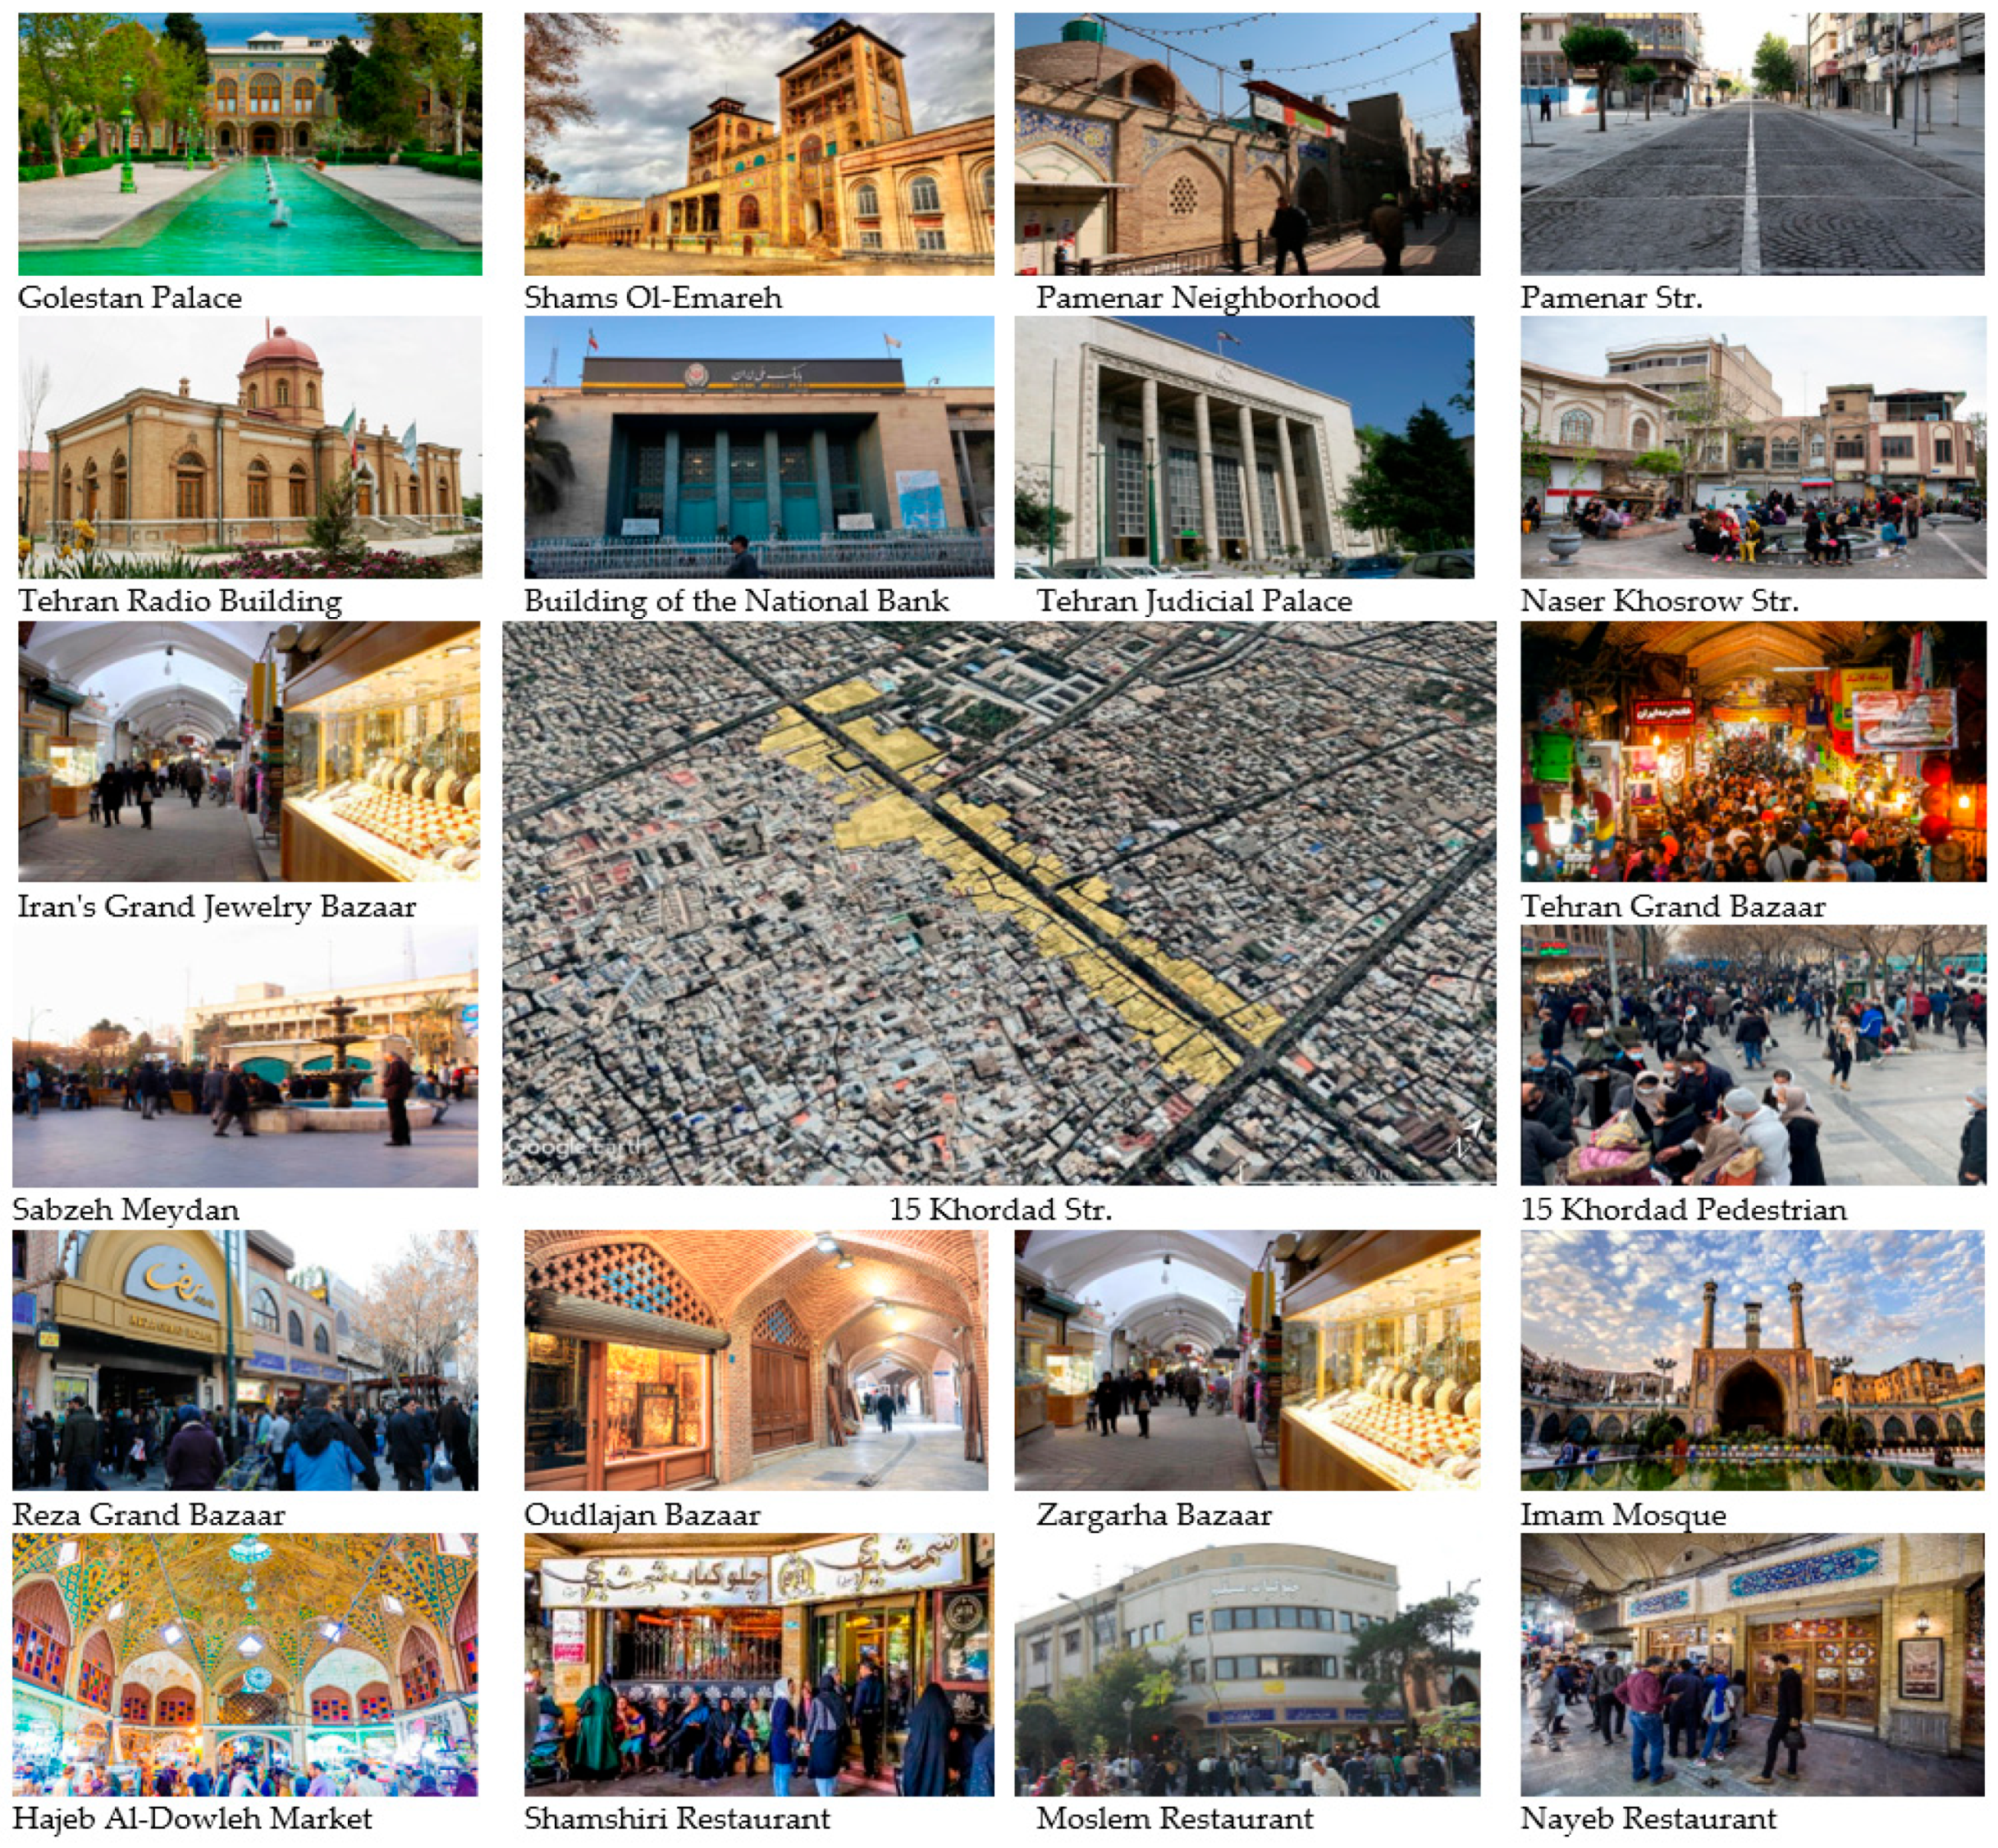
Tehran is considered the administrative and economic center of Iran and the city with the greatest concentration of population and economic activity. District 12 in Tehran municipality is known as the heart of Tehran because it is the city’s central and historic district where one of the most important streets left of old Tehran, 15 Khordad Street, is located. This street is one of the busiest streets near Tehran’s central market, which has been turned into a pedestrian street over the past years, and access for riders to it is limited (Figure 2).
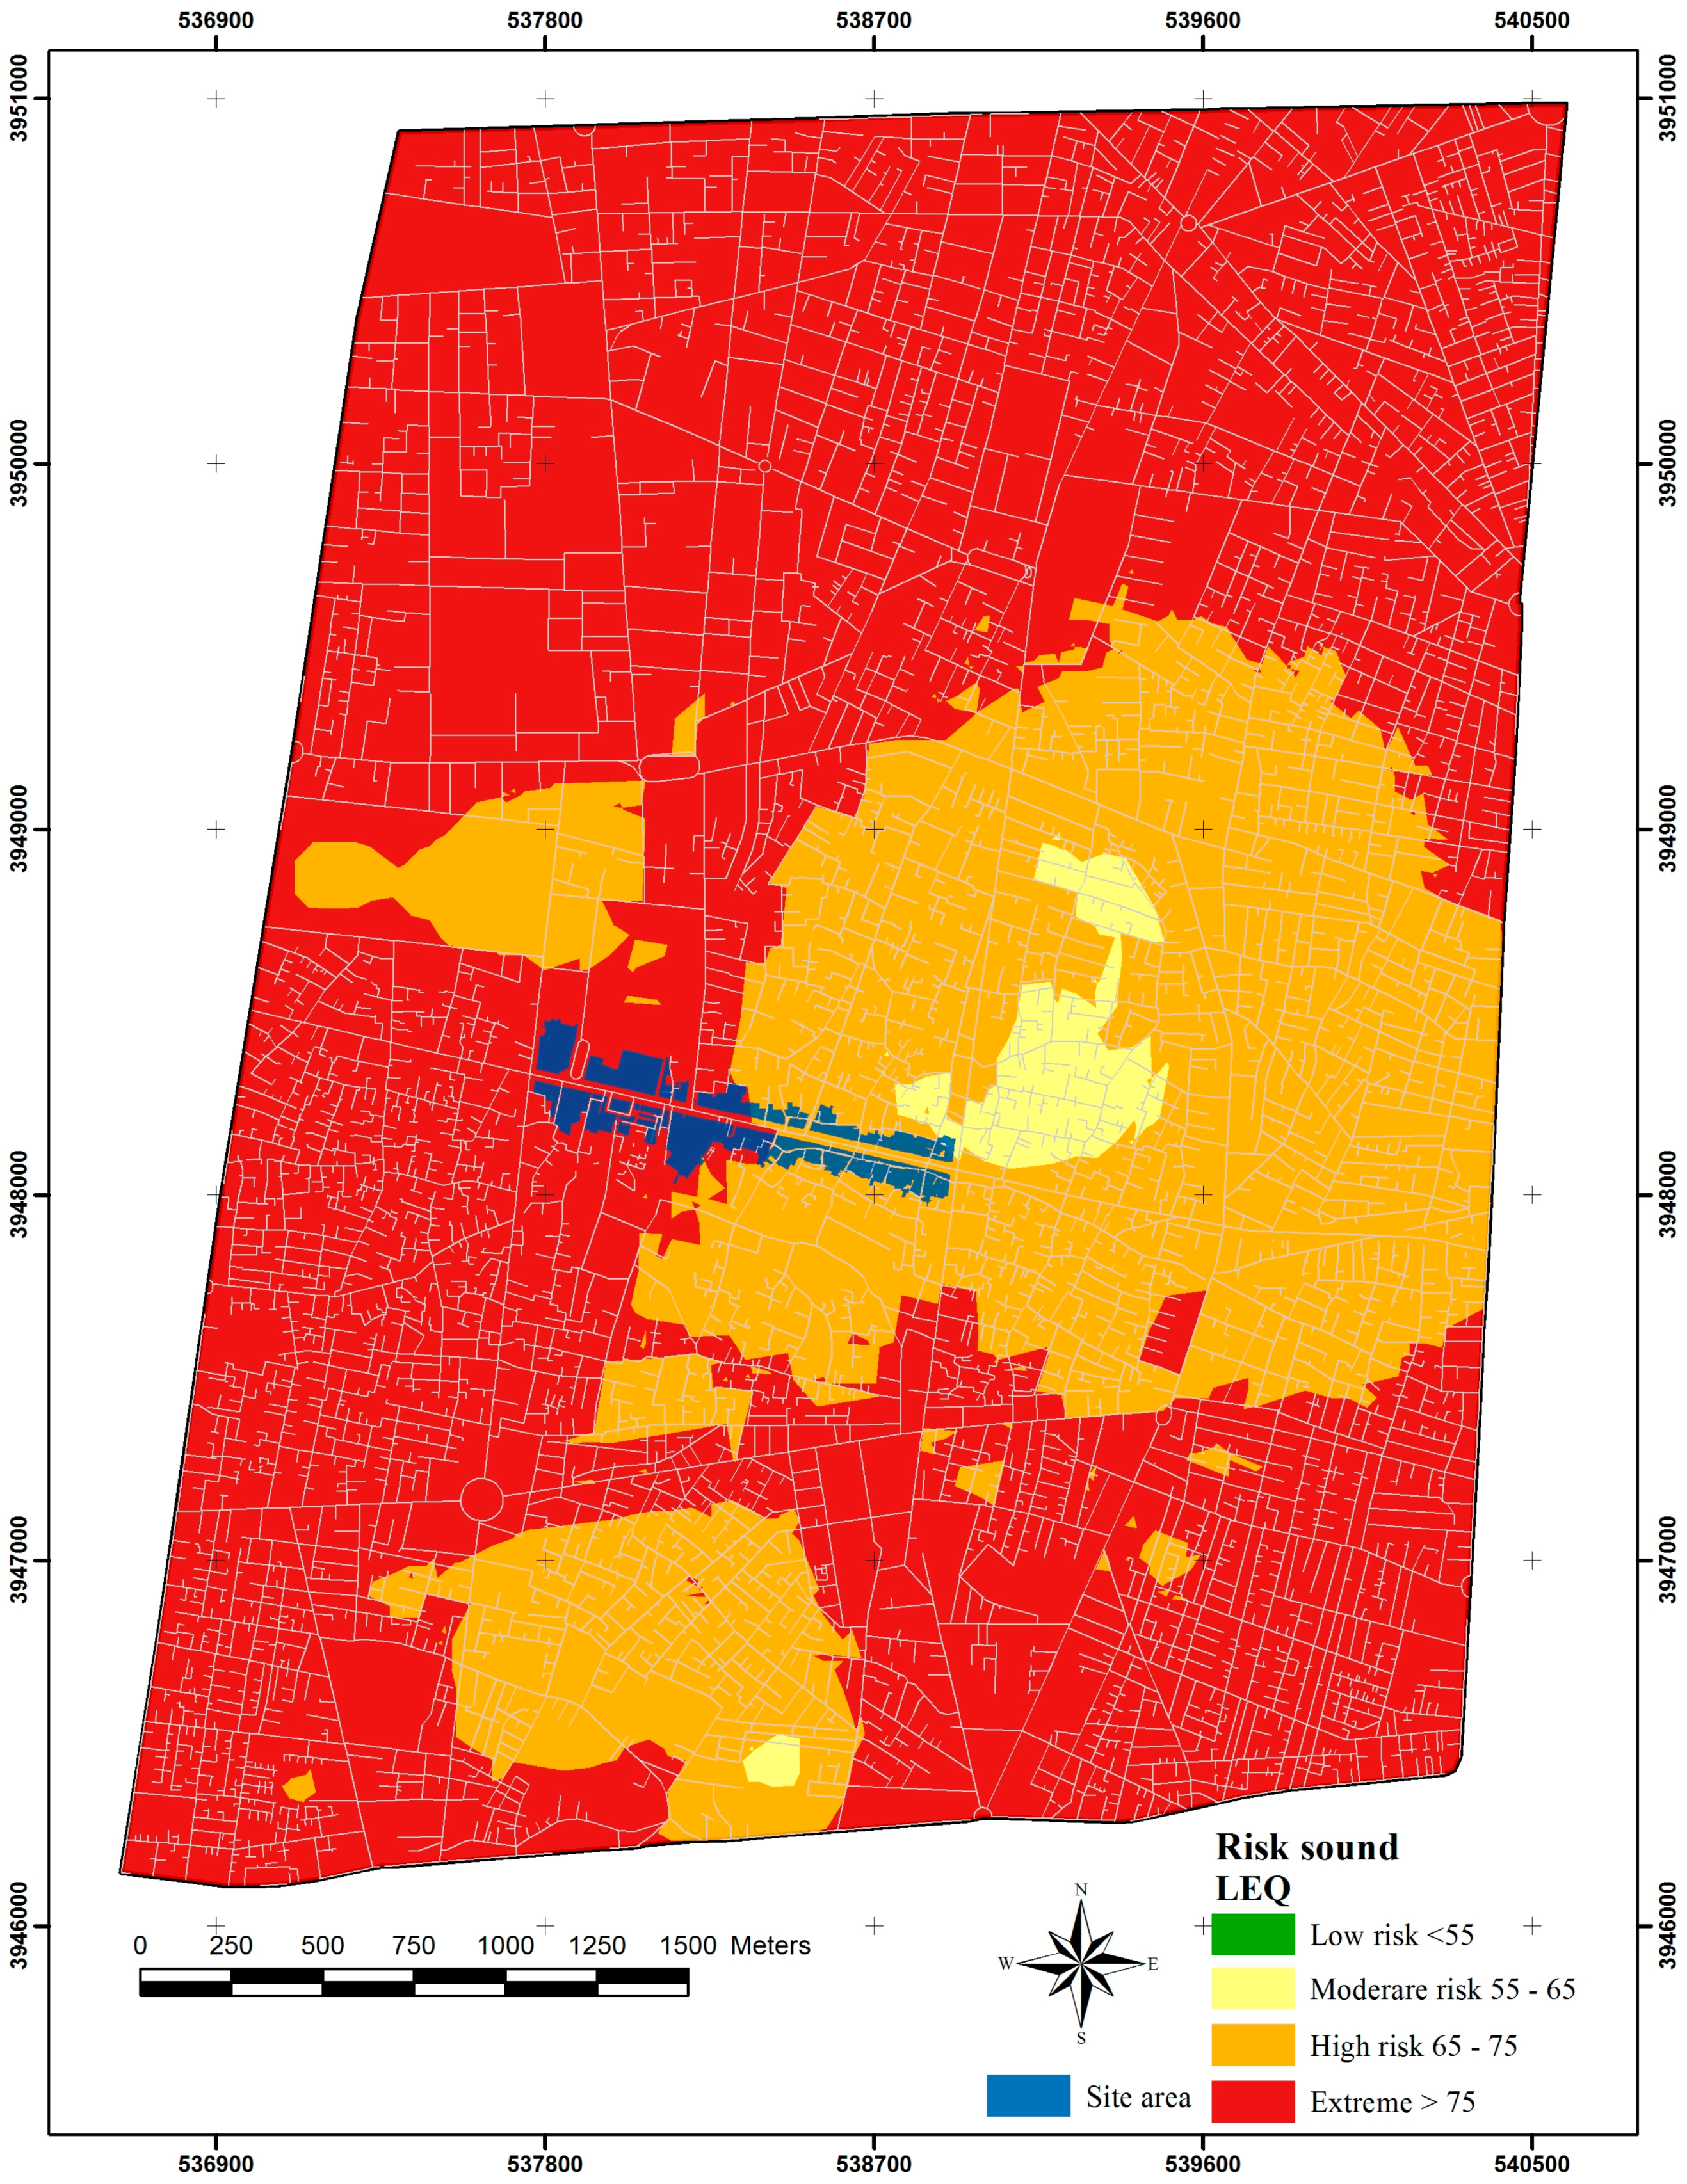
The areas with the highest amount of noise pollution are, respectively, District 9, 10, 11, 12, 16, and 21, and the lowest amount of noise pollution is reported in District 3 and 18 in Tehran. This is even though, over the past 10 years, the average amount of noise pollution in Tehran has increased by 8 to 9 decibels [64]. We selected 15 Khordad Street in District 12 in Tehran municipality for this study because it is one of the noisiest areas in Tehran, and also one of the busiest because of its historic area and market. As shown in Figure 3, this street is in the high risk and extreme range.
In the public’s mind, 15 Khordad Street is fortunate to have a name and rich history as they see it as an important urban space. In addition, this street suffers from the economic (commercial) and social burdens of being located in close proximity to central city streets. This street is in full compliance with the existing crosswalk routes, connecting two important points on Tehran’s map: the north–south street (Topkhaneh Square and Tehran’s Grand Bazaar) and the east–west street (Molawi Bazaar and 15 Khordad Square). This area encompasses human activity, living paths, and memory spaces that are responsible for social prosperity, identity formation, and remembrance. It is one of the many areas where people come together to create a collective presence. Therefore, it is both a destination and a passage. This street is within the limits of the streets that have been important in three historical periods of Iran in the last 250 years, including Qajar, Pahlavi I, and Pahlavi II until today.
Social and cultural activities that are derived from local culture play a significant role in the sound identity of an urban space, including 15 Khordad Street. In addition to various daily activities, ceremonies such as the national and religious holidays of Iranians (Chershanbesuri, Ashura, Nowruz, holidays, and other occasions) are held in the open spaces of this area. Moreover, music playing, street shows, and face painting are also held as part of the entertainment activities in the area.

4. Results

4.1. Social and Economic Features of Respondents

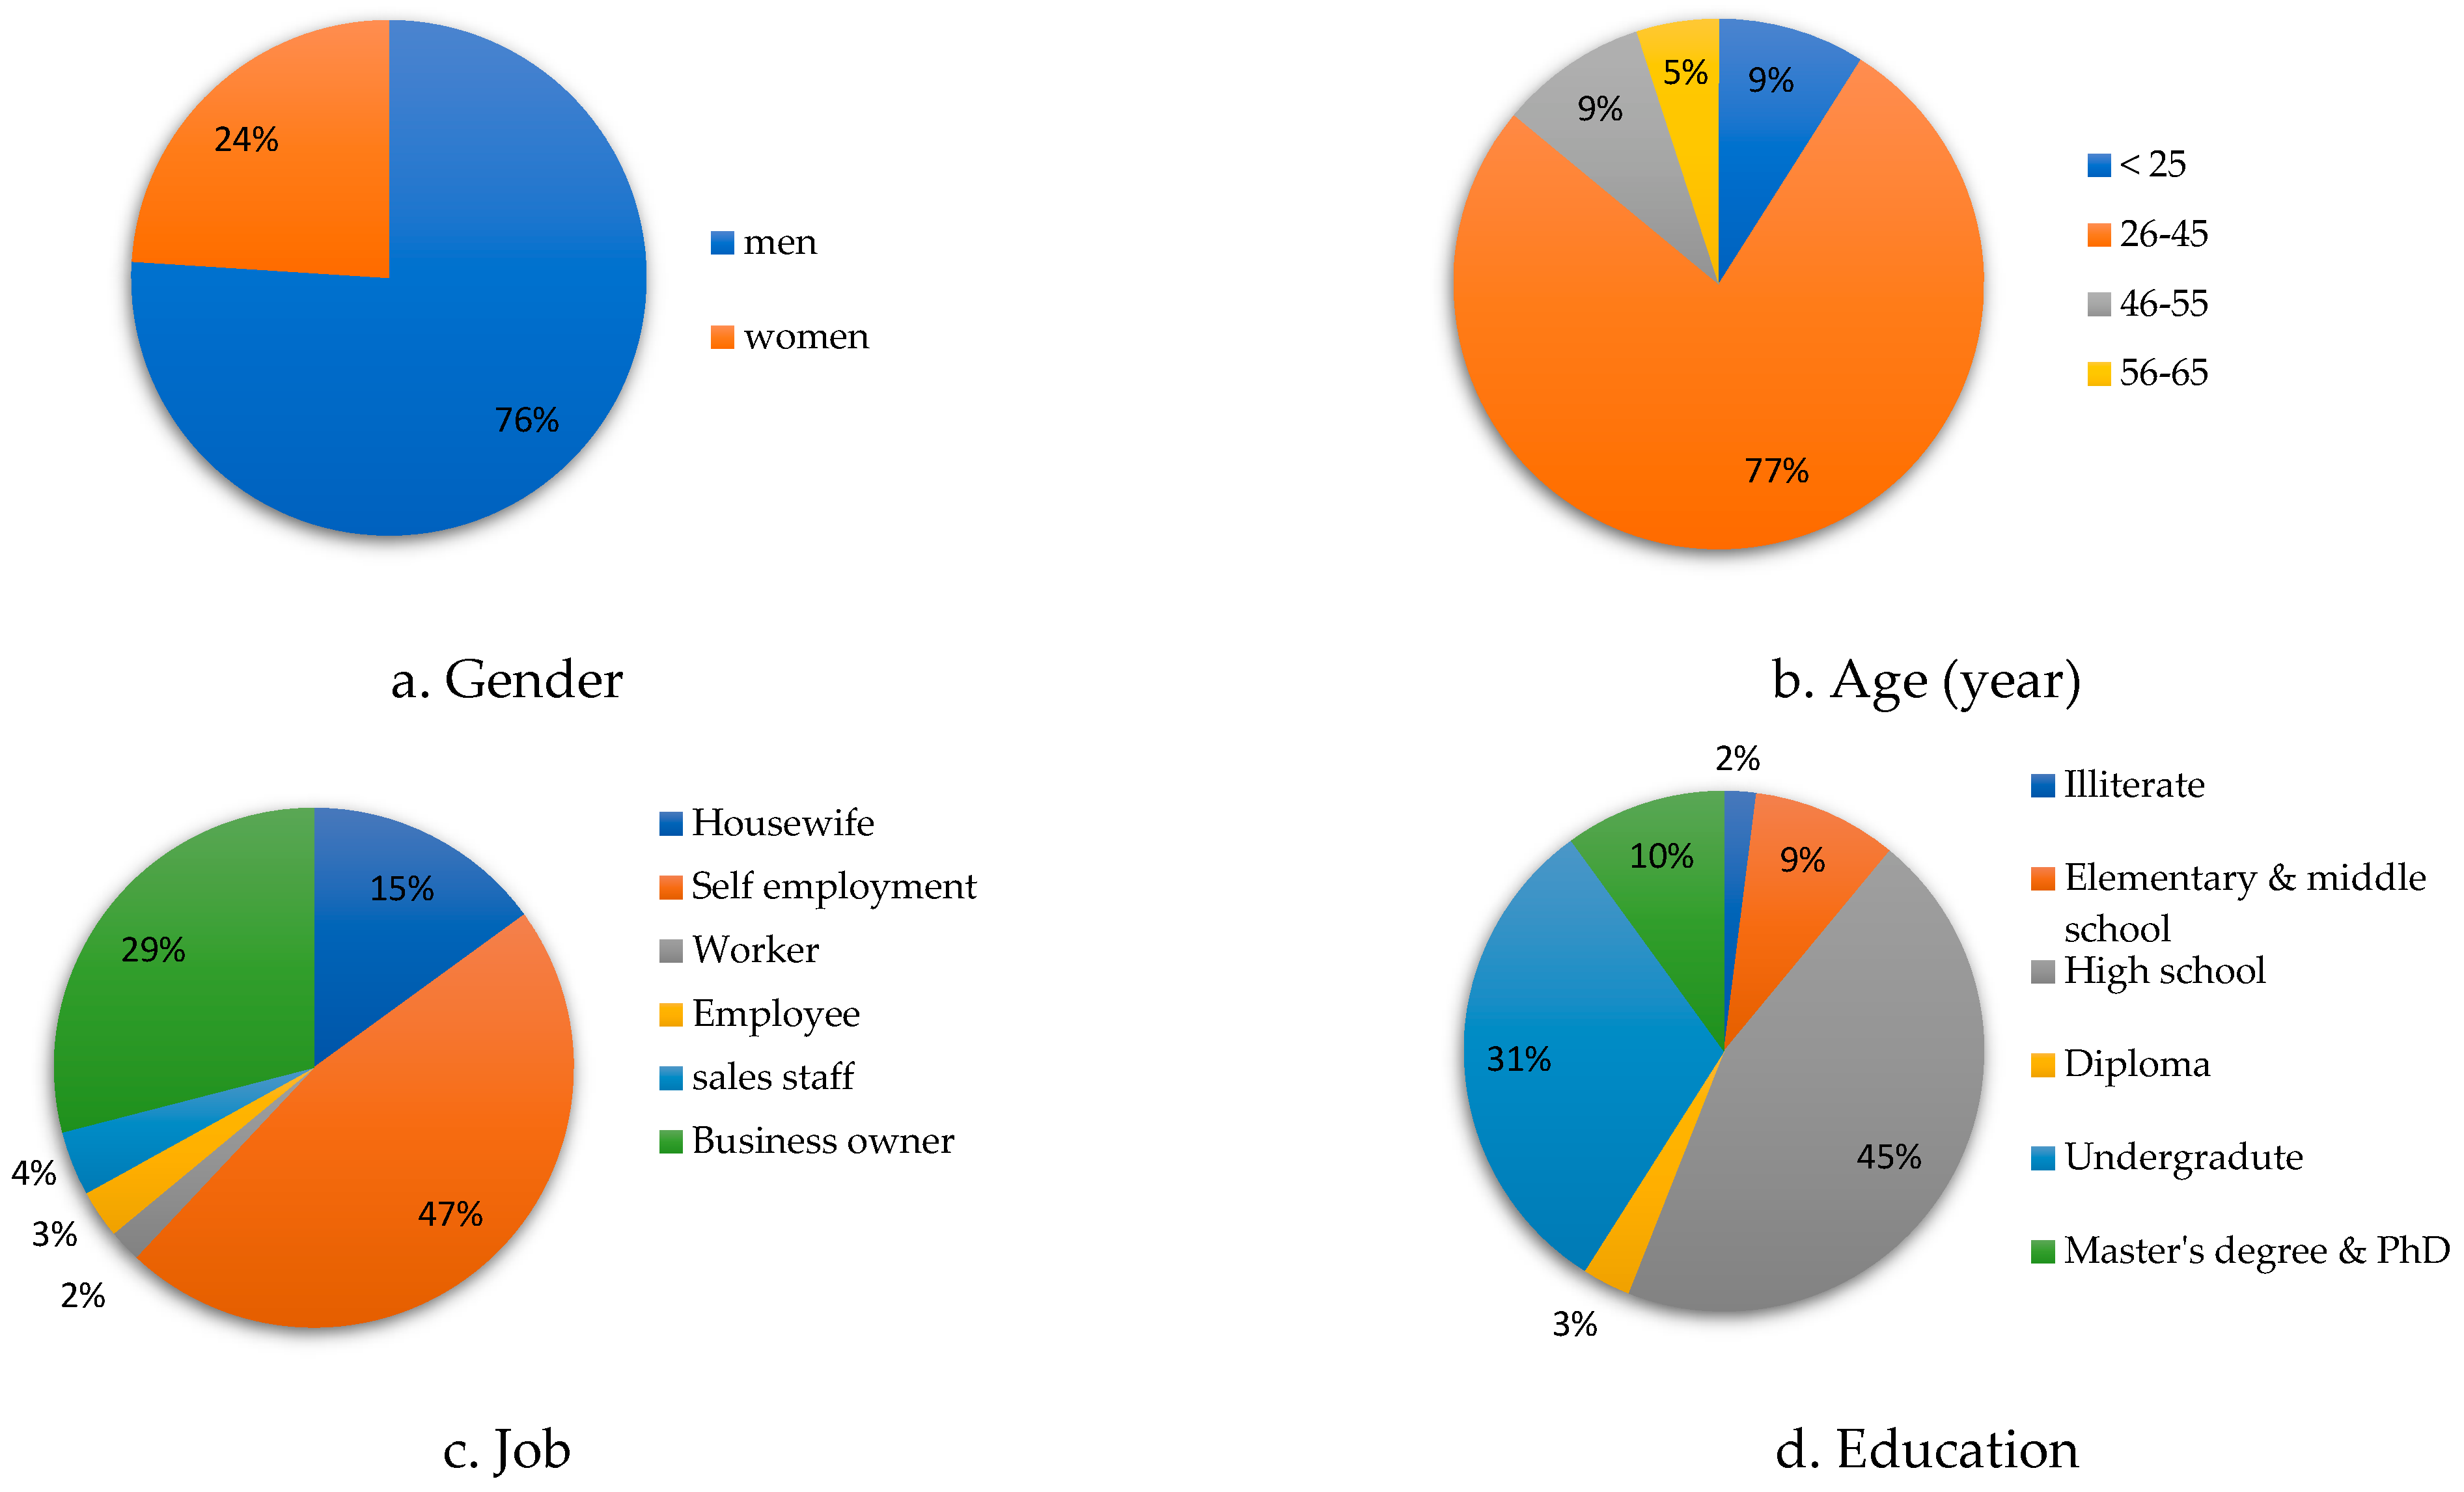
The results of the descriptive data showed that in the case study (Figure 4a–d), 76.5% of respondents were men and 23.5% were women, and the age group consisted of 21 to 61 years. The average age of respondents was 37 and the standard deviation for the age 9.5 years was reported. The largest proportion was in the 26–45 age group, with about 77.5%, which shows that users are mainly young. Approximately 5% of individuals were aged 56 to 65, and 8.8% were under 25 and 46 to 55.
In terms of education, the largest group of respondents were high school students with 45%, and 31% were undergraduates. About 10% had a master’s or PhD degree, 3% were high school graduates, 9% had completed elementary or middle school, and 2% were illiterate. (The questions for the illiterate people were read and the answers were recorded by the researchers). Most of the task force members in this axis were self-employed with 47.1%. After this occupational group, the business owners are placed with 29.4%. The next group is housewives, which includes roughly 15%. Sales staff with 4%, employees with 3%, and workers with 2% are placed at the next levels.
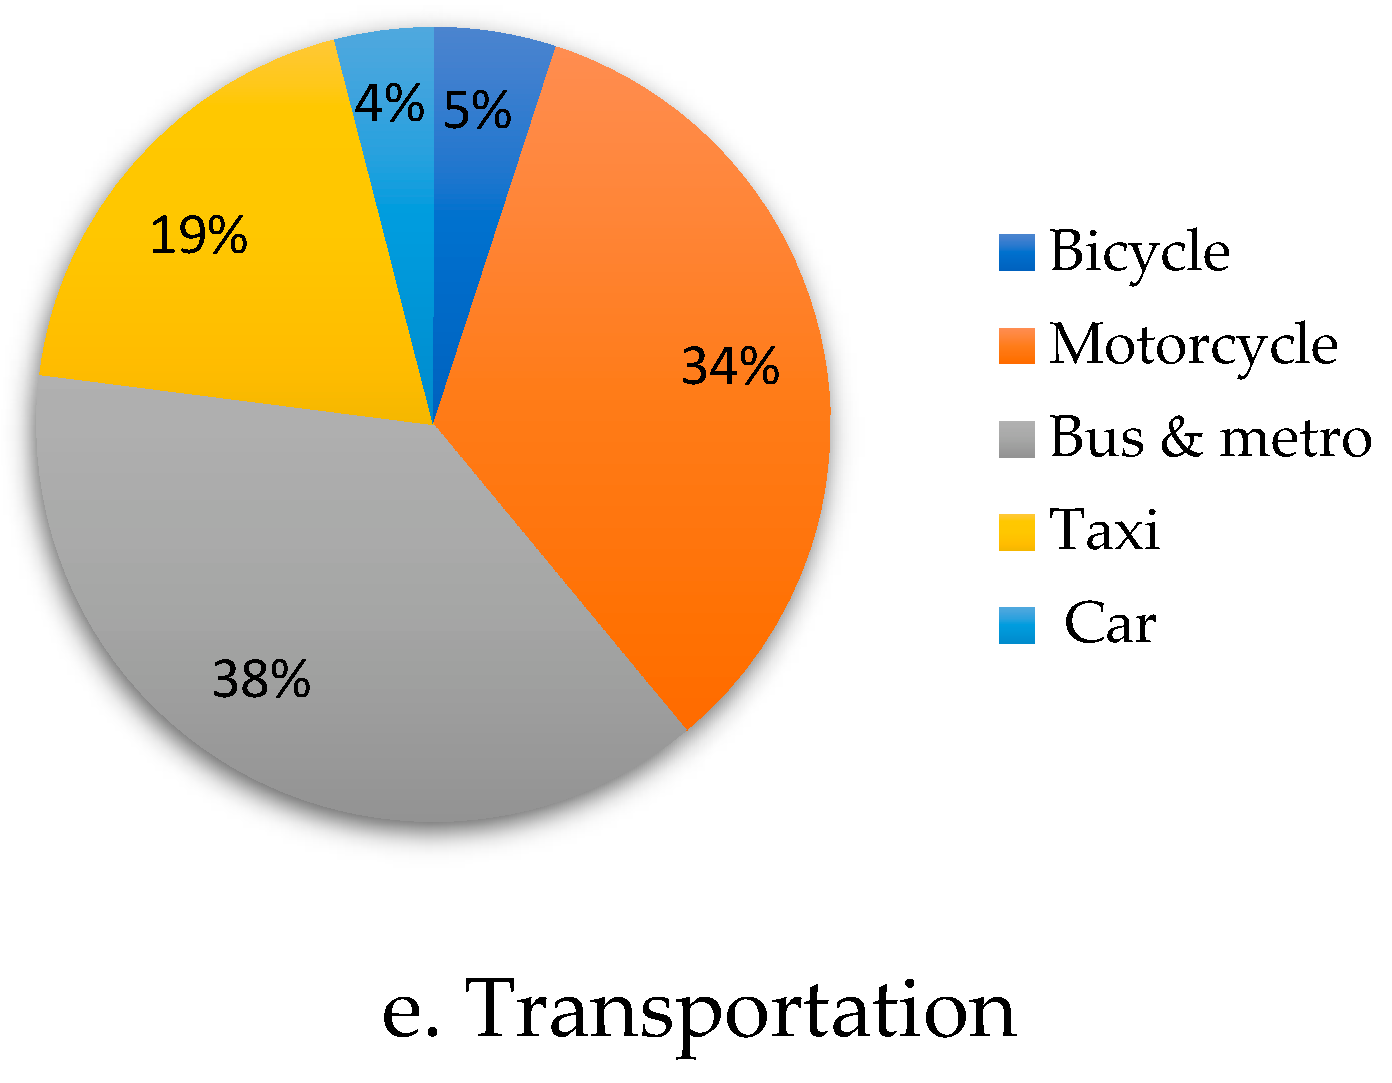
People choose various vehicles to come to this street. About 38% of people come to this space using public transportation, such as buses and metros. This axis is known as a communication hub in the center of the city of Tehran. City managers in different eras have tried to create better facilities for this area as the beating core of Tehran’s economy. Highway networks were not included in this area as a result of government policies in various land use plans, including the masters’ plans of 1968 and 1992 and the urban traffic plan of 1980. It is also important to mention that the public transportation system has not changed a great deal in recent years. Consequently, citizens and business owners choose lighter modes of transportation, such as motorcycles, which are easier to navigate in traffic. This vehicle is also used to transport light articles to other urban areas or freight terminals. It should be mentioned that the motorcycle itself is one of the factors that produce unpleasant sounds in the study area. Over 34% of those who entered this area used the mentioned mode of transportation. About 20% also enter this axis by taxis, which is also considered a cause of pollution and traffic, especially since the taxi station has not been upgraded for several years. Around 5% of respondents use bicycles, which has become commonplace in recent years, and around 4% of respondents use cars. The reason for the limited use of passenger vehicles is Tehran’s urban traffic plan.

4.2. Quality of the Sonic Environment: Indicators Analysis

To analyze the understanding of the quality of the sonic environment, indicators such as pleasantness, evocative and inspiring role, and space intractability were asked. It helped us assess their understanding of the various variables in each indicator. Table 1 shows the pleasantness indicators affected by the sonic environment in the investigated case study. There are variables of items, including motorcycles, car horns, traffic, electrical exercises, loud music, hawkers, porters, old air conditioners, building construction, etc., that fall under the category of unpleasantness and undesired noises that people do not particularly enjoy. People on this path are deprived of comfort and serenity by the unloading and loading of items for the market, as well as the passing traffic of motorcyclists, caravans, etc. Only 9% of people are less impacted by it, which may be a result of their frequent presence in the area and regular exposure to this circumstance. This in and of itself creates unpleasant sonic psychological effects; around 61% of people are aware of these impacts. With the average at 52%, the coverage and variety of plants along the street can balance the space. The total average of 2.7 for this variable is lower than the expected average, etc. There is no favorable situation when it comes to the variable of geophony. Due to the surroundings and the absence of geophony in this area, around 59% of respondents find it unattractive. One of the most crucial factors in this study is the environment’s variety of sounds, which draw people’s attention and lead to a considerable amount of users about 70% perceiving the existence of such sounds in the researched site as prominent. Despite some part of the study area being designed as a pedestrian area and its purpose is for playing music, the respondents gave it an averagely poor rating. Such circumstances, which are uncommon in this region, can be beneficial in enhancing the vibrancy of urban public places.
Regarding the deprivation of comfort through the biophony, possibly the presence of birds can be more noticeable, as both residents and businesses hardly ever see the entry of animals such as dogs due to the cultural and historic setting of this area. This species cannot be accompanied by passersby who enter this area via public transportation. The responders, however, are not satisfied with the current circumstances. On this road, however, passersby might not have a lengthy stop. A total of 24.5% of respondents think the situation is ordinary, while 64% think it is bad. About 37% of people claim to have a fair to poor relationship with the space. The responses claim that despite frequent daily visitors to this area, which is a part of Tehran’s economic center, the prosperity of some enterprises has not been affected by the noise. The area has lost some of its attractiveness as a result of the noise generated by the street.
The most significant identified variables for the evocative and inspiring role indicators were assessed. Its results are shown in Table 2. An average knowledge has been attained in this case, and an intermediate state can be seen concerning the variable of attracting attention through various sounds, which can be the directing channel of sound, such as the call to prayer, religious chants, and peddlers. The occurrence of dispersed noises that are difficult to navigate through sound may be the primary cause. The respondents rated the ability of some sounds to recall past memories as medium to high due to their nostalgic nature. It should be noted, however, that not all noises, particularly troubling ones, can serve as a memory of prior events. Instead, the respondents were asked to name specific sounds, such as music, adhan, a particular pilgrim’s voice tone, and others that they were already familiar with. A few well-known restaurants, the specific tone of the voices of some peddlers for advertisements, a little live music, some seating places, and some furnishings can all help you make memories. Not much enjoyment was seen with sounds such as music, as noted in conjunction with the pleasantness indicator. The possibility of hearing the sound of music (song) as a component of the auditory richness of the area and the influence it can have is not favorable in this region; therefore, around 61% were dissatisfied and approximately 30% were moderately satisfied. Sounds of children playing are heard less due to the lack of children in traditional markets and the fact that parents usually do not bring their kids along. This is supported by locals in the vicinity as there are not many places for kids to play near or on the 15 Khordad Street pedestrian path. The evocative and inspiring role of children’s play sounds was generally mentioned by 72.5% of respondents, and 9% thought they were effective. Due to the nature of the market and the commercial nature of this area, sellers’ and purchasers’ conversations are constantly and relentlessly heard. Approximately 55% of respondents rated the pleasantness indicators for the variety of noises generated by various activities in the environment as high, and about 14% as low. This indicates that sounds associated with occupations such as peddlers, hawkers, etc. are frequently heard in this location. Distractions and neglect such as leaving things, stealing, confused in space, and losing track are other problems that have an impact on people’s attendance. The intriguing findings of this study demonstrate that the responders are not much affected by this connection. Perhaps the more protective maintenance work performed by people is the cause. People have become more watchful recently, especially as a result of field observations or reports of theft in crowded and public areas in Tehran. Additionally, according to the statements gathered, hearing noises less causes people to lose direction or location. The perception obtained shows an intermediary state with a tendency to less confusion. On the other hand, despite this incident, the urban identity has also been harmed, and the identity dimension, that means the linkages between people and the environment, has been severed. Even though there are cultural, traditional, and economic components, about 63% of people state that different voices have diminished the track’s uniqueness.
The other section referred to space intractability as a dependent variable. As Table 3 demonstrates remarkably, about 70% of respondents report that the environment noise in the area had no bearing on their being there. Despite the various sounds, other environmental attractions have helped humans maintain their presence in the area. These kinds of attractions are not always available, of course, but economic activities such as shopping have contributed to their existence in the area. Due to the loudness, ordinary to high levels of leisure time are seen in this area despite the presence of several historical and recreational sites that have transformed this area into a cultural and economic showcase for Tehran. Because the area is not only child-unfriendly to children, but also to the young and the old, almost 74% of the respondents expressed dissatisfaction with attendance, and 18.6% expressed an average opinion on the supply of urban hangout areas in this direction. The level of noise scatters people and precludes environmental convergence. Maybe we may uncover an inverse link between this variable and the variable of leaving the surroundings. About 55% of the respondents state that they are not being forced to leave this space by the sounds coming from 15 Khordad Street. Even though there is a pedestrian area, the respondents feel that there are no acceptable locations in this area. Their statements, with an average that matches the presumptive average and a propensity for low attendance, point to the unattractiveness of the urban furniture in this area. Additionally, these data show that quarreling is unaffected by the level of noise. The findings described people continue to use the street and return to this area despite the unappealingness and lack of the evocative and inspiring role of some characteristics. Businesses serve as Iran’s and Tehran’s most important economic hubs, fostering a return of human presence through their rich cultural values and artwork. Not many people are eager to bring their friends or family to this location. As was already indicated, we have witnessed the low voice of children and the lack of meeting places for the elderly, both of which can be quantified and connected with other variables. Therefore, the lack of various age groups (children and the elderly) supported the preceding two scenarios. Respondents believe that favorable sounds, that will lead to their continued and increased presence, are not heard in this area. They will, therefore, spend more time in this area if pleasant sonics are heard there.

4.3. The Appeasing Sounds of the Environment

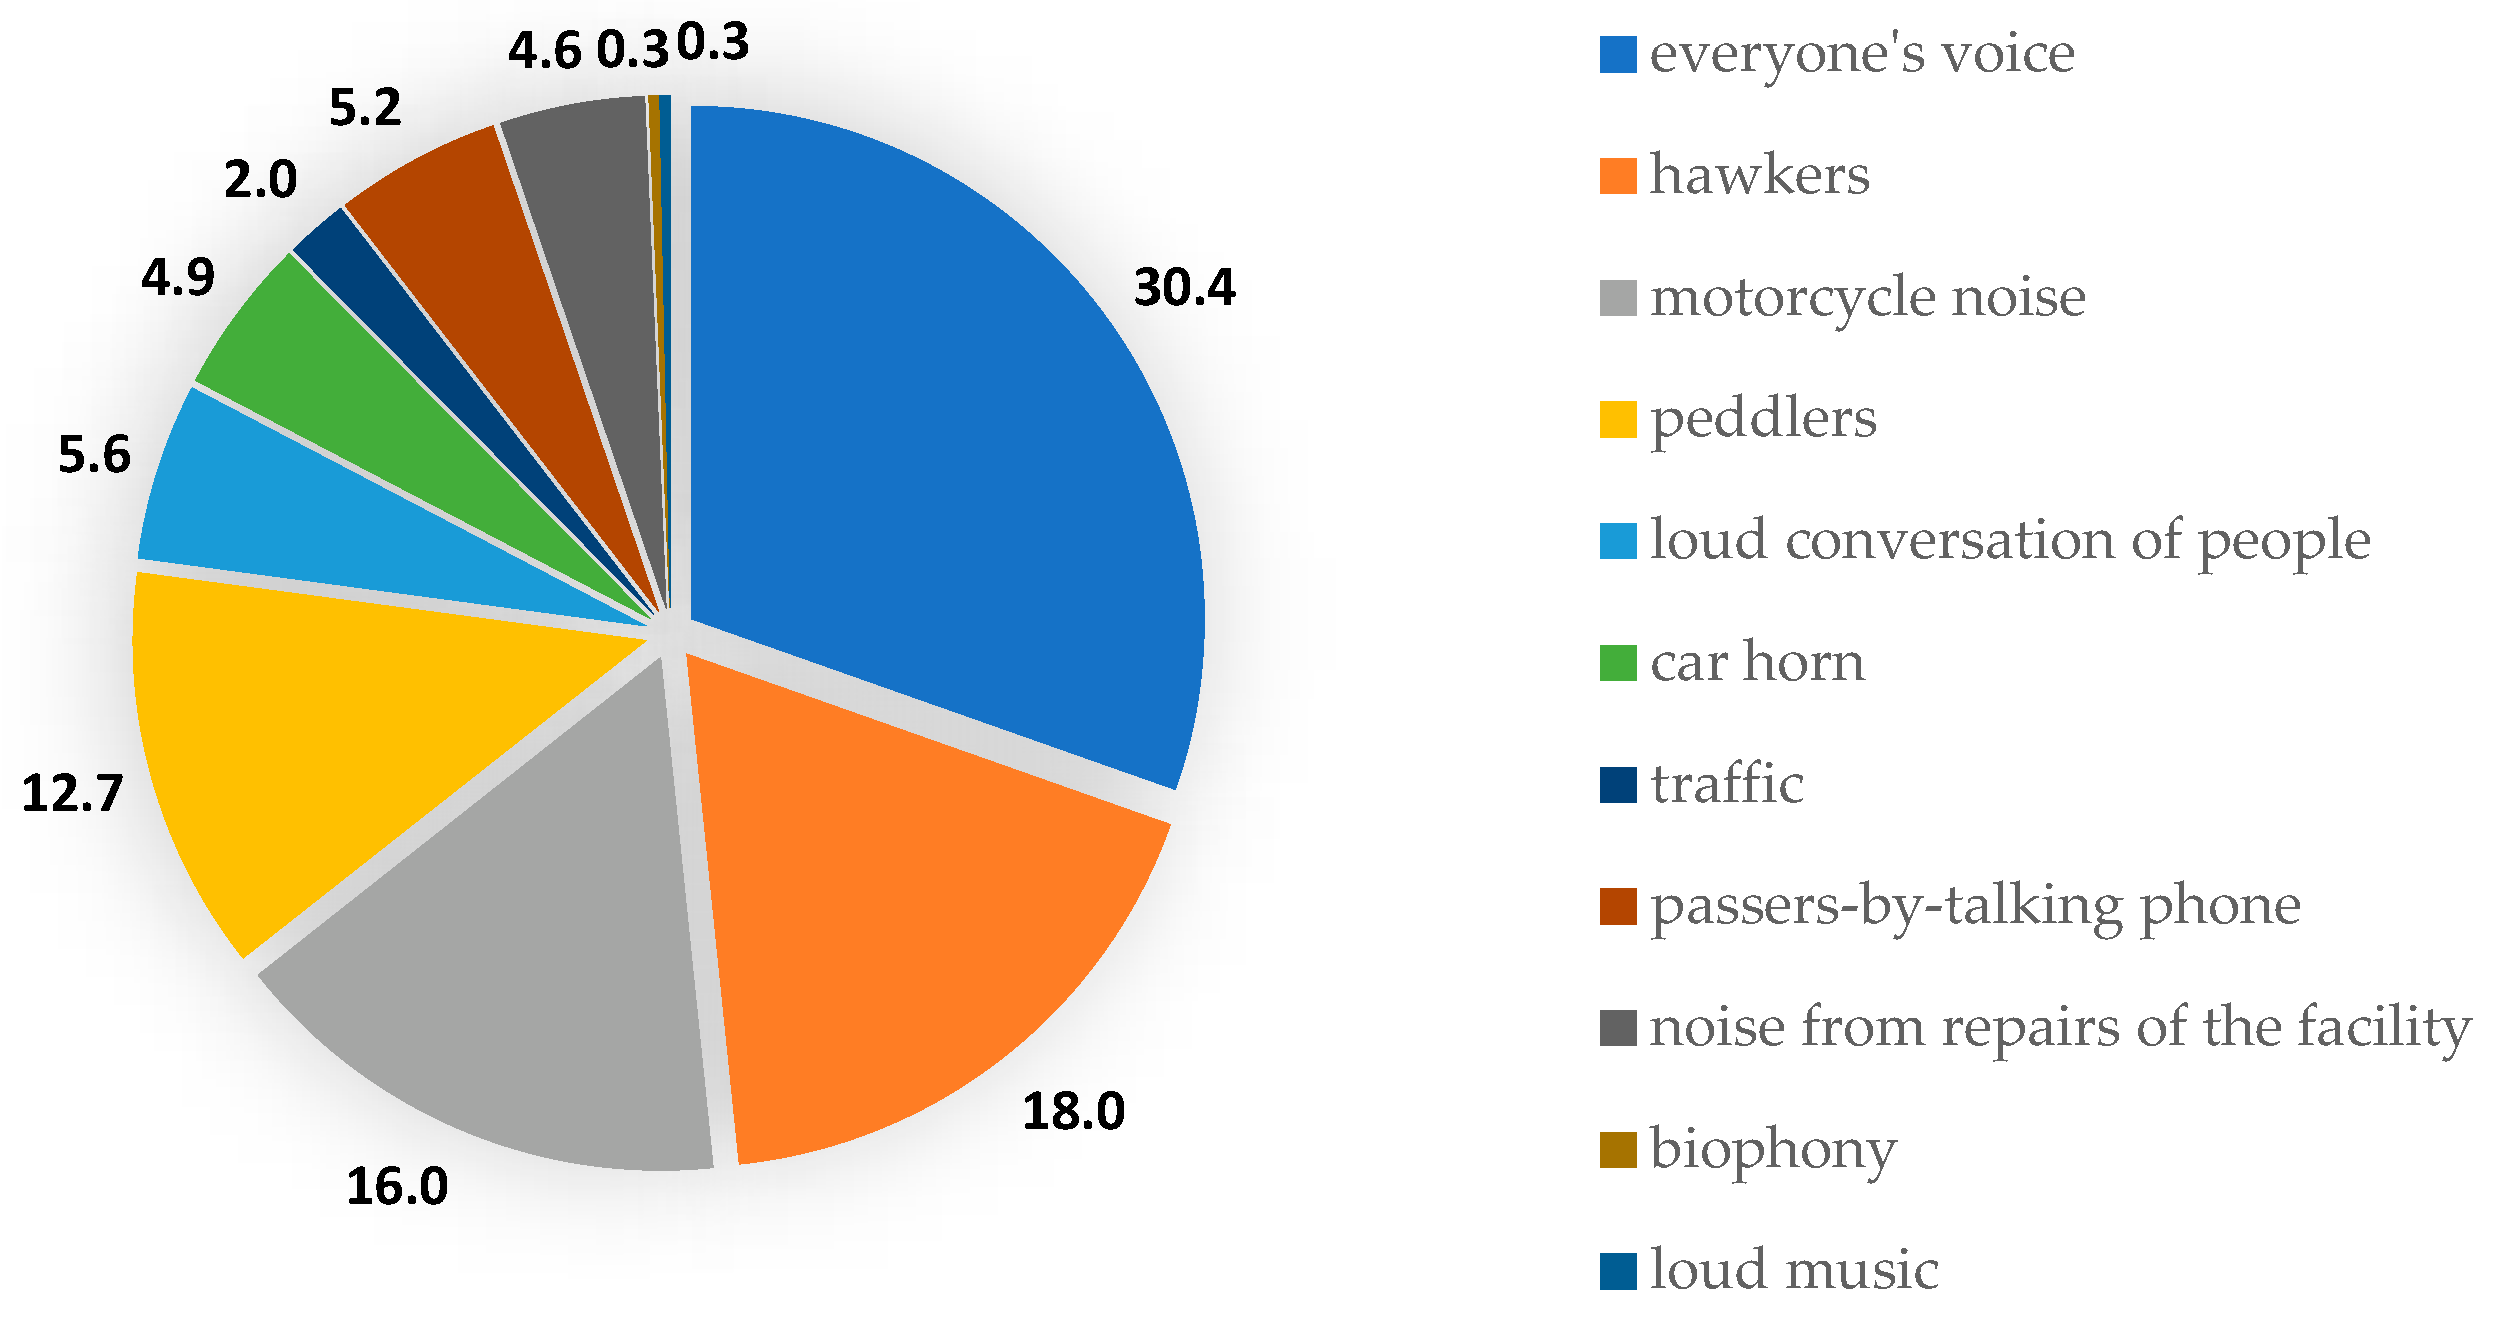
In the next stage, respondents were asked to identify, from the highest to lowest priority, the variables that affect their peace. Everyone’s voice with 34.3%, hawkers with 18%, motorcycle noise with 16%, and peddlers with 12.7% had the most frequency. Next is the sound of other priorities obtained which include the loud conversation of people, car horn, traffic, passers-by-talking phone, noise from repairs of the facility by the municipality or other organizations. In the last ranks, some variables have approximately the same weight, such as the biophony, such as the sound of horses that are used in the area to move people around and loud music (Figure 5).

4.4. Reasons for Coming to the Studied Space

The two most prevalent references to the study area are work and shopping, which account for 43.1% and 41.2%, respectively. Only 15% of visitors come here to have leisure time, and about 1% come to this site to visit the museums that are located in this area. The majority of visitors, about 57%, come alone, and the main reasons they do so are to shop or travel to work, which is consistent with the stated purposes for their travel. People entering this area in couples (31.4%) is next in the order. Though there are certain historic, cultural, and recreational spaces, it is important to observe that fewer people (11.8%) are eager to enter these areas as a group. In terms of who accompanies you to enter the area, it can be said that 57% of people do so by themselves, which corresponds to the question raised about how people being there. Additionally, 13% of individuals prefer to go shopping and to entertainment destinations with their families, while 25.5% of people prefer to go with friends. About 5% of people also come here with their coworkers. Regarding the issue of where you would want to spend time, 77.5% of the respondents said they would select a restaurant. Approximately 9% also like selecting city furnishings such as seats or locations with adequate illumination for sitting. About 7% of people would like to sit in a vitamin area (juice shops), and 4% of people prefer to spend their free time in coffee shops, whereas 3% prefer to remain in their current workplace.

4.5. Explain Inter-Indicator Relationships

To establish the nature of the relationship between the indicators and to offer a causal explanation, multiple regression was performed. Here, the pleasantness and the evocative and inspiring role are the independent variables, and people attendance is the dependent variable. Table 4 shows the model’s fit statistics. The normalized or beta effect coefficient helps us determine the relative contribution of each independent variable in the explanation of changes in the dependent variable.
Here, lack of people attendance variable was examined along with the variables of hearing the voice of sellers and purchasers continuously, deprivation of comfort through the biophony, unpleasantness and undesired noises, and unpleasant sonic psychological effects. The value of the specified coefficient of determination at 0.098 units predicts lack of people attendance variable. In the next step, one-way analysis of the variance was measured. ANOVA examines the hypothesis of a linear relationship between variables. According to the value of Sig. of ANOVA, it can be established that the regression model was able to describe the variance of the dependent variable more than the random state; because Sig. 0.039 is inferior to the probability of the first error α = 0.05. Regression or parameter estimates are also indicated in Table A1. The standardized coefficients or beta helped to determine the relative contribution of each independent variable to the explanation of changes in the dependent variable. The relation is as follows, where the constant value was equal to 3.276.
Quality of the sonic environment = β hearing the voice of sellers and purchasers continuously + β deprivation of comfort through the biophony + β unpleasantness and undesired noises + β unpleasant sonic psychological effects + ε
Quality of the sonic environment = 0.042 + −0.086 + 0.106 + −0.222 + 3.276
In another review, the relationship between not bringing friends and family as a dependent variable with all the pleasantness and evocative and inspiring role indicators mentioned in Table 1 and Table 2 were measured. The value of the coefficient of determination specified with 0.353 units predicts lack of people attendance variable. Given that the Sig. 0.000 is inferior to the probability of the first error α = 0.05, a linear correlation between the dependent variable and the independent variables can be established (Table 5). Parameter estimates are also presented in the coefficient Table A2. Some of the coefficients of the independent variables indicated are less than 0.01, such as unpleasant sonic psychological effects and hearing the sound of music, the null hypothesis is rejected, and the alternative hypothesis is accepted. The constant value was equal to 3.467 and the beta was also 0.102, 0.081, −0.097, −0.013, −0.076, −0.094, −0.230, −0.054, −0.097, −0.037, 0.307, −0.094, −0.088, and 0.139.

5. Discussion

Despite several decades since the publication of Rachel Carson’s book “Silent Spring 1962” [65], there are still concerns about the loss of natural sounds, especially in urban environments. In today’s urban environments, many natural sounds such as birdsong, wild animals (biophony), and inanimate sounds of water movement and wind blowing (geophony) have changed [66], and have been gradually replaced by artificial sounds (anthrophony) that are produced by humans and their activities. In 15 Khordad Street, natural sounds such as the sound of water and wind are heard less, which is due to the drowning of the sound of nature, and, as Beatley [67] states, it occurs in an urban sonic environment that is full of mechanical and engine sounds. On the other hand, in the case study, the pleasantness has decreased due to the existence of different sounds caused by different human activities and attracting people’s attention by different sounds. As Yang et al. [20] and Rehan [11] suggest in their research, preserving and strengthening natural sounds and respecting nature and applying the integrated green–blue approach is a promising way to improve local quality and human comfort conditions.
In the axis of 15 Khordad Street, hearing the sound of music and hearing the sound of children playing is the least, while Jacobs [68] considers it necessary to pay attention to their uses and activities at different hours to create vitality. On the other hand, hearing the continuous and non-stop sounds of sellers and purchasers has been the most repeated and has reduced the attractiveness of the space. While a more favorable sonic environment could have created places where people spend their time, in which social life flows [69] and people encourage and motivate social interactions [70] and become familiar with the surrounding environment [71].
In this street, it has not been possible to form local hangouts and behavioral settings for different age groups, including young people and the elderly. While in line with the results of the research by Aram et al. [72] and Kowkabi [73], it is expected to increase the level of familiarity of neighbors with each other and social interactions in Bazar because it is a factor to attract the population. Although the axis is crowded during the hours of the day, this presence failed to generate many social interactions. On the other hand, in this street, favorable sounds and increased (continuously) attendance, and also returning to the space, have been reported less. Therefore, the sonic environment has not been able to bring about the identity of the space as was pointed by Huang [74].

6. Conclusions

The main function of the public space is to provide a platform for people’s presence. If this space is not desirable due to noise pollution, these spaces often do not meet the needs of humans as social beings and people only look at urban environments as a way to pass time. On the other hand, urban spaces can help people develop their social interactions and communication skills. Sound is an important role in the quality of urban environments. In some cases, sound destroys the opportunity for people to be in the environment.
The street studied contains a combination of historic, cultural, architectural, and commercial elements. In recent years, Tehran municipality turned this street into a pedestrian area to facilitate the movement of people. Following protests from the business owners, part of the street was reopened for automobiles. We show to what extent the sounds of the environment can affect the pleasantness, the evocative and inspiring role, and space intractability in the pedestrian street. This study pinpoints the multifaceted indicators of the users.
We show that in the central district of Tehran, biophony and geophony sounds are heard less and affect the sonic environment less, as factors such as the compression of the urban space due to the increase in population density and land use have led to a decrease in the hearing of biophony and geophony sounds. In addition, the compression of the space has caused its identity to be challenged. Crucially, we found that this space is not very nostalgic and the various sounds are not very attractive to people. We found that despite the many unpleasant noises and their effect on the psyche, people are present in the space and are not willing to leave it. It also does not prevent familiarity with the space and people from returning to this space. Our approach to this paper has highlighted some of these variables, to add more nuance to discussions on the sonic environment. Although this street is located on a historic and cultural axis and part of it is designed as pedestrian, it is not child-friendly, elderly-friendly, or family-friendly. This may be due to issues including the predominance of traditional commercial land use.
Unpleasant noises are a significant and durable public problem in cities, especially the central district of cities in developing countries, and neglecting it can damage its sustainability. Landscape planning could be developed and give way to conscious acoustic design and active sound management in order to produce the right sound at the right place. These objectives could be achieved by moving beyond just reducing noise levels and initiating innovative experiments for designing urban soundscapes that would create a calm environment and quiet spaces amid the city’s bustle, describing acoustic phenomena in urban environments, determining the application of acoustic aspects of urban design, reducing unwanted noise in outdoor areas (streets, piazzas, open spaces, and nodes), managing the acoustic environment of cities through the creation of sustainable solutions, enabling landscape planners to view sounds as a planning resource to increase awareness of soundscapes, and enhancing our natural soundscape to create a pleasing soundscape.

Author Contributions

Conceptualization, A.H. and L.K.; Methodology, A.H. and L.K.; Software, A.H. and L.K.; Validation, A.H. and L.K.; Formal analysis, A.H. and L.K.; Investigation, A.H. and L.K.; Resources, A.H. and L.K.; Data curation, A.H. and L.K.; Writing—original draft, A.H. and L.K.; Writing—review & editing, A.H. and L.K.; Visualization, A.H. and L.K.; Supervision, A.H. and L.K. All authors have read and agreed to the published version of the manuscript.

Funding

This research received no external funding.

Institutional Review Board Statement

Not applicable.

Informed Consent Statement

Not applicable.

Data Availability Statement

The data will be available on request to the corresponding author.

Acknowledgments

The measurement and the data analysis of this study have been done in the research laboratory “Soundscape Lab” at University of Art, Tehran.

Conflicts of Interest

The authors declare no conflict of interest.

Appendix A

Table A1. Multiple regression analysis and parameter estimates of people attendance based on the quality of the sonic environment.
Coefficients a
ModelUnstandardized CoefficientsStandardized CoefficientstSig.
BStd. ErrorBeta
1(Constant)3.2760.556 5.8860.000
unpleasantness and undesired noises−0.0420.095− 0.044−0.4470.656
unpleasant sonic psychological effects−0.0860.109−0.080−0.7870.433
deprivation of comfort through the biophony0.1060.0850.1221.2430.217
hearing the voice of sellers and purchasers continuously−0.2220.097−0.233−2.2950.024
a. Dependent Variable: lack of people attendance.
Table A2. Multiple regression analysis of some people attendance variables with pleasantness and evocative and inspiring role indicators.
Coefficients a
ModelUnstandardized CoefficientsStandardized CoefficientstSig.
BStd. ErrorBeta
1(Constant)3.4670.842 4.1190.000
The variety of sounds caused by different activities in space0.1020.0890.1071.1390.258
The coverage and variety of plants along the street0.0810.1030.0750.7870.433
Geophony−0.0970.092−0.101−01.0600.292
Attracting people’s attention by different voices −0.0130.086−0.015−0.1540.878
Pleasantness by playing music (calm)−0.0760.097−0.076−0.7900.432
Unpleasantness and undesired noises−0.0940.087−0.099−01.0880.280
Unpleasant sonic psychological effects−0.2300.101−0.215−02.2830.025
Deprivation of comfort through the biophony −0.0540.081−0.062−0.6700.505
Attracting attention through various sounds −0.0970.094−0.102−01.0310.305
The memory of past memories across certain sounds−0.0370.105−0.035−0.3500.727
Hearing the sound of music0.3070.0880.3193.4760.001
Hearing the voices of children playing−0.0940.085−0.102−1.1040.273
Hearing the voice of sellers and purchasers continuously−0.0880.093−0.093−0.9450.347
Confusion in finding direction or location by hearing noises0.1390.0780.1671.7710.080
a. Dependent Variable: Not bringing friends and family.

References

  1. Buxton, R.T.; Pearson, A.L.; Allou, C.; Fristrup, K.; Wittemyer, G. A synthesis of health benefits of natural sounds and their distribution in national parks. Proc. Natl. Acad. Sci. USA 2021, 118, e2013097118. [Google Scholar] [CrossRef] [PubMed]
  2. Mahdi, A.; Hosseini, A.; Pourahmad, A.; Hataminejad, H. Analysis of effective environmental factors an urban health, a case study of Qom, Iran. Habitat Int. 2016, 55, 89–99. [Google Scholar] [CrossRef]
  3. McMichael, A.J. The urban environment and health in a world of increasing globalization: Issues for developing countries. Bull. World Health Organ. 2000, 78, 1117–1126. [Google Scholar] [PubMed]
  4. Tanner, M.; Harpham, T. Urban Health in Developing Countries: Progress and Prospects; Routledge: Oxford, UK, 2014. [Google Scholar]
  5. Nieuwenhuijsen, M.J. New urban models for more sustainable, liveable and healthier cities post COVID-19; reducing air pollution, noise and heat island effects and increasing green space and physical activity. Environ. Int. 2021, 157, 106850. [Google Scholar] [CrossRef]
  6. United Nations. World Urbanization Prospects: The 2018 Revision; Department of Economic and Social Affairs: New York, NY, USA, 2019. [Google Scholar]
  7. King, E.; Bourdeau, E.; Zheng, X.; Pilla, F. A combined assessment of air and noise pollution on the High Line, New York City. Transp. Res. Part D Transp. Environ. 2016, 42, 91–103. [Google Scholar] [CrossRef] [Green Version]
  8. Lee, H.P.; Kumar, S. Perspectives on the Sonic Environment and Noise Mitigations during the COVID-19 Pandemic Era. Acoustics 2021, 3, 493–506. [Google Scholar] [CrossRef]
  9. Steele, D.; Bild, E.; Guastavino, C. Moving past the sound-noise dichotomy: How professionals of the built environment approach the sonic dimension. Cities 2023, 132, 103974. [Google Scholar] [CrossRef]
  10. Yuan, M.; Yin, C.; Sun, Y.; Chen, W. Examining the associations between urban built environment and noise pollution in high-density high-rise urban areas: A case study in Wuhan, China. Sustain. Cities Soc. 2019, 50, 101678. [Google Scholar] [CrossRef]
  11. Rehan, R.M. The phonic identity of the city urban soundscape for sustainable spaces. HBRC J. 2016, 12, 337–349. [Google Scholar] [CrossRef] [Green Version]
  12. Pijanowski, B.C.; Farina, A.; Gage, S.H.; Dumyahn, S.L.; Krause, B.L. What is soundscape ecology? An introduction and overview of an emerging new science. Landsc. Ecol. 2011, 26, 1213–1232. [Google Scholar] [CrossRef]
  13. WHO. Environmental Noise Guidelines for the European Region; WHO Regional Office for Europe: Copenhagen, Denmark, 2019. [Google Scholar]
  14. Eriksson, C.; Pershagen, G.; Nilsson, M. Biological Mechanisms Related to Cardiovascular and Metabolic Effects by Environmental Noise; WHO Regional Office for Europe: Copenhagen, Denmark, 2018. [Google Scholar]
  15. Basner, M.; McGuire, S. WHO environmental noise guidelines for the European region: A systematic review on environmental noise and effects on sleep. Int. J. Environ. Res. Public Health 2018, 15, 519. [Google Scholar] [CrossRef] [Green Version]
  16. Brown, A.L.; Van Kamp, I. WHO environmental noise guidelines for the European region: A systematic review of transport noise interventions and their impacts on health. Int. J. Environ. Res. Public Health 2017, 14, 873. [Google Scholar] [CrossRef] [Green Version]
  17. Hong, J.Y.; Jeon, J.Y. Exploring spatial relationships among soundscape variables in urban areas: A spatial statistical modelling approach. Landsc. Urban Plan. 2017, 157, 352–364. [Google Scholar] [CrossRef]
  18. Jiang, L.; Nellthorp, J. Valuing transport noise impacts in public urban spaces in the UK: Gaps, opportunities and challenges. In Proceedings of the INTER-NOISE and NOISE-CON Congress and Conference Proceedings, Madrid, Spain, 16–19 June 2019; Institute of Noise Control Engineering: Washington, DC, DC, USA, 2019; Volume 259, pp. 5204–5216. [Google Scholar]
  19. Huang, B.; Pan, Z.; Wang, G. A methodology to control urban traffic noise under the constraint of environmental capacity: A case study of a double-decision optimization model. Transp. Res. Part D Transp. Environ. 2015, 41, 257–270. [Google Scholar] [CrossRef]
  20. Yang, L.; Zhang, L.; Stettler, M.E.; Sukitpaneenit, M.; Xiao, D.; Van Dam, K.H. Supporting an integrated transportation infrastructure and public space design: A coupled simulation method for evaluating traffic pollution and microclimate. Sustain. Cities Soc. 2020, 52, 101796. [Google Scholar] [CrossRef]
  21. Berglund, B.; Lindvall, T.; Schwela, D.H. Guidelines for Community Noise; WHO: Geneva, Switzerland, 1999. [Google Scholar]
  22. ISO 12913-1:2014; Acoustics—Soundscape—Part 1: Definition and Conceptual Framework. International Organization for Standardization: Geneva, Switzerland, 2014.
  23. ISO/PRF TS 12913-2; Acoustics—Soundscape—Part 2: Data Collection and Reporting Requirements; ISO Technical Specification. International Organization for Standardization: Geneva, Switzerland, 2018.
  24. Zannin, P.H.T.; Calixto, A.; Diniz, F.B.; Ferreira, J.A.C. A survey of urban noise annoyance in a large Brazilian city: The importance of a subjective analysis in conjunction with an objective analysis. Environ. Impact Assess. Rev. 2003, 23, 245–255. [Google Scholar] [CrossRef]
  25. Dumyahn, S.L.; Pijanowski, B.C. Soundscape conservation. Landsc. Ecol. 2011, 26, 1327–1344. [Google Scholar] [CrossRef]
  26. Maris, E.; Stalen, P.J.; Vermunt, R.; Steensma, H. Noise within the social context: Annoyance reduction through fair procedures. J. Acoust. Soc. Am. 2007, 121, 2000–2010. [Google Scholar] [CrossRef]
  27. Sun, K.; Echevarria Sanchez, G.M.; De Coensel, B.; Van Renterghem, T.; Talsma, D.; Botteldooren, D. Personal audiovisual aptitude influences the interaction between landscape and soundscape appraisal. Front. Psychol. 2018, 9, 780. [Google Scholar] [CrossRef] [Green Version]
  28. Dubois, D.; Guastavino, C.; Raimbault, M. A cognitive approach to urban soundscapes: Using verbal data to access everyday life auditory categories. Acta Acust. United Acust. 2006, 92, 865–874. [Google Scholar]
  29. Schafer, R.M. The Soundscape: Our Sonic Environment and the Tuning of the World; Destiny Books: Rochester, NY, USA, 1994. [Google Scholar]
  30. Bowles, A.; Schulte-Fortkamp, B. Noise as an indicator of quality of life: Advances in measurement of noise and noise effects on humans and animals in the environment. Acoust. Today 2008, 4, 35. [Google Scholar] [CrossRef]
  31. Pheasant, R.J.; Fisher, M.N.; Watts, G.R.; Whitaker, D.J.; Horoshenkov, K.V. The importance of auditory-visual interaction in the construction of ‘tranquil space’. J. Environ. Psychol. 2010, 30, 501–509. [Google Scholar] [CrossRef] [Green Version]
  32. European Environment Agency. Noise in Europe 2014; EEA Report No 10/2014; Publications Office of the European Union: Luxembourg, 2014. [Google Scholar]
  33. Fiedler, P.E.K.; Zannin, P.H.T. Evaluation of noise pollution in urban traffic hubs—Noise maps and measurements. Environ. Impact Assess. Rev. 2015, 51, 1–9. [Google Scholar] [CrossRef]
  34. Aletta, F.; Oberman, T.; Kang, J. Associations between positive health-related effects and soundscapes perceptual constructs: A systematic review. Int. J. Environ. Res. Public Health 2018, 15, 2392. [Google Scholar] [CrossRef] [PubMed] [Green Version]
  35. Berkouk, D.; Bouzir, T.A.K.; Maffei, L.; Masullo, M. Examining the Associations between Oases Soundscape Components and Walking Speed: Correlation or Causation? Sustainability 2020, 12, 4619. [Google Scholar] [CrossRef]
  36. Dein, J.; Rüdisser, J. Landscape influence on biophony in an urban environment in the European Alps. Landsc. Ecol. 2020, 35, 1875–1889. [Google Scholar] [CrossRef]
  37. Hao, Z.; Zhan, H.; Zhang, C.; Pei, N.; Sun, B.; He, J.; Wu, R.; Xu, X.; Wang, C. Assessing the effect of human activities on biophony in urban forests using an automated acoustic scene classification model. Ecol. Indic. 2022, 144, 109437. [Google Scholar] [CrossRef]
  38. Farina, A. Soundscape Ecology: Principles, Patterns, Methods and Applications; Springer Science Business Media: Berlin/Heidelberg, Germany, 2013. [Google Scholar]
  39. Mullet, T.C.; Gage, S.H.; Morton, J.M.; Huettmann, F. Temporal and spatial variation of a winter soundscape in south-central Alaska. Landsc. Ecol. 2016, 31, 1117–1137. [Google Scholar] [CrossRef]
  40. Brown, A.L.; Kang, J.; Gjestland, T. Towards standardization in soundscape preference assessment. Appl. Acoust. 2011, 72, 387–392. [Google Scholar] [CrossRef]
  41. Dickinson, P.J. Outdoor Recreational Noise, a Review of Noise in National Parks and Motor Sport Activities; International Institute of Noise Control Engineering: Washington, DC, DC, USA, 2012. [Google Scholar]
  42. Aletta, F.; Kang, J.; Fuda, S.; Astolfi, A. The effect of walking sounds from different walked-on materials on the soundscape of urban parks. J. Environ. Eng. Landsc. Manag. 2016, 24, 165–175. [Google Scholar] [CrossRef] [Green Version]
  43. Engel, M.S.; Paas, B.; Schneider, C.; Pfaffenbach, C.; Fels, J. Perceptual studies on air quality and sound through urban walks. Cities 2018, 83, 173–185. [Google Scholar] [CrossRef]
  44. Sudarsono, A.S.; Lam, Y.W.; Davies, W.J. The effect of sound level on perception of reproduced soundscapes. Appl. Acoust. 2016, 110, 53–60. [Google Scholar] [CrossRef]
  45. Yamagata, Y.; Murakami, D.; Yoshida, T. Evaluating walkability using mobile GPS data. In Spatial Analysis Using Big Data; Academic Press: Cambridge, MA, USA, 2020; pp. 239–257. [Google Scholar]
  46. Bild, E.; Pfeffer, K.; Coler, M.; Rubin, O.; Bertolini, L. Public space users’ soundscape evaluations in relation to their activities. An Amsterdam-based study. Front. Psychol. 2018, 9, 1593. [Google Scholar] [CrossRef]
  47. Madanipour, A. Urban Design, Space and Society; Springer: Berlin/Heidelberg, Germany, 2014. [Google Scholar]
  48. Moura, F.; Cambra, P.; Gonçalves, A.B. Measuring walkability for distinct pedestrian groups with a participatory assessment method: A case study in Lisbon. Landsc. Urban Plan. 2017, 157, 282–296. [Google Scholar] [CrossRef]
  49. Villanueva, K.; Knuiman, M.; Nathan, A.; Giles-Corti, B.; Christian, H.; Foster, S.; Bull, F. The impact of neighborhood walkability on walking: Does it differ across adult life stage and does neighborhood buffer size matter? Health Place 2014, 25, 43–46. [Google Scholar] [CrossRef] [Green Version]
  50. Kim, Y.H.; Hwang, I.H.; Hong, J.Y.; Lee, S.C. Effects of vegetation on soundscape of an urban religious precinct: Case study of Myeong-dong cathedral in Seoul. Build. Environ. 2019, 155, 389–398. [Google Scholar] [CrossRef]
  51. Van Renterghem, T. Towards explaining the positive effect of vegetation on the perception of environmental noise. Urban For. Urban Green. 2019, 40, 133–144. [Google Scholar] [CrossRef]
  52. Botteldooren, D.; Andringa, T.; Aspuru, I.; Brown, A.L.; Dubois, D.; Guastavino, C.; Kang, J.; Lavandier, C.; Nilsson, M.; Preis, A.; et al. From sonic environment to soundscape. Soundsc. Built Environ. 2015, 36, 17–42. [Google Scholar]
  53. Bouzir, T.A.K.; Zemmouri, N.; Berkouk, D. Assessment and analysis of noise pollution in Biskra public gardens (Algeria). AIP Conf. Proc. 2018, 1968, 030069. [Google Scholar]
  54. Weinzimmer, D.; Newman, P.; Taff, D.; Benfield, J.; Lynch, E.; Bell, P. Human responses to simulated motorized noise in national parks. Leis. Sci. 2014, 36, 251–267. [Google Scholar] [CrossRef] [Green Version]
  55. Liu, J.; Kang, J.; Behm, H.; Luo, T. Effects of landscape on soundscape perception: Soundwalks in city parks. Landsc. Urban Plan. 2014, 123, 30–40. [Google Scholar] [CrossRef] [Green Version]
  56. Sanchez, G.M.E.; Van Renterghem, T.; Sun, K.; De Coensel, B.; Botteldooren, D. Using virtual reality for assessing the role of noise in the audio-visual design of an urban public space. Landsc. Urban Plan. 2017, 167, 98–107. [Google Scholar] [CrossRef] [Green Version]
  57. Jiang, S. Therapeutic landscapes and healing gardens: A review of Chinese literature in relation to the studies in western countries. Front. Archit. Res. 2014, 3, 141–153. [Google Scholar] [CrossRef] [Green Version]
  58. Axelsson, O.; Guastavino, C.; Payne, S.R. (Eds.) Soundscape Assessment; Frontiers Media SA: Lausanne, Switzerland, 2020. [Google Scholar]
  59. Gozalo, G.R.; Morillas, J.M.B.; González, D.M.; Moraga, P.A. Relationships among satisfaction, noise perception, and use of urban green spaces. Sci. Total Environ. 2018, 624, 438–450. [Google Scholar] [CrossRef] [PubMed]
  60. Koprowska, K.; Łaszkiewicz, E.; Kronenberg, J.; Marcińczak, S. Subjective perception of noise exposure in relation to urban green space availability. Urban For. Urban Green. 2018, 31, 93–102. [Google Scholar] [CrossRef]
  61. Sarkar, C.; Webster, C.; Pryor, M.; Tang, D.; Melbourne, S.; Zhang, X.; Jianzheng, L. Exploring associations between urban green, street design and walking: Results from the Greater London boroughs. Landsc. Urban Plan. 2015, 143, 112–125. [Google Scholar] [CrossRef]
  62. Calleri, C.; Astolfi, A.; Pellegrino, A.; Aletta, F.; Shtrepi, L.; Bo, E.; Di Stefano, M.; Orecchia, P. The effect of Soundscapes and Lightscapes on the Perception of Safety and Social Presence Analyzed in a Laboratory Experiment. Sustainability 2019, 11, 3000. [Google Scholar] [CrossRef] [Green Version]
  63. Cochran, W.G. Sampling Techniques; John Wiley and Sons, Inc.: New York, NY, USA, 2007. [Google Scholar]
  64. Tehran Municipality. Tehran Noise Pollution Report; Tehran Air Quality Control Company: Tehran, Iran, 2019.
  65. Carson, R. Silent Spring; Houghton Mifflin Company: Boston, MA, USA, 2009. [Google Scholar]
  66. Barber, J.R.; Burdett, C.L.; Reed, S.E.; Warner, K.A.; Formichella, C.; Crooks, K.R.; Theobald, D.M.; Fristrup, K.M. Anthropogenic noise exposure in protected natural areas: Estimating the scale of ecological consequences. Landsc. Ecol. 2011, 26, 1281–1295. [Google Scholar] [CrossRef]
  67. Beatley, T. Celebrating the Natural Soundscapes of Cities; The Nature of Cities: New York, NY, USA, 2013. [Google Scholar]
  68. Jacobs, J. The Death and Life of Great American Cities; The Yale Law Journal Company: New Haven, CT, USA, 1961. [Google Scholar]
  69. Truss, C.; Gill, J. Managing the HR function: The role of social capital. Pers. Rev. 2009, 38, 674–695. [Google Scholar] [CrossRef]
  70. Hall, P.M.; Spencer-Hall, D.A. The social conditions of the negotiated order. Urban Life 1982, 11, 328–349. [Google Scholar] [CrossRef]
  71. Gehl, J. Public spaces for a changing public life. In Open Space: People Space; Taylor & Francis: Oxford, UK, 2007; pp. 23–30. [Google Scholar]
  72. Aram, F.; Gharaei, F.; Habibi, M. A Survey on the Role of Periodical Markets in the Sociability of Neighborhood’s Residents and Social Interactions, Case Study: Hamedan. Arman. Archit. Urban Dev. 2018, 11, 135–145. [Google Scholar]
  73. Kowkabi, L. Revitalization of bio infrastructure network, an approach to urban regeneration: A case study of the qanats of Tehran. Urban For. Urban Green. 2021, 59, 127020. [Google Scholar] [CrossRef]
  74. Huang, Y.F. An inventory model under two levels of trade credit and limited storage space derived without derivatives. Appl. Math. Model. 2006, 30, 418–436. [Google Scholar] [CrossRef]
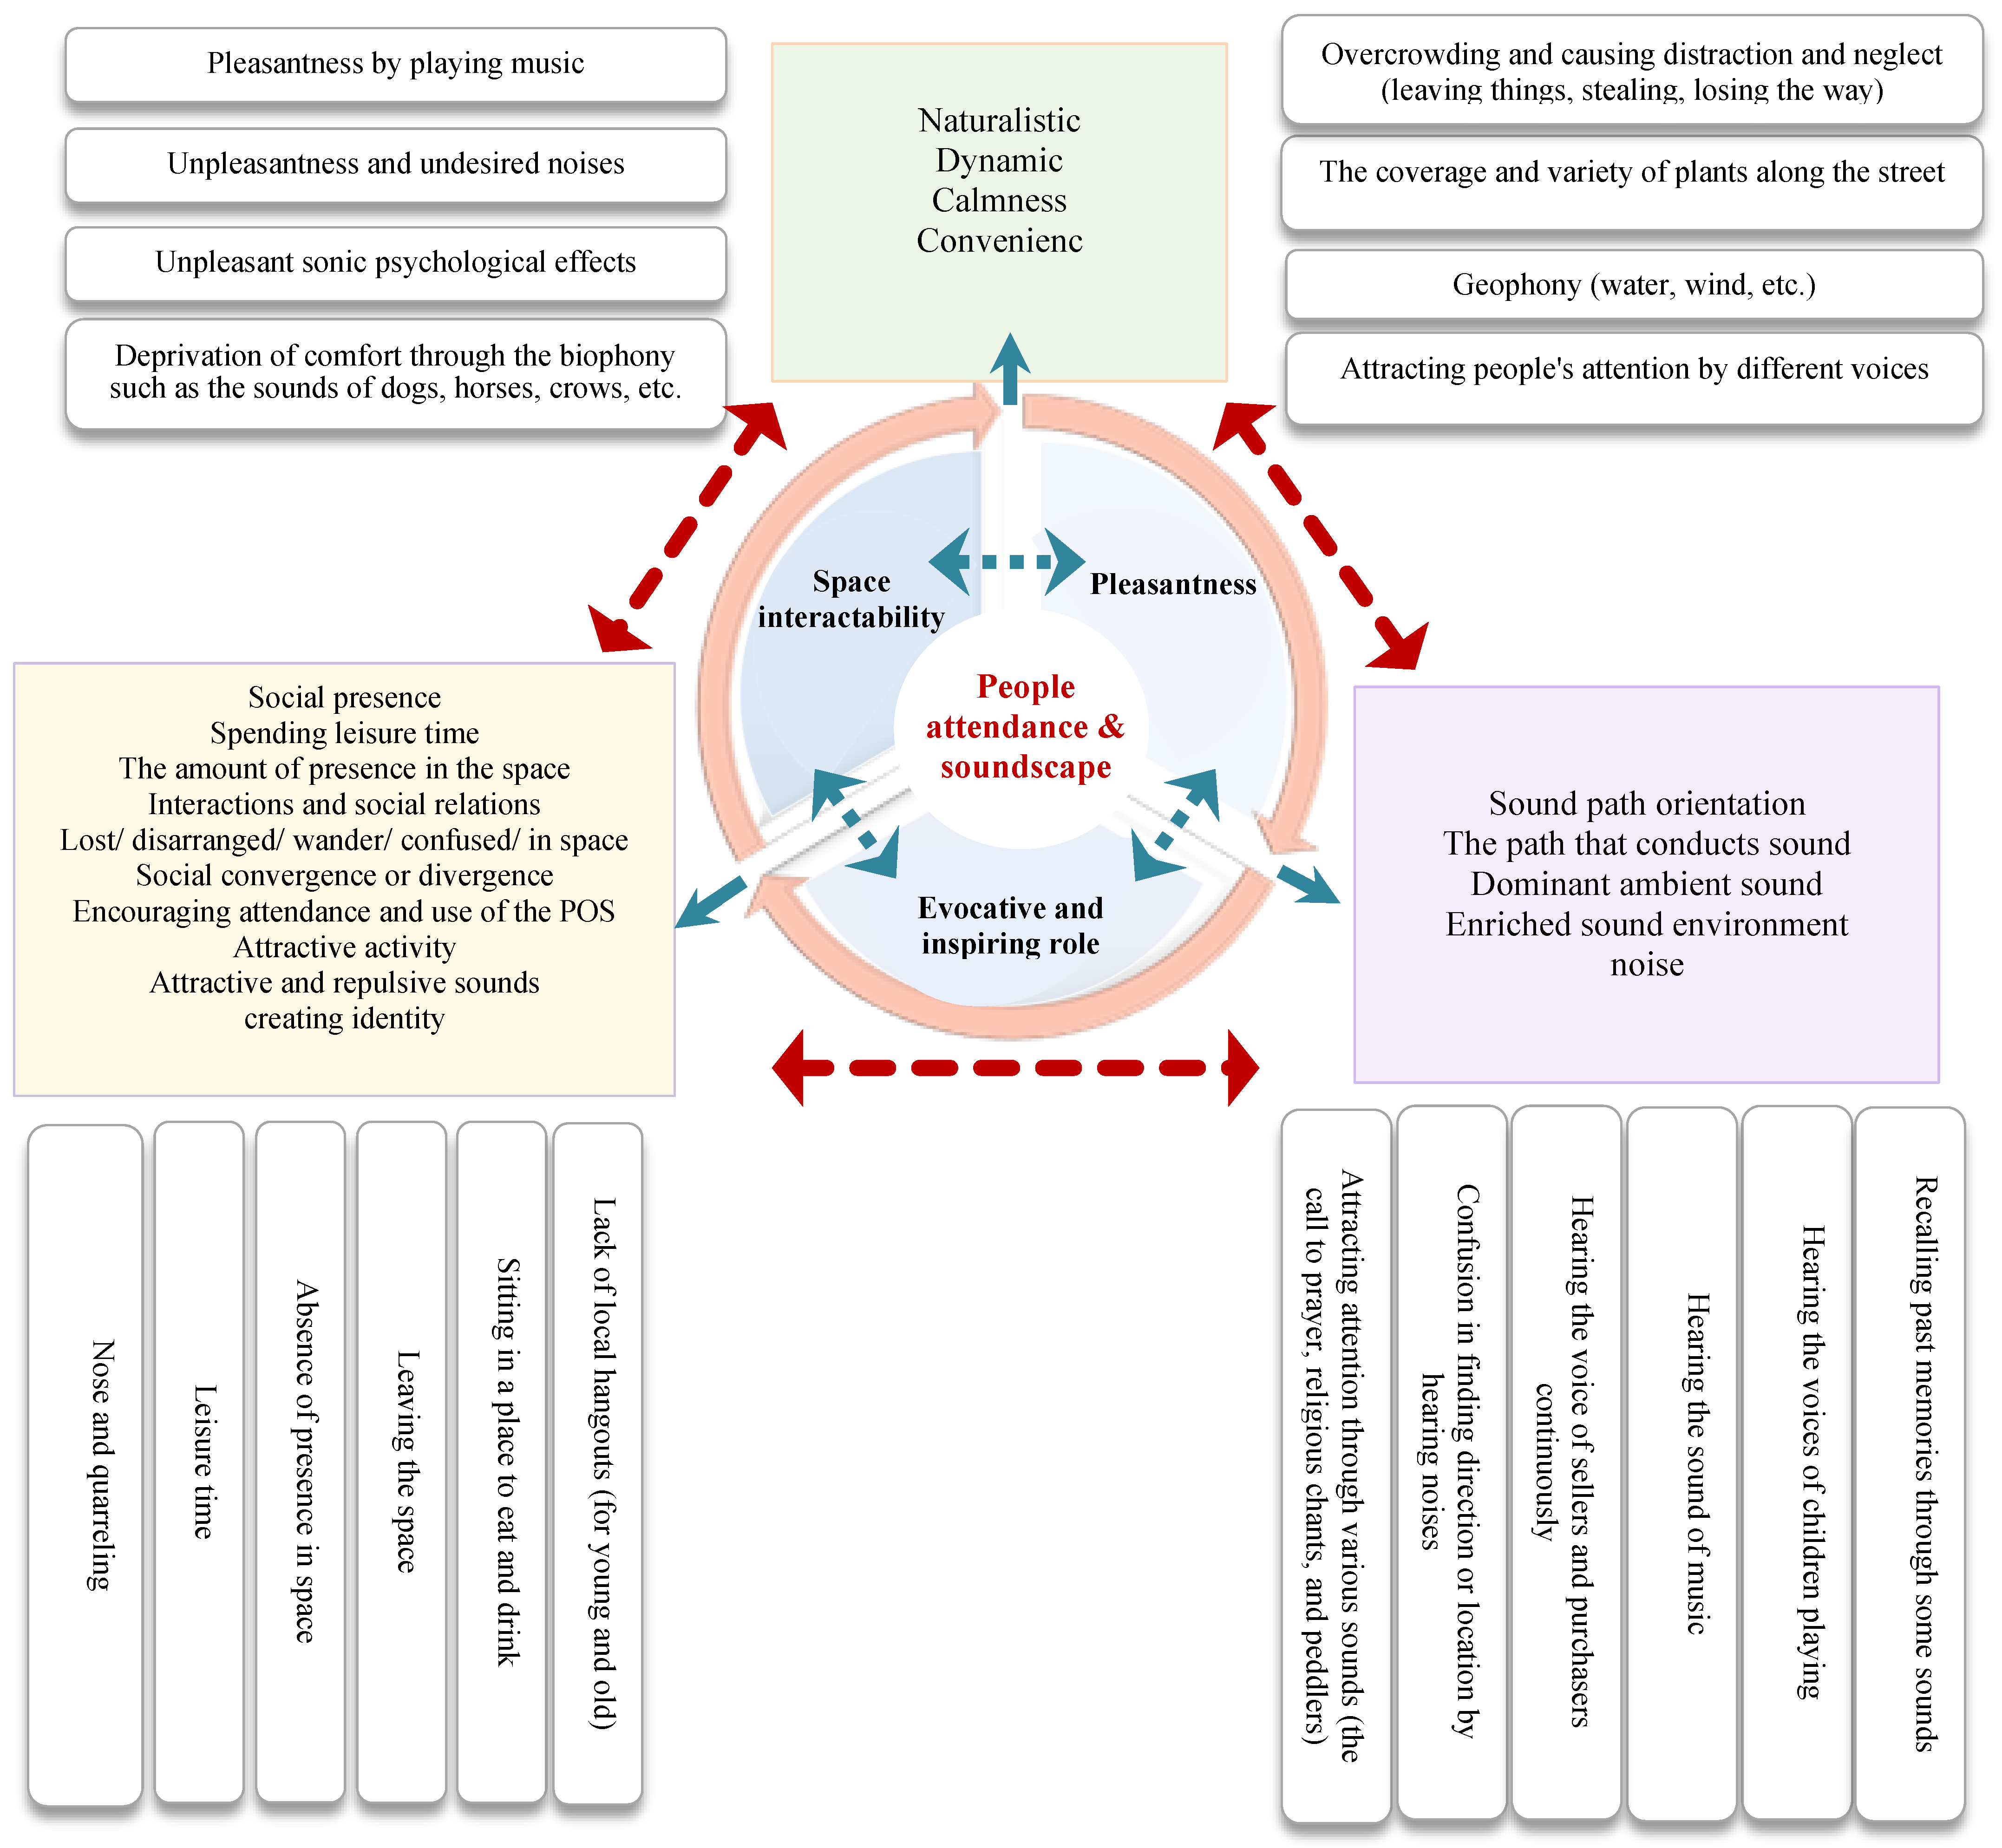
Figure 1. Effective indicators in people attendance in urban POS based on the qualities of the sonic environment.
Sustainability 15 04255 g001
Figure 2. The study area (15 Khordad Street) and historic, religious, governmental, and commercial featured places.
Sustainability 15 04255 g002
Figure 3. Sound level map of District 12 in Tehran, Adapted with permission from Ref. [64], 2019, Tehran Municipality.
Sustainability 15 04255 g003
Figure 4. Social and economic characteristics of the respondents in the study area.
Sustainability 15 04255 g004aSustainability 15 04255 g004b
Figure 5. Prioritizing sonics that disturb peace in the investigated case study.
Sustainability 15 04255 g005
Table 1. Pleasantness indicators affecting the sonic environment in the investigated case study.
Variable Very LowLow ModerateHigh Very HighMeanSDVariance
Unpleasantness and undesired noises3.910.828.446.110.83.40.9620.926
Unpleasant sonic psychological effects26.930.44911.83.60.8560.734
The coverage and variety of plants along the street6.928.4529.82.92.70.8430.711
Geophony (water, wind, etc.)14.744.131.45.93.92.40.946 0.896
Attracting people’s attention by different voices 3.913.738.231.412.73.31.0011.003
Pleasantness by playing music (calm)5.921.64918.64.92.90.9160.839
Deprivation of comfort through the biophony such as the sounds of dogs, horses, crows, etc. 20.643.124.55.95.92.31.0561.116
Lack of familiarity with the space4.931.437.323.52.92.90.9250.938
Reducing the prosperity of some activities (such as business)14.745.128.47.83.92.40.9680.938
The attractiveness of the space despite the loudness of the noise6.943.136.38.84.92.70.9230.852
Table 2. The evocative and inspiring role indicators affecting the sonic environment in the investigated case study.
Variable Very LowLow ModerateHigh Very HighMeanSDVariance
Attracting attention through various sounds (the call to prayer, religious chants, and peddlers)5.920.641.227.54.93.10.9580.918
Recalling past memories through some sounds4.917.65023.53.930.87790.771
Hearing the sound of music16.744.130.44.93.92.30.950.904
Hearing the voices of children playing22.55018.63.94.92.20.9920.985
Hearing the voice of sellers and purchasers continuously2.96.921.646.122.53.70.9710.943
The variety of sounds caused by different activities in space2.911.830.442.212.73.50.9620.926
Overcrowding and causing distraction and neglect (leaving things, stealing, losing track)16.742.226.58.85.92.41.0581.121
Confusion in finding direction or location by hearing noises14.726.530.424.53.92.71.11.211
Reducing the identity of the space13.74928.45.92.92.30.8970.805
Table 3. The space intractability indicators affecting the sonic environment in the investigated case study.
Variable Very LowLow ModerateHigh Very HighMeanSDVariance
Lack of people attendance18.65123.52.93.92.20.9210.85
Leisure time4.918.641.221.613.73.21.0561.116
Lack of local hangouts (for young and old)26.547.118.65.922.10.9280.862
Leaving the space14.740.232.48.83.92.50.9820.964
Sitting in a place to eat and drink4.918.64924.52.930.8670.752
Noise and quarreling15.744.132.44.92.92.30.9080.825
No returning to the space28.447.113.75.94.92.11.0461.095
Not bringing friends and family15.739.235.37.822.40.9150.839
Lack of presence of different age groups (children and elderly)7.837.345.15.93.92.60.8690.756
Favorable sounds and increase (continuity) attendance22.55220.62.922.10.850.723
Table 4. People attendance regression model based on the quality of the sonic environment.
Model SummaryANOVA a
RR SquareAdjusted R SquareStd. Error of the EstimatedfMean SquareFSig.
0.313 a0.0980.0600.893442.0962.6260.039 b
a. Predictors: (Constant), hearing the voice of sellers and purchasers continuously, deprivation of comfort through the biophony, unpleasantness and undesired noises, and unpleasant sonic psychological effectsa. Dependent variable: lack of people attendance
b. Predictors: (Constant), hearing the voice of sellers and purchasers continuously, deprivation of comfort through the biophony, unpleasantness and undesired noises, and unpleasant sonic psychological effects
Table 5. Regression model of some people attendance variables with pleasantness and evocative and inspiring role indicators.
Model SummaryANOVA a
RR SquareAdjusted R SquareStd. Error of the EstimatedfMean SquareFSig.
0.594 a0.3530.2490.79381142.1353.3870.000 b
a. Predictors: (Constant), all pleasantness and evocative and inspiring role indicatorsa. Dependent variable: not bringing friends and family
b. All pleasantness and evocative and inspiring role indicators
Disclaimer/Publisher’s Note: The statements, opinions and data contained in all publications are solely those of the individual author(s) and contributor(s) and not of MDPI and/or the editor(s). MDPI and/or the editor(s) disclaim responsibility for any injury to people or property resulting from any ideas, methods, instructions or products referred to in the content.