1. Introduction
Transportation and logistics planning are considered multifunctional tasks [
1] that introduce engineering, information and communication technologies, and urban planning [
2,
3]. Urban planning investigation emphasizes that it is inevitable to coordinate urban and transportation planning to create sustainable urban development (SUD) [
4,
5]. Furthermore, transportation is considered the main factor that should be regarded to develop the intelligence of a city [
6]. Smart transportation systems have enhanced municipal assets’ efficient usage [
7]. However, many approaches have been implemented with strategic views, concentrating on long-term land use and transportation policies [
8]. Several authors have attempted to estimate traffic or travel length and calculate urban land use [
9]. Other research evaluates transportation systems and often ignores urban factors [
10,
11].
Most academic studies on corporate mobility currently focus on the acceptance and effects of ride-hailing systems due to the recent emergence of taxi booking services [
12]. Nowadays, users are more inclined towards informal public transport modes [
13], known as ride-sourcing services, which provide real-time connectivity between drivers and passengers, and effectively enhance urban mobility by providing last-mile connectivity to the passengers [
14]. Although transport systems are typically large and complicated, the spatial and operational interdependence between them and other infrastructures makes it very difficult to identify potential bottlenecks and critical points [
15]. This problem is exacerbated by the fact that a transportation network’s criticality can be examined from different aspects, such as the type of transportation, operational layers (such as physical, communication, and energy), and specific probable failure scenarios [
16].
For two reasons, it is essential to identify critical points in a transport network over time. First, knowing which existing nodes are likely to be busier (congested) helps develop strategies to increase network flexibility [
4]. These strategies vary throughout the day and between weekends and holidays. Secondly, obtaining information about the node’s criticality facilitates managing public resources and allocating budget requests [
11]. In this regard, transportation planning becomes a beneficial approach that balances commuters’ changing travel demands with the sustainable views of the transportation system. Such a preventive answer is considered an essential feature of smart systems in designing a smart city [
17]. Recently, one of the significant challenges for these service providers has been forecasting demand and analyzing travel trends in various routes, significantly since customer behavior has changed since the advent of COVID-19 and has changed travel routes [
6].
Most simple analyses in this field cannot meet business needs, and therefore it is necessary to use newer and more sophisticated methods to extract knowledge [
1,
18]. A social network is defined as a social structure consisting of individuals or organizations connected [
19,
20] with one or several types of affiliations such as friendship, kinship, bargaining, information exchange, etc. [
12]. Combining these entities and the relationships between them creates a structure referred to in the social sciences as the social structure [
21,
22]. Social network analysis (SNA) has been developed aimed to find the patterns of communication between actors in network structure [
15,
23] and analyze them to explore the effects of such repetitive patterns in society and organizations [
9,
24].
According to the needs mentioned above and the features and capabilities of SNA analysis, this study was carried out to identify the central points in the smart city travel network, which can solve the challenge of predicting routes and corresponding analyses. Similarly, to increase competitiveness in the current state of business, the decision-making approach must be based on creating shared value and sustainability to maintain its resilience in market competition in the long run. The proceeds of this study can also provide essential and desirable points for municipal services such as municipalities, traffic police, and traffic headquarters.
2. Literature Review
Network theorists believe that norm-oriented approaches emphasize the culture and social procedure through which norms and values are internalized in actors’ existence. Following the normative orientation, a set of shared ideas holds people together. Nevertheless, network theorists reject such a view, arguing that the objective pattern of the links connecting community members should be emphasized [
25,
26]. Wellman [
22] argues that network analysts are trying to investigate the rules by which individuals and groups practically behave rather than examining beliefs about the behavior’s customs. According to this view, network analysts aim to prevent normative explanations of social behavior. They reject, for any reason, that is considered a nonstructural explanation. This explanation confines social process as a set of personal characteristics and internalized individual actors’ norms [
22].
The attention of network theory to a broader range of macro and microstructures is considered one of its distinctive aspects. According to the network theory, actors might be human beings [
27]. However, groups, institutions, and societies can also be considered actors. Links may be established at the macro-scale socio-structural level as at the micro-level. Reviewing the broad applications of social network analysis in management topics, we face a wide variety of various research the following examples can be listed.
Many studies were conducted on taxi booking systems from 2017 to 2022, and the methodology used by them is listed in
Table 1. For a better comparison of the changes in the literature as well as the final focus on the research of the last 5 years, these studies have been extracted from the Scopus database. As shown in the table, these studies did not use network analysis techniques. Thus, this study has used network analysis techniques and tools. Given that the COVID-19 incident is a new phenomenon, and no significant study has been carried out on online taxi systems, this study focuses on online taxi booking systems.
Almost all previous studies have used the retrospective taxi booking members’ questionnaire to link taxi booking and travel behavior. One of the most crucial goals of this research is to system conclusions that lead to an overview of system performance and behavior [
43]. This is important because it provides macro insights and makes it possible to accurately understand the system using quantitative and data-driven analysis and provide solutions for its development [
1,
26,
44]. The central focus in decision-making and presentation of final solutions in this research is based on the creation of shared value [
44] and sustainability, which try to provide legitimate conditions for the company to survive by seeing the interests of various system stakeholders, which increases competitiveness and has a competitive advantage.
3. Methodology
3.1. Case Study and Problem
The metropolis of Tehran, as the capital, is 225 years old and is the largest metropolis in Iran and the second metropolis in the Middle East after Cairo in Egypt, which has 22 districts and 355 neighborhoods. Districts 2, 1, 6, 22, and 3, respectively, are the most dense, and districts 17, 10 and 18, respectively, are the least dense districts. Although public transportation in Tehran is far better-equipped than other cities, it is not in a good condition from the viewpoint of intelligence. Additionally, traffic problems are severe; for example, there is 1 car for public transportation for every 11 people in Tehran, but this amount of cars is suitable for 4 people. Also, there has been a bus service in Tehran since 1927, and the reason for the low popularity of this is due to the weak infrastructure, low speed, many delays, annoying traffic, and excessive passengers. On the other hand, with 7 lines, Tehran Metro is the largest intracity transportation network in Iran and provides more smart ways of commuting for people. Additionally, there are 4 types of taxis in Tehran: ride-hailing taxis, sightseeing taxis, line taxis, and telephone taxis, and among them, only the first type is considered as smart transportation.
Considering the mentioned background, the major problem of this study arises from the fact that the ride-hailing company under study (which, due to some considerations, cannot be named) realized that significant changes have occurred in its smart transportation network during and after the COVID-19 pandemic in 2019. The company under study is one of the ride-hailing providers in Iran, which offers passenger and motor courier transportation services. The company noticed problems with the system that increased passenger load. Government decisions were repealed to curb traffic during traffic hours, and within the scope of the traffic plan, private cars were allowed to travel throughout the city without any restrictions. Subways and public transportation were unreliable for many other communities, and people were sought after due to overcrowding. Thus, a group of people who did not use personal vehicles turned to ride-hailing services by reducing their use of public transport, and the use of these systems increased [
39,
45,
46].
Providing peace of mind to customers has been the goal of solutions considered by companies in this field to deal with COVID-19, such as using gloves and masks, equipping the driver and passenger separating space, and suchlike. However, changing customers’ and drivers’ behavior would inflict more damage to the system, so it is necessary to address it. Therefore, as a research team for the company, the present team plays an essential role in solving the problem. The social media analysis method was chosen to solve this problem because it creates a holistic and systematic view of changing the behavior of customers and drivers. Using the shared value creation and sustainability perspective is necessary for the analysis and conclusions to provide practical suggestions so that all stakeholders can be considered and bring the system closer to competitive conditions in the current situation. The current situation reflects the sensitivity of customers and society to environmental, social, and civil rights issues, leading companies to serve to obtain maximum satisfaction from stakeholders.
3.2. Model Inputs
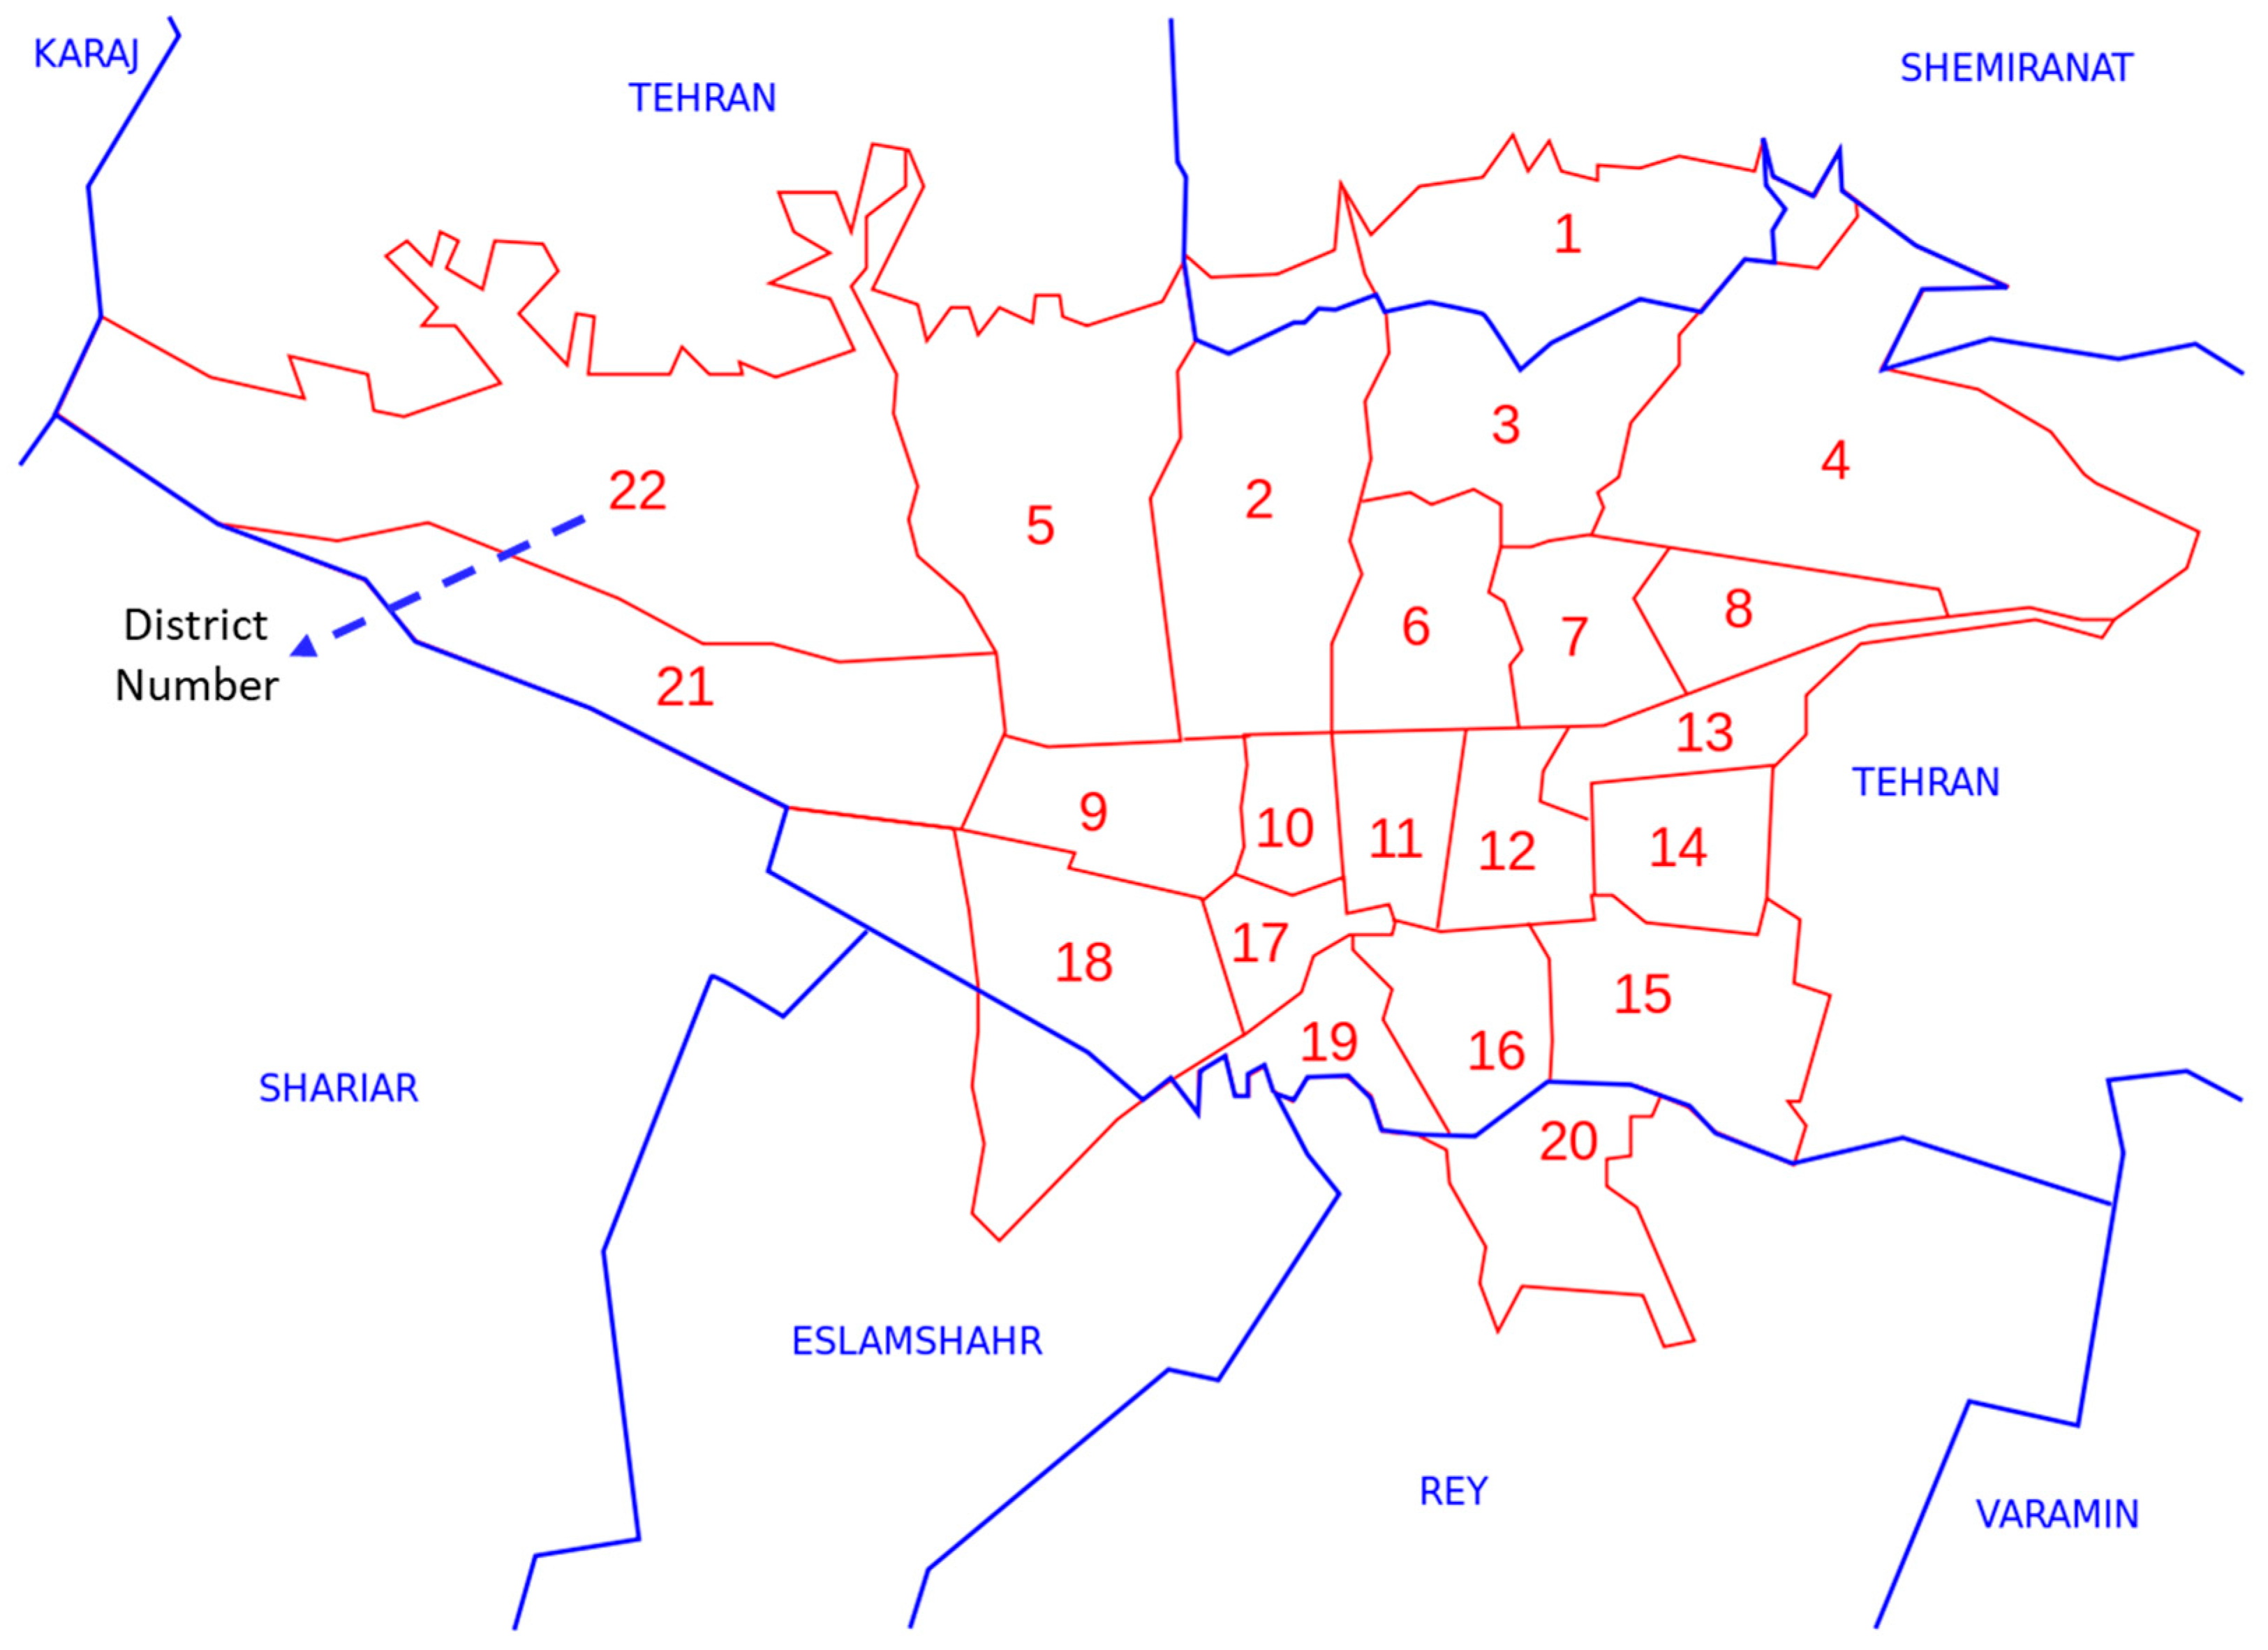
Our final input is a two-dimensional matrix (22 × 22), the average number of 20-day trips in July, 2021. The rows and columns are the 22 metropolitan districts of Tehran. Each point in this matrix equals the number of city trips recorded in the smart taxi booking system between the two districts. The diameter of this matrix contains the number of city trips within each district. This is an asymmetric matrix. In other words, the number of trips made from district I to district J is not necessarily equal to the number of trips made from district J to district I. For a holistic view of all districts and their situations, see
Figure 1.
3.3. Methods Description
The following comparison criteria have been used to detect the network’s strategic districts: degree centrality (DC), special vector centrality, and hub and reference scores. Degree centrality (DC) is a criterion of local centrality calculated from the direct neighborhood links. DC is considered the most creative idea for the validity of a node in a group [
26,
27] regardless of the overall structure of the graph. According to the following formula, the idea is the average number of concatenated bonds to nodes, known as the first-degree node in graph theory.
is the number of vertices, the adjacency matrix component ∝ (i, j) is 1, if there is a direct relationship between vertices i and j (i ≠ j), otherwise it is zero. A graph adjacent matrix to a graph is a matrix that represents the proximity of individual nodes to each other. The matrix adjacency of the graph is symmetrical without direction; in other words, ∝ (i, j) = ∝ (j, i). If the matrix adjacent to the graph is not symmetrical and ∝ (i, j) ≠ ∝ (j, i). Nevertheless, in the case of graphs with weighted bonds, the adjacency matrix component A ∈ R
(n *
n) is calculated using the following equation:
In the case of a directed graph, the in-degree centrality of a node is equal to the number of input links to that node, and out-degree centrality is equal to the number of output links of that node, which are calculated using the following equation:
where
(i) is the input degree,
out (i) is the output degree,
(i) is the degree of node i. The above relationships are valid for the weighted graph because the graph’s bonds-related weights are applied to the weighted matrix vortex matrix. The values of the centrality criteria are the same for all nodes except the weighted degree centrality and special vector centrality because the graph of the smart transportation network is a regular taxi booking system. As a result, no information is obtained using other centrality criteria to analyze the network.
The network graph proximity matrix is used to calculate the quantities of input degree, output degree, and the total degree of an i district in the smart transportation network of the smart taxi locator system, which is discussed in Equation 3. In other words, the smart transportation network can be represented at any time by the vectors n × 1, d
in(i), d
out (i), and d
tot(i). The significance of a node in a network is obtained by the particular vector centrality criterion (Borgatti 2005). The specific vector centrality of one node increases if it has a solid relationship to nodes with high specific vector centrality. The adjacency matrix A can calculate the specific vector centrality vector e
→, given that the special vector corresponds to the largest eigenvalue of the adjacent matrix A. However, the veracity of the eigenvalues A is guaranteed under conditions where the adjacency matrix A is symmetrical. This leads to the centrality of the special vector as a useful measure for nondirected graphs. In contrast, the smart taxi locator system’s smart transportation network is a weighted directed graph. Creating symmetry for the proximity matrix is applying the concept of special vector centrifugation in directional graphs; for example, the proximity matrix can be symmetrized using the following equation.
The weight of each edge of a nondirectional graph is equal to the average number of city trips in the two corresponding edges in the directional graph in the smart transportation network. The power method was used to calculate the centrality of the special vector in this research.
Hubs and references are introduced for directed networks within the Hyperlink-Induced Topics Search (HITS) [
9,
47]. According to the basic idea, there are two important nodes in directional networks: hubs and references. An important hub powerfully points to many important references. In comparison, the important references are the nodes referred to by many important hubs. Kleinberg developed an algorithm based on the structure of web mining called thematic search induced by the Hyperlink.
WSM seeks to explore the structure of hyperlinks through the interlink level, while web mining content focuses on the structure of hyperlinks at the in-document level. WSM creates a structured summary of web pages through a web graph. Thus, web pages as nodes and hyperlinks as edges connect two related pages. The HITS algorithm assumes a set of reference pages for each user-generated query relevant, popular, and focused on the query. This algorithm also assumes a set of hub pages containing useful links to related pages, including links to many references. The HITS considers the web as a directional graph G (V, E), such that V is a set of vertices representing pages, and E is a set of edges associated with links. A directed link (p, q) represents a link from page p to page q. Likely, the search engine will not retrieve all relevant pages for the query, so the first pages retrieved by the search engine are a good starting point for moving further forward. However, relying on the original pages alone does not guarantee that the hub and reference pages will be retrieved effectively. HITS uses a convenient way to find user-related query information to solve this problem.
The Hyperlink-Induced Topic Search (HITS) algorithm works in two necessary steps, sampling and hub, and reference. The first step collects a set of related pages for the user query. In other words, the sub-graph S is retrieved from G, which is rich in the reference pages. The algorithm starts with the root set R (about 200 to 300 pages); this algorithm is selected from the list of results of a typical search engine. The set S is obtained starting from R. It should be noted that this S t is relatively small, rich in query reference pages, and contains most of the strongest references. Pages in the R root collection should include links to other references, if any. The HITS algorithm extends the R root set to the base S set using the following algorithm:
Input: the set of all roots of R, output: the base set S.
First, consider the set S equal to the set R.
Apply the steps 3 to 5 for each p∈S.
Consider T as the set of all the pages that the set S refers to.
Consider F as a set of pages that refer to the set S.
Consider the sum of S = S + T as part or all of F.
Remove all links with the same domain.
Return S.
The set S probably contains approximately 100 to 3000 pages. Sorting the hubs and references based on the number of inbound and outbound links is a simple approach to finding hubs and references from the S set. This approach works well in some situations but does not always work well. Before starting the second step of this algorithm, HITS removes all links between pages on the same website or the same domain in step 5. The argument is that links between pages on a shared website are circulating the relevant website, not for references. Furthermore, if multiple links from one domain point to a single page outside the domain, in this case, only a minimal number of these links are counted instead of all links. The second step finds hubs and references using the output of the sampling step:
Input: the base set, output: the set of hub set and reference.
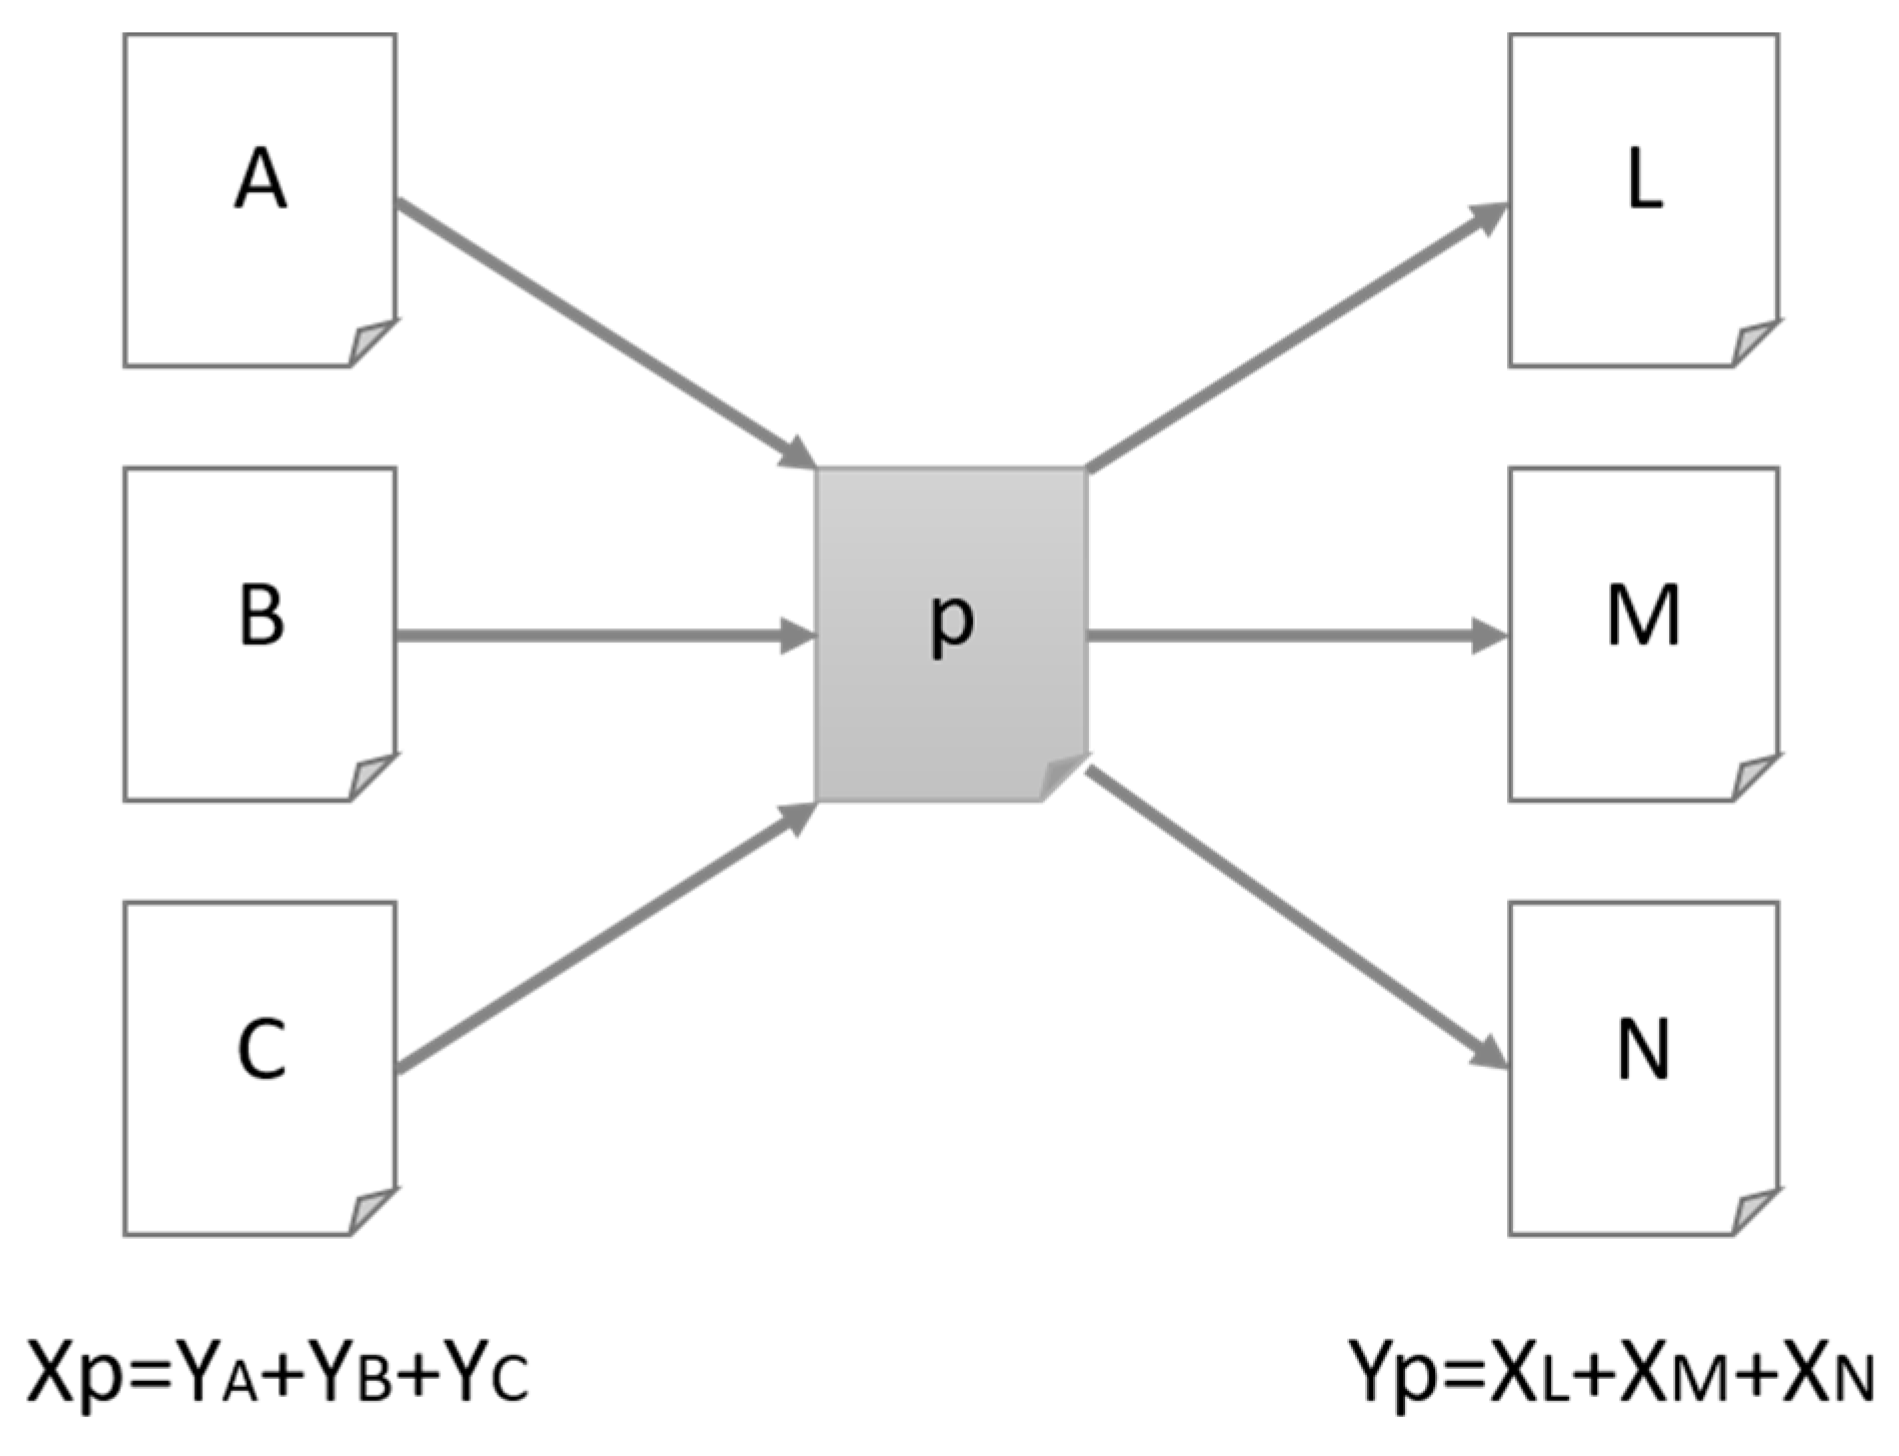
Consider a page p with a nonnegative reference weight of xp and a hub weight of yp. Pages with a relatively large reference weight of xp are classified as references. Similarly, pages with a large yp hub weight are categorized as hubs.
The weights are normalized so the square of each of the weights becomes one.
For page p, the value of xp is updated to the sum of the yp weights of all q pages linked to p.
The value of yp is updated to the sum of the xp weights of all pages q to which there is a link from p.
If the output conditions are not met, the algorithm returns to step 2.
A set of pages with the highest xp weights (references) and a set of pages with the highest yp weights (hubs) are specified.
Relevant weights are assigned to hubs and references. A reference that is referenced by a large number of high-rated hubs is considered a strong reference. A hub that refers to a large number of high-rated references is considered a popular and influential hub. If sets B (p) and R (p) represent a set of reference pages of page p, respectively, the scores of hub and reference of page p are calculated as follows:
The hub and reference points are calculated, as shown in
Figure 2. Pages are ranked based on their hub and reference points [
48].
A strong hub refers to a district with a high degree of output to strong references (districts with a high degree of input from strong hubs) in the context of the smart transportation network. The scores of a hub (h
→) and references (
) can be specified repeatedly [
49] or the hub matrix
and the reference matrix
are determined by considering the dominant special vectors of, respectively. Moreover, they can be obtained using the dominant special vector A [
8], which is calculated using the following equation:
Given that
A is symmetrical, it is guaranteed that the largest eigenvalue and the eigenvector corresponding to it are real. If
A is a
matrix, then A is a 2n × 2n matrix. The first n sentences of the dominant special vector
A correspond to the directional hub graph scores, and the second n sentences correspond to the scores of the references [
8]. In the present study, the hub’s score is equal to the dominant eigenvector of the hub matrix
AAT. The reference score equals the dominant eigenvector of the reference matrix
ATA.
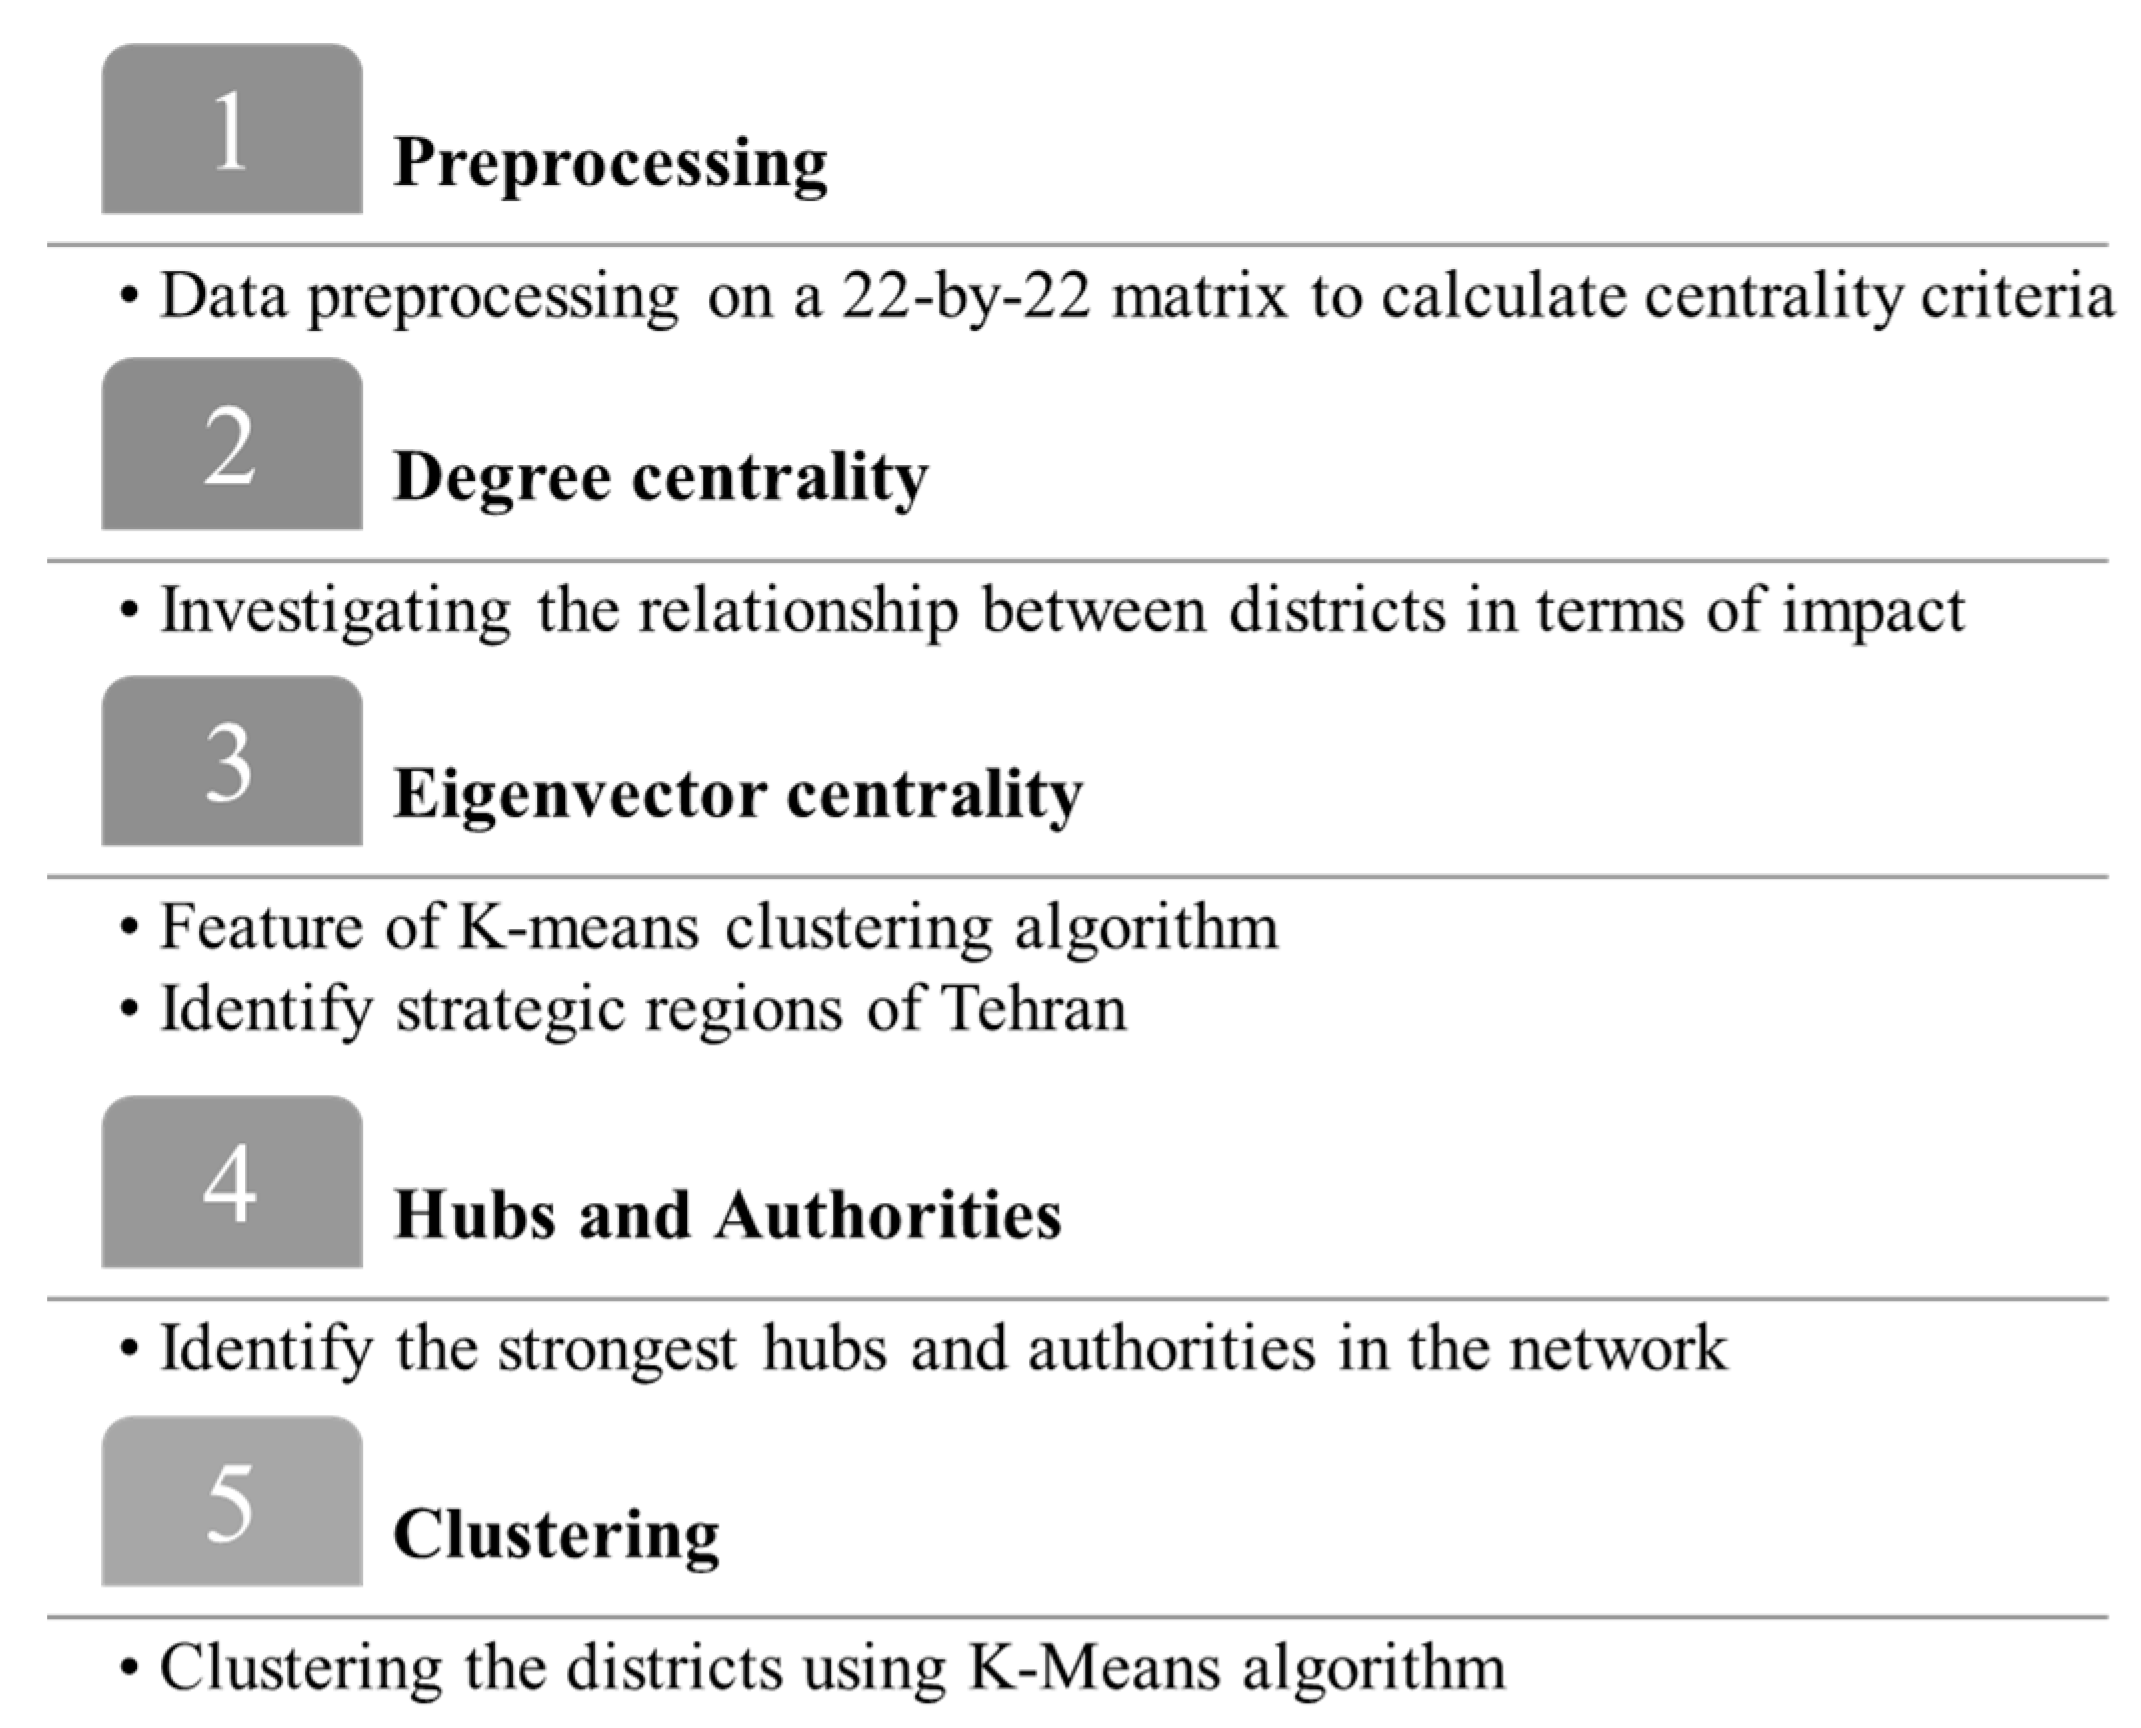
The K-means clustering algorithm was selected due to the low volume of research data and, at the same time, the high efficiency of this algorithm. The K-means algorithm is an iterative algorithm that divides a database into a predetermined number (K) of separate, nonoverlapping subgroups (clusters). Each data point has only one belonging to the group. The algorithm tries to make the data points within the cluster as similar as possible, while the data points in the clusters are as different as possible. K-means assigns data points to a cluster where the sum of the square points of the distance from the centroid (the arithmetic mean of all data points belonging to the cluster) is minimal. By and large, the brief steps of implementing the methodology are shown in
Figure 3.
The network used in this study has specific features. For example, it is fully connected. All the nodes of the network that represent the districts of Tehran are connected in pairs. In the meantime, the weight of the links that connect the districts is of great importance. The weight of each link indicates the number of trips made between the two ends of the link. Thus, in the present study, some centrality is meaningless because its value is equal in all districts. For example, the intermediate centrality or proximity of all districts of our network has the same value.
Furthermore, it makes sense to use other centralities when considering the links (e.g., degree centrality and eigenvector centrality). In addition to this limitation, according to the HITS algorithm, two groups of nodes in a network are of great importance, called hubs and references. Thus, strong hubs and references can be identified by calculating the hub and reference points of the smart transportation network districts of the smart taxi booking system. The districts are also be ranked based on the above centrality criteria, and new strategic districts are identified in the current research network. Furthermore, the relationship between districts in terms of effect and effectiveness can also be examined. Finally, the districts of Tehran are ranked based on the criteria of weighted degree centrality, and eigenvector centrality is clustered.
4. Results and Discussion
Given that the data received from the relevant company was not structured and unsorted, the data must be converted to the program’s desired format to import the data in the gaffe and network illustration program. Furthermore, the data had to be converted to the appropriate data structures of the relevant Python libraries to calculate the relevant centrality criteria and cluster the districts. For example, the data were first converted from Excel file format to data frame format using Pandas to perform other calculations. The data were also converted from data format to the matrix format using NumPy methods to calculate the hub and reference scores.
Table 2 shows the system input data:
Degree centrality is considered an indicator for identifying influential local nodes. Thus, the most significant districts in the smart taxi booking system’s smart transportation network are identified by calculating and ranking the districts based on it. Identifying the most effective districts to improve the services of the smart system is used in those effective districts, which leads to an increase in the efficiency of the system and earning more profit. For this purpose, the relationship between districts in terms of effect and effectiveness. Influential districts are defined as the districts from which most urban trips are made to other districts, and affected districts are the districts to which most urban trips are made from other districts. Additionally, the degree of centrality of input and output was used as features of the K-means clustering algorithm in the present for clustering districts. Furthermore, degree centralities were used to rank Tehran districts to identify strategic districts.
According to the eigenvector centrality view, a node is more influential and central if its neighbors have more centrality value. The values of this centrality for network nodes were used as the third feature of the K-means clustering algorithm. The eigenvector centrality and other centrality criteria were used to rank districts to identify strategic districts. Programming was carried out in Python language to calculate this centrality. For this purpose, the network graph was obtained from the network data. The input parameter was imported to the Power function (the Power function is used to calculate the centrality of the eigenvector centrality of the districts). Other input parameters included the maximum number of iterations of the Power function, which is 100 here; error tolerance was assigned to each node to check the algorithm’s convergence; initial values in the dictionary format; and the weights of the graph links. After the input parameters were determined, the values of this centrality for the districts of Tehran in the smart transportation network of the smart taxi booking system were determined. Identifying hub districts in logistics networks is crucial. There is a positive correlation between hub score, degree centralities, and eigenvectors [
11]. Most of the trips from the smart taxi booking system’s smart transportation network hubs take place in other districts (degree centrality) in this study. The destinations of these hubs also receive more trips (eigenvector centrality). In other words, according to the definition of the HITS algorithm, on the one hand, the purposes of hubs are districts with high reference scores. On the other hand, the purposes of hubs, like hubs, are important districts, according to the definition of eigenvector centrality. However, it does not have to be an intermediate hub between districts. In other words, it does not have to have a high intermediate centrality. Also, a hub does not need to be close to other districts. In other words, it has a high degree of proximity. This is true in networks that are frequently connected by public transport. Because all nodes are connected in the logistics network, hubs can be fully functional without being located between districts (having high intermediate centrality) or close to other districts [
11].
Coding was used to calculate hub and reference points of districts such as eigenvector centrality. The hub score of the districts is equal to the dominant eigenvector components of the hub matrix and the reference score of the districts is equal to the dominant eigenvector components of the reference matrix . The NumPy and Linaleg packages were used to calculate these two points. Matrix calculations, including point multiplication calculus and matrix transmutation, were performed using NumPy and Linaleg to calculate the principal value and specific vector of the two hub and reference matrices. Thus, the most vital hubs and references in this research network were identified. These scores were used as a benchmark for identifying strategic districts in the research network in the present study.
To identify strategic districts in the network of the present study, their ranking was made based on the criteria of weighted in-degree centrality, weighted out-degree centrality, weighted degree centrality, special vector centrality, and hub and reference scores.
Ranking the metropolitan districts of Tehran was conducted based on three criteria: weighted degree centrality, weighted in-degree centrality, and weighted out-degree centrality.
Table 3 shows the relevant rankings based on the above criteria.
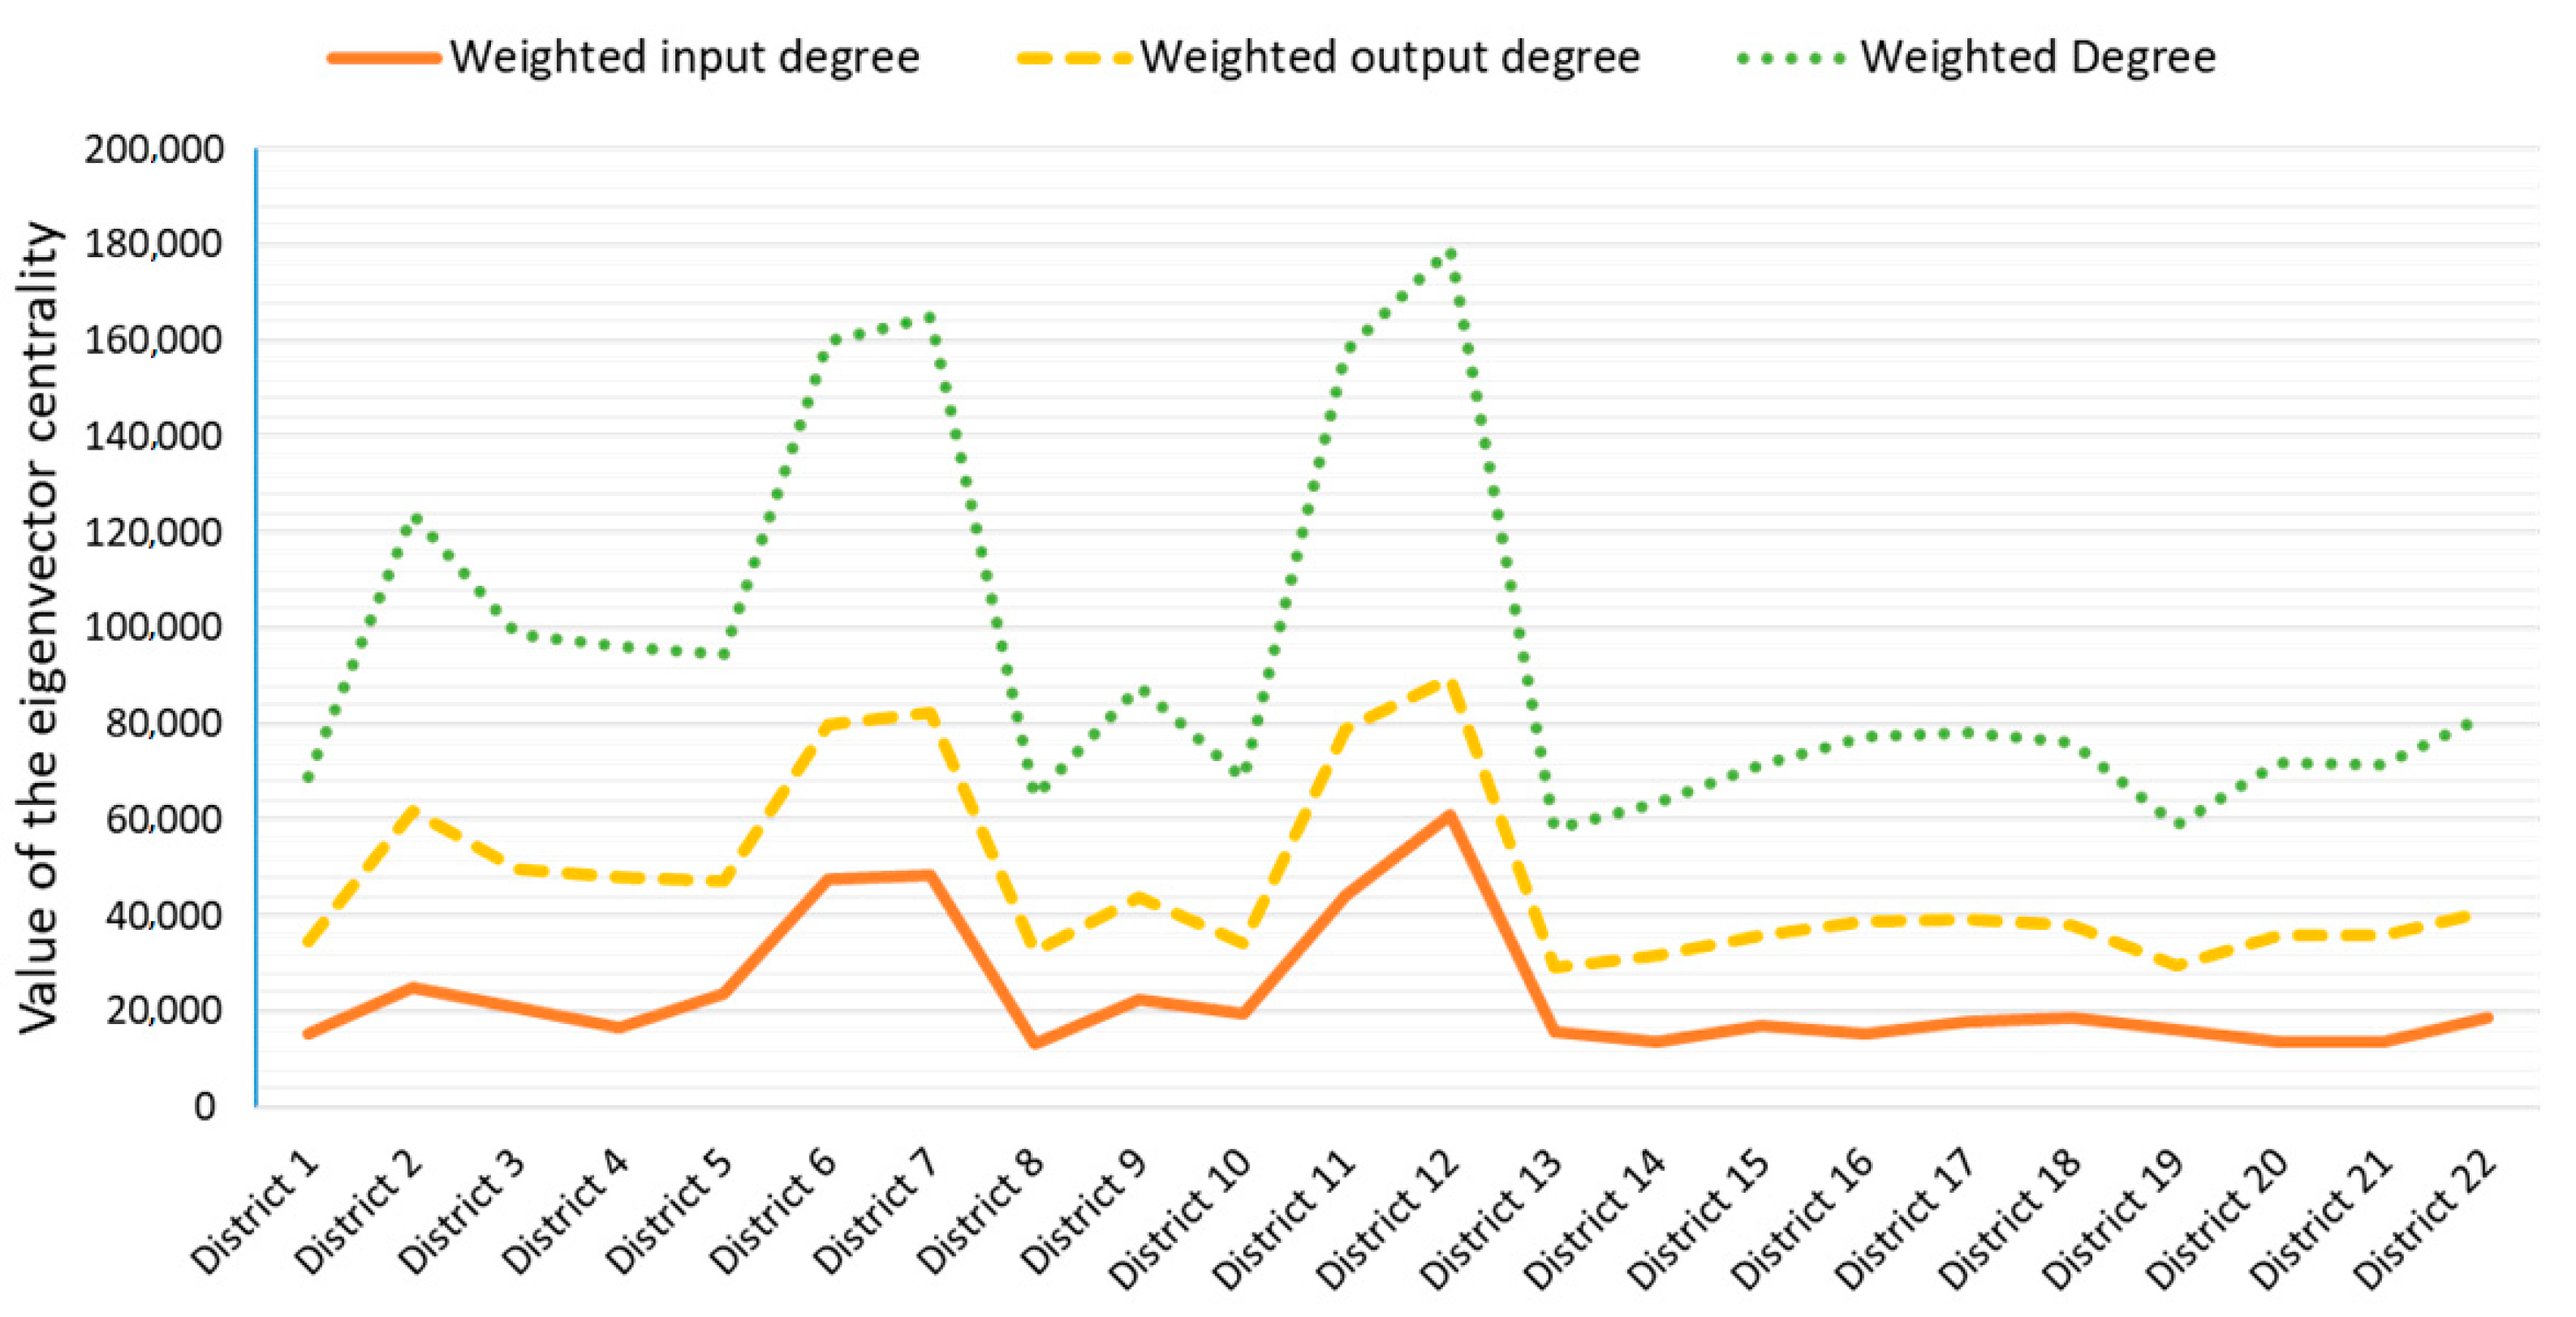
According to the degree centrality criterion, District 12 of Tehran earned first rank. According to the in-degree centrality, District 12 of Tehran was ranked first. According to the out-degree centrality, District 12 was ranked first. The comparison depicted as
Figure 4.
As mentioned earlier, the high value of the eigenvector centrality indicates the connection to important and strategic nodes. Therefore, districts in the top rankings are considered strategic in communication. The districts of Tehran in the smart transportation network of the smart taxi booking system are ranked based on the eigenvector centrality in the following
Table 4.
The
Table 5 shows the hub and reference points of Tehran districts in the smart transportation network of the smart taxi booking system. In the network of this study, a strong hub refers to a district with a high degree of output to powerful references (districts with high in-degree input from strong hubs).
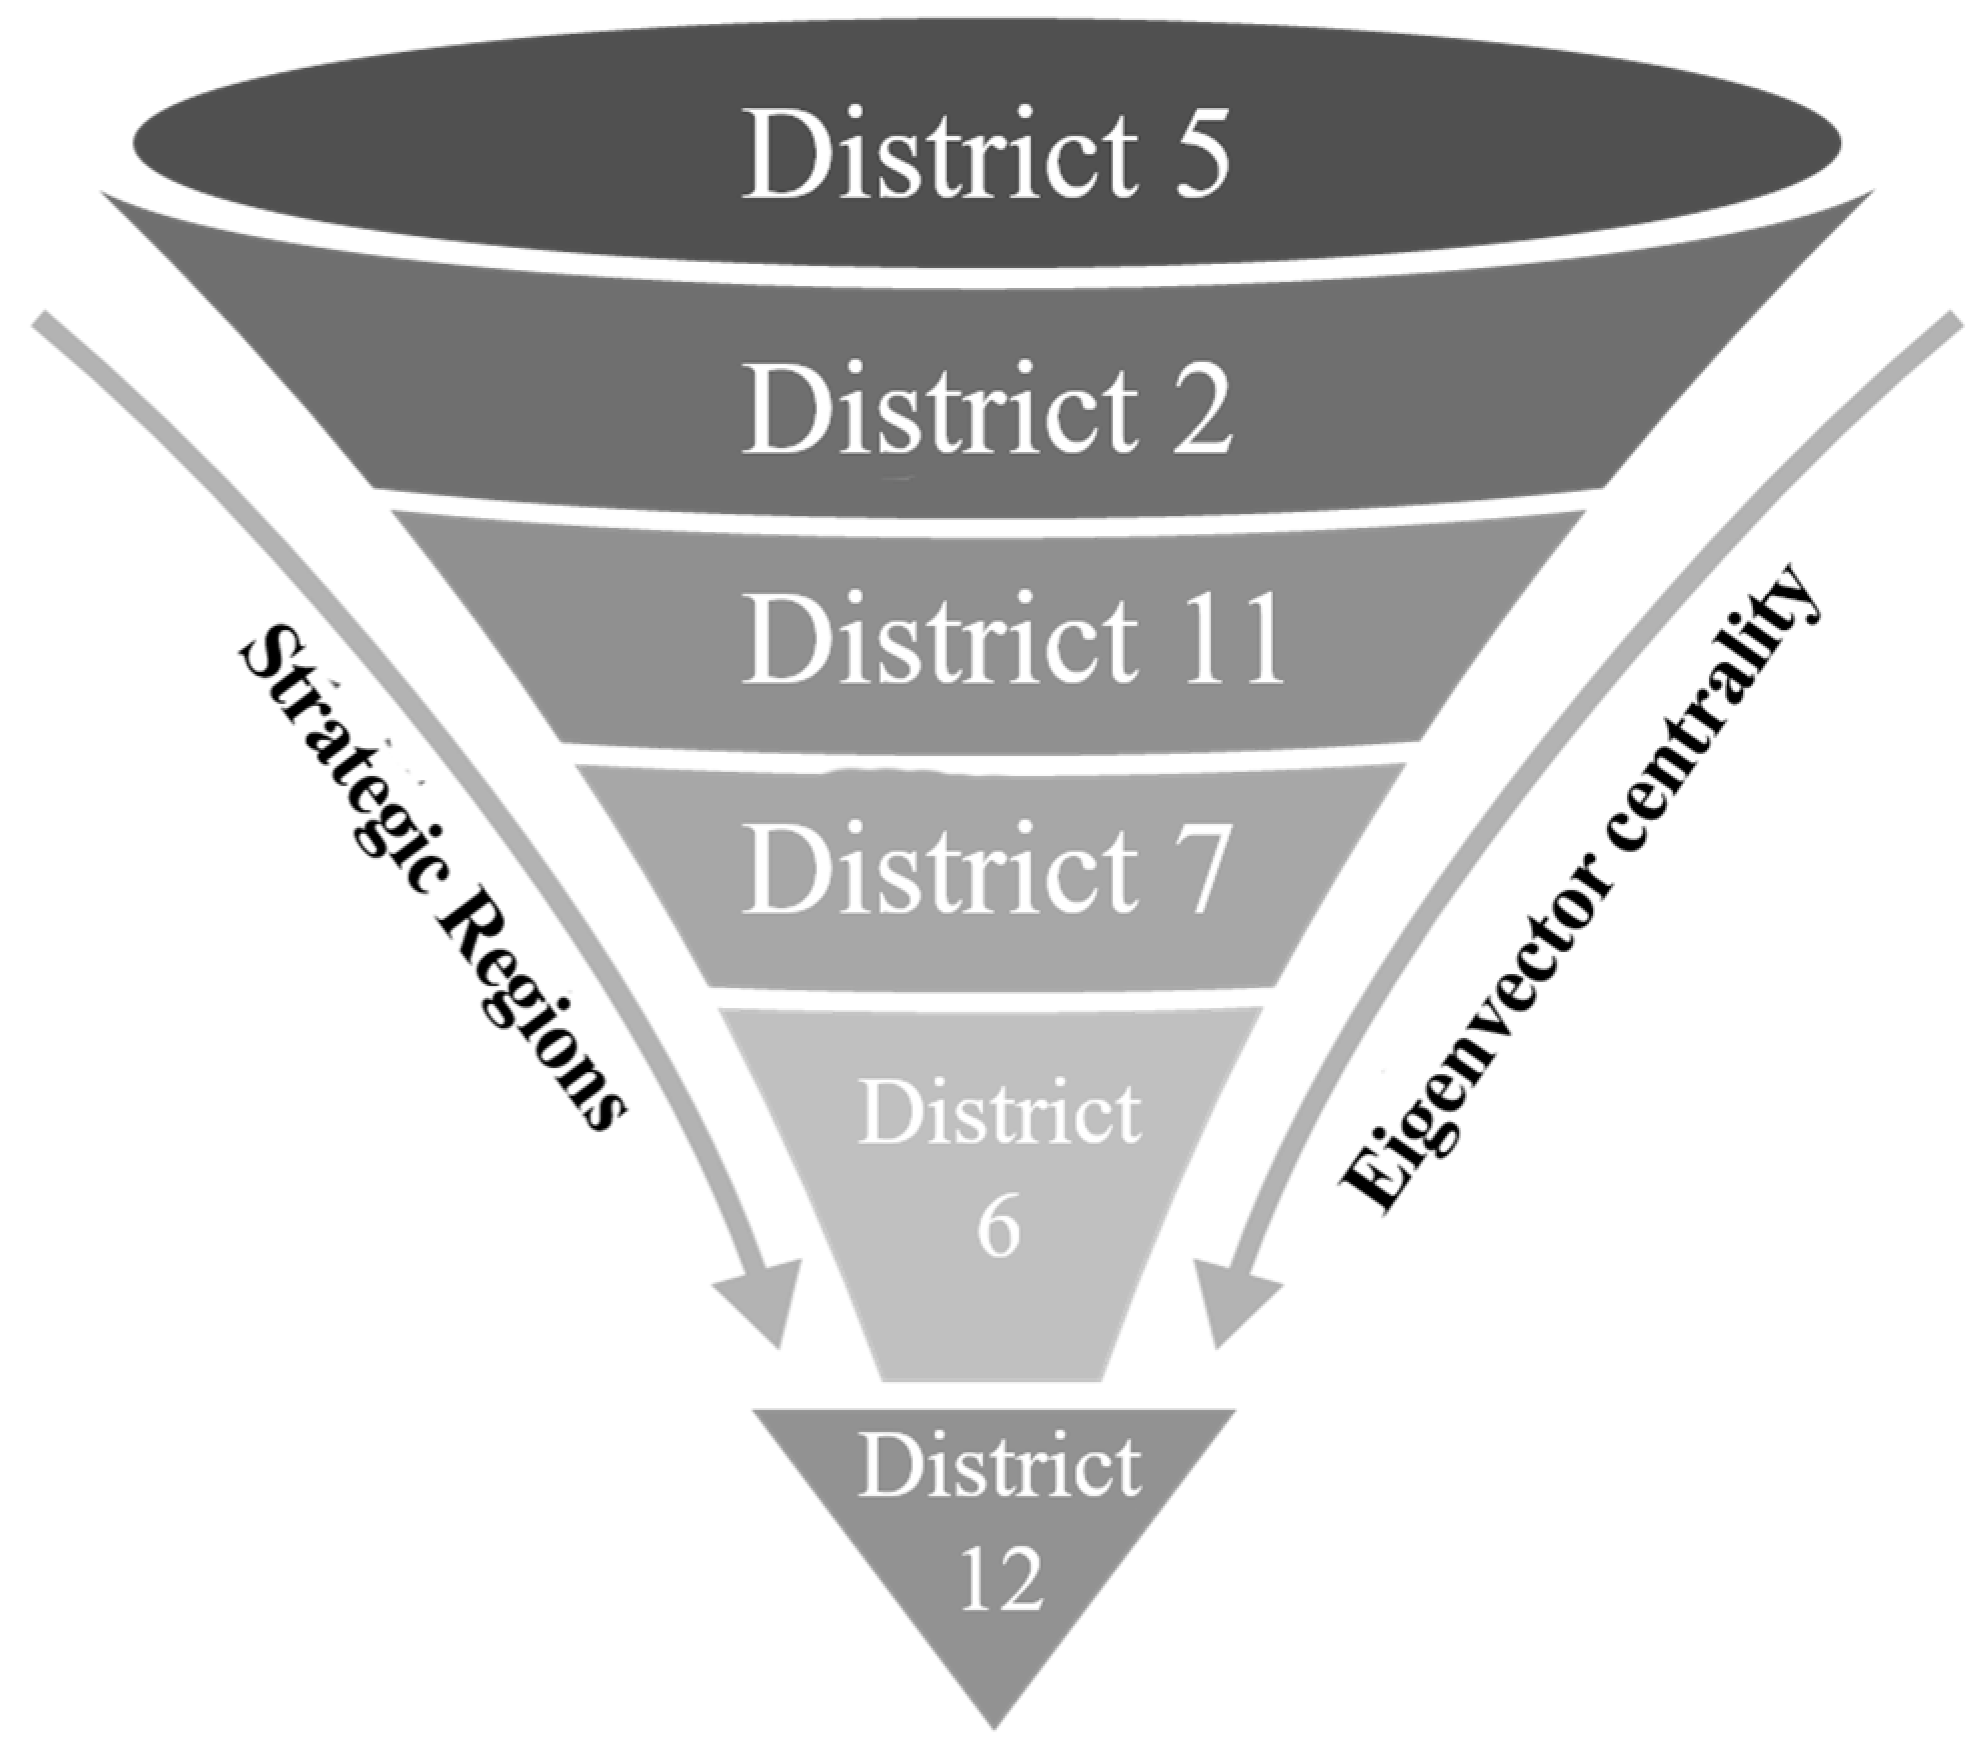
According to the hub points of Tehran, District 2 is the strongest hub in the network in this study. The strongest reference in the urban research network of the present study belongs to District 12. Then, strong hubs and references in the network of this study are introduced.
According to the modern economic geography theory, the infrastructure of a local district is very important in determining whether a district is a hub [
50]. Thus, the hub, being strong in the above five districts, can be justified because these strong hubs contain the required infrastructure in all social, economic, cultural, political, etc., dimensions and are considered strategic districts. On the other hand, population density is another factor that significantly affects hub districts in the transportation network. Strategically, hubs should be located in districts with population density benefits [
50]. Districts with high hub points in the network of this study are generally districts with high population density.
District 12 is considered the strongest reference in the network of the present study. Hub and reference districts are generally located in Tehran, strategic districts and have a high population density. The interesting thing is the sharing of strong hubs and references. Three districts, 6, 11, and 12, have five strong hubs and five strong references in both categories.
Table 6 shows the result of comparing the rankings with the mentioned criteria.
As mentioned in the following sections, District 2 is the most effective, and District 12 is the most influential. This is significant given the ranking of districts based on the criteria of centrality and the above points. As shown in the above table, district two was ranked first in weighted out-degree centrality and had the highest hub point, making sense to be the most influential district. Also, District 12 was ranked first in weighted in-degree centrality and had the highest reference point; therefore, it can be named the most noninfluential district. Furthermore, District 12, ranked first in four of the above six criteria, is the most central district among the 12 districts. District 2 is placed in the next place. According to the ranking of districts based on the six criteria, districts 12, 6, 11, 7, and 2 are considered strategic districts in the smart transportation network.
The
Figure 5 shows the first rank of eigenvector centrality belongs to District 12.
The district with maximum influence ability and effectiveness was determined for each district of Tehran. The district with maximum effectiveness has the highest number of urban trips to the relevant district. The district with the maximum influence ability has the highest number of urban trips from the relevant district. In other words, the effectiveness and influence ability are based on the weighted degree of centrality, which is shown in
Table 7.
According to
Table 8 and
Figure 6, the frequencies of effectiveness and influence ability in Tehran are listed. As shown in the following table, District 2 is the most significant district of Tehran in the smart transportation network, and District 12 is the most influential.
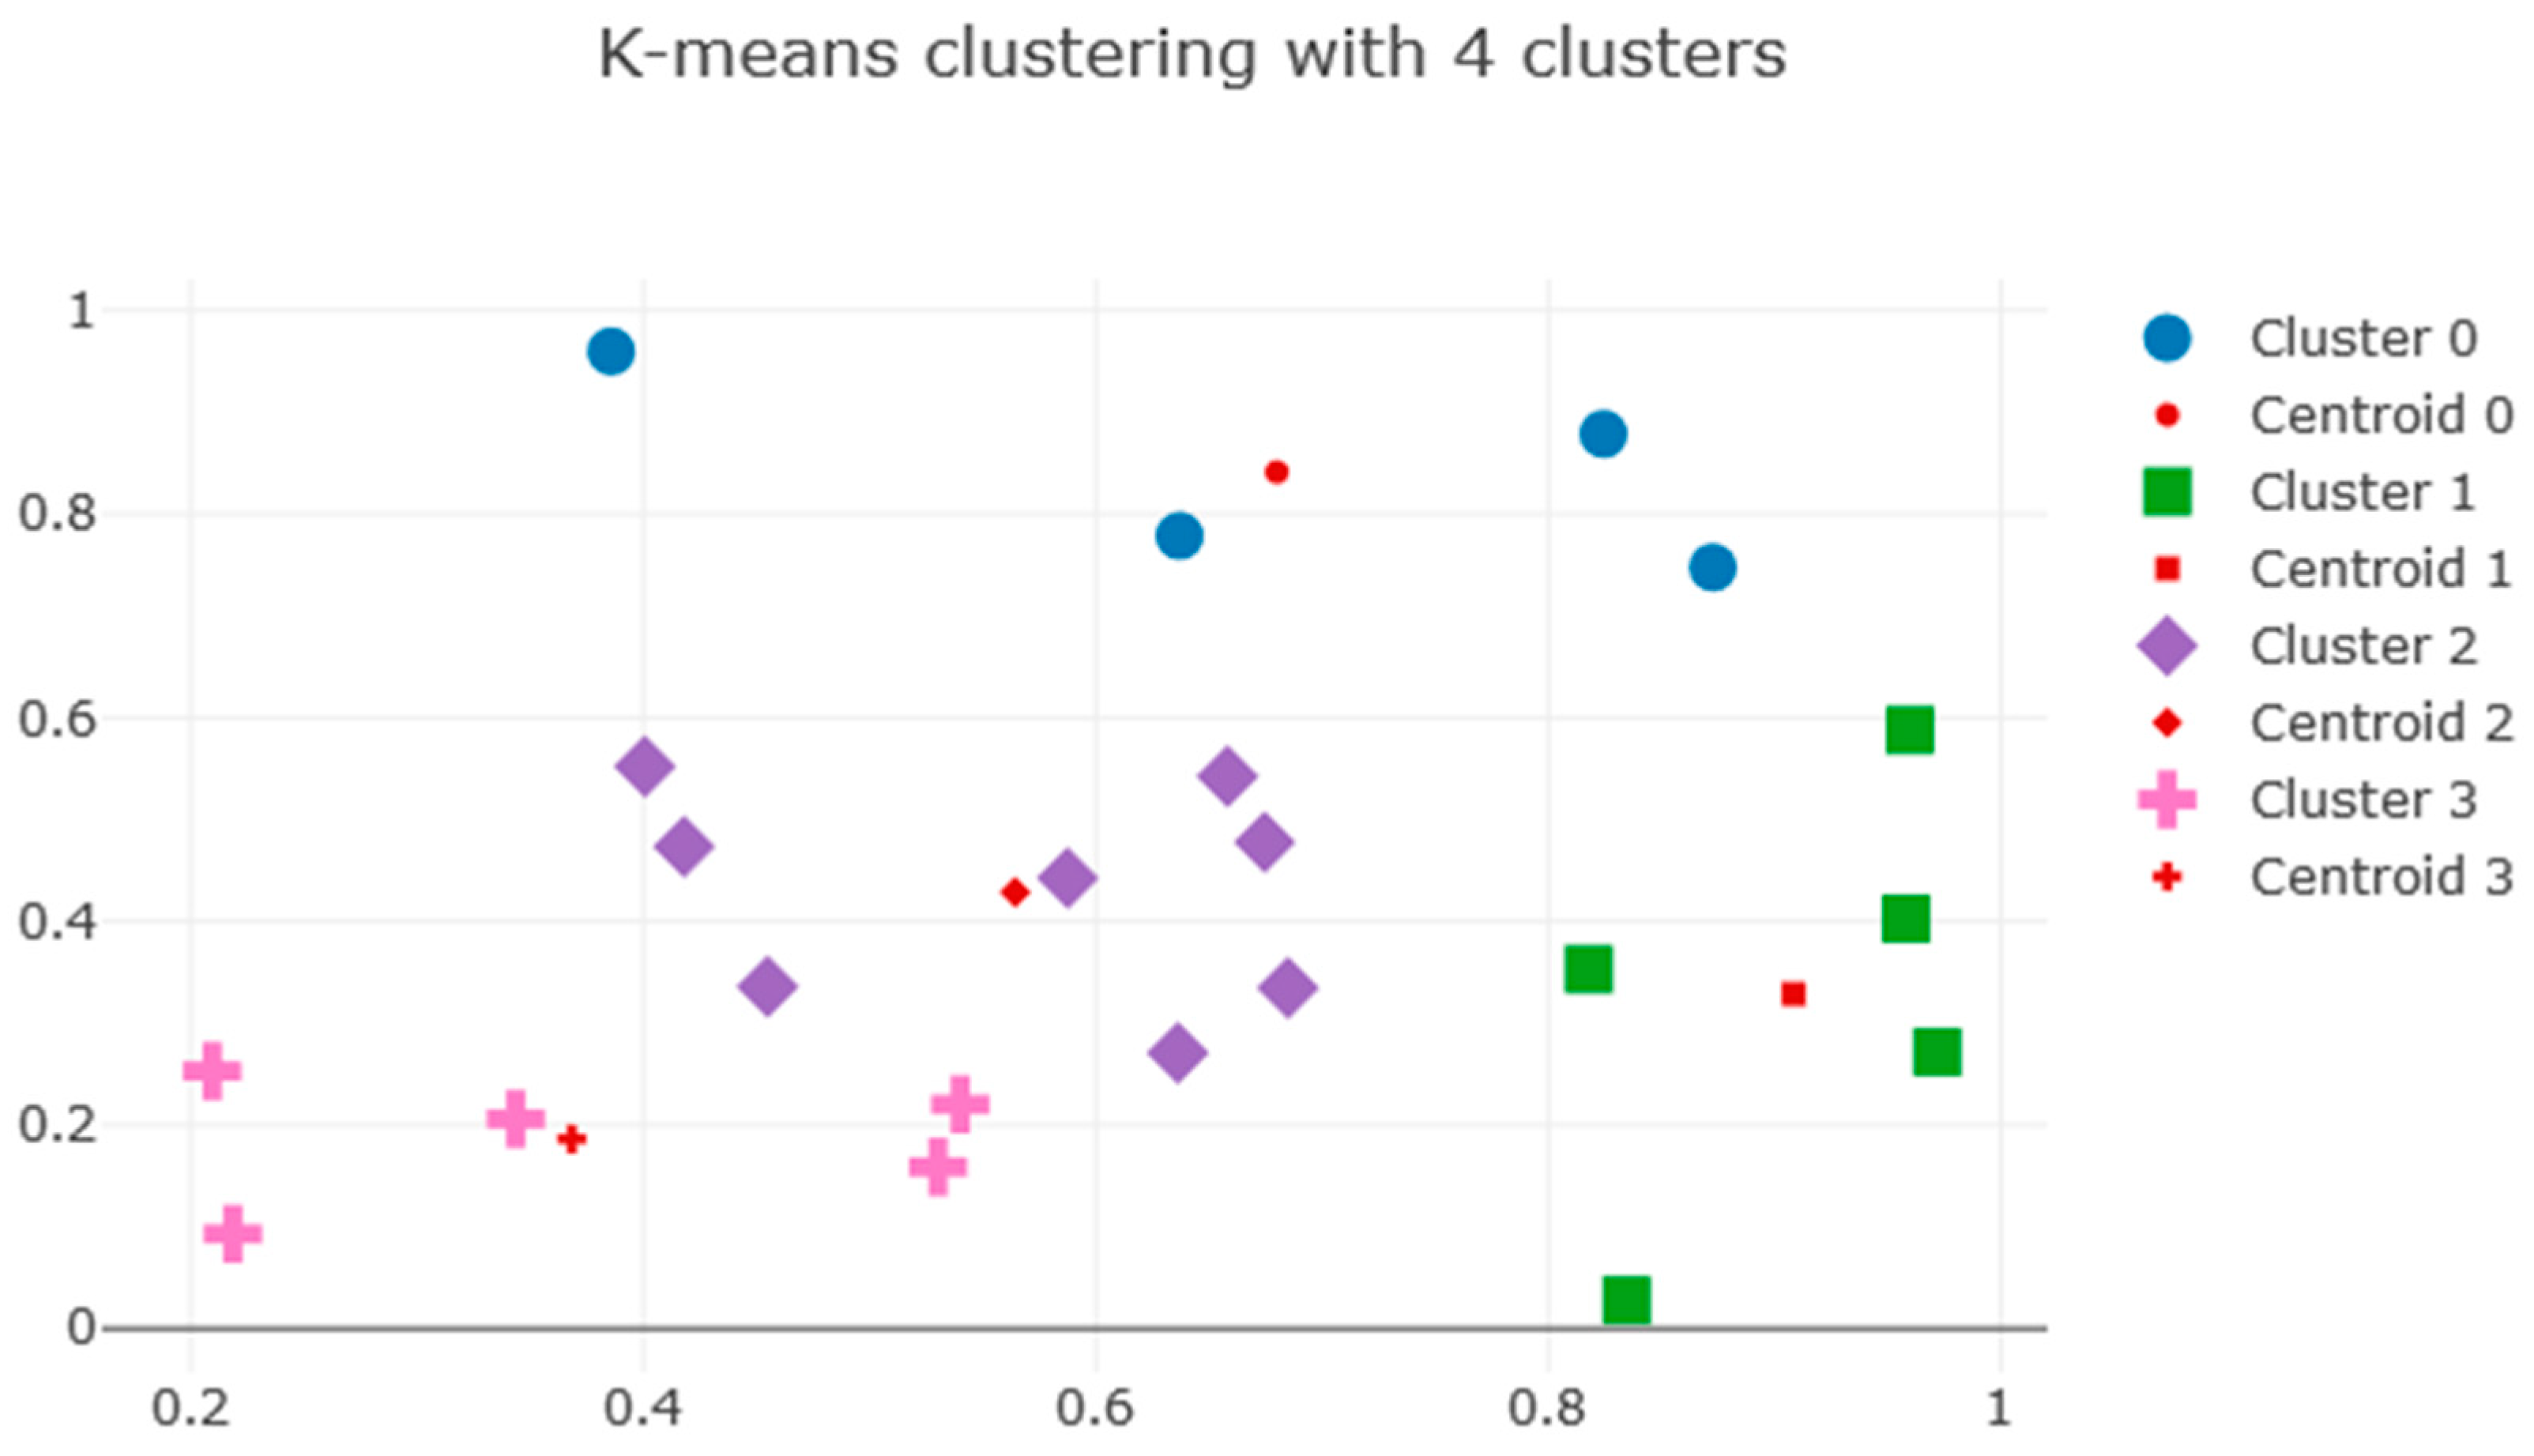
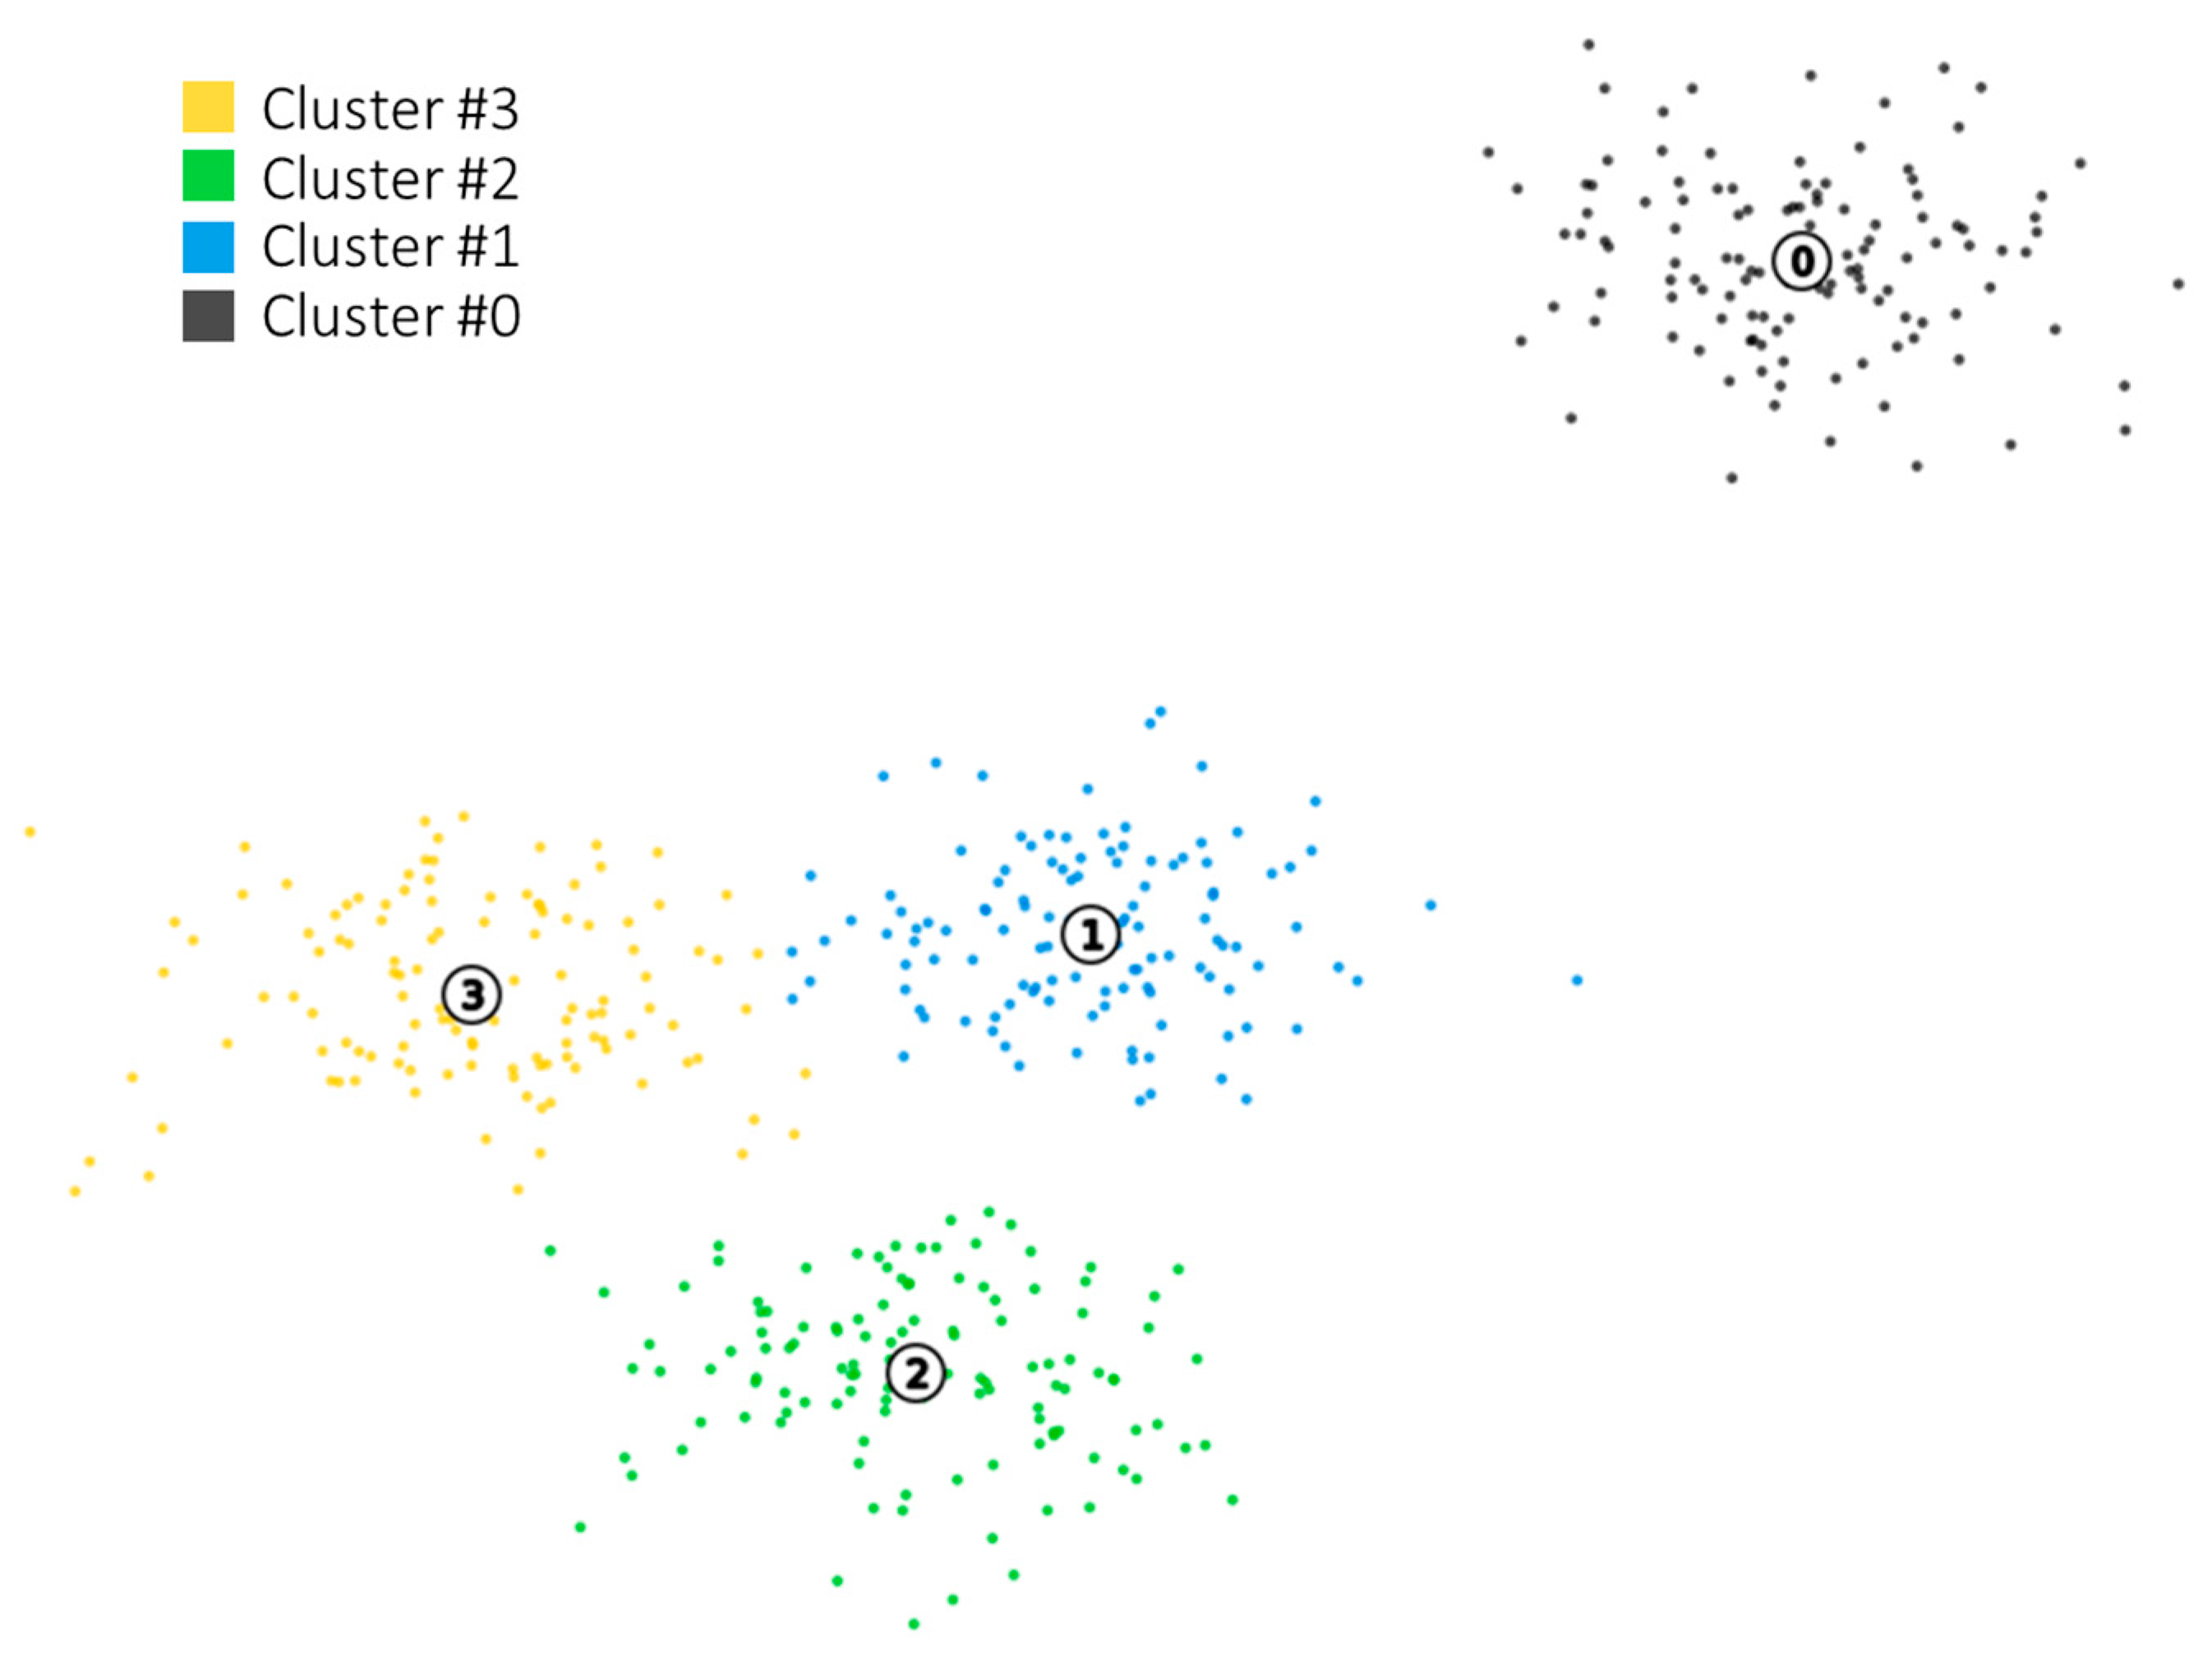
The K-means unsupervised learning algorithm was used to cluster Tehran districts in the smart transportation network in the present study. The variable k is considered equal to 4 in this study, determining the number of clusters. The three-dimensional representation of this clustering is shown in
Figure 7. The values of the centralities of the districts are normalized.
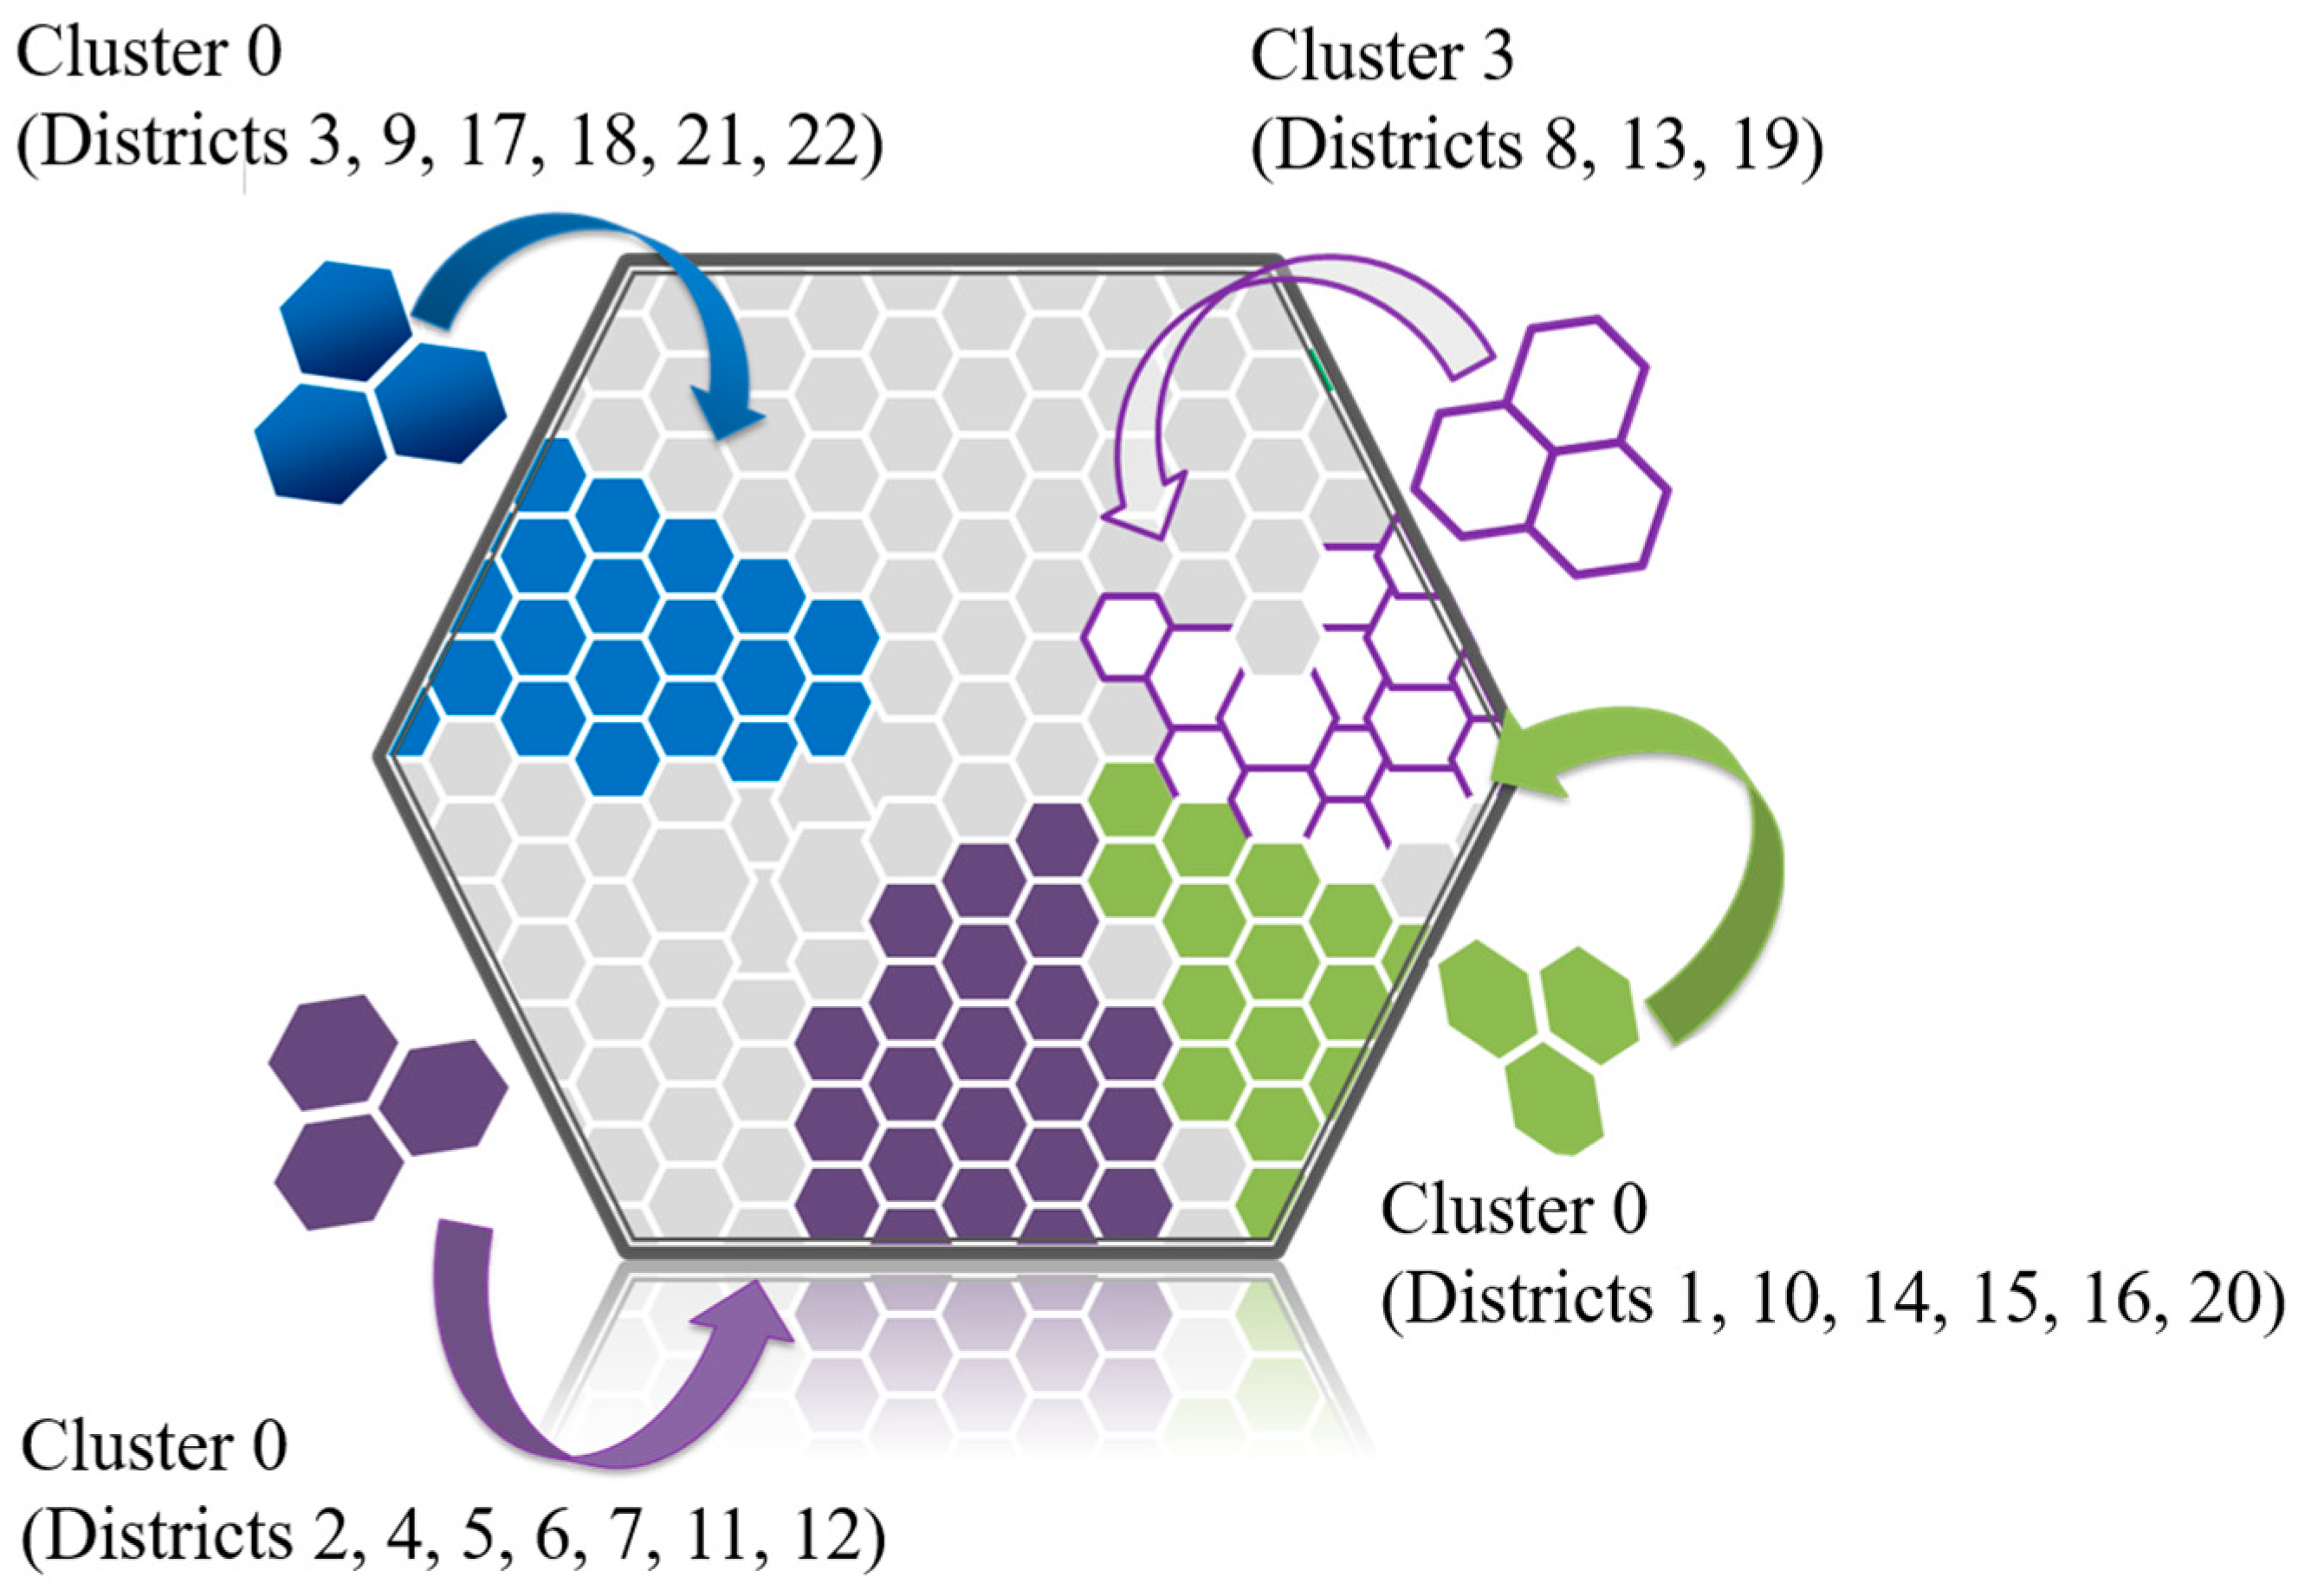
In the above three-dimensional diagram, cluster 0 is shown by a blue circle and its center by a red circle, cluster 1 by a green square and its center by a red square, cluster 2 by a purple rhombus and its center by red rhombus, and finally cluster three by a pink plus sign and its center by a red plus sign. The x-axis in the above diagram represents the weighted degree centrality, and the y-axis represents the eigenvector centrality of the districts of Tehran in the urban travel network. The areas in each cluster are listed in
Figure 8.
The districts in cluster 2 are in the top ranks of the centralities mentioned in the previous sections. Thus, these districts in the network of this study were identified as strategic districts in the network.
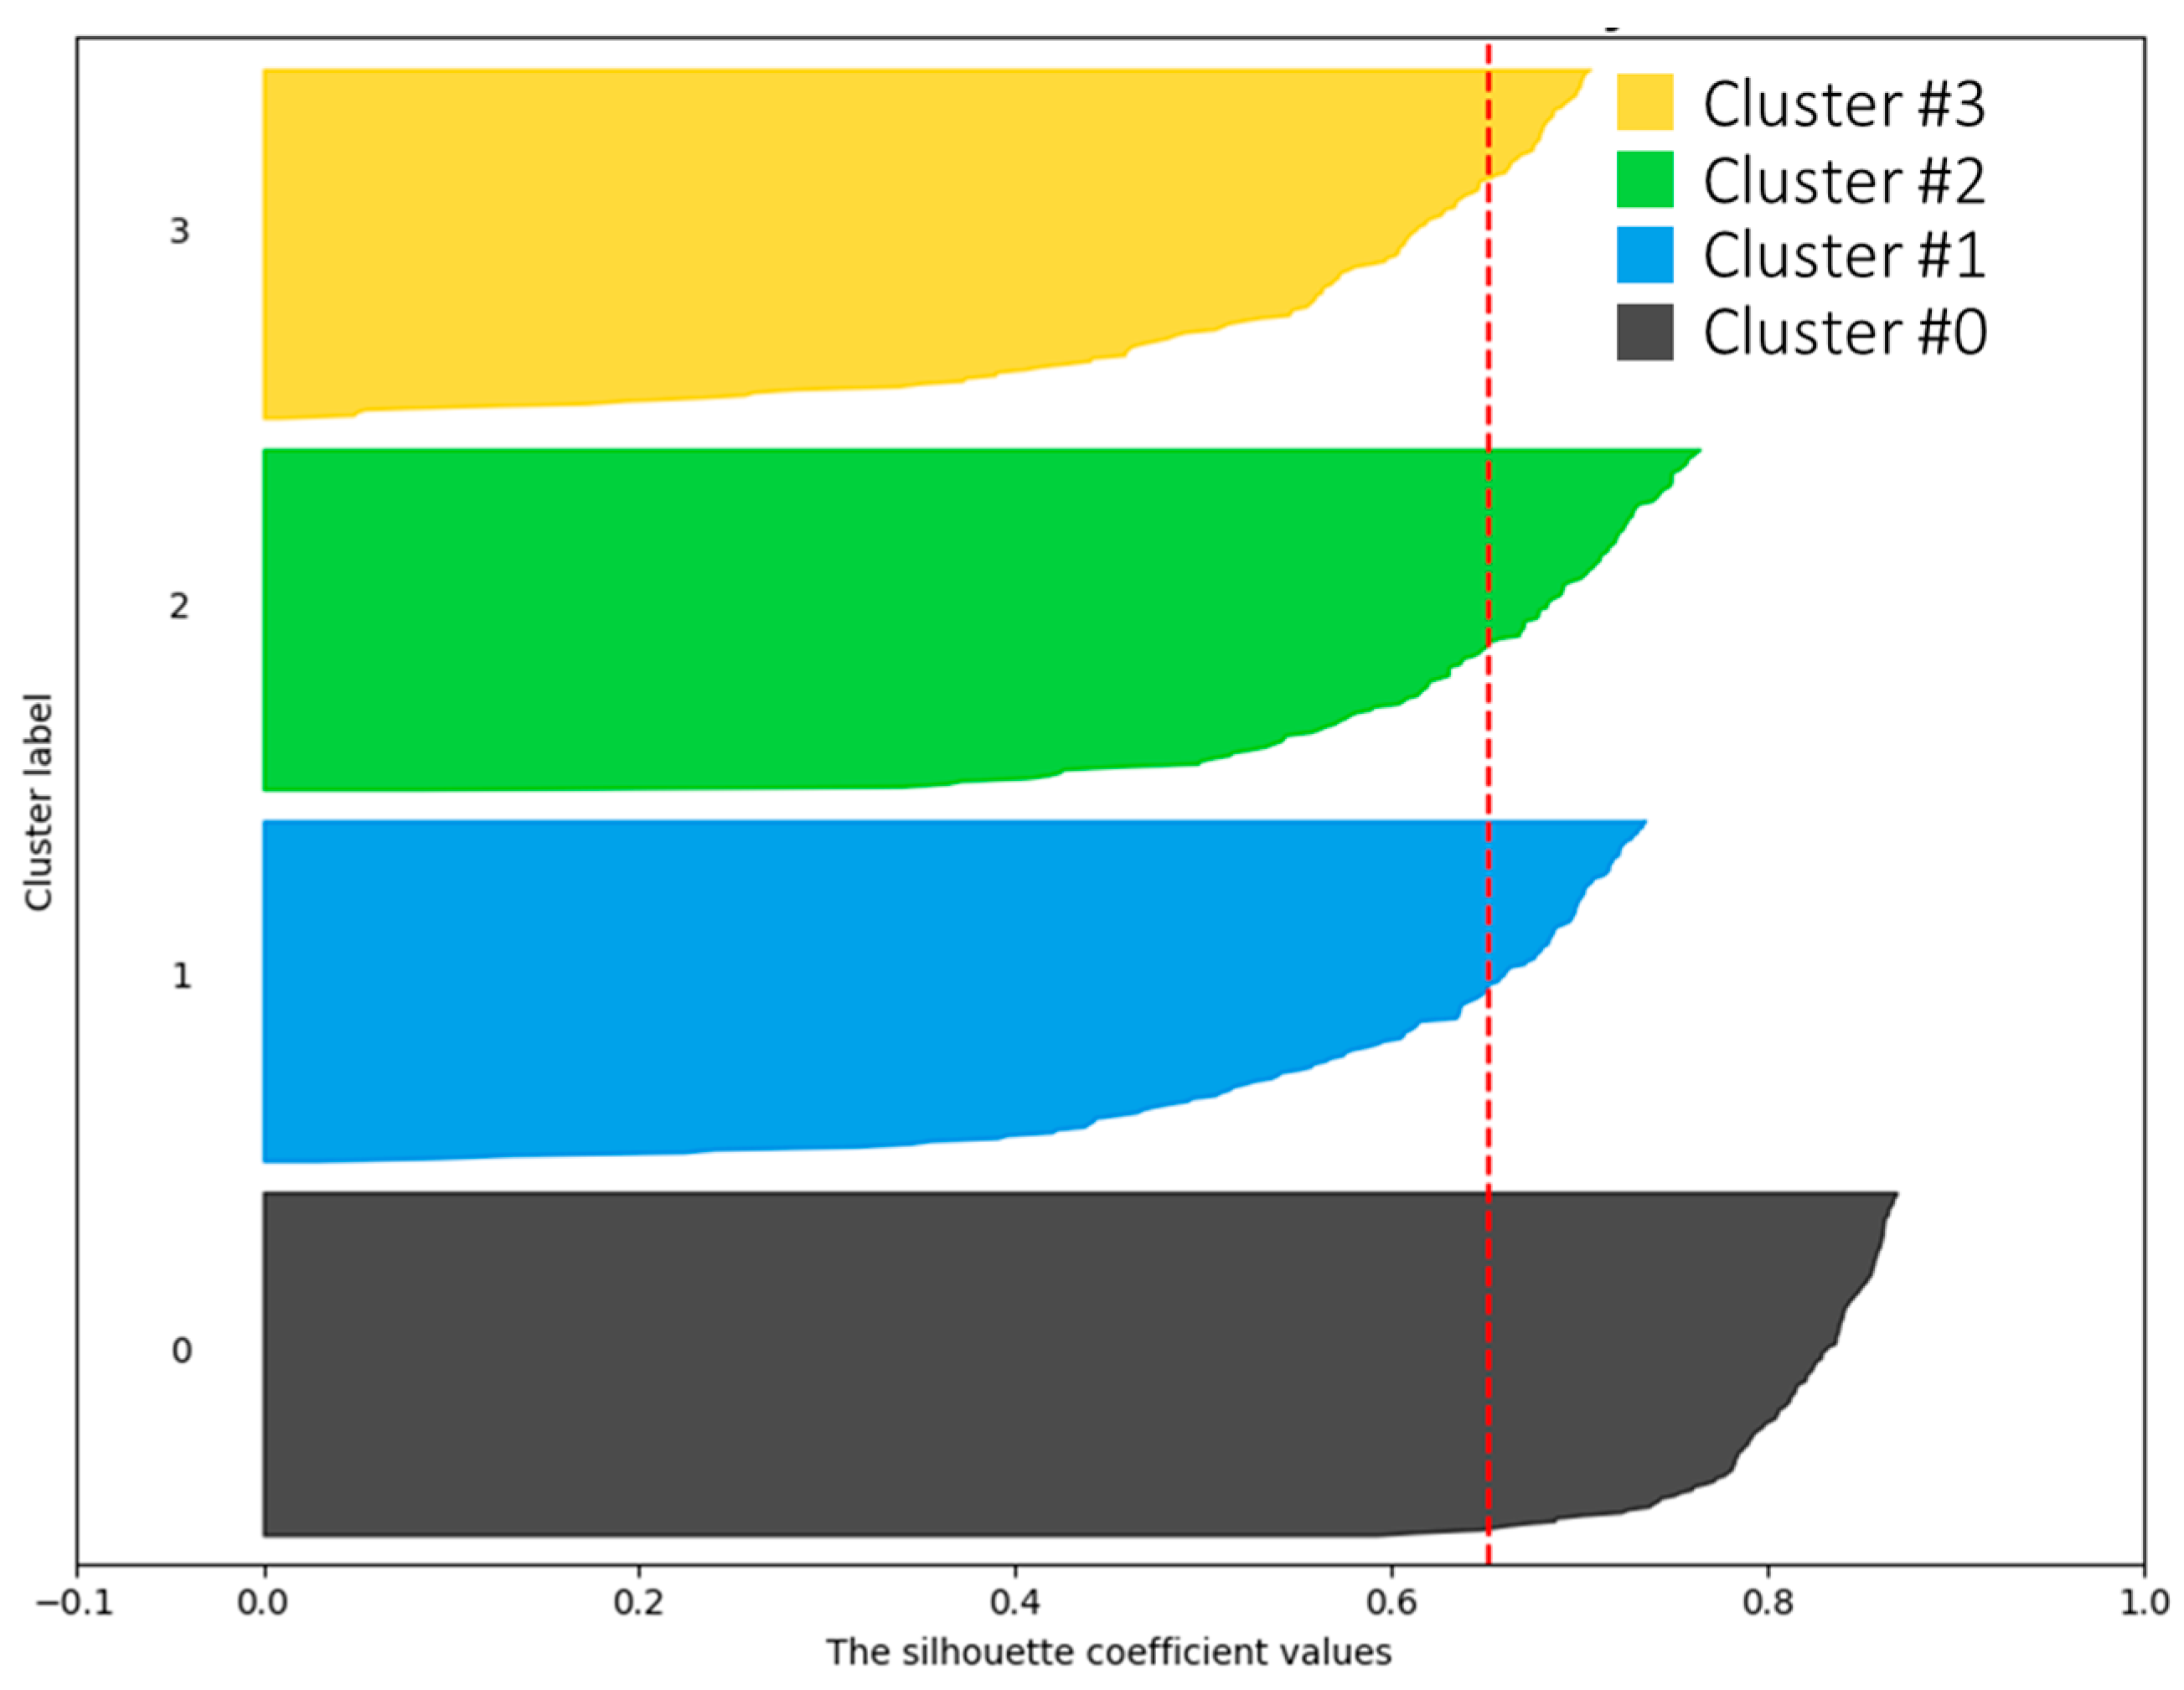
The silhouette’s value for this study’s clustering is equal to 0.65. The silhouette plot is drawn in
Figure 9 and
Figure 10. It is observed that the clusters have relatively high amounts of silhouettes. High values of silhouettes indicate that each area district in the research network is clustered appropriately. Of the 4 clusters, cluster 0 has the highest value. Cluster 0 is more separated from the rest of its neighboring clusters and has no overlap.
5. Research Findings
Acquiring knowledge from the smart transportation network and presenting it to the relevant company for making a better decision and policy based on this decision by creating shared value and sustainability is considered one of the main goals of this study; that is, a solution that can solve the challenges of the service owner, customer, and community, and also help the environmental issue to a certain extent. Of course, in the current situation of the COVID-19 pandemic, although it is important to refer to the issue of the environment, most of the attention in the present study has been paid to the direction that makes it possible to meet the needs of society and customers adequately by considering the economic income of the company. A team was formed based on the company’s experts in operations management, customer support, and business consultants to gain a collective understanding of these results, which were discussed. Given that the company’s internal stakeholders were well understood, it was agreed that the decision should be made to consider the shared values and social aspects of sustainability. Therefore, the following practical suggestions were summarized and presented to the managing director.
First and maybe foremost, our network’s hub and reference districts were determined. According to the analysis of the travel network, also, the peak of our trips either starts or ends from these districts and also our travel peak in this area is very high due to the common hub and the reference; on the other hand, we will probably have a lot of canceled trips at our special hours in these districts. Thus, our first suggestion was to consider the policy of extra points for drivers traveling in these districts instead of the penalty policy, which is the company’s current policy of non-approval by drivers (this has led drivers to prefer to travel in districts with less density or far from these districts), of course, if this issue is informed and managed by having a time network at the moment can be carried out through the system, addressed in the following part.
Additionally, most of the drivers in this fleet have chosen to drive as their permanent job, and they are not few; sometimes in certain hours of the day, they choose some areas to rest and start again. Due to the country’s pandemic, many drivers are reluctant to increase their working hours. Also, they cannot make long stops in crowded places in the current situation. This allows greater profitability and a better response to customer needs by addressing some drivers’ concerns. We suggested that the company establishes mobile health clinics, such as car coffee shops or mobile service staff, at a low cost, reported in the hubs and reference stations at our target hours. Thus, drivers were encouraged to choose these areas to rest. In addition to attracting the drivers of this fleet by providing simple services such as tea, coffee, or regular drinks or even a free car inspection by the service technician drivers, they start the clock again from those areas.
In addition, nowadays, one of the issues that such companies face is the problems created by competitors, such as multiple trips and cancellations, etc., which is proposed here by presenting a network analysis model that exposes the network to fraud. Fraud networks can be identified simply by changing the input information to the software model from the information of trips made to canceled trips and redrawing the network using community gathering and network analysis. They can be analyzed, identified, and blocked by having usernames, which helps the company detect fraud.
Moreover, it is suggested that the company’s share of providing services on low-traffic routes where drivers are less interested in being present be reduced. The amount received is the driver’s share due to pandemic conditions in Tehran and creating peace of mind in customers. The amount of this share for the customer can be considered a discount and a price reduction to help disperse more drivers in those areas, increase the share of driver coverage, and encourage more passengers to use these services. It also increases the wellbeing of the low-income groups to create more prosperity for the poor, and by paying less, the company can bring more prosperity to the slums. To a large extent, this may prevent the urban travel of these groups by using public transportation services.
Furthermore, importing information online is possible by designing a platform based on the analysis carried out in this study, and dynamic network analysis of the moment can be obtained. A kind of management dashboard can be built to plan for managing drivers and analysis of trips and even canceled trips, plans like the ones mentioned earlier. Based on this, dynamic pricing can be conducted online. Additionally, the use of network analysis and its output as one of the inputs of the trip pricing model and possible discussions in this field.
Additionally, helping to better plan urban issues such as traffic may be possible by using this type of urban travel in collaboration with urban management organizations and municipalities and using network analysis. Achieving goals with the purpose of strategic social responsibility may be possible. Last but not least, because people in districts 2, 5, and 1 have a higher level of wellbeing, travelers in those areas will naturally be more sensitive to health protocols during COVID-19. Therefore, to reduce travel cancellations and increase satisfaction, it is recommended to send the necessary warnings to the driver to observe higher-quality health tips when the car is in these areas.
6. Conclusions
Many companies decided to enter this field to grow their business with the growing use of online taxi finder systems. It has become so important that in the last few years, only a few companies have been operating in Iran, including SNAPP, TAPSI, TOUCH30, MAXIM, CARPINO, DING, MIAREH, and ALOPEYK. These growing systems prompted researchers to carry out much research on various topics of online taxis. Some studies in this field include demand analysis of taxi booking systems, destructive transportation, quality analysis of services, and online taxi companies’ effect on the taxi industry. It still takes a long time for the volume of research to reach an acceptable level to meet such companies’ needs due to the freshness of the space. Recent changes in customers, drivers, and traffic behavior, including the volume of traffic and traffic routes, are among the problems these companies have struggled with since the COVID-19 pandemic. The present study was conducted to find a comprehensive view of the traffic on different routes using social network analysis and provide solutions to deal with existing risks based on identifying acquired behaviors. The main risks in this field in a pandemic situation include an excessive concentration of drivers in some areas of Tehran, which leads to the increased traffic load in the city and reduces the profitability of the company and drivers, excessive cancellations in border areas, and low traffic that leads to a decrease in the satisfaction of all stakeholders (customer, company, and driver), as well as the lengthening of routes due to line traffic after the removal of traffic plans.
The present study examined and analyzed the smart transportation network. The nodes in this network represent the districts of Tehran, and the link between the two districts indicates the trips made between those two districts. Additionally, the weight of each link indicates the number of trips made between the two nodes. As mentioned in the previous chapter, the ranking of Tehran districts in the smart transportation network using the smart taxi booking system was based on six criteria: degree centrality, in-degree centrality, out-degree centrality, eigenvector centrality, and hub and reference points. According to the results, District 12 was ranked first in-degree centrality, special vector centralities, and reference points. District 2 was also ranked first based on the out-degree centrality and the hub point. Thus, District 12 in the first rank, based on four criteria out of six relevant criteria, and District 2, in two criteria out of six relevant criteria, indicates that District 12 is the most strategic district among the 22 districts of Tehran’s current research network. Also, District 2 is considered the most strategic district after District 12.
Furthermore, according to the results of the examination of the districts’ relationships in terms of effect based on the in-degree and out-degree centrality, District 12 was identified as the most influential district, and District 2 was the most effective district. The findings indicate the importance of the ranking section because District 2 is in the first rank of the out-degree centrality and has the highest hub point; thus, it seems logical that it is considered the most influential district. Moreover, District 12 was ranked first in terms of in-degree centrality and had the highest reference point, so it seems logical that it is considered the most influential district.
The identified strategic districts are examined from different dimensions in the first part of the evaluation section, based on which the identified areas are proven strategic. District 12, which is historically governmental, political, economic, educational, and religious, and historical, governmental, political, and diplomatic, economic centers, including Tehran’s Grand Bazaar, are located in this field. Also, district two was forced to accept the establishment of some extra-district, urban, and extra-urban activities due to the creation of new and extensive infrastructure, large plots, cheap land, too concentrated activities in the city center, and proximity to the center of gravity and need to develop the main structures of activities. These characteristics and suitable geographical and ecological conditions provided a suitable context for developing the population living in the district. District 2 is one of the urban areas in Tehran with a high population density, and many complexes have been built. Additionally, this area is considered one of the strongest communication structures in Tehran due to being enclosed between the major highways, removing several main arteries and the entire length of the passages network of about 1.5 km. Based on the results, eight essential suggestions were obtained for review, and the correctness and necessity confirmed by experts in the company and referred to high-level managers for further review and implementation.
In some ways, this research is comparable with previous research. This research has a more practical purpose than Ma, Yang [
4] who has clustered the general pattern of daily movement and provides findings to deal with the changes caused by the crisis. Also, compared to Jelokhani-Niaraki, Samany [
38], which was conducted in Tehran, the results of this research are innovative considering the pandemic conditions. The only research that is considered in the context of pandemic is Morshed, Khan [
40] who analyzed the network using Twitter data that the current research is much closer to reality due to the nature of its data.
In this study, access to the studied data is considered the most critical limitation. Companies have avoided providing their data for long periods because their business is heavily data-driven. This higher accuracy can be achieved by combining routing algorithms and social network analysis if more details of the data provided are available.
It seems that in the post-COVID era, people’s behavior will remain the same for a long time, but in this regard, other research should be conducted and its results should be compared with the current research. Also, for future studies, there are suggestions due to the variable volume of car traffic and the demand for cars for city trips during the day, so the study can be carried out at various intervals throughout the year to achieve more accurate results. It is also possible to study the number of areas in more detail and with more detailed information about urban trips (especially the route of vehicles). In the meantime, more attractive patterns for analysis can be achieved by combining routing algorithms and social network analysis. In this study, the predetermined values for the network edges indicate the travel volume. Also, matching public transport data, such as the subway and BRT with the collected data, can lead to a more accurate clustering of areas. In the case of the COVID-19 pandemic, it is also suggested that a study be carried out on traffic schedules so that companies can inform certain hours to provide citizens with unnecessary things, and for this, offer discounts and price reductions as incentive benefits.
