
Structural Dimensions and Measurement of Trust Networks among Construction Project Participants


Abstract
:1. Introduction
2. Theoretical Background
2.1. Definition of Indicators of Structural Characteristics of Trust Networks
2.2. Subdimensions of Network Density and Central Potential
3. Research Design and Methodology
3.1. Development of the Initial Scale
3.2. Data Collection
4. Data Analysis
4.1. Exploratory Factor Analysis
4.1.1. Reliability Analysis and Question Purification
4.1.2. Validity Analysis
4.2. Validation Factor Analyses
4.2.1. First Stage Conceptual Assessment
4.2.2. Second Stage Conceptual Assessment
4.3. Reliability and Validity Tests
5. Results Discussion
- (1)
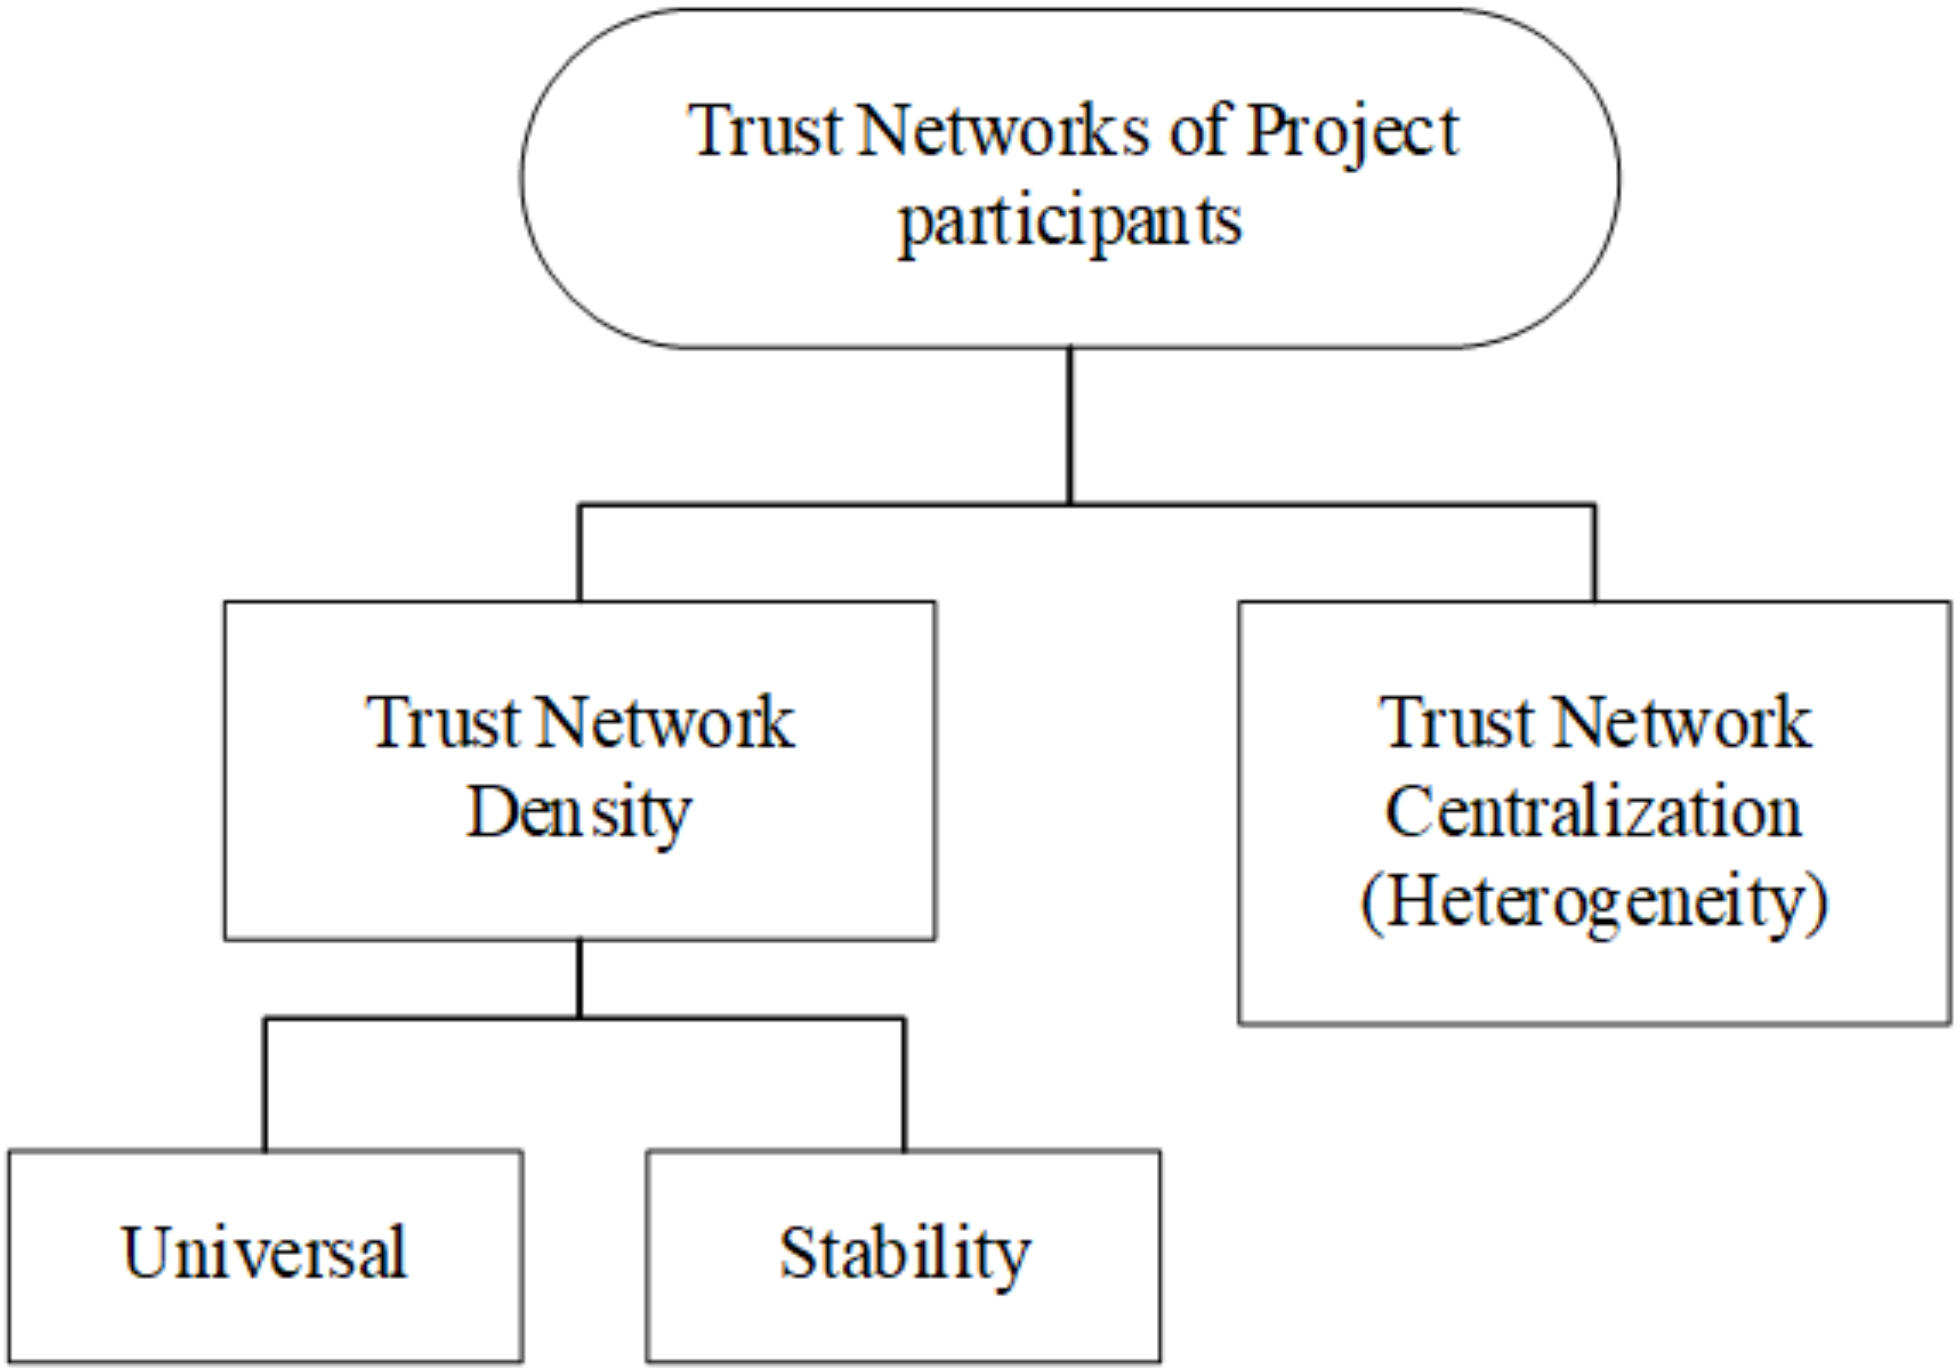
- A universal trust relationship between project participants is the foundation of any networked structure. If a universal trust relationship cannot be achieved between the participants, the number of connections between the nodes in the networked structure will be reduced or even disappear (i.e., the network density value in the social network analysis will be close to zero). The universality of trust relationships in a network is therefore a core subdimension of network density. The existence of stable trust relationships among participants will help to maintain network density. Importantly, the network structure is always heterogeneous; so, in practice, it will always dynamically change as the project progresses. In this way, the density of the trust network will change with time, so the stability of the relationships will be an important indicator of its density. The results of the validation factor analysis show that the path coefficients between trust network density and its two subdimensions (i.e., universality and stability) are 0.738 and 0.909, respectively, thereby suggesting that universality and stability are both strong explanatory factors of trust network density. The results of the above analysis suggest the following: (a) The existing studies in the social network theory literature have emphasized the inhibitory effect of trust relationships on opportunistic behavior, which is also the basis for improving each participant’s efficiency. Thus, the trust relationships of each participant constitute a network structure, and the stability of the relationships between each participant is particularly important. This is why the path coefficient between the density of the trust network and its subdimension (i.e., stability) is high, which emphasizes the importance of a stable trust relationship in improving cooperation and suppressing opportunistic behaviors in engineering projects. (b) In fact, the parties involved in an engineering project do not all trust each other. In this reality, the trust relationship that prevails between the parties corresponds to a high level of trust network density. Conversely, a low level of network density or even the absence of a trust network structure is indicated. Thus, the dimension of universality is a fundamental perspective, it can indicate that a trust network actually exists. However, it is clear from our analysis of the path coefficient data that this universality is less important than stability in the measurement of trust network density. This is because the stability dimension is more indicative of a sustainability or time-series nature than the universality dimension which is the nature of cross-sectional data. Therefore, although the universality dimension is a foundational perspective, it is not as important as the stability dimension;
- (2)
- According to graph theory and social network theory, the unevenness and complexity of the relationship between nodes in a network is reflected by the central potential of the network, which is also in line with the “heterogeneity” characteristic in ecology and the general social consensus. That is to say, there is a natural imbalance in the distribution of trust relationships between individual participants—that is, there is not an equal strength of trust between all participants in a project [39]. On the contrary, in practice, there is a core of participants who are able to gain more trust from other participants, and there are also individual participants who are unable to gain trust from any other participant. Specifically, the contractor and the developer are always the core binary subjects in engineering projects [40]. The trust relationship induced by this relationship is more binding than those of other participants, and the network of construction projects is characterized as a “scale-free network” without a loss of generality (i.e., their high central potential is often more obvious). Heterogeneity is the core dimension of the central potential of trust networks. The literature review in this study classifies the central potential of trust networks into two subdimensions—unevenness and agglomeration—while the results of the exploratory factor analysis show that both belong to the same factor. The main reason for this finding is that the relationships between and behavior of the parties involved in a construction project are heterogeneous, and the networked structure of the trust relationship is complex and variable; thus, its central potential is variable and difficult to measure. This is also reflected in the statistics presented in the literature review, where there is a similar amount of support for a differentiated dimensional approach.
6. Conclusions and Limitations
Author Contributions
Funding
Institutional Review Board Statement
Informed Consent Statement
Data Availability Statement
Conflicts of Interest
References
- Daboun, O.; Yusof, A.M.; Khoso, A.R. Relationship management in construction projects: Systematic literature review. Eng. Manag. J. 2022, 22, 1–24. [Google Scholar] [CrossRef]
- Sheng, Z.; Yu, J. Complex Systems Management: An Emerging Management Science with Chinese Characteristics. J. Manag. Wor. 2021, 37, 36–50+2. [Google Scholar]
- Chen, X.; Cong, H. What is the Morphology method of engineering ethics. Stud. Sci. Sci. 2017, 35, 1806–1812. [Google Scholar]
- Shi, C.; Chen, Y.; You, J. Asset specificity and contractors’ opportunistic behavior: Moderating roles of contract and trust. J. Manag. Eng. 2018, 34, 04018026. [Google Scholar] [CrossRef]
- Deng, J.; Wu, S.; Yan, L. Development and Evolution Trends of Relational Governance Research—From the Perspective of Combination of Co-word Cluster and Literature Analysis. East China Econ. Manag. 2015, 29, 154–160. [Google Scholar]
- Tom, G.; Howard, W.; Oliver, M.; Ken, S. Political informality: Deals, trust networks, and the negotiation of value in the urban realm. J. Dev. Stud. 2020, 20, 56–67. [Google Scholar]
- Capaldo, A.; Gianno, I. Interdependence and network-level trust in supply chain networks: A computational study. Ind. Mark. Manag. 2015, 44, 180–195. [Google Scholar] [CrossRef]
- Yin, Y.; Xu, Z. Development and evolution of trust State in construction project organization: An exploratory study in Chinese management scenario. J. Ind. Eng./Eng. Manag. 2017, 31, 74–83. [Google Scholar]
- Li, J.; Jiang, W.; Zuo, J. The effects of trust network among project participants on project performance based on SNA approach: A case study in China. Int. J. Constr. Manag. 2020, 20, 837–847. [Google Scholar] [CrossRef]
- William, S.; Peter, M.D.; Malik, K. The application of social network analysis to identify trust-based networks in construction. Int. J. Netw. Virtual Organ. 2007, 4, 369–382. [Google Scholar]
- Choi, E.W.; Zer, Z.; Zheng, Y. Network trust and trust behaviors among executives in supply chain interactions. Manag. Sci. 2020, 66, 102–122. [Google Scholar] [CrossRef]
- Wang, X.; Yin, Y.; Deng, J.; Xu, Z. Influence of trust networks on the cooperation efficiency of PPP projects: Moderating effect of opportunistic behavior. J. Asian Archit. Build. Eng. 2021, 21, 1–16. [Google Scholar] [CrossRef]
- Wang, X.; Yin, Y.; Deng, J.; Xu, Z. Opportunistic behavior governance in PPP projects: An analysis based on trust networks. Adv. Civ. Eng. 2021, 2021, 8899338. [Google Scholar] [CrossRef]
- Wang, X.; Sun, L.; Chen, Y. Contractors’ Stakeholders Based on Social Network Analysis. J. Eng. Manag. 2015, 29, 13–18. [Google Scholar]
- Tan, J.; Zhang, H.; Lin, R. Modeling and analyzing the evolution mechanism of industrial innovation network. J. Manag. Sci. China 2019, 22, 1–14. [Google Scholar]
- Frazier, A. The severity of contract enforcement in interfirm channel relationships. J. Mark. 2001, 65, 67–81. [Google Scholar]
- Nyuur, R.B.; Brecic, R.; Debrah, Y.A. SME international innovation and strategic adaptiveness. Int. Mark. Rev. 2018, 35, 280–300. [Google Scholar] [CrossRef]
- Ye, Z.; Shen, Q. Structural equation modeling of the intelligent manufacturing entrepreneurship’s network characteristics. J. Intell. Fuzzy Syst. 2020, 38, 7803–7811. [Google Scholar] [CrossRef]
- Kamiyama, R.; Miyata, T.; Ferrer, A.J.G.; Kurokura, H.; Ishikawa, S. Differences in the effects of social network, trust, and cooperation on fishery co-management. Mar. Policy 2018, 87, 314–320. [Google Scholar] [CrossRef]
- Adali, S.; Escriva, R.; Goldberg, M.K. Measuring behavioral trust in social networks. In Proceedings of the 2010 IEEE International Conference on Intelligence and Security Informatics (ISI), Vancouver, BC, Canada, 23–26 May 2010; IEEE: Piscataway, NJ, USA, 2010. [Google Scholar]
- Giuliani, E.; Bell, M. The micro-determinants of meso-level learning and innovation: Evidence from a Chilean wine cluster. Res. Policy 2005, 34, 47–68. [Google Scholar] [CrossRef]
- Park, Y. On the optimality of trust network analysis with subjective logic. Adv. Electr. Comput. Eng. 2014, 14, 49–54. [Google Scholar] [CrossRef]
- Pasquale, D.M. Using centrality measures to predict helpfulness-based reputation in trust networks. Trans. Internet Technol. 2017, 17, 1–20. [Google Scholar]
- Wang, T.; Pan, S.; Shi, L.; Zeng, T. Research on the Impact of Informal Governance of Enterprise Innovation Network on Knowledge Flow. Sof. Sci. 2022, 36, 55–60. [Google Scholar]
- Hinkin, T.R. A review of scale development practices in the study of organizations. J. Manag. 1995, 21, 967–988. [Google Scholar] [CrossRef]
- Scheaf, D. Measuring Opportunity Evaluation: Conceptual Synthesis and Scale Development. J. Bus. Ventur. 2020, 35, 105935. [Google Scholar] [CrossRef]
- Farh, J.; Zhong, C.; Organ, D. Organizational citizenship behavior in the people’s republic of China. Organ. Sci. 2004, 15, 241–253. [Google Scholar] [CrossRef]
- Zhang, Y.; Waldman, D.; Han, Y. Paradoxical leader behaviors in people management: Antecedents and consequences. Acad. Manag. J. 2015, 58, 538–566. [Google Scholar] [CrossRef]
- Liu, W.; Sun, L.; Gao, Q. Development and Test of Place Brand Image Scale Based on Consumer Perspective. Sof. Sci. 2021, 35, 125–130. [Google Scholar]
- Hair, J.F.; Ringle, C.M.; Sarstedt, M. PLS-SEM: Indeed a silver bullet. J. Mark. Theory Pract. 2011, 19, 139–152. [Google Scholar] [CrossRef]
- Nunnally, J. Psychometric Theory; McGraw-Hill: New York, NY, USA, 1967; pp. 21–27. [Google Scholar]
- Yan, L.; Wang, Z.; Deng, J. Research on structural dimensions and measurement of contractors’ performance behavior in construction project based on theory of contract reference point. Chin. Civ. Eng. J. 2018, 51, 105–117. [Google Scholar]
- Zhao, S.; Zhang, X. Research on the Internal Structure and Scale Development of Moral Foundation in Chinese Cultural Context. Chin. J. Manag. 2021, 18, 1473–1482. [Google Scholar]
- Cheng, X.; Chen, H.; Zheng, M. The structure dimension and scale development of responsible leadership the Chinese cultural context. Chin. J. Manag. 2021, 18, 1780–1789. [Google Scholar] [CrossRef] [PubMed]
- Akter, S.; Ambra, J.; Ray, P. Development and validation of an instrument to measure user perceived service quality of health. Inf. Manag. 2013, 50, 181–195. [Google Scholar] [CrossRef] [Green Version]
- Wetzels, M.; Odekerken, G.; Oppen, C.V. Using PLS path modeling for assessing hierarchical construct models: Guidelines and empirical illustration. MIS Q. 2009, 33, 177–195. [Google Scholar] [CrossRef]
- Becker, J.M.; Klein, K.; Wetzels, M. Hierarchical latent variable models in PLS-SEM: Guidelines for using reflective-formative type models. Long Range Plan. 2012, 45, 359–394. [Google Scholar] [CrossRef]
- Fornell, C.; Larcker, D.F. Evaluating structural equation models with unobservable variables and measurement error. J. Mark. Res. 1981, 18, 39–50. [Google Scholar] [CrossRef]
- Wang, X.; Yin, Y.; Xu, Z. The influence of trust networks on public–private partnership project performance. Manag. Procure. Law 2022, 40, 1–10. [Google Scholar] [CrossRef]
- Yang, R.J.; Zou, P.X.; Wang, J. Modelling stakeholder-associated risk networks in green building projects. Int. J. Proj. Manag. 2016, 34, 66–81. [Google Scholar] [CrossRef]

| Classification | Secondary Classification | References | Total | ||||||||
|---|---|---|---|---|---|---|---|---|---|---|---|
| 1 | 2 | 3 | 4 | 5 | 6 | 7 | 8 | 9 | |||
| Trust Networks Density | Strength of relationship | √ | √ | √ | √ | 4 | |||||
| Universality | √ | √ | √ | √ | √ | √ | √ | 7 | |||
| Nodal distance | √ | √ | √ | 3 | |||||||
| Relationship maintenance | √ | √ | √ | √ | 4 | ||||||
| Tightness | √ | √ | √ | √ | 4 | ||||||
| Trust Networks Centralization | Uneven | √ | √ | √ | √ | √ | √ | 6 | |||
| Agglomeration | √ | √ | √ | √ | 4 | ||||||
| Punctuality | √ | √ | √ | 3 | |||||||
| Intermediacy | √ | √ | √ | 3 | |||||||
| Proximity | √ | √ | √ | √ | 4 | ||||||
| Differences | √ | √ | 2 | ||||||||
| Classification | Secondary Classification | Item No. | Initial Measurement Items | References |
|---|---|---|---|---|
| Trust Networks Density (ND) | Universality | NDU1 | There is mutual trust between all parties involved in the project | Nyuur [15]; Frazier [14] |
| NDU2 | The participants have always shown themselves to be trustworthy | |||
| NDU3 | No obvious obstacles to forming a relationship of trust with other parties when joining a new participant | |||
| NDU4 | All parties involved agree that a good relationship of trust is important to the project | |||
| Tightness | NDT1 | The participants are happy to work centrally, and a relationship of trust is formed during this period | ||
| NDT2 | Efficient sharing of project information and the formation of trust between participants | |||
| NDT3 | Frequent communication between project participants, during which a relationship of trust is formed | |||
| Relationship maintenance | NDS1 | Trust between project participants throughout the cooperation period | ||
| NDS2 | >No sporadic conflicts between the parties involved will lead to a breakdown in the relationship of trust | |||
| NDS3 | Satisfactory relationship of trust between the various parties involved | |||
| NDS4 | The parties involved want to maintain a relationship of trust long after the project has been completed | |||
| Trust Networks Centralization (NC) | Unevenness | NCB1 | There are participants who are trusted or largely untrusted by other individual participants | Ye [16]; Pasquale [23] |
| NCB2 | The project participants apparently focus their trust relationship on a specific participant | |||
| NCB3 | Some participants pay extra attention to building and maintaining trusting relationships | |||
| NCB4 | Some participants expressed or showed contempt for the relationship of trust | |||
| Agglomeration | NCC1 | Differences in trust relationships between project participants | ||
| NCC2 | A small faction of participants who clearly trust each other in the project | |||
| NCC3 | A participant is the “bridge” position for the relationship between other nodes |
| Average of Scales after Deletion of Items | Scaled Variance after Removal of Terms | Corrected Term to Total Correlation | Cronbach’s Alpha after Deletion of Terms | |
|---|---|---|---|---|
| NDU1 | 37.87 | 127.827 | 0.522 | 0.911 |
| NDU2 | 37.78 | 129.018 | 0.529 | 0.910 |
| NDU3 | 38.29 | 127.717 | 0.568 | 0.909 |
| NDT1 | 38.42 | 130.135 | 0.309 | 0.922 |
| NDT2 | 39.05 | 123.275 | 0.623 | 0.907 |
| NDT3 | 39.08 | 115.805 | 0.779 | 0.900 |
| NDS1 | 38.95 | 125.141 | 0.579 | 0.909 |
| NDS2 | 39.16 | 115.250 | 0.807 | 0.899 |
| NCB1 | 38.64 | 121.167 | 0.730 | 0.903 |
| NCB2 | 38.36 | 121.389 | 0.731 | 0.903 |
| NCC1 | 38.68 | 120.731 | 0.711 | 0.903 |
| NCC2 | 38.46 | 124.918 | 0.608 | 0.908 |
| NCC3 | 38.23 | 115.002 | 0.819 | 0.898 |
| Item No. | Factors Extracted | ||
|---|---|---|---|
| 1 | 2 | 3 | |
| NCC1 | 0.807 | 0.159 | 0.137 |
| NCB2 | 0.790 | 0.346 | 0.174 |
| NCC2 | 0.784 | 0.136 | 0.390 |
| NCC3 | 0.773 | 0.335 | 0.374 |
| NCB1 | 0.772 | 0.262 | 0.295 |
| NDT2 | 0.143 | 0.867 | 0.120 |
| NDS1 | 0.118 | 0.841 | 0.111 |
| NDT3 | 0.390 | 0.835 | 0.128 |
| NDS2 | 0.373 | 0.829 | 0.201 |
| NDU2 | 0.235 | 0.128 | 0.826 |
| NDU1 | 0.180 | 0.177 | 0.810 |
| NDU3 | 0.364 | 0.101 | 0.743 |
| Classification | Factors | Item No. | Factors Loading | CITC | Characteristics | Amount of Variance Explained (%) | Amount of Cumulative Variance Explained (%) | Cronbach’s α |
|---|---|---|---|---|---|---|---|---|
| ND | Universal | NDU1 | 0.810 | 0.752 | 1.033 | 8.610 | 8.610 | 0.804 |
| NDU2 | 0.826 | 0.758 | ||||||
| NDU3 | 0.743 | 0.724 | ||||||
| Stability | NDT2 | 0.867 | 0.630 | 1.757 | 14.645 | 23.255 | 0.916 | |
| NDT3 | 0.841 | 0.845 | ||||||
| NDS1 | 0.835 | 0.530 | ||||||
| NDS2 | 0.829 | 0.547 | ||||||
| NC | Heterogeneity | NCB1 | 0.772 | 0.581 | 6.485 | 54.043 | 77.298 | 0.919 |
| NCB2 | 0.790 | 0.594 | ||||||
| NCC1 | 0.784 | 0.758 | ||||||
| NCC2 | 0.807 | 0.555 | ||||||
| NCC3 | 0.773 | 0.782 |
| First Stage Conceptual Assessment | Second Stage Conceptual Assessment | ||||||
|---|---|---|---|---|---|---|---|
| Secondary Classification | Item No. | Factors Loading | AVE | CR | Dimensional | AVE | CR |
| Universal | NDU1 | 0.833 | 0.720 | 0.885 | Trust Networks Density | 0.545 | 0.892 |
| NDU2 | 0.863 | ||||||
| NDU3 | 0.850 | ||||||
| Stability | NDT2 | 0.875 | 0.799 | 0.941 | |||
| NDT3 | 0.933 | ||||||
| NDS1 | 0.830 | ||||||
| NDS2 | 0.933 | ||||||
| Heterogeneity | NCB1 | 0.884 | 0.757 | 0.940 | — | — | — |
| NCB2 | 0.873 | ||||||
| NCC1 | 0.873 | ||||||
| NCC2 | 0.793 | ||||||
| NCC3 | 0.924 | ||||||
| Secondary Classification | Heterogeneity | Universal | Stability | Average Value | Standard Deviation |
|---|---|---|---|---|---|
| Heterogeneity | 0.870 * | 3.273 | 0.187 | ||
| Universal | 0.616 | 0.849 * | 3.769 | 0.270 | |
| Stability | 0.585 | 0.390 | 0.894 * | 2.687 | 0.089 |
| Paths | Factors | T-Statistic | p-Value |
|---|---|---|---|
| ND → Universal | 0.738 | 15.47 | 0.000 |
| ND → Stability | 0.909 | 69.387 | 0.000 |
| Trust Networks | Density | Heterogeneity | Universal | Stability | Cronbach’s α | AVE | |
|---|---|---|---|---|---|---|---|
| Trust Networks | 0.735 | 0.920 | 0.540 | ||||
| Density | 0.924 | 0.738 | 0.856 | 0.545 | |||
| Heterogeneity | 0.924 | 0.709 | 0.870 | 0.919 | 0.757 | ||
| Universal | 0.733 | 0.738 | 0.616 | 0.849 | 0.806 | 0.720 | |
| Stability | 0.808 | 0.909 | 0.585 | 0.390 | 0.894 | 0.915 | 0.799 |
| Classification | Items No. | Measurement Items |
|---|---|---|
| Trust Networks Density (ND) | ND1 | There is a general relationship of mutual trust between the various parties involved in the project. |
| ND2 | The participants have always tried to show that they are to be trusted. | |
| ND3 | All parties involved agreed that the relationship of trust had a significant impact on the project. | |
| ND4 | Project information is often shared efficiently and trusting relationships emerge between the participants. | |
| ND5 | Frequent communication between the participants and the emergence of a trusting relationship between the participants. | |
| ND6 | The relationship of trust between the project participants is maintained and continues throughout the period of cooperation. | |
| ND7 | The parties involved in the construction will not easily be in conflict over disputes leading to a breach of trust. | |
| Trust Networks Centralization (NC) | NC1 | There are participants who are only trusted or largely untrusted by other individual participants. |
| NC2 | The majority of participants apparently focused their trust relationships on particular participants. | |
| NC3 | There are significant differences in the level and depth of mutual trust between project participants. | |
| NC4 | There are clearly groups or factions of participants in the project that trust each other. | |
| NC5 | The presence of a participant can be an effective catalyst for building trust between other participants. |
Disclaimer/Publisher’s Note: The statements, opinions and data contained in all publications are solely those of the individual author(s) and contributor(s) and not of MDPI and/or the editor(s). MDPI and/or the editor(s) disclaim responsibility for any injury to people or property resulting from any ideas, methods, instructions or products referred to in the content. |
© 2023 by the authors. Licensee MDPI, Basel, Switzerland. This article is an open access article distributed under the terms and conditions of the Creative Commons Attribution (CC BY) license (https://creativecommons.org/licenses/by/4.0/).
Share and Cite
Wang, X.; Yin, Y. Structural Dimensions and Measurement of Trust Networks among Construction Project Participants. Sustainability 2023, 15, 4112. https://doi.org/10.3390/su15054112
Wang X, Yin Y. Structural Dimensions and Measurement of Trust Networks among Construction Project Participants. Sustainability. 2023; 15(5):4112. https://doi.org/10.3390/su15054112
Chicago/Turabian StyleWang, Xiang, and Yilin Yin. 2023. "Structural Dimensions and Measurement of Trust Networks among Construction Project Participants" Sustainability 15, no. 5: 4112. https://doi.org/10.3390/su15054112
APA StyleWang, X., & Yin, Y. (2023). Structural Dimensions and Measurement of Trust Networks among Construction Project Participants. Sustainability, 15(5), 4112. https://doi.org/10.3390/su15054112