Article

Evaluating Urban Outdoor Thermal Comfort in Jabal Al Natheef Amman

by
Farah Z. Al-Atrash
* and
Athar Al-Ayyoub
Department of Architecture and Interior Architecture, School of Architecture and Built Environment, German Jordanian University, Amman 11180, Jordan
*
Author to whom correspondence should be addressed.
Sustainability 2023, 15(5), 4092; https://doi.org/10.3390/su15054092
Submission received: 21 November 2022 / Revised: 19 February 2023 / Accepted: 20 February 2023 / Published: 23 February 2023
(This article belongs to the Section Environmental Sustainability and Applications)

Abstract

:
Outdoor thermal comfort is an essential aspect of sustainable architecture, and it is key to maintaining a safe outdoor environment. Several programs have been developed to predict thermal comfort based on climate parameters, as well as the built environment, and to forecast comfort within the urban context. Solar radiation and wind speed can be manipulated by the constructed environment. This research uses Jabal Al Natheef as a case study. An attempt is made to evaluate the outdoor thermal comfort of the urban environment and to identify the contributing factors that impede or facilitate outdoor thermal comfort in Amman. The goal of this research is to investigate behavioral factors, including perception, in addition to environmental parameters, such as thermal adaptation and solar radiation intensity, as well as the green infrastructure implementation. A comprehensive literature analysis of outdoor thermal comfort over the last decade is conducted in this paper, which included adaptive and rational thermal comfort approaches, from the standpoint of contextualizing the behavioral perspective that is connected to the use of urban space. This research employed a scenario-based approach, enabling site assessment and community participation. The possibility of enhancing the outdoor thermal comfort in Jabal Al Natheef is discussed. Furthermore, we identify the effect of design measures that influence outdoor thermal comfort. Recommendations for improving outdoor thermal conditions in the region to improve urban life and stimulate outdoor activities are provided. The results indicate that vegetation has a significant effect on reducing air temperature by providing shade. Urban areas with more vegetation have a mean radiant temperature that is significantly reduced, by almost 7 °C, especially during the summer.

1. Introduction

The main target of this research is to investigate the possibility of enhancing outdoor thermal comfort in Jabal Al Natheef. This involves figuring out how designers can change the climatic conditions in urban spaces for thermal comfort and obtaining a better understanding of the relationship between outdoor thermal comfort, urban design, and the microclimate, in order to improve both the user’s thermal perception and behavioral perspective. The following objectives were defined: (1) quantitively and qualitatively evaluating outdoor thermal performance at the research site in respect of occupant behavior; (2) identifying the causes and effects of thermal comfort/discomfort at the research site; and (3) evaluating the urban environmental context and its effect on microclimatic parameters and thermal stress. Additionally, using a simulation tool, we quantified the impact of various design elements that may improve outdoor thermal performance in terms of social and environmental aspects.
The work of researchers such as Arini 2014 [1] and Altal et al. 2018 [2] studied the urban socio-spatial elements and structures in Jabal Al Natheef. This research addresses urban microclimate measures and parameters, and how design elements affect them. The integration of accumulated knowledge of climatology into applicable planning tools and guidelines is a means of improving the microclimate of the outdoor built environment and sustaining healthy human behavior within the urban context. Therefore, developing urban design strategies for outdoor environments based on bioclimatic principles provides designers with design guidelines that can improve the microclimate at the research site and have a positive impact on occupants’ behaviors. In fact, there is a need to analyze the impact of urban design elements on the microclimate of Jabal Al Natheef. A main focus of this study is the relationship between thermal comfort and occupants, and how climatic conditions affect behavior.
Cities with thermally suitable outdoor areas can entice individuals to spend more time outside while also boosting vitality and resilience (Lan et al., 2011) [3]. Thermal comfort is determined by the interaction of sun radiation, wind, and ambient temperature. As a result, before a tool can be built to aid designers and consultants in developing thermally comfortable outdoor environments, it is critical to understand this dynamic relationship (Lan et al., 2011) [3].

1.1. Thermal Comfort in Urban Spaces

Thermal comfort is a priority in urban planning, with the earliest research dating back to the 1960s. As the indoor environment is a limited space where people spend extended periods of time (such as living and working spaces), it is understandable that architectural thermal comfort has been studied for a long time. Outdoor temperatures, on both the local and global scales, are constantly changing as a result of current and future environmental changes. As a result, urban thermal comfort is becoming increasingly important to preserving the attractiveness and utility of public places (Pessanha, 2017) [4]. Furthermore, through facilitating physical activity, outdoor public spaces are seen as a critical component in improving people’s health, well-being, and behavior, as well as other social aspects (Lee, 2015) [5].
Social and behavioral settings are two important factors in providing improved possibilities for occupants to participate in outdoor physical activities and feel comfortable in Jabal Al Natheef.
The thermal environment in public spaces can have a big impact on how people perceive thermal elements and how they use the area. As a result, attempting to improve microclimatic conditions and thermal comfort in urban places will most likely encourage people to spend more time outdoors, perhaps increasing social cohesiveness and impacting the community as a whole, which, in turn, may cause an uplift in economic activity. This should help to improve the environmental quality of the cities where people live and work, as well as their overall quality of life (Ragheb et al., 2016) [6].
A research area in Jabal Al Natheef was chosen for the present study (Figure 1). Jabal Al Natheef is a congested neighbourhood. This trait has several effects on its spatial fabric and, as a result, has an impact on the social environment of its people. It is critical for urbanists to discuss comparable examples of overcrowding in Jordan’s unofficial settlements, where people may face psychological and health concerns. Although this area has established some elements that are favorable toward its community over the years, congestion still has significant negative effects that must be addressed and resolved, according to Altal et al., 2018 [2].

1.2. Thermal Comfort in Outdoor Spaces

Long, hot, and dry summers and relatively cold winters characterize Amman’s climate. Based on this, it is difficult to plan for both seasons. Amman has a dispersed urban structure with low floor-area ratios in many locations, particularly in residential districts. Since some sun radiation is able to reach the street level, this style of urban design is warm throughout the winter season. However, because it provides minimal shade for walkers, the existing design is not well adapted for the long, hot, and dry summer season (Johansson, 2009) [7].
Solar radiation and the ambient temperature frequently draw individuals to use outdoor places or motivate them to spend more time outdoors than they intended (Nikolopoulou and Lykoudis, 2007) [8]. The annual rhythms of the sun have a strong influence on solar radiation and ambient temperature in metropolitan areas. Solar radiation levels are higher near the summer solstice, resulting in a warmer feeling than that experienced during the winter. Cloud cover is also a factor, since it can disperse solar energy, reducing its warming effect.
People’s outdoor thermal comfort may also be influenced by humidity levels. People are prone to feeling thermally uncomfortable when humidity levels are too high or too low, especially when temperature levels are also high (Nikolopoulou and Lykoudis, 2007) [8]. Humidity is not always included in indices for evaluating thermal comfort, unlike sun radiation, wind, and ambient temperature. This is since most studies that generate comfort indices focus on temperate climates where humidity does not play a role in thermal comfort (Sangkertadi and Syafriny, 2012) [9].
The primary goal of this research is not to produce an idealized plan based on environmental considerations, but rather to provide a workable plan that is economically viable and which recognizes that the planner must consider other factors in addition to transportation system requirements (Ragheb et al., 2016) [6]. Mills, 2006 [10] noted that, while the meteorologically ideal settlement serves a beneficial pedagogical purpose, it does not recognize planning realities wherein climate issues are hardly a dominant factor.
Urban codes have resulted in Amman’s dispersed urban form. Street canyons feature low height-to-width ratios due to restrictions on maximum building height, minimum road widths, and front setbacks. As a result, the floor-to-area ratios are poor. More shade at street level is required to produce a climate-conscious urban design that considers the hot summer temperatures. This can be accomplished by using a more compact urban design with higher height-to-width ratios than are currently used, as well as various sorts of overhead shading, such as arcades and other types of covered pathways. The cold season must also be considered, and some bigger streets and open public places should be created to provide solar access. To provide a climate-conscious urban design, Amman’s urban codes must be updated and made more flexible. Pedestrian shading at street level and in public locations should ideally be encouraged by urban codes (Johansson, 2009) [7].
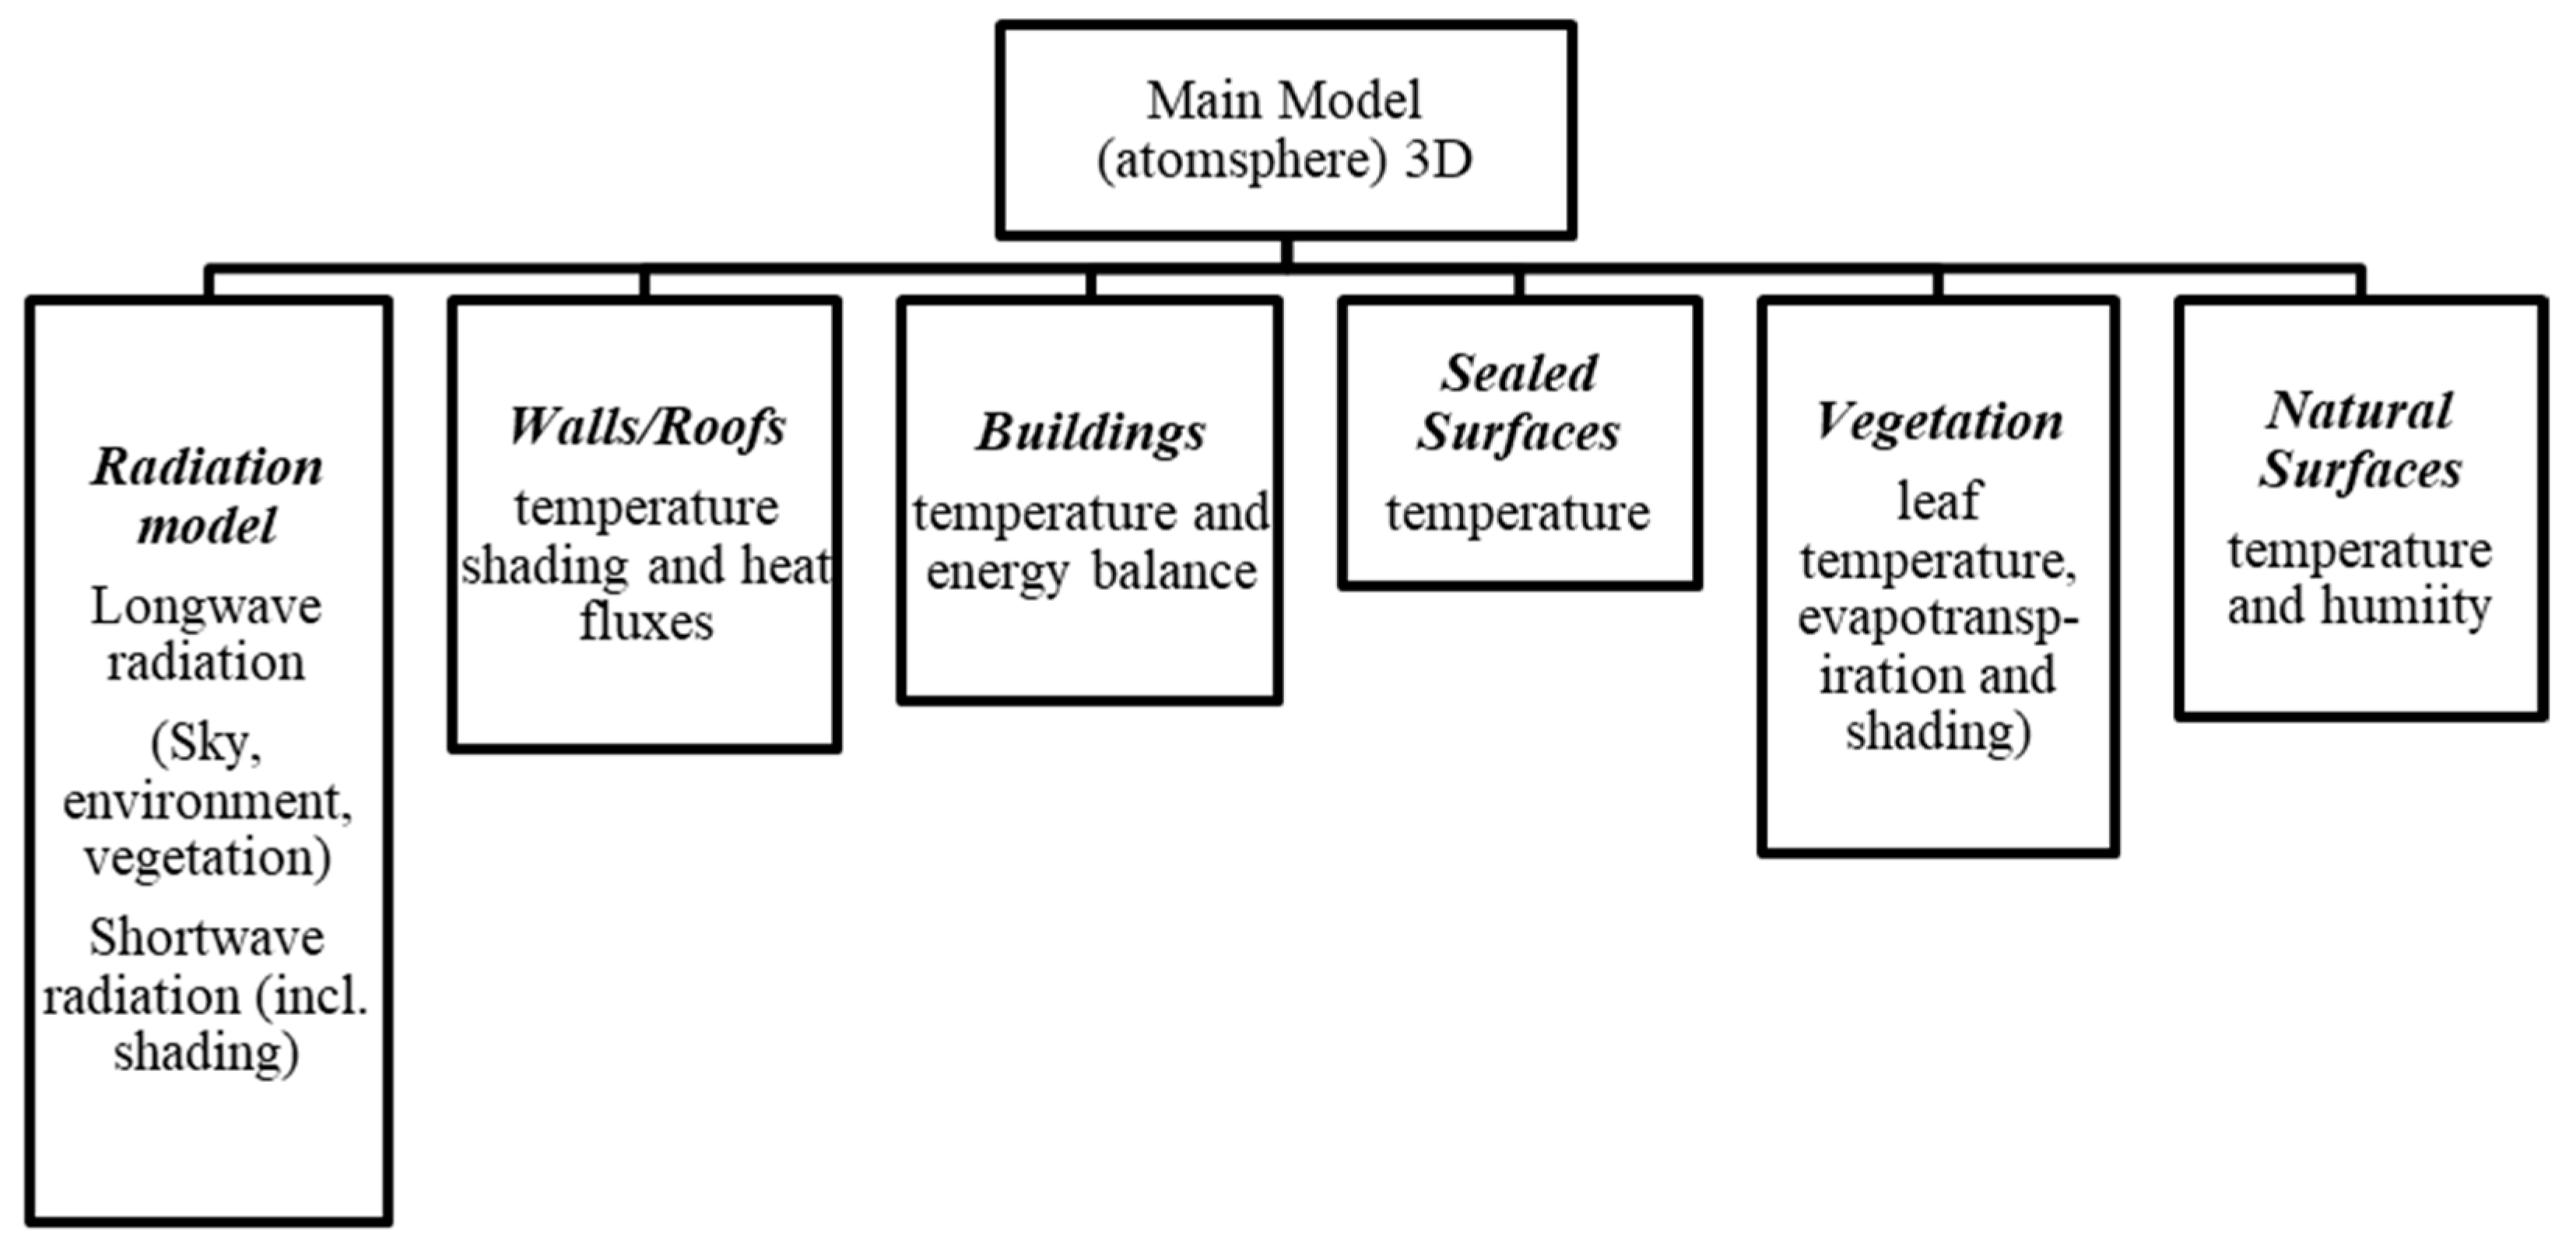
The important prognostic factors identified by ENVI-met include wind speed and direction, air and soil temperature, air and soil humidity, radiative fluxes, and gas and particle dispersion (Bruse and Fleer, 1998) [11]. Short-wave and long-wave radiation fluxes, temperature, humidity, wind flow (speed and direction), and turbulence are all predicted by the atmospheric model (Huttner, 2012) [12]. A combination of various sub-models must be used to calculate these variables, as shown in Figure 2.

2. Materials and Methods

This research develops several scenarios for implementing a green infrastructure strategy in order to determine whether it is possible to improve Jabal Al Natheef’s outdoor thermal comfort. To enhance the user’s thermal perception and the behavioral perspective, this research determines how designers can alter the climatic conditions in urban spaces for thermal comfort and better understand the relationship between outdoor thermal comfort, urban design, and the microclimate. Furthermore, we aim to turn the process of predicting outdoor thermal comfort into a tool that can be used at the basic design stage of undertaking a project in Jabal Al Natheef. In addition, we evaluate the outdoor thermal performance in the area with respect to occupant behavior. This research focuses on the climatic parameters of summer. It provides a complete framework for analyzing and anticipating the effects of various design measures and their characteristics on the outdoor microclimate.
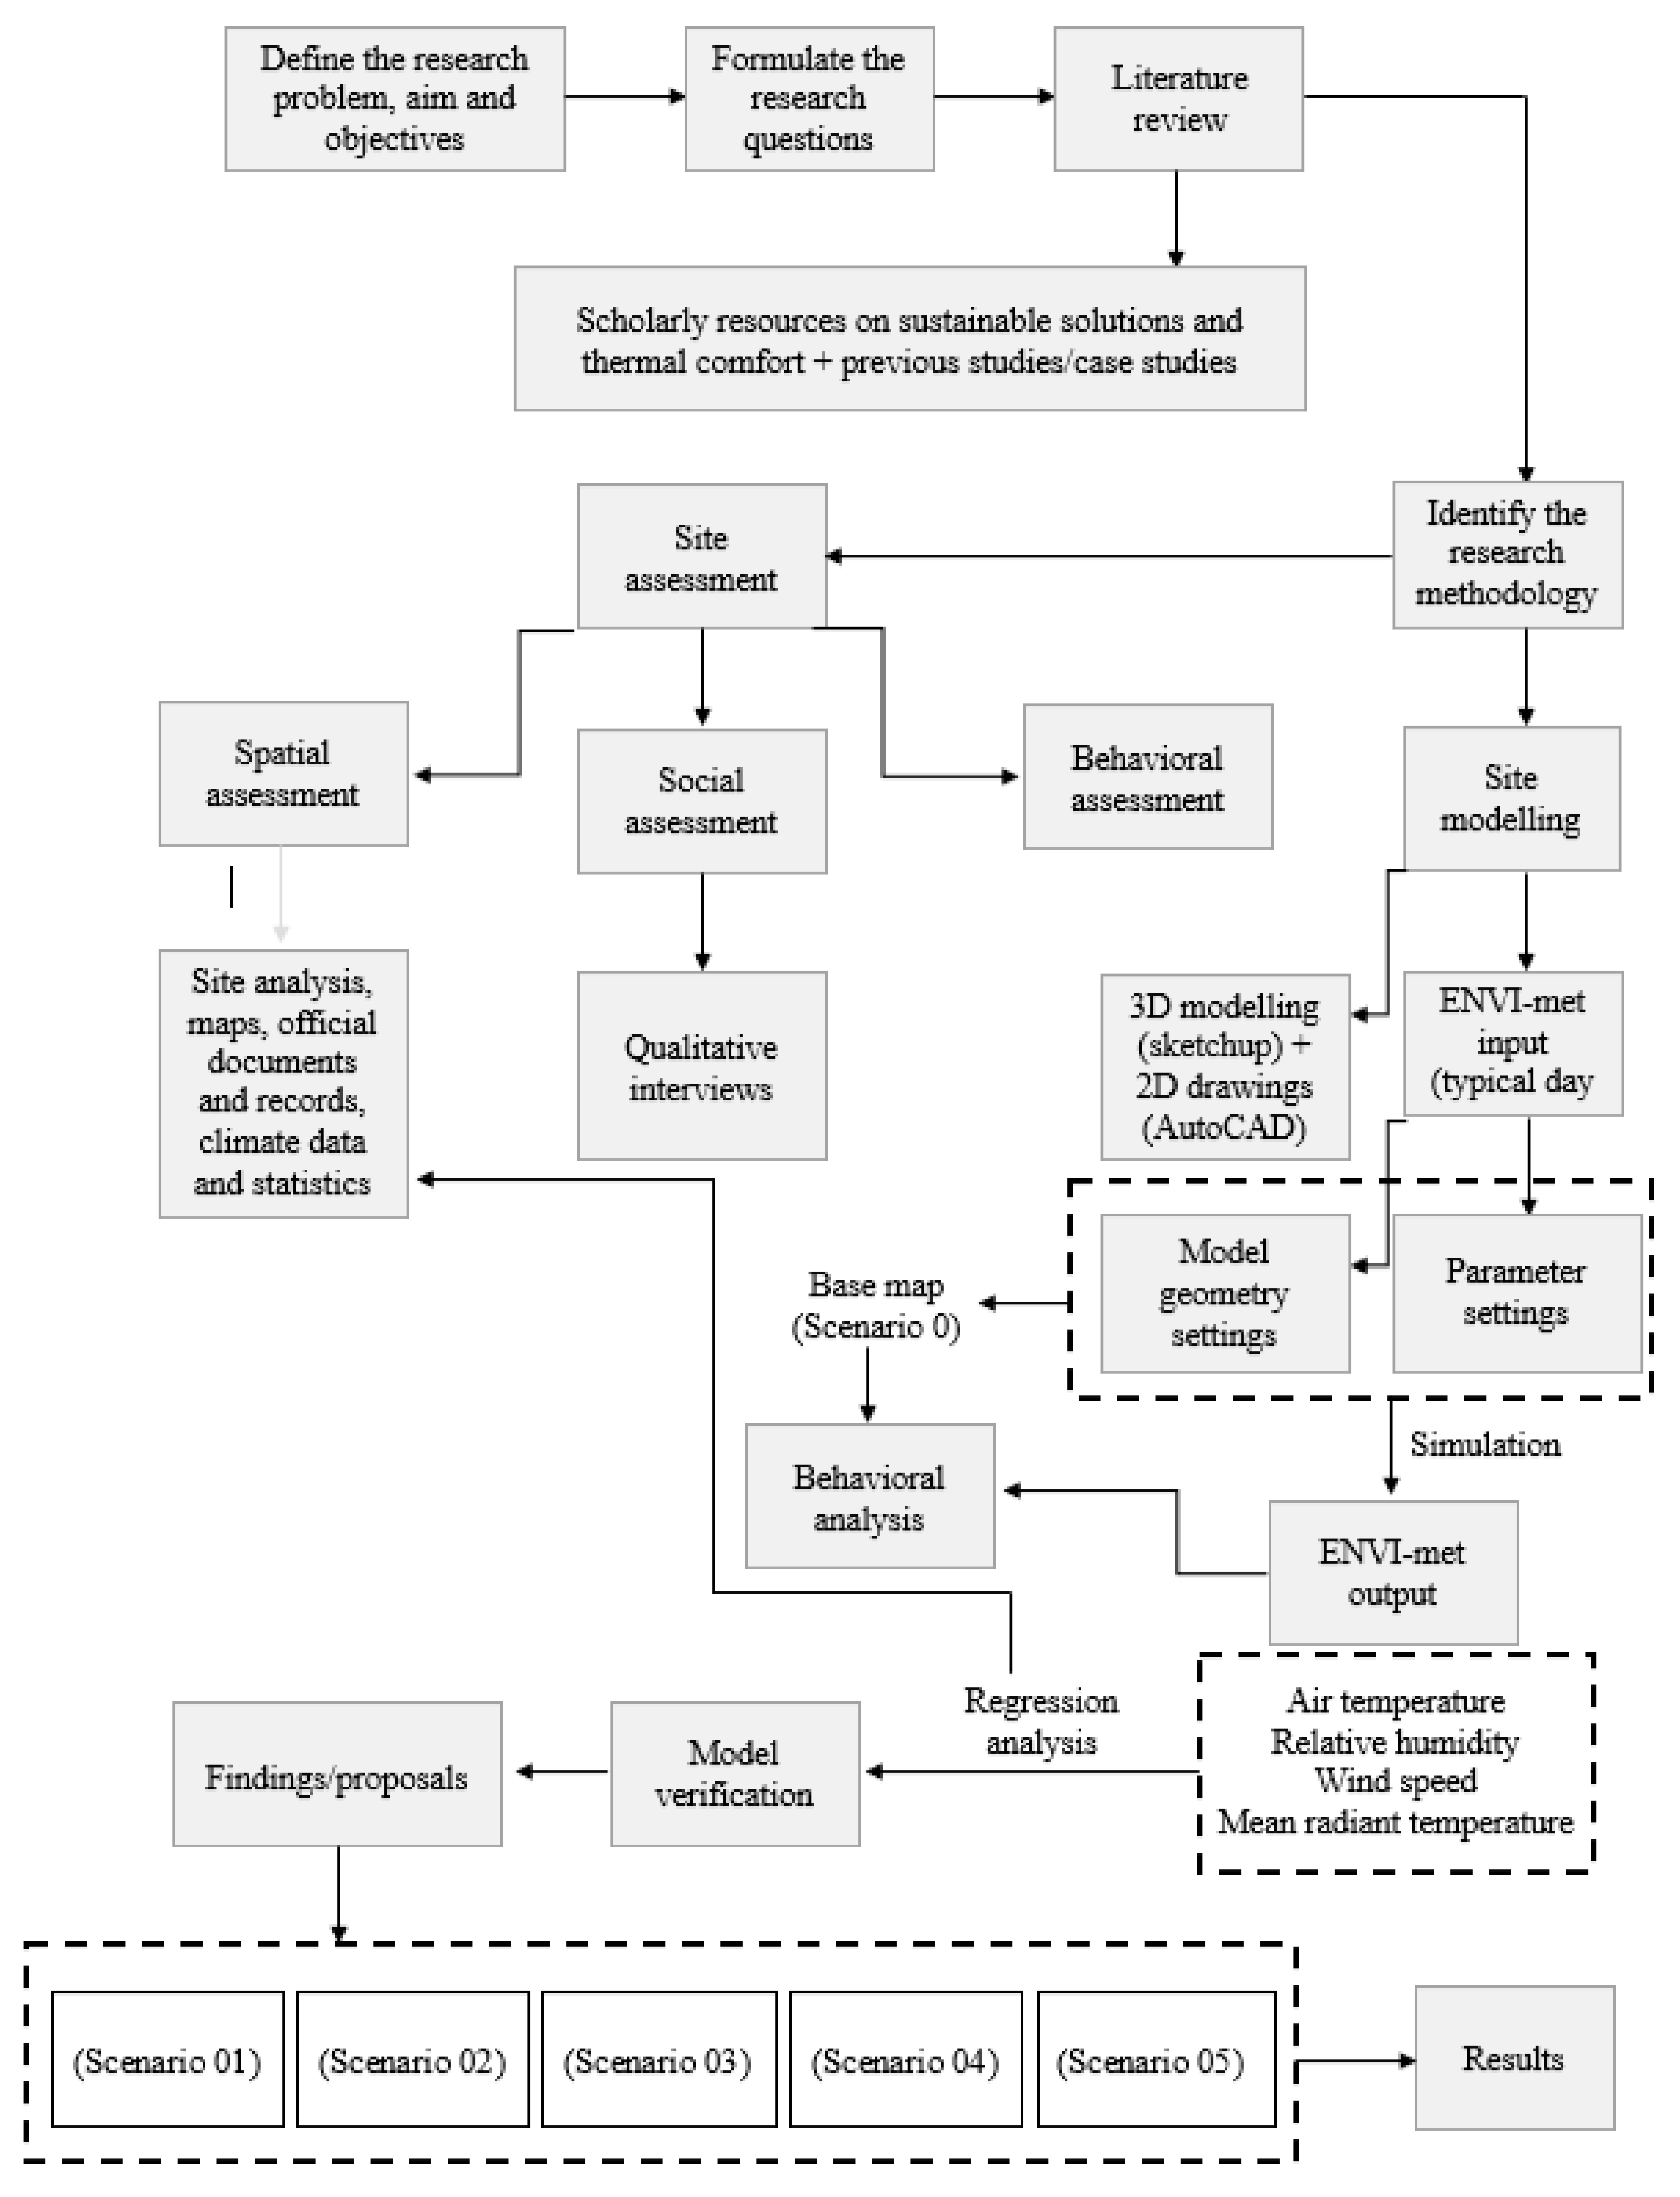
The ENVI-met simulation program was chosen for this research to simulate the scenarios in Jabal Al Natheef. Its main advantage is that it is able to replicate the key atmospheric processes that influence the microclimate, such as the wind and its turbulence, radiation fluxes, air temperature, and relative humidity, by utilizing the fundamental principles of thermodynamics and fluid mechanics. Figure 3 shows the steps for the strategy while Figure 4 shows the methodological framework.
The research includes researching and analyzing the study area in terms of thermal comfort and evaluating the performance of the current situation in Jabal Al Natheef. It identifies the problem, solutions, and contextual scenarios for design elements to be integrated in the site by highlighting the effectiveness of the proposed plan. This research compares different scenarios in the study area, which includes green roofs, green walls, and vegetation; recommendations are then given based on the results. The methodological framework of this research concentrated on the initial process from which the proposed built environment was developed. The preceding step included site assessment, in which a spatial assessment and a social assessment were conducted. The spatial assessment focused on site analysis, official data, climate data, statistics, maps, and datasheets. Design standards manuals were also included to help establish the criteria of the design. In the social assessment, qualitative interviews were conducted to develop an understanding of occupants’ behaviors, their levels of satisfaction, and their needs in terms of thermal comfort and its components.
The collected data were used to initialize the base scenario for the simulation process, which was built to obtain the most feasible and realistic model of the current situation. It also helped assess the different scenarios for the proposed green infrastructure of Jabal Al Natheef based on the data collection. Each of the previous steps added an input for the simulation model and played an important role in the simulation. Figure 4 shows the methodological framework process.

3. Analysis and Data Collection

3.1. Scenario Development

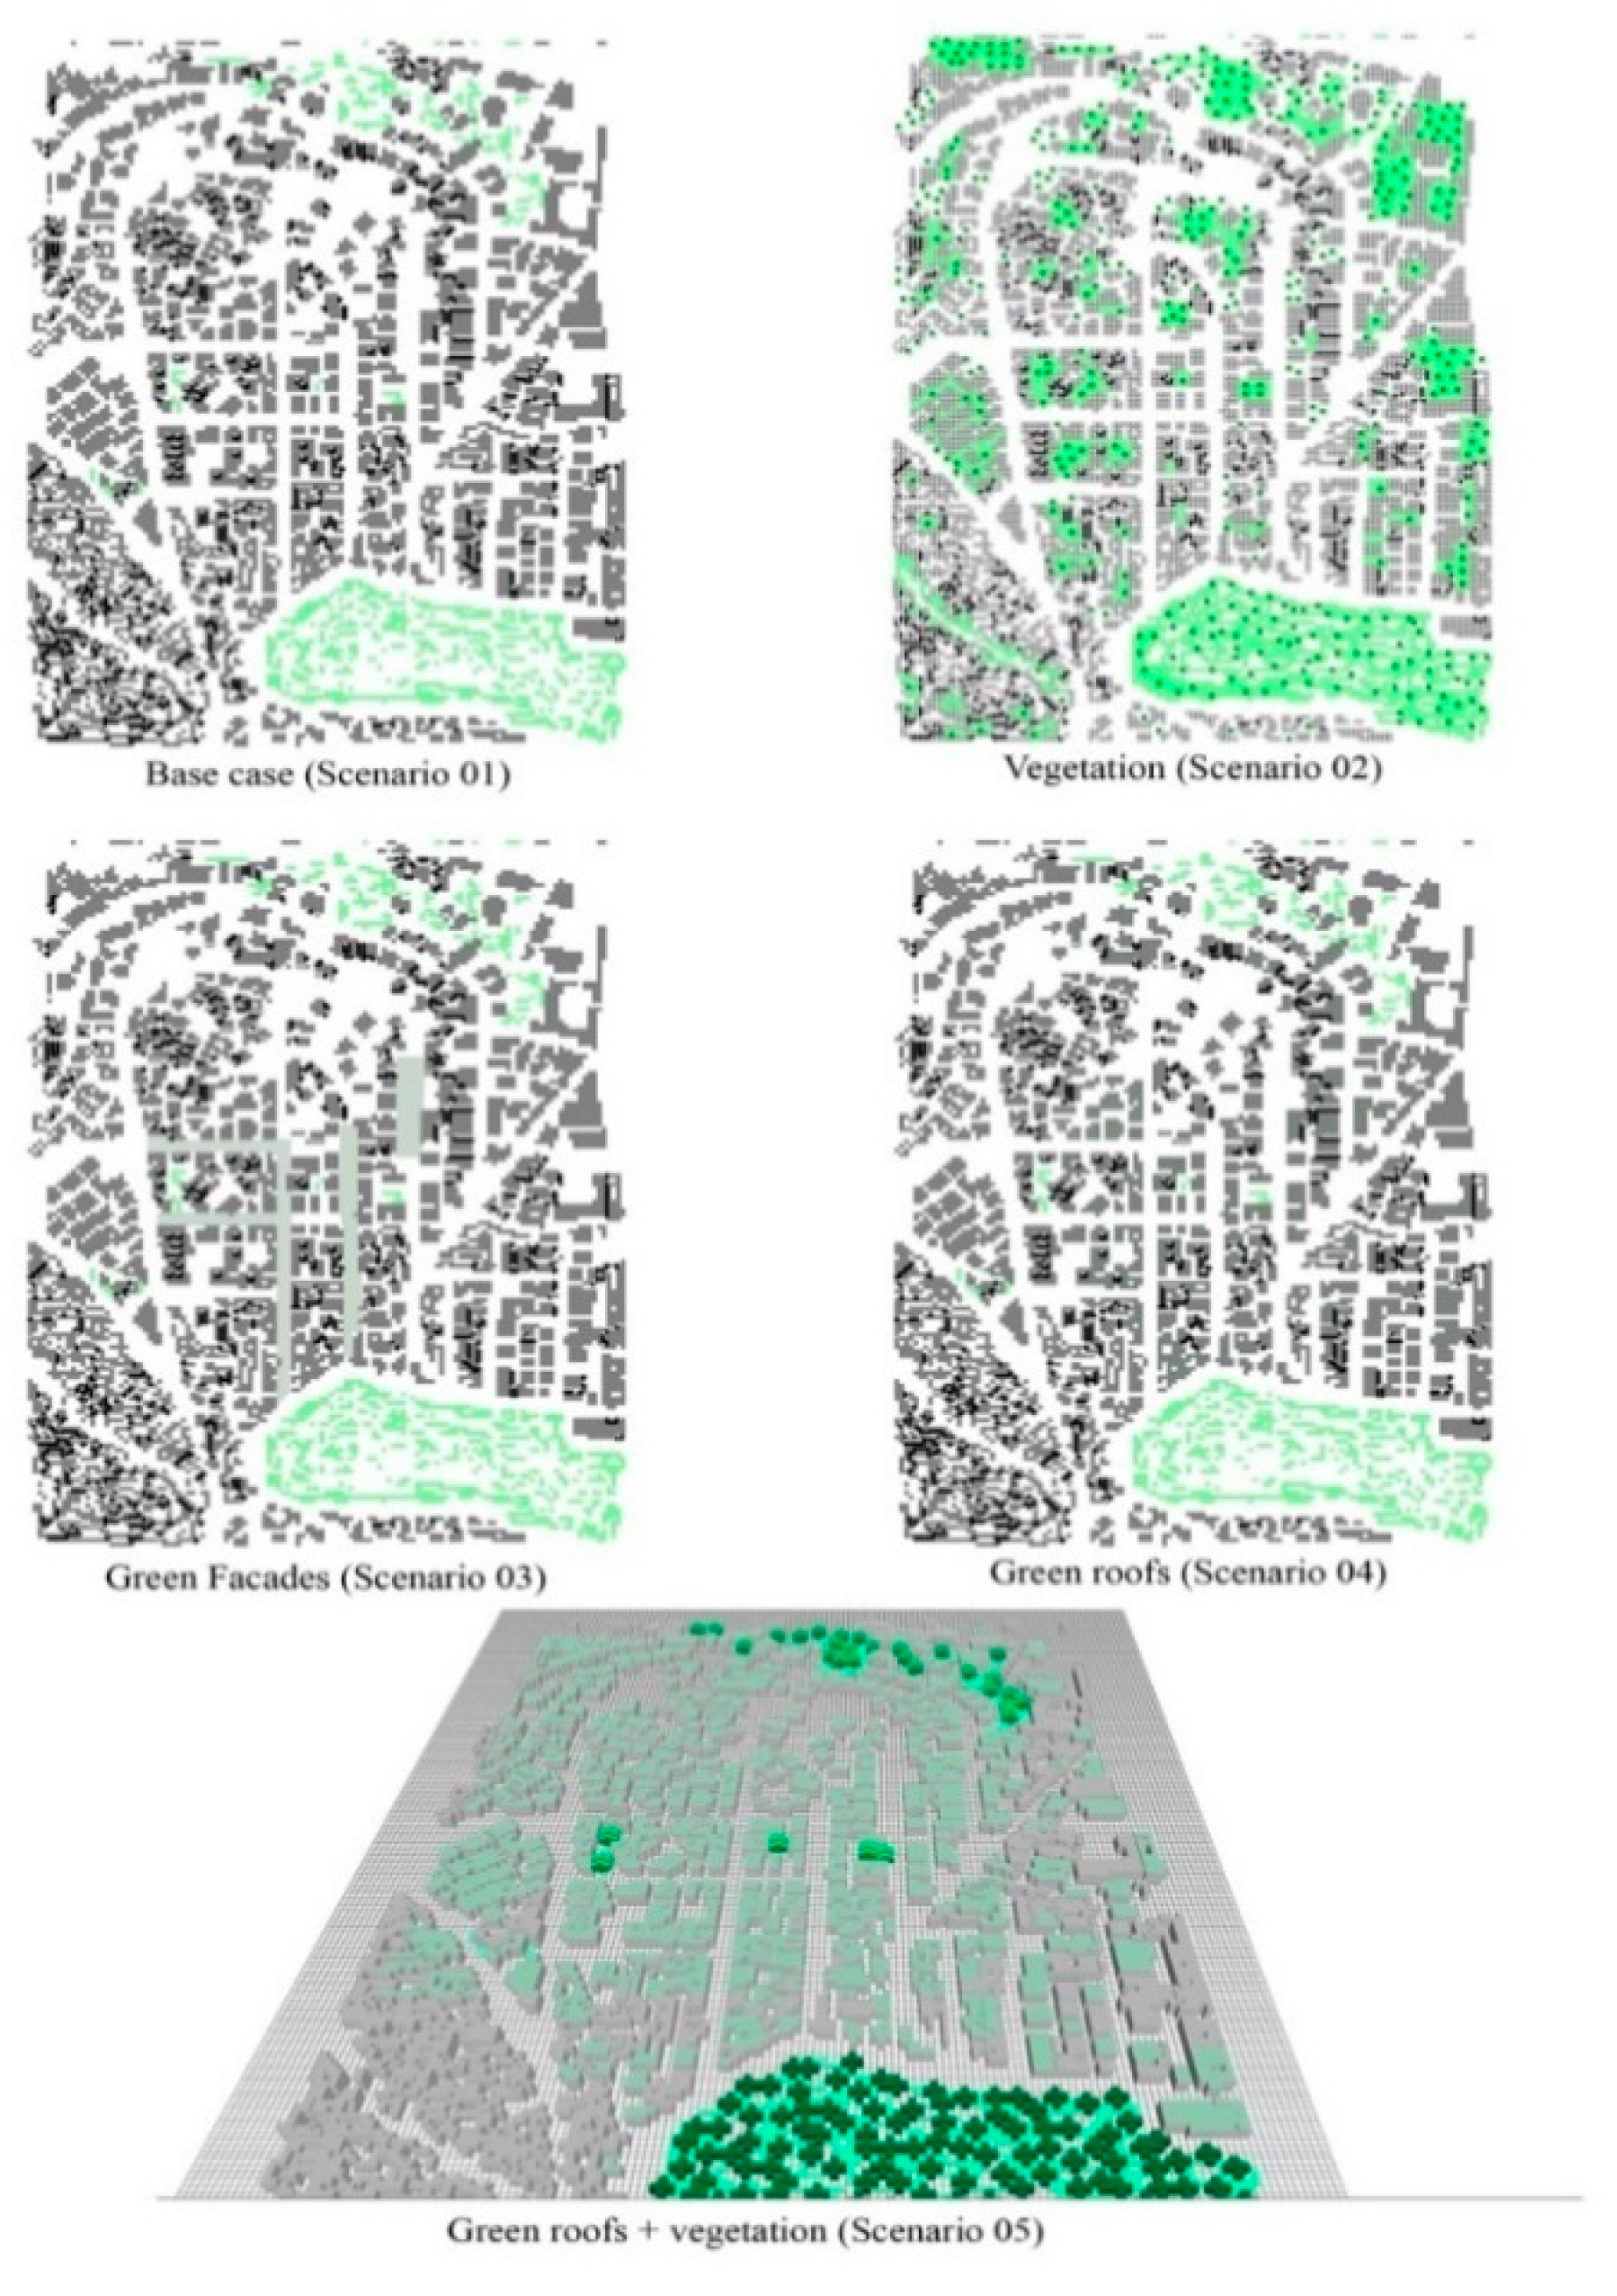
The study area is highly condensed and overcrowded and has narrow streets. This urban neighborhood in Amman’s eastern district is one of the city’s oldest and most densely populated. It lies in the Ras Al-Ain district, and it has an estimated population of 54,000 people, who reside within an area of 0.078 km2. When compared to Amman’s urban density, which is 528.8 person/km2, Jabal Al-Natheef’s urban density, which is 69,269, is very high (Arini, 2014) [1]. Therefore, efforts to plan a green infrastructure strategy were limited by the lack of space, and design solutions were mostly placed on roofs and walls. The first case scenario created the base map as a foundation for the next scenarios. The base map represents the current situation with its vegetation and building forms. The green areas were placed in the available open spaces. Green envelopes were placed on buildings that were parallel to streets, since the streets are too narrow to locate any greenery on the sides of the pavement. Buildings’ roofs were used as green roofs to enhance air quality and reduce heat stresses. Each scenario was placed as shown in Figure 5.

3.2. Smartphone Applications

Two main applications were used on site to help assess the thermal comfort of the space: the Heat Index application and the Thermo Hygro application. The Heat Index application combines air temperature and relative humidity. It shows a prediction of “feeling” in the space. It works with air temperature and other environmental conditions such as humidity and wind. The Thermo Hygro application includes an optimal algorithm specially created for the THI (thermo-hydrometric index). It gives a forecast for the next 10 days, along with the outside temperature and humidity.
To efficiently obtain the best results, an area in Jabal Al Natheef was chosen for the simulation analysis, as shown in Figure 1. A 3D depiction of the research area is provided by ENVI-met after combining the inputs from the 2D model.
The current situation of the site is presented as an initial scenario (0), while sustainability-based solutions are presented in four scenarios (01–04). Scenario 01 is for vegetation, scenario 02 is for 50% green roofs, scenario 03 is for 75% green roofs, scenario 04 is for green façades, and scenario 05 is a solution where vegetation and green roofs are combined.
The vegetation scenario incorporated different types of trees and green covers while maintaining the same aspects of the urban layout and ground cover materials present in other places. Table 1 shows the vegetation specifications. The materials used in the modeling stage of the site resemble those currently found in the area, and they include asphalt, grass, and loam soil for exposed soil areas. As for buildings, concrete walls were mostly used.

3.3. Space Modeling Phase

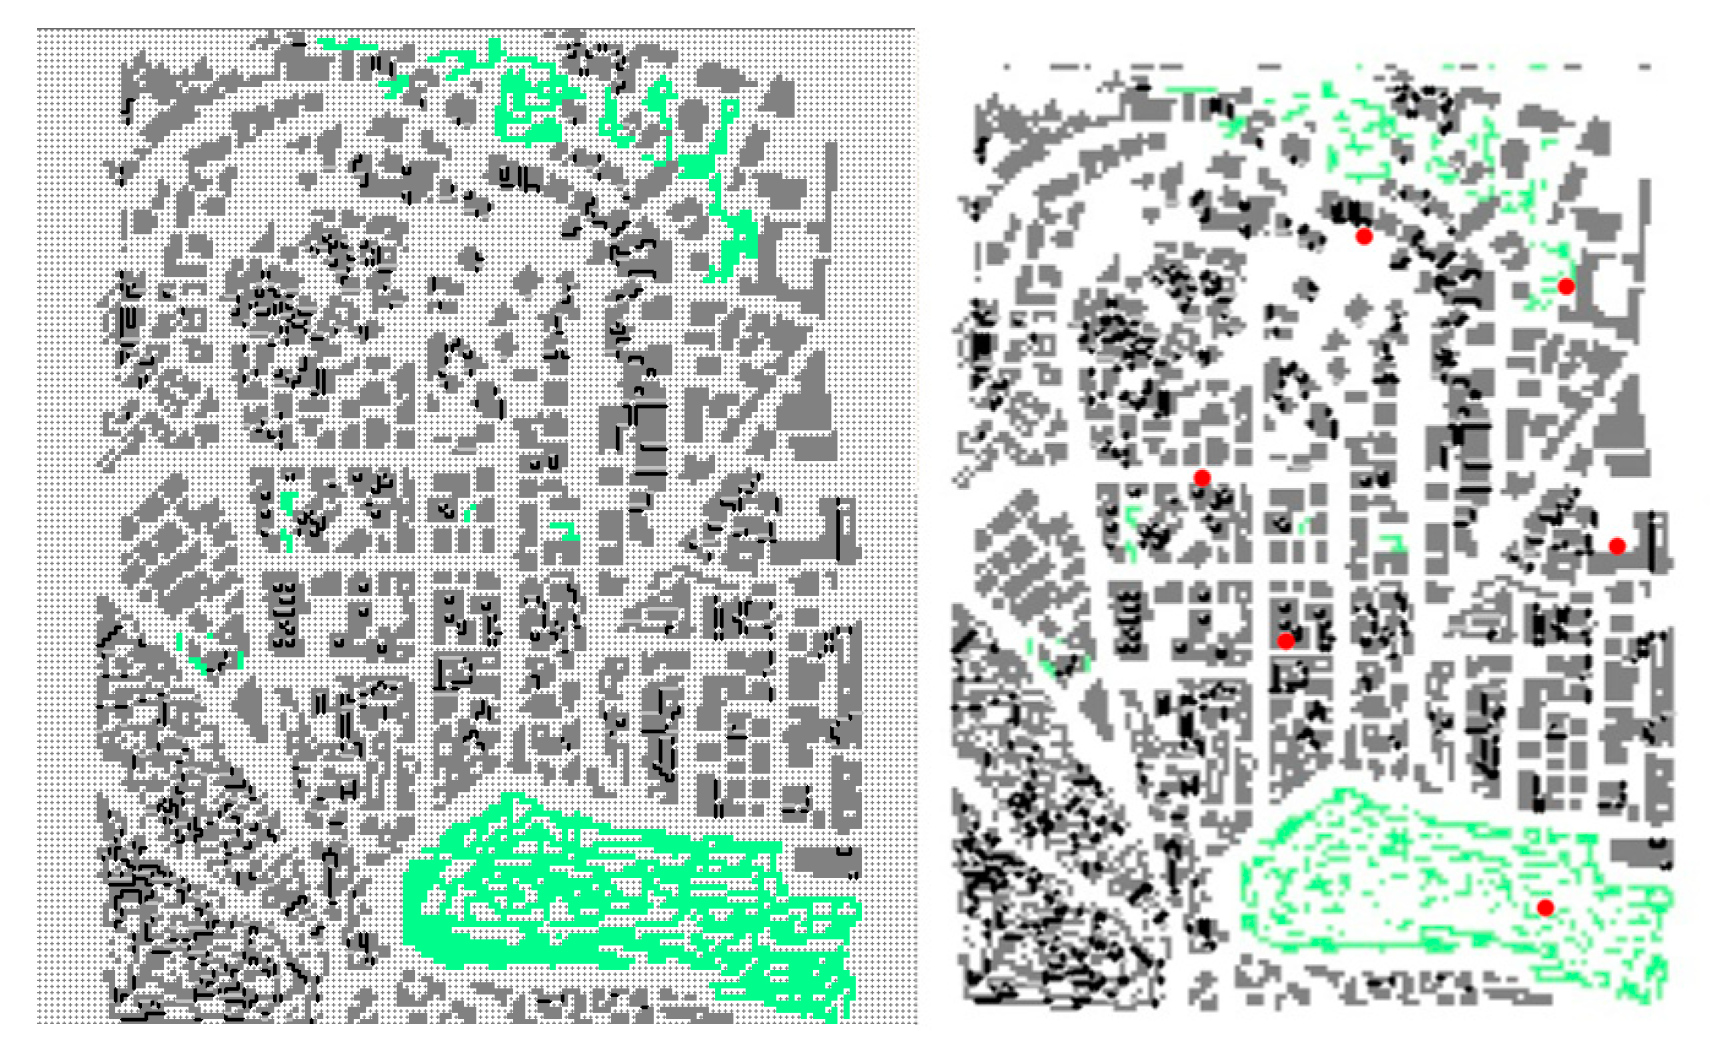
One of the ENVI component’s named spaces was used to create a 3D model of the site, with the initial AutoCAD format drawings serving as the model’s foundation. The grid system used for modeling in spaces has a default resolution of 4 m, considering it uses an urban scale. The site is a large-scale site, fitting to a dimension of 660 × 500, as shown in Figure 6, which is represented in 145 × 185 × 15 grid cells. This resolution was chosen to provide a detailed representation of the area.
The atmosphere, surface (which includes diverse surface covers, buildings, and flora), and soil are the three layers that the model considers while analyzing interactions, as shown in Figure 6. Maximum and minimum air temperature and relative humidity readings, as well as the average wind speed and wind direction, are all included in the meteorological data for the model. The tallest points of the structures only reach 14 m, which is sufficient to avoid any boundary concerns that can arise due to the proximity to the upper limit of the model; therefore, “equidistant” was chosen as the method of vertical grid generation. In terms of vegetation, through Albero, ENVI-met users can build their own vegetation databases.

3.4. Simulation

The simulation process took place on a typical summer day on the 21 June. To begin with, an EnergyPlus Weather file format (EPW) was used as an indication for the weather parameters where weather data can be facilitated for analysis. However, the EPW file can force climate conditions into the simulation for more detailed results, rather than assuming each component. Table 2 summarizes the initial simulation inputs and settings that were used in this phase.

3.5. Thermal Comfort Indices

The Physiological Equivalent Temperature (PET) is a helpful measurement in this research paper because it is used for outdoor environments. To offer a rigid assessment of the green infrastructure implementation of the scenarios, ENVI-met calculates thermal comfort indices using BIO-met through the simulation data gathered. According to ENVI-met, standard parameters were chosen for the PET calculation, as shown in Figure 7.

3.6. Climate Forces in Jordan

Jordan’s climate is primarily of the Mediterranean variety, with two brief transitional seasons that begin in October and end around mid-April. It is distinguished by a hot, dry summer and a somewhat cold, wet winter. The wet season begins in October and lasts until May. As a result, the rainy season spans two fiscal years. For instance, the rainy season 2005/2006 includes the months of October, November, and December of 2005 and the months of January, February, March, and April of 2006. The summer months of June, July, and August are moderately hot with temperatures ranging from 24 to 27 degrees on average. August is the warmest month, with a 32.8 °C average maximum temperature (Freiwan, 2007) [13]. According to the World Meteorological Organization, to define a climate in a certain area, 30 years is the period required to perform the statistical analysis. Table 3 shows the climate mean for the Amman Civil Airport station in the period between 1989 and 2018.
Since 1960, Amman has undergone climate change, whereby the annual maximum temperature has increased by between 0.3 °C and 1.8 °C, according to Amman’s climate action plan. Results from several research studies show a decreasing trend in annual precipitation, along with an increase in the minimum, maximum, and mean temperatures (Abdulla, 2020 [15]; Matouq et al., 2013 [16]). A study on heat waves discovered a statistically significant pattern in their summertime duration, frequency, and intensity (Shehadeh and Tarawneh, 2014) [17]. In the past 96 years, Amman has experienced 34 heat waves. Typically, one to two heatwaves happen in the summer and autumn of each year. When higher temperatures and climate change arise, increases in the amount and intensity of rainfall occur.

3.7. Existing Materials’ Surfaces

The material surfaces that existed on site were located on streets and buildings; they included asphalt, concrete, stone, and trees. The buildings have been damaged over time, mostly by weather conditions and natural disasters. There are no building guidelines, and the structural pieces were built up to fulfill privacy and expansion needs. These materials can barely absorb water, and therefore lack an evaporative cooling effect, contributing to higher air temperatures. The site consisted of large-mineral-based surfaces, which can have the effect of increasing the temperature.

3.8. Vegetation

Currently, there is not much greenery in the area. Introduced plants and a few sparse, fragile species that ascend hills make up the vegetative cover. However, certain wildlife, including birds, insects, and tiny animals, are supported by these plants. The site visits recorded a total of five genera: Olea, Ceratonia, Pinus, Acacia, and Eucalyptus.

3.9. Scenario Development

There is a lack of vacant spaces on site; therefore, green infrastructure implementation was mainly proposed for roofs and façades. Based on the literature review, site assessment, and interviews with occupants on site, the proposed solutions for on-site thermal comfort address the following issues (Table 4, Figure 8). Scenario 01 is for vegetation, scenario 02 is for green roofs (50%), scenario 03 is for green roofs (75%), scenario 04 is for green façades, and scenario 05 is a solution where vegetation and green roofs are combined.

4. Results

4.1. Potential Air Temperature (PAT)

Figure 9 shows the potential air temperature on the 21 June and the degree of difference between the base case and the proposed scenarios. The average potential air temperature over 24 h was measured for the six chosen points on site, which were selected to ensure good distribution throughout the area in order to obtain an average value. The height is 1.8 m. Table 5 shows the PAT reduction by comparing the temperatures of the base case and the proposed scenarios; the hours were divided throughout the day to show a detailed analysis of the temperature.

4.1.1. Base Case and Vegetation (Scenario 01)

As illustrated in the graph, the maximum average PAT measured in the base case was 30.5 °C. The values were calculated at a pedestrian level (1.8 m) for six receptors chosen in the research area. After applying the vegetation, the greatest reduction in temperature due to vegetation implementation was observed in the daytime between 11:00 a.m. and 5:00 p.m., while there was no clear reduction during the night or at sunset. Therefore, vegetation did not have a significant effect on PAT during the night. For more specific results, a numerical data analysis was performed to validate the proposed scenarios on site. The maximum PAT reduction was measured at −0.88 °C, which was found between 4:00 a.m. and 7:00 p.m. Based on the literature review, achieving a 0.88 °C reduction in PAT has a positive impact on the site. This indicates that vegetation can lower air temperature by 0.8 °C. Meanwhile, it was shown that, between 8:00 p.m. and 11:00 p.m., the PAT was reduced the least due to the absence of sun radiation. During the nighttime, the PAT recorded the lowest level of reduction. The distribution of the PAT was analyzed in terms of space to obtain the efficient implementation scenario and to gather a better understanding of where to place each scenario parameter (Figure 9).

4.1.2. Green Roof Case (50%) (Scenario 02)

The maximum average PAT measured in the base case was 30.5 °C. The maximum PAT reduction was measured at −0.07 °C between 8:00 a.m. and 11:00 a.m. and between 12:00 p.m. and 3:00 p.m. Based on the literature review, achieving a 0.07 °C reduction in PAT does not prove a scenario’s efficiency. This indicates that green roofs covering only 50% of the roofs in the area barely reduce the temperature. Meanwhile, it was shown that, between 8:00 p.m. and 11:00 p.m., the absorbed heat during the day was released, resulting in an increasing PAT in the area.

4.1.3. Base Case and Green Roof Coverage of 75% of the Area (Scenario 03)

The maximum PAT reduction was measured at −0.08 °C between 12:00 p.m. and 3:00 p.m. This indicates that green roofs covering 75% of the roofs in the area cannot reduce the temperature by the required amount. Additionally, it was shown that, between 4:00 a.m. and 7:00 a.m., the heat absorbed during the day was released, increasing the PAT of the area. By providing shade and redistributing the available energy to higher latent heat fluxes through evapotranspiration, green roofs minimize sensible heat flow.

4.1.4. Base Case and Green Facades (Scenario 04)

The PAT was only reduced by −0.01 °C between 8:00 a.m. and 11:00 a.m. and between 4:00 a.m. and 7:00 a.m. Based on the literature review, a reduction value of 0.01 °C is insufficient. Heat was released during the night by 0.01 °C, which was then absorbed during the day. A green façade cools the air around it, which cools the streets.

4.1.5. Base Case and a Combination of Green Roofs with Vegetation (Scenario 05)

The average PAT in the base case was valued at 30.5 °C, whereas, in the combined scenario, it was valued at 30.3 °C. In the combined scenarios where vegetation and green roofs met, there was a range of reductions in PAT. The time between 8:00 a.m. and 11:00 a.m. witnessed the highest reduction in temperature, with a value of −0.5 °C. Meanwhile, a release of the absorbed temperature occurred between 8:00 p.m. and 11:00 p.m., recording a value of 0.08 °C. The results show that green roofs can release temperature as they absorb it, which does not impact the reduction at other times. This indicates that vegetation has a better effect on reducing the PAT in the area.

4.2. Mean Radiant Temperature

4.2.1. Base Case and Vegetation (Scenario 01)

The proposed vegetation scenario had a recognizable impact on the mean radiant temperature, as shown in Figure 10. The tree canopies proved that they could reduce the mean radiant temperature of the area. Notably, they decreased the MRT during the day; on the other hand, they also increased the MRT during the night due to the radiation absorbed during the day and stored below the trees. The base case recorded an MRT of 30.43 °C and the vegetation scenario recorded an MRT of 29.17 °C.
As shown in Table 6, a variation in MRT in relation to the base case scenario resulted in a maximum reduction of 6.58 °C. Based on the literature review, a reduction value of 6 °C is considered sufficient and effective to achieve thermal comfort. The highest value occurred between 12:00 p.m. and 3:00 p.m., where sunlight is the most intense. During the day, the tree canopies trap the radiation underneath, only to release it during the night, resulting in an increase in MRT at that time. The lowest value was recorded between 4:00 a.m. and 7:00 a.m.; meanwhile, between 4:00 p.m. and 7:00 p.m., the trapped MRT was released and increased by 3.20 °C. Between 8:00 p.m. and 11:00 p.m., the radiation was increased by 0.74 °C.

4.2.2. Base Case and Green Roof Coverage of 50% of the Area (Scenario 02)

According to Figure 10, there was no significant change in MRT when implementing green roof coverage of 50% of the area due to its minimal impact on the pedestrian level (1.8 m high). The base case recorded an MRT of 30.43 °C and the green roof scenario recorded an MRT of 30.37 °C. The maximum reduction value was recorded between 12:00 p.m. and 3:00 p.m., with a reduction of 1.17 °C. Meanwhile, the lowest reduction value (0.02 °C) occurred between 8:00 p.m. and 11:00 p.m. and between 4:00 a.m. and 7:00 a.m. due to the absence of sun radiation.

4.2.3. Base Case and Green Roof Coverage of 75% of the Area (Scenario 03)

There was no significant change in the mean radiant temperature when implementing green roof coverage of 75% due to its minimal impact at the pedestrian level (1.8 m high). Where the base case recorded an MRT of 30.43 °C, the scenario with green roof coverage of 75% of the area recorded an MRT of 30.37 °C.

4.2.4. Base Case and Green Façades (Scenario 04)

The green façade scenario, in contrast, exhibited an upward trend in the values because of increased radiation emitted from building materials, and did not lower mean radiant temperatures during the day.
The average mean radiant temperature measured in the base case was 30.43 °C. Meanwhile, the average mean radiant temperature after implementing the green façade scenario was measured at 30.47 °C, since green façades cannot have an impact at the urban level.
According to these results, the reduction values using different receptors in the streets where green façades were implemented were compared to the values in the base case, in order to determine the impact at the street level; these figures are shown in Table 6.

4.2.5. Base Case and the Combination of Green Roofs and Vegetation (Scenario 05)

The base case recorded an MRT of 30.43 °C and the combined scenario recorded an MRT of 29.21 °C. The highest reduction value was recorded between 8:00 a.m. and 11:00 a.m. (3.56 °C); meanwhile, the lowest value (0.41 °C) was recorded between 4:00 a.m. and 7:00 a.m. Table 6 show the reduction values when implementing the combined scenario.
Due to the radiation trapped under the tree canopies, the usage of a tree canopy in the green street scenario significantly reduced the mean radiant temperatures during the day while increasing the mean radiant temperature values during the night, between 8:00 p.m. and 11:00 p.m.
In addition to vegetation, green roofs also contributed to decreasing the MRT in this scenario. Changes in MRT may result from the installation typology of a green roof since its soft surface emits less long-wave radiation than the base roof’s hard surface. The MRT can be impacted by leaf coverage and density; as a result, temperature changes can be affected by programmed inputs in ENVI-met.

4.2.6. Vegetation, Green Roofs (75%), and Green Façades

Vegetation clearly decreases MRT compared to the other two scenarios. Where the maximum MRT of vegetation was at 29.17 °C, it was 30.37 °C when implementing green roofs and 30.47 °C with the implementation of green façades.
These results confirm that green façades only have an impact at the street level facing the placement and have no effect at an urban level.

4.3. Wind Speed

Applying trees can reduce wind speed on a pedestrian level (1.8 m high). In our scenario, trees were placed 8 m apart. This emphasizes the fact that trees can impede wind from the ground level to the treetops. The average wind speed in the base case was measured at 0.56 m/s; meanwhile, after implementing vegetation, it was recorded as 0.44 m/s. The most significant difference in wind speed occurred between 12:00 p.m. and 3:00 p.m. Table 7 shows the variation in wind speeds of the vegetation scenario in comparison to the base case of Jabal Al Natheef. There is a remarkable difference in wind speed due to the implementation of vegetation, where the most pronounced reductions occurred between 12:00 p.m. and 3:00 p.m. (−20 m/s) and between 4:00 p.m. and 7:00 p.m. (−18 m/s). The lowest reduction occurred between 4:00 a.m. and 7:00 a.m., with a value of 0.13 m/s. According to the literature review, a wind level of 0.5–1.5 m/s constitutes a pleasant, light breeze that allows occupants to be thermally comfortable.
When implementing green roof coverage of 50% of the area, no significant difference in relation to the base case was found, although a slight reduction in wind speed was demonstrated upon the implementation. The average wind speed in the base case was measured at 0.56 m/s, while in the green roof scenario, it was 0.55 m/s. Therefore, green roof coverage did not have a considerable impact on wind speed.
As shown in Table 7, the reduction in wind speed in the implementation scenarios always had a constant value of 0.01 m/s. This indicates that the green roof strategy has almost no effect on wind speed. Moreover, when implementing green roof coverage of 75% of the area, it also resulted in the same values.
Additionally, when analyzing the wind speed at roof level (11 m) (scenario 03), it was found that the same reduction value occurred. Wind speed varied with height and time, with less fluctuation in airflow at greater heights. The only difference is that, between 8:00 a.m. and 11:00 and between 4:00 a.m. and 7:00 a.m., no reduction value was recorded, considering the hours that featured the maximum wind speed.
Green façades had no role in impacting wind speed at the urban level. This proves that green façades mainly impact the street where they are implemented and have no effect at an urban level. Table 7 shows the similar values of each scenario.
The average wind speed at the pedestrian level (1.8 m high) in the base case scenario recorded a value of 0.56 m/s; this value was 0.44 m/s when green roofs and vegetation were combined.

4.4. Physiologically Equivalent Temperature (PET)

Based on the PET index, scenarios for green infrastructure are investigated for their potential to control the microclimate in Jabal Al Natheef. Six receptors were positioned in the area, and the PET values were calculated at the pedestrian level (1.8 m high). The PET readings for all scenarios indicate that the research area is experiencing moderate to severe heat stress. The average PET for the area is shown in Figure 11. The average PET in the current scenario of Jabal Al Natheef is 30.75 °C. While discomfort and extreme stress can be felt between 11:00 a.m. and 5 p.m., the intensity of PET is most comfortable in the morning. It should be noted that there are modest distribution differences across the model areas. Vegetation implementation results in sufficient PET reduction in the morning and afternoon. This can be explained by the high MRT values caused by tree canopies. However, heat reduction and absorption attributed to vegetation resulted in a variation in PET, where the value increased at night and decreased in the daytime.
The findings show that the use of vegetation on building envelopes has a minimal impact on pedestrians’ high thermal comfort levels, as shown in Table 8.
On the other hand, the combination scenario, in which green roofs and vegetation were combined, indicates that implementing several green infrastructure strategies can be efficient. Table 8 shows that the maximum reduction value caused by the scenario implementation reached 2.01 °C.

4.5. Behavioral Assessment Results

The number of occupants and their related PET thermal index values were illustrated, since the number of users is one of the most fundamental pieces of information related to the use of space. The potential air temperature reached 38.5 °C during the daytime at 12:00 p.m. on 21 June in Jabal Al Natheef, while the PET reached its highest (49.74 °C) at 12:00 p.m.
Social and climatic parameters impact these results. Due to the feeling of insecurity in the area, children tend to play in the outdoor area between 11:00 p.m. and 8:00 p.m., since sunset is at 7:30 p.m. during summer. Open spaces are narrow and incapable of providing enough space for everyone to interact. Thus, the number of space users was highest when the PET was 29.9 °C. The number of people decreased as the PET decreased, and only a few people were present when the PET reached 48.46 °C.
With regard to location selection and movement, when participating in outdoor activities, people chose the locations of their social interactions based on their experiences in the area from a thermal perspective. People may relocate if they are thermally unsatisfied with their initial choice. These decisions might be closely correlated with expectations, experiences, and perceptions of the microclimate.
Users of Jabal Al Natheef defined the areas where they would rather sit and interact or allow their children to play. Through behavioral observations and interviews, it was found that they preferred narrow staircases because the buildings are a source of shade in those areas. Therefore, the initial places they choose constitute psychological representations of their experiences in the environment.
The movements of the users of Jabal Al Natheef are reactions brought on by a confluence of physiological exposure and psychological expectations. In other words, in addition to changes in the physiological heat balance brought on by exposure to the microclimate, humans display appropriate adaptation behaviors based on their expectations and preferences for the microclimate. On-site behavioral observations indicated that people relocate because their impressions of the heat intensity are inconsistent with their psychological experiences and expectations.
Users of Jabal Al Natheef frequently start their searches in shaded areas. This suggests that people prefer to interact in public spaces with shade-giving trees rather than in places directly exposed to the sun’s harsh rays while enjoying outdoor leisure time. According to previous findings, most interviewed occupants believed that shaded areas would have relatively low temperatures based on their prior encounters and expectations, and that these locations would be more comfortable.
As a result, the majority of people preferred to carry out their tasks in shaded places. Few people had started moving again, which suggests that few people were affected by elevated physiological heat loads. Therefore, when exhibiting thermally adaptive behaviors, people relied more on their past experiences, expectations, and other psychological factors than on physiological ones.

5. Discussion

The analysis of the data revealed that vegetation generally has a favorable impact on cooling the air and enhancing thermal comfort throughout the summer. Vegetation is an efficient approach for improving the microclimate and increasing human thermal comfort, since trees and other plants help to cool the surrounding areas.

5.1. Scenario Development

The scenarios were proposed based on a solid methodology where community participation was included to ensure people’s acceptance of new developments. Therefore, qualitative interviews were conducted on site to investigate their demands and the problems they were currently facing in their neighborhood.
Site assessment focused on gathering data to help understand the strengths and weaknesses of Jabal Al Natheef, and to determine what could feasibly and acceptably be included in the green infrastructure implementation. The gathered data included aspects such as the physical environment (building geometry, building heights, surfaces identification, vegetation, transportation, and the footprints and conditions of roofs and façades) and environmental parameters to enhance their functions through the development of green infrastructure. These factors boosted the scenario development stage to achieve a sustainable solution.

5.2. Simulation

Using ENVI-met software, the current situation of Jabal Al Natheef in terms of its climatic parameters was assessed to examine the problem of thermal comfort and to suggest different scenarios. The proposed scenarios were as follows: Scenario 0—base case, current situation; Scenario 01—vegetation implementation in open spaces and in between buildings; Scenario 02—green roofs covering 50% of Jabal Al Natheef; Scenario 03—green roofs covering 75% of Jabal Al Natheef; Scenario 04—green façades; Scenario 05—a combination of Scenarios 02 and 04.
The results of the implemented scenarios were as follows:
Urban areas with more vegetation cover had significantly reduced mean radiant temperature, with reductions of almost 7 °C, especially during the summer. The parameter that is most strongly impacted by tree shade is MRT.
The presence of greenery reduces the radiant heat load, improving thermal comfort throughout the summer. In the second scenario, the usage of grass in some regions reduced the reflection of incoming solar radiation, which significantly reduced MRT.
Vegetation alters outdoor thermal comfort through evapotranspiration, sun reflection, solar protection (shading), and altered wind flow.
The use of green façades has a minimal effect that is concentrated only on the street where the implementation takes place, and it does not impact the area at an urban scale. In general, green façades had a negligible effect on pedestrian-level streets where green façades were not applied.
In most scenarios, it was demonstrated that most green infrastructure absorbed heat during the day only to release it at night, resulting in a lower reduction value in temperature during the nighttime.

5.3. Occupants’ Behaviors

People appear to physiologically and psychologically adapt to the shaded microclimate circumstances based on their experiences and perceptions. The findings also shed light on the significance of shade in improving people’s overall outdoor thermal comfort experiences.
In order to illustrate and confirm the relationship between behavior and the thermal environment, an on-site behavioral observation was conducted, along with interviews of the occupants, to allow community participation. Despite their psychological inclinations for colder temperatures, the observed subjects appeared to have a very high tolerance for higher summer temperatures. This was evidenced by their activities and behavior during the hot season, showing how adaptable people are to their environments. By observing how individuals used spaces, we were able to confirm that high amounts of outdoor insulation affected people on a social level.
The primary findings related to occupants’ behavior are as follows: the number of people present during the daytime decreased as temperatures increased. Users preferred shaded areas by more than 75%. Additionally, users lingered in shaded regions longer than they did in sunny locations, based on the observations and interviews. People favored static activities in partially shaded surroundings. The shaded areas were ideal for static activities.
The architecture of a place, which is frequently connected to the climatic and geographic environment, can be used to research how a society interacts with its surroundings. In other words, harmony with and adaptability to the environment through social and cultural manifestations are present across generations, as is the balance between people and their ecosystem (Mehryar et al., 2022) [18]. In a case study of Argales Industrial Park in Spain, scenarios were proposed to research the impact of climatic parameters in the area, using ENVI-met to understand the urban climate as an essential step for creating design solutions that enhance the environment. Two scenarios were modeled for this research. The research area was first depicted before any intervention, while nature-based solutions were used afterwards. The proposed scenario implemented the same qualities seen in scenario 01 in Jabal Al Natheef, where vegetation was implemented while maintaining the same characteristics of urban geometry and artificial ground cover materials. The model’s height for the reading data was set at 1.2 m (Alves et al., 2022) [19]. For the simulated times of 5 h, 7 h, 12 h, and 16 h, the base scenario showed ranges of 2.7 °C, 1.4 °C, 8.3 °C, and 10.5 °C, respectively, overall. The models for the vegetation-based proposed scenario predicted amplitudes of 10.5 °C, 7.1 °C, 4.3 °C, and 9.7 °C, respectively, during the same time periods. The lowest air temperatures were simulated over grassy areas, under trees, and in other areas that were shaded by both buildings and trees. The maximum air temperatures were anticipated to be attained over asphalt and walkways. When comparing the vegetation scenario to the base scenario, lower temperatures were present in the places where trees were introduced, extending the base simulation’s initial cool areas. The greatest noticeable variations were discovered at midday and seven hours after sunrise. The reason for these variances is that, beginning at daybreak, the trees partially blocked the sun’s rays, resulting in lower solar incidence. Furthermore, trees release water vapor through transpiration, which helped to lower the air’s temperature. Additional temperature decreases were also supplied by grass surfaces, especially when they were irrigated; however, this vegetation was less successful than trees at regulating temperature. The vegetation scenario’s addition of vegetated areas reduced the effects of heat islands by lowering air temperatures during the afternoon hours. Increases in evapotranspiration, which also contributed to increases in relative humidity, can be used to explain these phenomena (Alves et al., 2022) [19].
According to the results of the simulation in Jabal Al Natheef, it was shown that the presence of vegetation in urban areas is effective at controlling air temperature. When combined with effective site watering, the radiant energy received results in a high degree of evapotranspiration, which can help sustain the vegetation’s ability to improve local thermal comfort.
Another research case was located on Ryerson University campus in Toronto; it analyzed the impact of implementing green roofs using ENVI-met. In order to recreate the current microclimate surrounding Kerr Hall, an as-is model was first made. The microclimate results showed that installing a green roof on an existing structure may lower the air temperature by up to 0.4 °C during the day and 0.8 °C at night (Furukawa, 2015) [20]. These outcomes are comparable to those from other research. For instance, the installation of green roofs in New York City was found to reduce afternoon temperatures by up to 0.6 °C (Rosenzweig et al., 2006) [21]. Another study in Hong Kong used green roof applications to lower air temperatures by up to 0.7 °C at 2:00 p.m. (Peng and Jim, 2013) [22]. These studies employed green roofs on a bigger scale than simply one building, implementing them across an entire neighborhood or city. When green roofs were placed on most of the buildings and were simulated for several climates, it resulted in slightly larger decreases in daytime air temperatures. It is expected that a larger-scale application of green roof retrofits on most of the buildings in Jabal Al Natheef would significantly improve outdoor thermal comfort; this is a topic that deserves future research, even though the temperature reduction during the day found in this research was not that significant.
In the summer, green façades can physically shade buildings and encourage evapotranspiration; they can also improve thermal insulation in the winter. At the University of Bari, an experiment was conducted as a case study to research the impact of green façades on temperature. In this research, two green façades and a control wall were monitored for an extended period in Mediterranean climate conditions; they were mainly analyzed at the street level in front of the building where the green façade was located. The façades showed a good capacity for cooling during hot weather; the daytime temperatures observed on the south-facing green façades were up to 9.0 °C lower than those of the uncovered wall. The façades served as a thermal barrier on chilly days; the vegetated walls’ overnight temperatures were up to 3.5 °C warmer than those of the control wall (Vox et al., 2018) [23].
When it comes to comparing the simulation results to the behavioral assessment results, it can be concluded that they are related. When the PET during the simulation in the base scenario showed high values, the behavior of the users was affected. Between 12:00 p.m. and 3:00 p.m., high values of PET were recorded, which prompted occupants to adopt a static behavior pattern that produces less metabolic heat in the body and, in turn, increases the user’s thermal comfort.
Regarding the spatial distribution of the potential air temperature in the area, it was shown that, where temperature values are lower, occupants’ behavior patterns changed. Occupants tend to spend more time in areas where temperatures are lower, and they are also more likely to move from sunny areas to shaded areas in a dynamic movement, looking for spots where it is more thermally comfortable. An outdoor thermal comfort study that was carried out through a field survey on the campus of the University of Birjand, Iran, during November, February, April, and June showed that the neutral PET temperature range was determined as 16.4 °C to 25.3 °C. This survey has a similar climate classification as our study (Khalili et al., 2022) [24].
The disparity between these temperatures can be interpreted as the gap between psychological perceptions and actual behaviors, indicating that people moved to places where the observed temperatures were higher even if they psychologically preferred cooler temperatures throughout the hot season, as recorded in the simulation process. People showed a great level of tolerance for the higher summer temperatures, demonstrating their climatic adaptation.
The potential air temperature that resulted from the simulation program gave a valid reason for the number of users that were present in certain places during each hour of the day. This highlights the fact that, whenever the temperature was high, fewer people were roaming around the area; meanwhile, when the temperature started to decrease, people tended to start enjoying their outdoor spaces.

6. Conclusions

This research evaluated the effects of several green infrastructure scenarios on the microclimate and thermal comfort in Jabal Al Natheef. Jabal Al Natheef was chosen as the case study due to its highly populated and densely built environment, which lacks vegetation. A scenario-based approach was used to obtain sustainable design solutions; this approach was based on site assessments, occupant participation, and previous studies. Vegetation, green roofs, and green façades were proposed for implementation on site to examine their effect on the microclimate. The research approach focused on dynamic computer simulations using ENVI-met to quantify the impacts of the proposed scenarios in three main aspects: temperature, wind, and thermal comfort.
The results of the numeric ENVI-met model indicate that there is evidence that the use of green infrastructure can successfully lower temperatures and enhance outdoor thermal comfort.
A hot and humid microclimate can benefit from the development of green infrastructure, according to climatic factors and urban planning techniques. These factors need to be standardized to match previous research findings if we are to derive quantitative results; further research can be undertaken to determine the similarities and differences of potential outcomes. The quality of the implementation performance and the related system components can then be used to suggest a more precise technical target. The design and implementation issues can then be successfully addressed in the resulting discourse. From our findings, it can be seen that implementing vegetation is the most effective influencing factor in terms of the summer microclimate and thermal comfort.
A successful outdoor place that appeals to the public could be created by incorporating users’ climate experiences and awareness into outdoor environmental planning and design. In order to find the best potential planned surroundings to sustain extended use of outdoor space, this research proposes that future urban development plans include context-based socio-cultural thermal comfort parameters.

Author Contributions

Conceptualization, F.Z.A.-A. and A.A.-A.; methodology, F.Z.A.-A. and A.A.-A.; software, A.A.-A.; validation, F.Z.A.-A. and A.A.-A.; formal analysis F.Z.A.-A. and A.A.-A.; investigation, F.Z.A.-A. and A.A.-A.; resources, F.Z.A.-A. and A.A.-A.; data curation, F.Z.A.-A. and A.A.-A.; writing—original draft preparation, F.Z.A.-A. and A.A.-A.; writing—review and editing, F.Z.A.-A. and A.A.-A.; visualization, F.Z.A.-A. and A.A.-A.; supervision, F.Z.A.-A. and A.A.-A.; project administration, F.Z.A.-A. and A.A.-A. All authors have read and agreed to the published version of the manuscript.

Funding

This research received no external funding.

Informed Consent Statement

Informed consent was obtained from all subjects involved in the study.

Data Availability Statement

Not applicable.

Conflicts of Interest

The authors declare no conflict of interest.

References

  1. Arini. Mapping Jabal Natheef. 2014. Available online: http://arini.org/mapping-jabal-al-natheef-publication/ (accessed on 1 January 2022).
  2. Al Tal, R.; Al Mulqi, R.; Alawneh, L.; Tarawneh, S. Overcrowding and its effects on the social and spatial aspects of the urban fabric. The case of jabal al-natheef, amman, jordan. J. Settl. Spat. Plan. 2018, 9, 25–33. [Google Scholar] [CrossRef]
  3. Lan, L.; Wargocki, P.; Wyon, D.P.; Lian, Z. Effects of thermal discomfort in an office on perceived air quality, SBS symptoms, physiological responses, and human performance. Indoor Air 2011, 21, 376–390. [Google Scholar] [CrossRef] [PubMed]
  4. Pessanha, T. An Assessment Tool for Operationalizing Urban Thermal Comfort in Urban Policies and Urban Design. Master’s Thesis, University of Groningen, Groningen, The Netherlands, 2017. [Google Scholar]
  5. Lee, A.; Jordan, H.; Horsley, J. Value of urban green spaces in promoting healthy living and wellbeing: Prospects for planning. In Risk Management and Healthcare Policy; Dove Medical Press Ltd.: Macclesfield, UK, 2015; Volume 8, pp. 131–137. [Google Scholar] [CrossRef] [Green Version]
  6. Ragheb, A.A.; El-Darwish, I.I.; Ahmed, S. Microclimate and human comfort considerations in planning a historic urban quarter. Int. J. Sustain. Built Environ. 2016, 5, 156–167. [Google Scholar] [CrossRef] [Green Version]
  7. Johansson, E.; Ouahrani, D. Climate Conscious Architecture and Urban Design in Jordan: Towards Energy Efficient Buildings and Improved Urban Microclimate; Housing Development & Management, Lund University: Lund, Sweden, 2009. [Google Scholar]
  8. Nikolopoulou, M.; Lykoudis, S. Use of outdoor spaces and microclimate in a mediterranean urban area. Build. Environ. 2007, 42, 3691–3707. [Google Scholar] [CrossRef] [Green Version]
  9. Sangkertadi, S.; Syafriny, R. Proposition of regression equations to determine outdoor thermal comfort in tropical and humid environment. Iptek J. Technol. Sci. 2012, 23, 59. [Google Scholar] [CrossRef] [Green Version]
  10. Mills, G. Progress Toward Sustainable Settlements: A Role for Urban Climatology. Theor. Appl. Climatol. 2006, 84, 69. [Google Scholar] [CrossRef]
  11. Bruse, M.; Fleer, H. Simulating surface-plant-air interactions inside urban environments with a three dimensional numerical model. Environ. Model. Softw. 1998, 13, 373–384. [Google Scholar] [CrossRef]
  12. Huttner, S. Further Development and Application of the 3D Microclimate Simulation. Doctoral Dissertation, Johannes Gutenberg-Universität Mainz, Mainz, German, 2012. [Google Scholar] [CrossRef]
  13. Freiwan, M.; Kadioglu, M. Spatial and temporal analysis of climatological data in Jordan. Int. J. Climatol. 2007, 28, 521–535. [Google Scholar] [CrossRef]
  14. Jordan Meteorological Department. 2019. Available online: https://form.jordan.gov.jo/wps/portal/home/governmententities/ministries/ministry/ministry%20of%20transport/jordan%20meteorological%20department?current=true&nameentity=jordan%20meteorological%20department&entitytype=sub (accessed on 1 May 2022).
  15. Abdulla, F. 21st century climate change projections of precipitation and temperature in jordan. Procedia Manuf. 2020, 44, 197–204. [Google Scholar] [CrossRef]
  16. Matouq, M.; El-Hasan, T.; Al-Bilbisi, H.; Abdelhadi, M.; Hindiyeh, M.; Eslamian, S.; Duheisat, S. The climate change implication on Jordan: A case study using gis and artificial neural networks for weather forecasting. J. Taibah Univ. Sci. 2013, 7, 44–55. [Google Scholar] [CrossRef] [Green Version]
  17. Shehadeh, N.; Tarawneh. Impact of climate change upon summerheat waves in Jordan. J. Am. Sci. 2014, 10, 46–52. [Google Scholar]
  18. Mehryar, S.; Sasson, I.; Surminski, S. Supporting urban adaptation to climate change: What role can resilience measurement tools play? Urban Clim. 2022, 41, 101047. [Google Scholar] [CrossRef]
  19. Alves, F.M.; Gonçalves, A.; Del Caz-Enjuto, M.R. The use of envi-met for the assessment of nature-based solutions’ potential benefits in industrial parks—A case research of argales industrial park (Valladolid, Spain). Infrastructures 2022, 7, 85. [Google Scholar] [CrossRef]
  20. Furukawa, M.A. Green Roofs in Building Retrofits: Outdoor Microclimate Benefits and Energy Savings. Master’s Thesis, Toronto Metropolitan University, Toronto, ON, Canada, 2015. [Google Scholar] [CrossRef]
  21. Rosenzweig, C.; Solecki, W.; Slosberg, R.; The New York State Energy Research and Development Authority. Mitigating New York City’s Heat Island with Urban Forestry, Living Roofs, and Light Surfaces. 2006. Available online: http://www.giss.nasa.gov/research/news/20060130/103341.pdf (accessed on 1 March 2022).
  22. Peng, L.L.; Jim, C. Green-roof effects on neighborhood microclimate and human thermal sensation. Energies 2013, 6, 598–618. [Google Scholar] [CrossRef] [Green Version]
  23. Vox, G.; Blanco, I.; Schettini, E. Green façades to control wall surface temperature in buildings. Build. Environ. 2018, 129, 154–166. [Google Scholar] [CrossRef]
  24. Khalili, R.; Fayaz, S.; Zolfaghari, A. Analyzing outdoor thermal comfort conditions in a university campus in hot-arid climate: A case study in Birjand, Iran. Urban Clim. 2022, 43, 101128. [Google Scholar] [CrossRef]
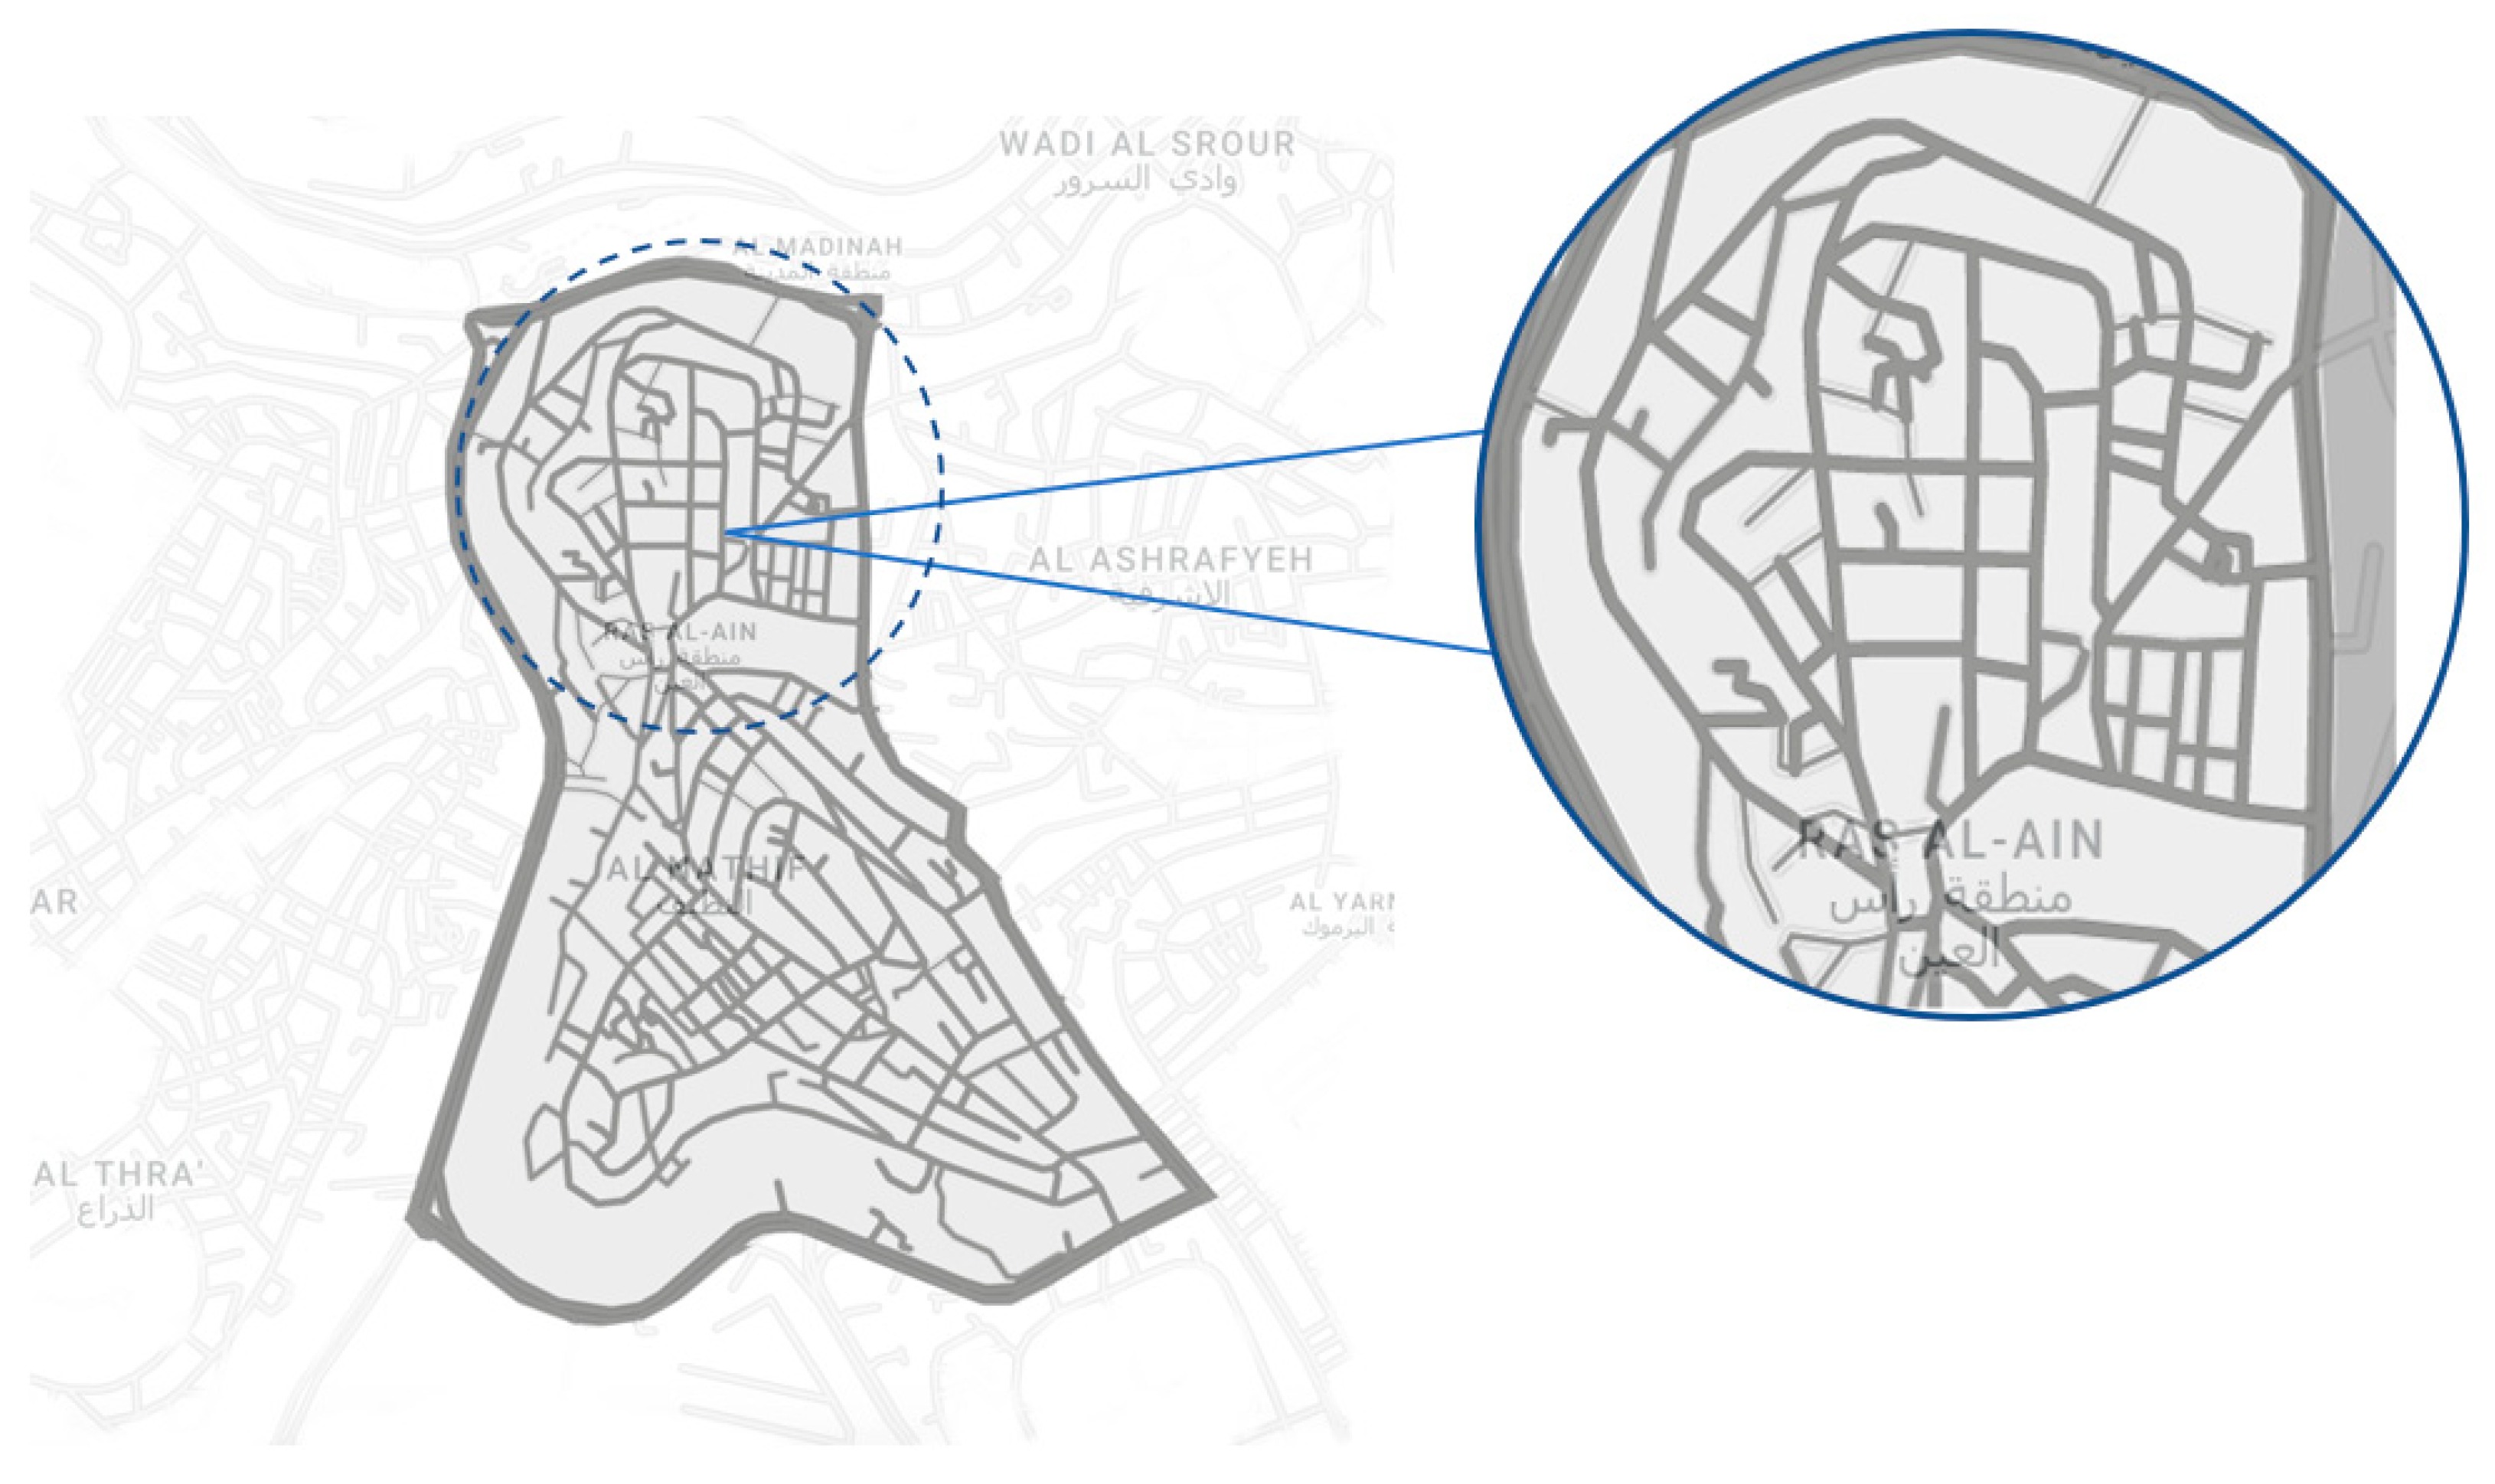
Figure 1. Map of Jabal Al Natheef and the chosen research area (Source: Google maps, edited by the authors, 2022).
Sustainability 15 04092 g001
Figure 2. Sub-models of ENVI-met (Huttner, 2012) [12].
Sustainability 15 04092 g002
Figure 3. Research strategy: the simulation process (source: authors, 2022).
Sustainability 15 04092 g003
Figure 4. Methodological framework process.
Sustainability 15 04092 g004
Figure 5. Scenario placement on site (source: authors, 2022).
Sustainability 15 04092 g005
Figure 6. The chosen area of the simulation process shown on grids (source: ENVI-met, authors, 2022).
Sustainability 15 04092 g006
Figure 7. PET calculation simulation inputs (source: authors 2022).
Sustainability 15 04092 g007
Figure 8. Green infrastructure implementation scenarios (source: authors, 2022).
Sustainability 15 04092 g008
Figure 9. Average potential air temperature at a height of 1.8 m in the research area.
Sustainability 15 04092 g009
Figure 10. Mean radiant temperature at a height of 1.8 m in the research area.
Sustainability 15 04092 g010
Figure 11. PET at a height of 1.8 m in the research area.
Sustainability 15 04092 g011
Table 1. Types of current and proposed trees in Jabal Al Natheef (source: authors, 2022).
Base Map Scenario
(Current Situation)
Vegetation typeEvergreenDescriptionOlea, Ceratonia, Eucalyptus
DeciduousAcacia
(Proposed Scenarios)
Vegetation typeDeciduousDescriptionMedium trunk, dense (Fraxinus Syriaca)
ConifersMedium trunk, dense (Pine + Cypress)
Green façadeIvy, default, Leaf area
Green roofDefault, Leaf area
Table 2. Initial simulation inputs and settings (source: authors, 2022).
SettingsDescription
LocationJabal Al Natheef, Amman, Jordan
Latitude: 31.94
Longitude: 35.92
Simulation date21 of June 2022
Simulation start time12:00 AM (HH:MM) (00:00)
Simulation total time (h)24 h
Meteorological dateEPW file
The wind force was set to OFF
ForcingFull forcing, except for wind
Wind speed3.50
Wind direction270.00 degrees
Height cap for adjusting raytracing and IVS precisionON
Set to 15 m
GridX = 145 y = 185 z = 15 each model
Building model parametersWalls:
Default material, or green façades
Roof:
Default materials, or green roof
SoilDefault asphalt, default unsealed soil
Simulation durationEach scenario took five days to process using one computer.
Table 3. Mean climate values for the Amman Civil Airport station (Marka) 1989–2018: (source: Jordan Meteorological Department, 2019) [14].
Mean ValuesJanFebMarAprMayJunJulAugSepOctNovDec
Min. air temperature °C4.257.611.215.118.520.820.618.515.410.15.9
Mean air temperature °C8.49.612.817.421.624.826.726.724.721.315.210.4
Max. air temperature °C12.614.218.123.628.131.132.732.830.927.220.314.8
Relative humidity %73.669.962.349.84342.844.649.545.255.761.870.7
Rainfall (mm)6657.930.58.230.1000.15.420.746.7
Table 4. The initialization of the proposed solution (source: authors, 2022).
Current ScenarioProposed Scenario Solution
High temperatures in narrow streets, lack of space on street edgesImplementing green façades in main streets to reduce temperatures; trees cannot be placed because the streets are very narrow
Lack of vegetation areasAdding trees at a distance from each other to allow ventilation in open spaces, and in available spaces between buildings
Lack of vacant spaces on site for social interactions and high temperatures due to the dense urban layoutAdding extensive green roofs for lower loads in some buildings and pots in other buildings due to their weak structures (roofs are the spaces most used by occupants for social activities, especially for women, and are protected with a fence)
Vegetation selectionVegetation was selected based on its characteristics in terms of shade tolerance, height, spread, and classification. Ivy was chosen for green façades, whereas sedum was chosen for green roofs.
Table 5. Potential air temperature reduction when implementing the proposed scenarios. The positive values in the “Reduction” columns mean that the temperature absorbed during the day was released at night, while the negative values indicate absorbed temperature.
HourBase Case
(Scenario 0)
Vegetation Case
(Scenario 01)
Reduction Value (Scenario 01)Green Roof Case 50%
(Scenario 02)
Reduction Value (Scenario 02)Green Roof Case 75%
(Scenario 03)
Reduction Value (Scenario 03)Green Façade
(Scenario 04)
Reduction Value
(Scenario 04)
Combination
(Scenario 05)
Reduction Value
8:00 a.m.–11:00 a.m.31.8331.12 −0.7131.76−0.07 31.76 −0.07 31.82−0.0131.33−0.50
12:00 p.m.–3:00 p.m.37.7937.15 −0.64 37.72 −0.07 37.71 −0.0837.79 -37.35−0.44
4:00 p.m.–7:00 p.m.33.03 32.78 −0.88 33.0 −0.03 32.99 −0.04 33.03 -32.93−0.01
8:00 p.m.–11:00 p.m.268826.84 −0.04 26.92 +0.04 26.93 +0.05 26.89 +0.01 26.96+0.08
4:00 a.m.–7:00 a.m. 26.0525.97 −0.08 26.05 -26.05 -26.04 −0.01 26.01−0.04
Table 6. The mean radiant temperature reduction caused by implementing the proposed scenarios. The positive values in the “Reduction” columns mean that the temperature absorbed during the day was released at night, while the negative values indicate absorbed temperature.
HourBase Case
(Scenario 0)
Vegetation
(Scenario 01)
Reduction Value (Scenario 01)Green Roof
(Scenario 02)
Reduction Value (Scenario 02)Green Roof
(Scenario 03)
Reduction Value (Scenario 03)Green Façade
(Scenario 04)
Reduction Value (Scenario 04)Combination
(Scenario 05)
Reduction Value
8:00 a.m.–11:00 a.m.51.4945.72−5.7751.30−0.1951.30−0.1949.64−4.047.93−3.56
12:00 p.m.–3:00 p.m.52.3145.73−6.5851.14−1.1752.14−0.1749.41−4.2349.61−2.70
4:00 p.m.–7:00 p.m.24.17 24.47+0.3024.14−0.0324.14−0.0355.90+2.1623.76−0.41
8:00 p.m.–11:00 p.m.12.3615.56+3.2012.34−0.0212.39+0.0315.29 +3.2013.39+1.03
4:00 a.m.–7:00 a.m.25.1724.43−0.7425.15−0.0225.15−0.0227.58 −0.5122.95−2.22
Table 7. Wind speed values (m/s) after implementing the different scenarios.
HourBase Case
(Scenario 0)
Vegetation
(Scenario 01)
Reduction Value (Scenario 01)Green Roof Value (Scenario 02)Reduction Value (Scenario 02)Green Roof at 11 Meters (Scenario 03)Reduction Value at 11 Meters (Scenario 03)Green Façade at 1.8 m (Scenario 04)Reduction Value (Scenario 04)Combination
(Scenario 05)
Reduction Value
8:00 a.m.–11:00 a.m.0.55 0.38 −0.17 0.54−0.011.35 -0.55-0.43−0.12
12:00 p.m.–3:00 p.m.0.54 0.34 −0.20 0.53−0.011.28 −0.010.54-0.40−0.14
4:00 p.m.–7:00 p.m.0.51 0.33 −0.18 0.50−0.011.25 −0.010.51-0.38−0.13
8:00 p.m.–11:00 p.m.0.49 0.32 −0.170.48−0.011.23 −0.010.49-0.37−0.12
4:00 a.m.–7:00 a.m.0.60 0.47 −0.13 0.59−0.011.46 -0.60-0.51−0.09
Table 8. Physiologically equivalent temperature (PET) in °C after implementing the different scenarios.
HourBase Case
(Scenario 0)
Vegetation
(Scenario 01)
Reduction Value (Scenario 01)Green Roof 50% (Scenario 02)Reduction Value (Scenario 02)Green Roof 75%
(Scenario 03)
Reduction Value (Scenario 03)Green Façade
(Scenario 04)
Reduction Value (Scenario 04)Combination
(Scenario 05)
Reduction Value
8:00 a.m.–11:00 a.m.42.43 39.26 −3.17 42.32 −0.0942.36 −0.07 42.42−0.01 40.42 −2.01
12:00 p.m.–3:00 p.m.46.49 41.97 −4.52 46.40−0.0946.41 −0.08 46.50−0.0144.54 −1.95
4:00 p.m.–7:00 p.m.28.72 28.97 +0.25 28.68 −0.0428.68 −0.04 28.73−0.0128.42 −0.30 °C
8:00 p.m.–11:00 p.m.19.7821.33 +1.55 19.89 +0.1119.90 +0.12 19.91+0.1320.32 +0.54
4:00 a.m.–7:00 a.m.24.6523.48 −1.17 24.66 +0.0124.67 +0.02 24.66+0.0123.75 −0.99
Disclaimer/Publisher’s Note: The statements, opinions and data contained in all publications are solely those of the individual author(s) and contributor(s) and not of MDPI and/or the editor(s). MDPI and/or the editor(s) disclaim responsibility for any injury to people or property resulting from any ideas, methods, instructions or products referred to in the content.