Article

Perceptions of Cultivated Meat in Millennial and Generation X Consumers Resident in Aotearoa New Zealand

by
Caroline Giezenaar
1,
A. Jonathan R. Godfrey
2,
Olivia J. Ogilvie
3,4,5,
Petra Coetzee
1,
Maheeka Weerawarna N.R.P.
1,
Meika Foster
6 and
Joanne Hort
1,5,*
1
Food Experience and Sensory Testing (Feast) Lab, School of Food and Advanced Technology, Massey University, Palmerston North 4410, New Zealand
2
Statistics Group, School of Mathematical and Computational Sciences, Massey University, Palmerston North 4410, New Zealand
3
Biomolecular Interaction Centre, School of Biological Sciences, University of Canterbury, Christchurch 8041, New Zealand
4
School of Biological Sciences, University of Canterbury, 20 Kirkwood Avenue, Upper Riccarton, Christchurch 8041, New Zealand
5
Riddet Institute, Massey University, Palmerston North 4410, New Zealand
6
Edible Research Limited, Christchurch 7475, New Zealand
*
Author to whom correspondence should be addressed.
Sustainability 2023, 15(5), 4009; https://doi.org/10.3390/su15054009
Submission received: 24 January 2023 / Revised: 10 February 2023 / Accepted: 20 February 2023 / Published: 22 February 2023
(This article belongs to the Special Issue Sensory and Consumer Science for a More Sustainable World)

Abstract

:
Evidence suggests that consumer perceptions and acceptance of cultivated meat (CM) differ between countries, cultures, and consumer groups. Limited research specific to Aotearoa New Zealand (A-NZ) is available. Survey responses from 592 A-NZ residents were analysed to determine CM awareness, willingness to engage with CM, and perceived CM product attributes relative to conventional meat and plant-based meat alternatives (PBMAs). The effects of gender, age, meat/PBMA consumption frequency, CM awareness, and food neophobia on CM perceptions were determined. The statements were rated on a seven-point Likert scale. Half (52%) of the respondents agreed they were aware of CM. The awareness was higher in men compared to women (p = 0.036), higher in Millennials compared to Generation X (p = 0.022), and higher in regular compared to infrequent PBMA consumers (p = 0.0003). The willingness to engage with CM and perceived CM product attributes were consistently more positive in consumers who were aware, compared with consumers not aware of CM (p < 0.05). Being male, Millennial, low neophobic and a low meat, or high PBMA consumer was also associated with higher potential engagement and perceptions of CM to varying extents. Segmentation divided the respondents into three groups. The ‘positive’ cluster (41%) consumed more PBMAs and less meat and was more aware of CM than the ‘neutral’ (50%) and ‘negative’ (9%) clusters. In conclusion, consumers in A-NZ are not a homogenous group with regards to their perceptions and potential engagement with CM. Increasing awareness and familiarity with CM will be an important strategy to increase engagement with CM.

Graphical Abstract

1. Introduction

A shift towards a more plant-based diet has been recommended to enhance personal health and environmental sustainability [1]. Furthermore, the COVID-19 pandemic has raised concerns about food safety issues associated with risk of disease from meat consumption [2]. Growing numbers of consumers in Aotearoa New Zealand (A-NZ) are interested in replacing meat products with plant-based meat alternatives (PBMAs) [3,4,5]. These traditionally include, for example, tofu, tempeh, and textured vegetable protein products. More recently, a broader range of offerings has become available, with many products, such as the Impossible Burger or Beyond Meat, designed to have meat-like appearances, flavours, and texture characteristics, including some that ‘bleed’ like meat [6]. Despite consumer beliefs in the potential advantages of replacing meat with PBMAs, for example, reduced environmental impacts, PBMA’s level of sensory appeal has been identified as the primary barrier to their consumption that weighs heavier than potential advantages [7].
A potential additional alternative to conventional meat is cultivated meat (CM), which is produced by culturing stem cells collected from an animal (e.g., satellite cells, induced pluripotent or mesenchymal stem cells) to form muscle tissue in a growth medium containing essential nutrients [8,9]. The sensory profile of CM may be more desirable than PBMAs because it is expected that, once optimised, CM will look like, cook like, and taste very similar to conventional meat [9]. The technology for large-scale production of CM is currently in development and currently CM is only approved for commercial sale in Singapore [10]. Once the technical challenges of upscaling CM production are overcome, consumer acceptance will determine whether CM will be successful [11].
The motivators and barriers to consuming PBMAs in place of meat vary widely, and include perceived sensory preference/appeal, health considerations, concerns regarding the meat industry’s impact on the environment and animal welfare, convenience of preparation, cooking and use, risk of disease from animal-based food consumption, familiarity, and naturalness [12]. Although similar factors may be relevant to a future understanding of CM consumption behaviours, recent evidence suggests that perceptions of CM currently differ from perceptions of PBMAs. For example, in an Australian survey [13], PBMAs, when compared with conventional beef, were rated equally for health, affordability, and safety. In contrast, cultivated beef compared to conventional beef was rated more positive for perceived animal welfare, but more negative for perceptions of health, affordability, safety, and eating enjoyment [13].
Consumer characteristics may influence perceptions of CM: in previous studies in the USA, India, and China [14], those who omitted meat from their diet were less likely to purchase CM compared to those who ate meat. Furthermore, low neophobia scores, awareness of CM, and perceived appeal contributed to the likelihood of purchase [14]. Potential engagement with CM is generally lower with increasing age [13,15,16,17].
Previous studies in the USA, Europe, Australia, South Africa, and Mexico [14,18,19] have shown that the perception of CM varies across countries with respect to familiarity, acceptance, evoked disgust, and perceived naturalness. Research investigating consumer perceptions of CM in A-NZ is limited. A focus group study [20] reported an overall negative attitude towards CM and, although the participants acknowledged that CM may improve animal ethics and increase capacity to produce protein, almost all participants rejected CM out of concern for sensory appeal and unfamiliarity with the CM concept. A more recent A-NZ study [21] in 254 mostly young and highly educated respondents found that, although most initial reactions to CM consisted of fear/unnaturalness (~25%), responses also included liking/approval (~15%) and curiosity (~10%). In this study, 51% of the respondents were willing to purchase CM [21]. An online survey in 206 A-NZ residents reported that this percentage reduced from 50% to 11% if CM was more expensive than conventional meat [22], indicating that price will be an important factor in CM purchasing decisions in A-NZ.
More evidence is needed to provide a deeper understanding of the motivations and barriers that would influence A-NZ consumer engagement with CM. It is unclear whether or how factors including gender, age, meat, PBMA consumption frequency, neophobia, and awareness of CM, for example, are likely to affect potential engagement with or motivation to consume CM. To the authors’ knowledge, no studies have investigated how current meat and PBMA consumption frequency affects perceptions of CM. Detailed data on CM perceptions in A-NZ consumers who are willing to replace at least some of their intake of conventional meat with alternatives is needed to characterise the potential local market for CM and to inform industry, government, and investment decisions in CM technology. Flexitarians constitute a large, growing segment of the population that is interested in the dietary inclusion of alternatives to animal protein for multiple reasons [4,23] and could be receptive to incorporating CM in their diet.
This study sought to: (a) explore attitudes towards CM, (b) investigate motivators and barriers to engagement with CM, and (c) predict the characteristics of future adopters of CM in A-NZ consumers with different levels of meat and PBMA consumption. The specific objectives of the study were to determine the association of ‘awareness of CM’ with gender, age, meat consumption frequency, PBMA consumption frequency, and neophobia; the association of potential engagement with CM with gender, age, meat consumption frequency, PBMA consumption frequency, neophobia, and CM awareness; whether perceptions of CM are relative depending on their comparison to conventional meat or PBMAs; the association of perceived CM product attributes (cooking and use, tastiness, healthiness, animal friendliness, environmental sustainability, ethics, safety, naturalness, and cost) with gender, age, meat consumption frequency, PBMA consumption frequency, neophobia, and awareness of CM, relative to both conventional meat and PBMAs; and whether CM perception is segmented across A-NZ consumers with different levels of meat and PBMA consumption.

2. Materials and Methods

2.1. Respondents

The respondents were recruited via an online recruitment company (Dynata, Auckland, New Zealand) and comprised members of the Dynata database who volunteer to complete online surveys in return for an incentive (NZD 10). The respondent information sheet, consent form, and survey were hosted on the Qualtrics platform (Qualtrics, Provo, UT, USA). Data were collected in October and November 2021.
The respondents were aged 25–55 years and consumed meat, but for less than 7 days per week, indicating that they were potentially interested in reducing their meat consumption. The quotas were set for equal numbers of respondents in two age groups (Millennials, aged 25–40 years or Generation (Gen) X, aged 41–55 years), by gender (men, women), and according to meat consumption frequency (4–6 days per week; 1–3 days per week; fortnightly; monthly; less than monthly). The age groups were included because a recent review reported that younger consumers were more accepting of CM than older consumers [17]. The study was considered and assessed as low risk following the Massey University Human Ethics Committee process (human ethics notification number: 4000024924). All respondents indicated informed consent by checking a checkbox to that effect at the commencement of the survey.

2.2. Procedure

The survey was piloted with colleagues and consumers prior to launch. Apart from grammatical suggestions, the only issues raised were that respondents were unsure whether CM was considered a plant-based product and whether it was currently available in A-NZ. These details were therefore clarified in the final version of the survey.
The survey required respondents to complete initial demographic questions, including gender and age range. Ethnicity, income, and location (rural, urban, or in-between) were also collected to characterize the sample but were not part of the research objectives. In subsequent questions (Table 1), respondents were asked about the frequency of their meat (Question 1a) and PBMA (Question 1b) intake. The survey terminated if the respondents indicated that they ate meat every day, or never. Furthermore, the survey terminated if the respondents indicated that they had never tried PBMAs. With these criteria, it was aimed to include respondents who replace meat by PBMAs to some extent.
The respondents were asked to respond to 23 statements/questions across 4 areas of interest (Table 1): awareness of CM (Statement 2), perceived product attributes of CM relative to conventional meat (Statements 3a-i), perceived product attributes of CM relative to PBMAs (Statements 4a–i), and potential willingness to engage with CM (Statements 5a–c and 6). The statements were rated on a 7-point scale ranging from strongly disagree to strongly agree (Statements 2–5) or never to always (Statement 6), with additional information provided to respondents at various points in the survey process.
After indicating their level of familiarity with CM (Statement 2: ‘I am aware of cultivated meat (sometimes called: in-vitro meat, lab-grown meat, and/or clean meat)’, the respondents were provided with a description of CM to ensure each respondent was exposed to identical background information before continuing with the survey:
“Cultivated meat is a future alternative to the meat we consume today (animal products). It is still under development; you can’t currently buy it in supermarkets or restaurants. To make cultivated meat, tissue is removed from an animal (e.g., a salmon, cow or duck) and grown into cuts of meat/fish in a laboratory by feeding the tissue with essential nutrients. Cultivated meat could produce 80,000 burgers from tissue the size of a sesame seed, where conventional farming requires 100 cows.”
Animal meat and cultivated meat look, cook, and taste identical because they are both made of animal muscle. This makes them different from plant-based alternatives like tofu or the Beyond burger, which are made from plants. The nutritional benefits of cultivated meat are expected to be equal or better than animal meats.
Cultivated meat is also known as (cell-)cultured meat, cell-based meat, clean meat, and lab-grown meat. In this study, we use the term ‘cultivated meat’ and assume that cultivated meat does not require any further animal material after the removal of cells from the animal.
Respondents were next asked to rate their perceptions of CM product attributes relative to conventional meat (Table 1, Statement 3a–i) and then relative to PBMAs (Table 1, Statement 4a–i) to explore a range of common motivators and barriers for reducing meat consumption [12], including preparation and cooking; tastiness; healthiness; animal friendliness; environmental friendliness; safety; ethicalness; naturalness; and cost. The respondents were informed of different terms used for cultivated meat and to assume that no further animal material is required to produce CM:
“Cultivated meat is also known as (cell-)cultured meat, cell-based meat, clean meat and lab-grown meat. In this study we use the term ‘cultivated meat’ and assume that cultivated meat does not require any further animal material after the removal of cells from the animal.”
The final survey section was designed to explore the willingness to engage with CM. The respondents were asked about their likelihood to taste, eat regularly, and purchase CM instead of conventional meat if it was available, and if they considered CM to be a more attractive alternative to meat than PBMAs (Table 1, Statements 5a–c and 6). To determine the willingness to engage with CM irrespective of cost—a known key driver of CM purchase likelihood [22]—the respondents were explicitly instructed to assume CM and conventional meat were identically priced with the following written instruction:
Currently, cultivated meat is not commercially available in New Zealand. Assuming that the price of cultivated meat is identical to that of conventional meat, rate how likely you are willing to taste cultivated meat (e.g., try on a one-off occasion) versus purchase and eat cultivated meat regularly.
To gauge willingness to try new foods, the respondents were also asked to complete the food neophobia questionnaire [24] comprising 10 questions rated on a 7-point Likert scale ranging from strongly disagree (score = 1) to strongly agree (score = 7).

2.3. Data Analysis

All statistical analyses were performed in R version 4.2.0 using R Studio software version 2022.2.3.492 [25]. Package dplyr [26] was used for data handling. p-values of <0.05 were considered statistically significant and the mean ± standard error (SE) values are reported throughout the article.
To determine if the respondents completed the survey genuinely, the food neophobia survey, which includes reverse-scored items (i.e., statements for which the scoring scale runs in the opposite direction of other statements), was assessed for respondents who repeatedly gave the same response to every statement. These individuals were identified using k-means clustering [25] of the neophobia scores and were removed from the dataset.
Meat consumption groups were recategorised into three categories to create more equal group sizes: high (4–6 days/week), medium (1–3 days/week), and low (fortnightly, monthly, or less than monthly). PBMA consumption was recategorised into four groups: high (7 days/week, 4–6 days/week), medium (1–3 days/week), low (fortnightly, monthly), and ‘tried once’.
To calculate neophobia scores, reverse-scored items were recoded so that the direction of scoring was equal for all statements, and the scores of all 10 questions were summed. The scores were segmented into low, medium, and high by dividing the respondents into three groups corresponding to the lowest quartile, second and third quartile, and highest quartile, respectively [27]. Kendall’s tau (τ) correlation was used to determine the correlations between meat and PBMA consumption frequency, and neopobia.
To determine whether respondent demographics affected meat and PBMA consumption frequency, linear models were determined with the following fixed factors: gender, age, meat and PBMA consumption frequency, neophobia class, and awareness of CM [25]. When the main effect of a fixed factor was significant, the differences in ratings between the demographic subgroups (post hoc testing) were determined using the Dunn test [28], with Benjamini-Hochberg corrections for multiple comparison. The correlations between meat consumption frequency and gender and age group were not determined because respondent quotas for the recruitment of these groups were used.
A linear effect model was used to determine whether there were differences between the different levels of potential engagement (statements 5a–c and 6). Linear effects models were determined for each individual statement, with the following fixed factors: gender, generation group, meat consumption frequency, PBMA consumption frequency, neophobia segment (i.e., low, medium, high), and awareness of CM (not included in the model for the statement on awareness of CM). When including CM awareness in the linear effects models as a fixed factor, the respondents were recategorised as either unaware (scored 1–4) or aware (scored 5–7). Interactions were allowed among gender, age group, and meat consumption frequency groups as these groups were included in respondent quotas. Post hoc testing was performed with the Dunn test for main effects and contrasts of estimated marginal means for interactions, both with Benjamini-Hochberg corrections for multiple comparison.
To determine whether CM product attribute (tastiness, healthiness, etc.) perceptions were dependent on comparison with conventional meat or PBMAs (Statements 3–4), principal component analysis (PCA) was performed on the ratings of CM product attribute perceptions relative to conventional meat and PBMAs. Then, the effect of comparator (i.e., conventional meat and PBMAs) on the fitted values of PC1 and PC2 were assessed by mixed effect models [29] with comparator as a fixed factor and the respondent as a random factor. When significant, indicating that there was an effect of the comparator, the effects of the comparator for each individual CM product attribute were determined with mixed effects models [29], with the comparator as a fixed factor and the respondent as a random factor. Linear effects models were determined for the perception of each individual product attribute, with the following fixed factors: gender, generation group, meat consumption frequency, PBMA consumption frequency, neophobia segment, and awareness of CM. The Dunn test was used for post hoc testing, with Benjamini Hochberg corrections for multiple comparison. Spearman correlation was used to determine the correlations between the outcomes of potential engagement and product attribute perceptions of CM. R-values of >0.5 (p < 0.05) were considered worthy of consideration.
K-means clustering on all statements relating to CM was used to determine if segmentation of respondents was evident. The optimal number of clusters was determined using the elbow method [30], which indicates the smallest number of clusters that still has a low sum of squares errors. The clusters were visualised using the factoextra package [30]. The differences in the proportions of demographics (e.g., men vs. women) between each cluster and the total sample were investigated with Chi-square goodness-of-fit test. If the proportions were different between a cluster and the total sample, standardised residuals were used to compare which subgroups were responsible for this difference. The differences in the mean ratings for statements between clusters were determined using the Dunn test [28], with Benjamini-Hochberg corrections for multiple comparison.

3. Results

A total of 801 respondents completed the survey but 221 were classified as insincere submissions based on internally inconsistent responses to the food neophobia survey. A further eight did not identify with either binary gender, and, as this group was too small to include in statistical models as a separate gender group, their responses were excluded from statistical analyses. Consequently, 572 responses were included in the final data analysis.

3.1. Respondent Demographics and Neophobia Scores

Demographic data, product consumption frequency, and neophobia scores for the respondent sample (n = 572) are summarised in Table 2. The respondents were 56% Millennial and 44% Gen X, with 47% identifying as male and 53% as female. With respect to meat consumption, 30% of respondents consumed meat less than once a week, 31% consumed meat 1–3 days per week, and 39% consumed meat 4–6 days per week. Regarding PBMA consumption, 24% had tried PBMAs just once, 34% consumed PBMAs less than once per week, 23% consumed PBMAs 1–3 days per week, and 20% consumed PBMAs 4–6 days per week. Low, medium, and high food neophobia groups corresponded to 26%, 50%, and 24% of the total sample, with mean (±SE) food neophobia scores of 23 ± 0.2, 37 ± 0.1, and 44 ± 0.2, respectively, out of a maximum score of 70.
Meat consumption frequency was inversely associated with PBMA consumption frequency (τ = −0.2, p < 0.0001). Food neophobia was positively associated with meat consumption frequency (τ = −0.15, p < 0.0001) and inversely associated with PBMA consumption frequency (τ = −0.14, p < 0.0001; data presented in text only).

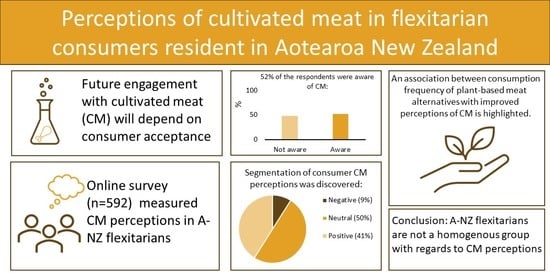
3.2. Awareness of Cultivated Meat

Overall, the mean CM awareness (n = 572) was 4.3 ± 0.07, and 52% of respondents indicated that they ‘somewhat agreed’, ‘agreed’ or ‘strongly agreed’ that they were aware of CM (scores 5–7 on 7-point answering scale; data presented in text only). The mean CM awareness scores (Table 3 were significantly higher in men compared to women (4.5 ± 0.06 vs. 4.2 ± 0.07; p = 0.036), higher in Millennials compared to Gen X (4.5 ± 0.07 vs. 4.1 ± 0.07; p = 0.022), and increased with increasing PBMA consumption frequency (p = 0.0003) and decreasing neophobia scores (p = 0.019). Meat consumption was not associated with awareness of CM (p = 0.26).
Awareness of CM was associated with more frequent PBMA consumption (τ = 0.17, p < 0.0001), but not with meat consumption frequency (τ = −0.05, p = 0.15; data presented in text only).

3.3. Potential Engagement with Cultivated Meat

The mean scores (n = 572) for willingness to taste CM (4.9 ± 0.06) were rated higher than the scores for willingness to eat CM regularly (4.3 ± 0.07), attractiveness of CM compared to PBMAs (4.4 ± 0.07), and willingness to purchase CM (3.6 ± 0.07) as measurements of potential engagement (main effect of statement, p < 0.0001, post hoc all p < 0.0001; data presented in text only). Overall, 67% of respondents stated that they ‘somewhat agreed’ ‘agreed’, or ‘strongly agreed’ (score ≥5 on 7-point answering scale) that they were willing to try CM; 47% were willing to eat CM regularly; and 30% were willing to regularly, often, or always purchase CM instead of conventional meat (data presented in text only).
The mean scores for willingness to try, regularly eat, and purchase CM instead of conventional meat and for attractiveness of CM compared to PBMAs were consistently higher in those who reported that they were aware of CM, compared with those who reported they were not (all p < 0.0001; Table 3). Men, compared to women, reported higher ratings of willingness to engage with CM for all outcomes (all p < 0.05), except willingness to try (p = 0.27). The respondents who consumed PBMAs more often were more likely to be willing to purchase CM instead of conventional meat (p < 0.0001). The mean rating for willingness to purchase in the high PBMA consumption group was 4.1 ± 0.08, equivalent to ‘sometimes’ on the response scale and ranging between ‘never’ and ‘always’, compared to a rating of 3.1 ± 0.06 (equivalent to occasionally) by respondents who had only tried PBMAs once (p = 0.0002).
A three-way interaction effect of gender, age, and meat consumption frequency for willingness to purchase CM instead of conventional meat was evident (p = 0.023; data presented in text only). Notably, willingness to purchase was highest in Millennial, low meat-consuming men, and was significantly higher than the Millennial, low meat-consuming women (men: 4.4 ± 0.07 vs. women: 3.4 ± 0.06; p = 0.0089; data presented in text only).

3.4. Principal Component Analysis for Comparison of Product Attributes of CM Relative to Conventional Meat and PBMAs

In the PCA of the CM product attribute perceptions relative to conventional meat and PBMAs, Principal Component (PC) 1 explained 54% and PC2 explained 14% of the data variability.
Similar loadings on PC1 (0.28–0.38; Table 4) for all product attributes, except cost (loading = 0.14), suggested that the variables similarly contributed to the variability of PC1. PC2 had particularly large loadings for animal welfare (−0.41), naturalness (0.52), and cost (−0.38), suggesting that these variables contributed most to the variability of PC2.
There was an effect of the comparator (i.e., conventional meat or PBMAs) on the fitted values of PC1 (p = 0.0011) and PC2 (p < 0.0001), and, therefore, the effects of the comparator were determined for each individual attribute (Table 4). CM perceptions were different compared to conventional meat than compared to PBMAs for cooking and use, tastiness, animal welfare, environmental sustainability, ethics, and naturalness (all p < 0.05; Table 4). CM was perceived as more natural and tastier (both p < 0.0001) compared to PBMAs than compared to conventional meat (Table 5). CM was perceived as more ethical, environmentally sustainable, animal friendly (all p < 0.0001), and more similar in cooking and use (p = 0.027) relative to conventional meat than to PBMAs. Perceived healthiness (p = 0.94), safety (p = 0.057), and cost (p = 0.60) of CM were similar, compared to either conventional meat or PBMAs.

3.5. Perceptions of Cultivated Meat

Since CM perceptions were rated differently depending on its comparator (traditional meat or PBMAs), the effects of respondent demographics were determined separately for CM perceptions relative to conventional meat and PBMAs.

3.5.1. Cultivated Meat Relative to Conventional Meat

Respondents who were CM aware consistently rated all CM product attributes, relative to conventional meat, more positive than those who were not CM aware (Table 5). There was an interaction effect of gender by age for the perceived tastiness of CM compared to conventional meat (p = 0.018, data presented in text only): Millennial men rated perceived CM tastiness compared to conventional meat as more positive (4.8 ± 0.06) than Millennial (4.2 ± 0.05; post hoc p = 0.0007) and Gen X (4.1 ± 0.06; p = 0.021) women. Compared to those with low neophobia, the respondents with medium or high food neophobia rated CM lower for perceived similarity of cooking and use (p = 0.004), animal welfare (p < 0.0001), environmental sustainability (p = 0.0006), and ethics (p = 0.042), but rated CM more positive for perceived tastiness (p = 0.013) and naturalness (p < 0.0001). Low and medium meat-consuming respondents rated CM relative to conventional meat more positive than high meat-consuming respondents for naturalness (p = 0.0005) and tastiness (p = 0.006). The frequency of PBMA consumption was associated with perceptions of CM tastiness, healthiness, animal welfare, safety, and naturalness, which were generally rated lowest by those who had tried PBMAs once, intermediate for those with low or medium PBMA consumption, and highest for those with high PBMA consumption (Table 5).

3.5.2. Cultivated Meat Relative to PBMAs

The respondents who were not CM aware rated all perceptions of CM product attributes relative to PBMAs lower than those who were CM aware, except for animal welfare, which was rated equally by aware and non-aware groups (Table 6). There was an interaction effect of gender by age for the perceived healthiness of CM compared to PBMAs (p = 0.02, data presented in text only). Millennial men rated perceived CM healthiness more positive (4.6 ± 0.05) than Gen X men (4.0 ± 0.05; post hoc p = 0.0026) and Millennial (3.9 ± 0.06; p = 0.0011) and Gen X (3.9 ± 0.06; p = 0.0011) women. Compared to the respondents with low neophobia scores, the respondents who had medium and high neophobia scores rated CM more positive for perceived healthiness (p = 0.034), safety (p = 0.003), and naturalness (p < 0.0001). Medium meat consumption respondents, compared to those with high meat consumption, rated CM more positive for perceived tastiness (p = 0.039). Low and medium meat consumers also rated CM more positive than high meat consumers for perceived naturalness (p = 0.035). High PBMA consumers generally rated tastiness, healthiness, safety, and naturalness of CM more positive than those who had tried PBMAs once or were low or medium PBMA consumers (Table 6).

3.6. Correlations between Potential Engagement and Product Attributes

Willingness to try CM was positively correlated with perceptions of animal friendliness (r = 0.56), environmental sustainability (r = 0.53), and ethics (r = 0.55) of CM compared to conventional meat, whereas willingness to eat CM regularly was positively correlated with healthiness (r = 0.55), safety (r = 0.60), ethics (r = 0.55), and naturalness (r = 0.51) of CM compared to conventional meat (Table 7). Willingness to eat CM regularly (r = 0.54) and attractiveness of CM relative to PBMAs (r = 0.57) were correlated with perceptions of tastiness of CM compared to PBMAs. Perceptions of safety were also positively correlated with the attractiveness of CM compared to PBMAs (r = 0.52), and willingness to regularly eat (r = 0.60) and purchase CM instead of conventional meat (r = 0.52).

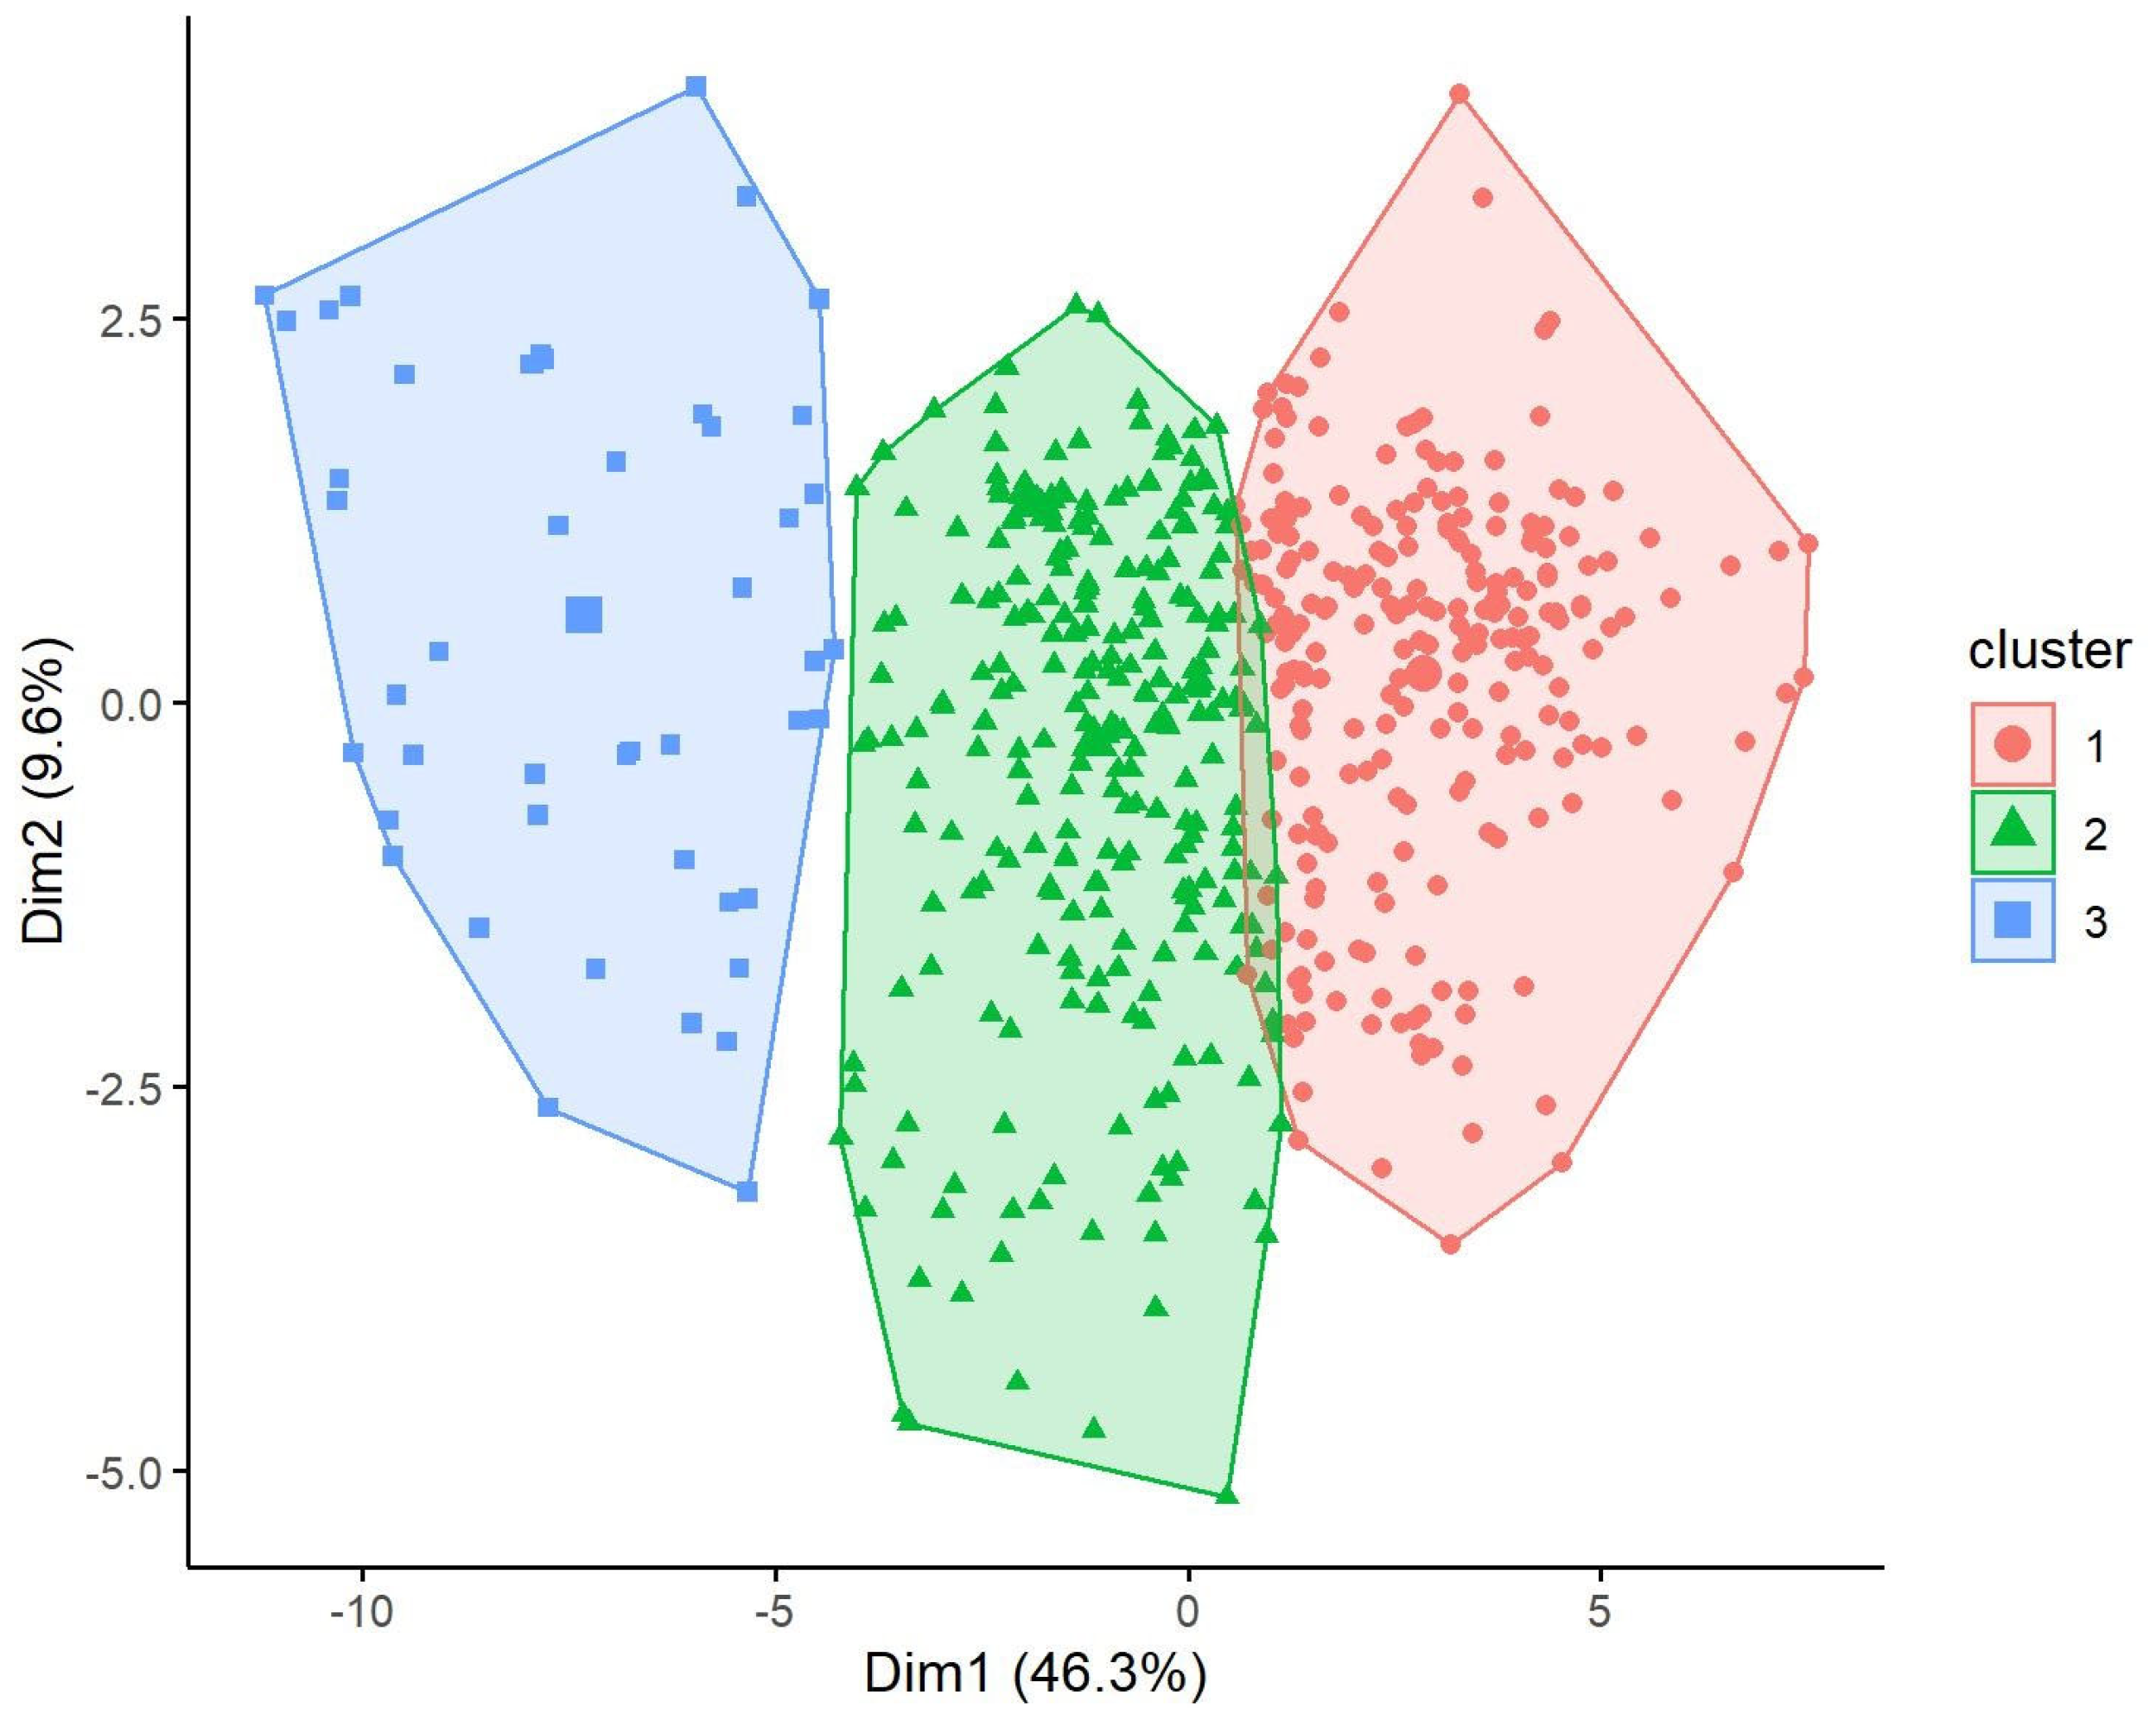
3.7. Clustering Respondents

The elbow method suggested three clusters with different responses to CM (Figure 1). Cluster 2 (subsequently assigned the label ‘neutral cluster’) was the largest cluster (n = 284, 50% of total) and was characterised by mostly neutral opinions (scores around 4).
Concerning CM (Table 8), Cluster 3 (named the ‘positive cluster’; n = 239, 41%) was of considerable size, and perceived CM more positively than Cluster 2, with scores generally higher than 5 across all statements. Cluster 1 (named the ‘negative cluster’) was the smallest (n = 49, 9%) and associated with negative opinions towards CM, with scores below 3 for each statement. Neophobia scores were not different between clusters. The positive cluster was more aware of CM than the negative and neutral clusters, and also had significantly more positive perceptions of the CM product attributes than the neutral and negative clusters. Not surprisingly, the positive cluster was significantly more likely to engage with CM: this cluster found CM more attractive than PBMAs and indicated that they would regularly eat and buy CM instead of conventional meat on a regular basis if it was available.
In terms of demographics (Table 8), the ‘neutral’ cluster differed from the total respondent sample in terms of gender proportions and meat and PBMA consumption frequencies. Compared to the total sample, the neutral cluster had lower proportions of men (neutral cluster: 41%, total sample: 47%) and higher proportions of women (neutral cluster: 59%, total sample: 53%). Furthermore, the neutral cluster had a lower proportion of low meat consumption respondents (neutral cluster: 24%, total sample: 30%), and a higher proportion of high meat consumption respondents (neutral cluster: 46%, total sample: 39%). This cluster also had a lower proportion of high frequency PBMA consumers compared to the total sample (neutral cluster: 11%, total sample: 20%).
Compared with the total respondent group, the ‘positive’ cluster had more men (positive cluster: 56%, total sample: 47%); less women (positive cluster: 44%, total sample: 53%); more Millennials (positive cluster: 63%, total sample: 56%); and less Gen X respondents (positive cluster: 37%, total sample: 44%). Furthermore, the positive cluster had more low meat (positive cluster: 36%, total sample: 30%) and less high-frequency meat (positive cluster: 30%, total sample: 39%) consumer respondents than the total sample. Conversely, this cluster had more high-frequency PBMA consumers (positive cluster: 30%, total sample: 20%) and less respondents who tried PBMAs once than the total sample (positive cluster: 18%, total sample: 24%). The demographic proportions of the negative cluster were not different from proportions of the total respondent sample.

4. Discussion

This study advances the current limited knowledge concerning the perception of CM among A-NZ consumers with varying meat and PBMA consumption habits. The results show that the willingness to engage and perceptions of CM are not homogenous across A-NZ flexitarians and that segmentation informs a more nuanced understanding of how factors such as gender, age, meat and PBMA consumption frequency, and levels of neophobia affect such perceptions. A clear relationship between PBMA consumption frequency and CM product attribute perceptions, as well as potential engagement with CM, is highlighted.

4.1. Effects of Respondent Demographics on Awareness and Perceptions of CM

Awareness of CM was rated around neutral for most demographic groups, but was higher in men than women, higher in Millennials compared to Generation X, and higher in high-frequency compared to low-frequency PBMA consumers. The proportion of respondents aware of CM (52%) was lower than a recent A-NZ study in which 66% of respondents were well informed of CM or had heard of it before [21]. Awareness is higher in young and highly educated people [17], and the Hamlin study included mostly young university students, whereas the cohort here represented a wider general population.
CM awareness in A-NZ appears lower than in other countries; for example, in India ~75% were aware [14]. Several factors can be postulated to contribute to a low relative awareness of CM in A-NZ. Firstly, agricultural food production plays a major role in the local economy [31], its society, and food culture [20]. Secondly, A-NZ has a conservative attitude towards some novel food production techniques compared to other countries. For example, A-NZ does not allow the cultivation of genetically modified (GM) crops and GM foods can only be imported after approval through the Food Standards Australia New Zealand Novel Foods Framework [32]. A-NZ has no specific regulatory framework in preparation for CM production, whereas others (e.g., the USA, Singapore) are actively developing bespoke frameworks [33]. Thirdly, in contrast to Europe, Asia, and North America, there are to date no CM start-ups within A-NZ [33,34], likely reducing the media exposure to CM for A-NZ residents.
Awareness and knowledge of CM have been associated with increased consumer acceptance of CM [35,36,37]. This was confirmed herein where CM aware respondents consistently rated potential engagement and CM product attributes higher than those CM unaware. Increasing consumer awareness and/or familiarity with CM therefore presents as an important strategy to increase consumer interest and engagement with CM in A-NZ.

4.2. Effects of Respondent Demographics on Potential CM Engagement (Willingness to Taste, Eat Regularly, and Purchase) and Perceptions of CM Product Attributes

The finding that men and Millennials have more positive perceptions of CM than women and Gen X, respectively, concurs with two recent comprehensive reviews on factors affecting consumer acceptance of CM [16,17].
The effects of food neophobia have been less commonly reported. Here, although low neophobics reported a slight but significantly higher willingness to try CM compared to medium and high neophobics, all scores were only somewhat above neutral (‘neither agree nor disagree’). Neophobic groups did not differ in their willingness to eat CM regularly or purchase it. The willingness to purchase was rated lower than the willingness to taste or regularly eat CM and suggests that the level of willingness to actively consume CM may not directly translate into purchase intent. Previous studies reported that increased neophobia reduces willingness to engage with CM [14,38,39,40]; however, these studies mostly only measured one level of engagement (e.g., willingness to consume/eat CM, intention to purchase CM) or reported averages across multiple measures of potential engagement [39]. This highlights that even though those who are most open to trying new foods demonstrate a higher relative willingness to try CM, they do not show more potential interest in regular engagement with CM than those generally less open to trying new foods. The Food Technology Neophobia Scale (FTNS) may have correlated more strongly with the measures of willingness to engage with CM than the Food Neophobia Scale since the FTNS specifically focuses on novel technologies rather than the food product itself [41]. For example, food technology neophobia was significantly correlated with attitudes of CM, as well as four different levels of potential engagement with CM, in an online survey among 617 German respondents [42]. Therefore, future research should consider the inclusion of the FTNS as an additional measure.
Notably, high PBMA consumers consistently reported higher CM awareness and willingness to eat and purchase CM regularly than those who did not regularly consume PBMAs. This suggests that, in A-NZ, CM is more attractive to those who already incorporate PBMAs in their diet—perhaps as a means of replacing meat as indicated by the strong association between meat and PBMA consumption frequency. In addition, cluster analysis showed that the most positive cluster had a relatively high proportion of high-frequency PBMA consumers and a low proportion of high-frequency meat consumers. In terms of product attribute perceptions, there was a strong positive PBMA consumption frequency effect on the perception of CM being more tasty, healthy, safe, and natural. Interestingly, high compared to low PBMA consumers had more positive CM perceptions not only relative to conventional meat but also relative to PBMAs, even though they consume the latter most often. Furthermore, replacing PBMAs with CM was perceived to increase the tastiness and naturalness of CM more than when CM was considered as a replacement for conventional meat. This implies a dissatisfaction with the taste of current PBMAs, consistent with the previous literature that reports that consumers prefer sensory characteristics of conventional meat over PBMAs [43,44]. As such, CM, which is expected to taste similar to meat once fully developed [9], may have a superior sensory profile compared to PBMAs, and could be an option for those embarking on a flexitarian lifestyle.
The current study is the first to report on CM perceptions across categories of PBMA consumption frequency, ranging from ‘tried PBMAs once’ to ‘consuming PBMAs 4–7 days per week’, and highlights the clear relationship between PBMA consumption frequency and CM perceptions, at least in A-NZ consumers.

4.3. Perceived CM Product Attributes Relative to Conventional Meat and PBMAs

The relative consistency across respondent demographics points to a general consensus among respondents regarding CM’s contribution to improving animal welfare and its environmental sustainability. Overall, replacing conventional meat with CM was seen as having a larger impact ethically and on animal welfare and environmental sustainability than consuming CM instead of PBMAs. This perception has been found in previous studies across multiple geographic areas, including Brazil [36], Germany [45], USA [46], and Italy [37]. These positive consumer CM perceptions could provide a useful narrative for future CM marketing. However, despite some predictive life-cycle analyses for CM [47,48,49], it is unknown whether commercially produced CM will be more environmentally friendly than conventional meat. If CM is eaten in addition to, rather than in substitution of, conventional meat, its environmental credentials would be diminished [50]. Likewise, whether CM will improve animal welfare is yet to be determined [51].
The respondent demographic groups were divided as to perceived tastiness and naturalness of CM, perhaps because these attributes are more a matter of personal preference than animal welfare and environmental sustainability concepts. Taste is certainly subjective, and perceived naturalness flows from emotional factors (e.g., fear, disgust) more so than from logical reasoning [52]. Furthermore, it is difficult to rate the perceived tastiness of a hypothetical and unavailable product, as implied by the large proportion of respondents who neither agreed nor disagreed with statements that CM was tastier/healthier/ safer than conventional meat/PBMAs. Sensory characteristics are a key driver of food choice [53], therefore, extensive sensory characterisation will be required to compare CM to conventional meat once CM is available for evaluation [54].
Interestingly, when compared to conventional meat, low neophobics rated perceptions of CM more positively than medium and high neophobics for animal welfare, environmental sustainability, and ethics, but lower for taste and naturalness. This may suggest that low neophobics could consider consuming CM for ethical reasons, however, the low perceived naturalness (ratings less than neutral) may be a large barrier as perceived naturalness has been reported to be strongly associated with reduced CM acceptance [18,55] through evoked disgust [56]. Siegrist et al. (2020) previously reported counter-intuitive results of reduced perceived CM naturalness by low neophobic Chinese respondents as a chance finding [40], however, this study shows similar results. Low neophobia in adults has been associated with a preference for low processed, whole food products [57], which may account for more negative perceptions of naturalness for meat grown in an industrial setting in the low neophobic group.
The positive correlations between potential engagement and CM product attributes suggest that more positive perceptions of safety and ethics may result in a higher willingness to regularly eat and purchase CM when compared to conventional meat, but that higher perceived tastiness may result in higher engagement with CM when compared to PBMAs. This highlights that motivators of consumption differ depending on whether a consumer uses CM to replace conventional meat or PBMAs and may be an important consideration when targeting different consumers.

4.4. Limitations

This study provided novel insights into CM perceptions in A-NZ based respondents but had some limitations. Firstly, the study included a convenience sample of quasi-professional panellists who may not be fully representative of the population aged 25–55. The results may not be applicable to those younger and older than the respondents included in this study. Due to the low numbers of non-binary respondents, these were removed from statistical analyses and therefore CM perceptions in non-binary respondents is an area for future research. Education level was not considered in this study, but should be investigated in future studies since a high education has been associated with the early adoption of novel food technologies in previous studies [17]. Furthermore, this study investigated a product concept (CM) not currently available on the market within A-NZ and so respondents may have found it cognitively challenging to answer questions about a concept with which they have no tangible experience and may account for answers hovering around neither agree nor disagree for several statements. It should be acknowledged that the information respondents received included comments on potential cooking, use, taste, and health of CM and potential benefits of CM on animal welfare, which may have influenced the product attribute ratings in the current study. However, the researchers deemed it a priority that respondents completed the survey with identical background knowledge to be able to compare the results between demographic groups. Nevertheless, as consumer acceptance of these products is key to their success, this research is needed to inform developments in and promotion of this new technology.

5. Conclusions

Awareness most consistently predicted potential engagement and enhanced CM product attribute perceptions, but other factors (being male, Millennial, a high-frequency PBMA, and/or low-frequency meat consumer) also improved perceptions and increased potential engagement with CM to some extent. Consumer segmentation showed that only a small group of respondents (9%) had very negative perceptions of CM, with other groups having more neutral (50%) or positive (41%) perceptions. The differences in respondent demographics between clusters showed that consumers in A-NZ are not a homogenous group with regards to their perceptions and potential engagement with CM. Furthermore, increasing consumer awareness of and familiarity with CM to improve perceptions of this novel technology will be an important strategy to enhance CM engagement. Currently, it appears early adopters of CM may be those who already consume PBMAs regularly.

Author Contributions

Conceptualization, C.G., O.J.O. and J.H.; methodology C.G., O.J.O., M.W.N. and J.H.; formal analysis, C.G. and A.J.R.G.; investigation, C.G. and A.J.R.G.; resources, C.G. and P.C.; data curation, C.G.; writing—original draft preparation, C.G.; writing—review and editing, C.G., A.J.R.G., O.J.O., M.W.N., M.F. and J.H.; visualization, C.G; supervision, M.F. and J.H.; project administration, C.G. and P.C.; funding acquisition, M.F. and J.H. All authors have read and agreed to the published version of the manuscript.

Funding

This work was funded by a NZ Ministry of Business, Innovation, and Employment (MBIE) Catalyst Grant (70161-CNZSFF-MAU).

Institutional Review Board Statement

The study was conducted in accordance with the Declaration of Helsinki and approved by the Ethics Committee of Massey University (low risk; protocol code 4000024924).

Informed Consent Statement

Informed consent was obtained from all subjects involved in the study.

Data Availability Statement

The lead author has full access to the data reported in the manuscript and data are available upon request.

Conflicts of Interest

Olivia J. Ogilvie is an employee of CellCo Limited, a company that aims to commercialise ingredients for cultivated meat. The other authors declare no conflict of interest.

References

  1. Willett, W.; Rockström, J.; Loken, B.; Springmann, M.; Lang, T.; Vermeulen, S.; Garnett, T.; Tilman, D.; DeClerck, F.; Wood, A.; et al. Food in the Anthropocene: The EAT—Lancet Commission on healthy diets from sustainable food systems. Lancet 2019, 393, 447–492. [Google Scholar]
  2. Niemiec, R.; Jones, M.S.; Mertens, A.; Dillard, C. The effectiveness of COVID-related message framing on public beliefs and behaviors related to plant-based diets. Appetite 2021, 165, 105293. [Google Scholar] [CrossRef]
  3. Kantar. Better Futures 2022; Kantar: London, UK, 2022. [Google Scholar]
  4. Colmar Brunton. Hungry for Plant-Based: New Zealand Consumer Insights; Food Frontier: Melbourne, Australia, 2019. [Google Scholar]
  5. Parodi, A.; Leip, A.; De Boer, I.J.M.; Slegers, P.M.; Ziegler, F.; Temme, E.H.M.; Herrero, M.; Tuomisto, H.; Valin, H.; Van Middelaar, C.E.; et al. The potential of future foods for sustainable and healthy diets. Nat. Sustain. 2018, 1, 782–789. [Google Scholar] [CrossRef] [Green Version]
  6. O’Connor, A. Fake Meat vs. Real Meat. The New York Times, 2 December 2020. [Google Scholar]
  7. Szejda, K.; Urbanovich, T.; Wilks, M. Accelerating Consumer Adoption of Plant-Based Meat: An Evidence-Based Guide for Effective Practice; Good Food Institute: Washington, DC, USA, 2020. [Google Scholar]
  8. Post, M.J.; Levenberg, S.; Kaplan, D.L.; Genovese, N.; Fu, J.; Bryant, C.J.; Negowetti, N.; Verzijden, K.; Moutsatsou, P. Scientific, sustainability and regulatory challenges of cultured meat. Nat. Food 2020, 1, 403–415. [Google Scholar] [CrossRef]
  9. Post, M.J. Cultured beef: Medical technology to produce food. J. Sci. Food Agric. 2014, 94, 1039–1041. [Google Scholar] [CrossRef]
  10. Aravindan, A.; Geddie, J. Singapore Approves Sale of Lab-Grown Meat in World First; Reuters: London, UK, 2020. [Google Scholar]
  11. Hort, J. Consumers are central to any change in the food system. N. Z. Sci. Rev. 2021, 77, 65–67. [Google Scholar] [CrossRef]
  12. Onwezen, M.C.; Bouwman, E.P.; Reinders, M.J.; Dagevos, H. A systematic review on consumer acceptance of alternative proteins: Pulses, algae, insects, plant-based meat alternatives, and cultured meat. Appetite 2021, 159, 105058. [Google Scholar] [CrossRef]
  13. de Oliveira Padilha, L.G.; Malek, L.; Umberger, W. Consumers’ attitudes towards lab-grown meat, conventionally raised meat and plant-based protein alternatives. Food Qual. Prefer. 2022, 99, 104573. [Google Scholar] [CrossRef]
  14. Bryant, C.; Szejda, K.; Parekh, N.; Deshpande, V.; Tse, B. A Survey of Consumer Perceptions of Plant-Based and Clean Meat in the USA, India, and China. Front. Sustain. Food Syst. 2019, 3, 11. [Google Scholar] [CrossRef] [Green Version]
  15. Bryant, C.; Sanctorum, H. Alternative proteins, evolving attitudes: Comparing consumer attitudes to plant-based and cultured meat in Belgium in two consecutive years. Appetite 2021, 161, 105161. [Google Scholar] [CrossRef]
  16. Bryant, C.; Barnett, J. Consumer Acceptance of Cultured Meat: An Updated Review (2018–2020). Appl. Sci. 2020, 10, 5201. [Google Scholar] [CrossRef]
  17. Pakseresht, A.; Ahmadi Kaliji, S.; Canavari, M. Review of factors affecting consumer acceptance of cultured meat. Appetite 2022, 170, 105829. [Google Scholar] [CrossRef]
  18. Siegrist, M.; Bearth, A.; Hartmann, C. Food disgust sensitivity influences the perception of food hazards: Results from longitudinal and cross-cultural studies. Appetite 2020, 153, 104742. [Google Scholar] [CrossRef]
  19. Bryant, C.; van Nek, L.; Rolland, N.C.M. European Markets for Cultured Meat: A Comparison of Germany and France. Foods 2020, 9, 1152. [Google Scholar] [CrossRef]
  20. Tucker, C.A. The significance of sensory appeal for reduced meat consumption. Appetite 2014, 81, 168–179. [Google Scholar] [CrossRef]
  21. Hamlin, R.P.; McNeill, L.S.; Sim, J. Food neophobia, food choice and the details of cultured meat acceptance. Meat Sci. 2022, 194, 108964. [Google Scholar] [CrossRef]
  22. Malavalli, M.M.; Hamid, N.; Kantono, K.; Liu, Y.; Seyfoddin, A. Consumers’ Perception of In-Vitro Meat in New Zealand Using the Theory of Planned Behaviour Model. Sustainability 2021, 13, 7430. [Google Scholar] [CrossRef]
  23. Euromonitor International. Going Plant-Based: The Rise of Vegan and Vegetarian Food; Euromonitor International: London, UK, 2020. [Google Scholar]
  24. Pliner, P.; Hobden, K. Development of a scale to measure the trait of food neophobia in humans. Appetite 1992, 19, 105–120. [Google Scholar] [CrossRef]
  25. R Core Team. R: A Language and Environment for Statistical Computing; R Foundation for Statistical Computing: Vienna, Austria, 2022. [Google Scholar]
  26. Wickham, H.; François, R.; Henry, L.; Müller, K. dplyr: A Grammar of Data Manipulation. 2022. [Google Scholar]
  27. Laureati, M.; Spinelli, S.; Monteleone, E.; Dinnella, C.; Prescott, J.; Cattaneo, C.; Proserpio, C.; De Toffoli, A.; Gasperi, F.; Endrizzi, I.; et al. Associations between food neophobia and responsiveness to “warning” chemosensory sensations in food products in a large population sample. Food Qual. Prefer. 2018, 68, 113–124. [Google Scholar] [CrossRef]
  28. Ogle, D.H.; Doll, J.C.; Wheeler, P.; Dinno, A. FSA: Fisheries Stock Analysis. 2022. [Google Scholar]
  29. Pinheiro, J.; Bates, D. R Core Team. nlme: Linear and Nonlinear Mixed Effects Models. 2022. [Google Scholar]
  30. Kassambara, A.; Mundt, F. Factoextra: Extract and Visualize the Results of Multivariate Data Analyses. 2020. [Google Scholar]
  31. Beef + Lamb New Zealand. Economic Contribution of the New Zealand Red Meat Industry. 2020. [Google Scholar]
  32. Food Standards Australia New Zealand. Australia New Zealand Food Standards Code in Standard 1.5.1—Novel Foods. Available online: https://www.legislation.gov.au/Details/F2017C00324 (accessed on 23 January 2023).
  33. Food Standards Australia New Zealand. Available online: https://www.foodstandards.gov.au/consumer/generalissues/Pages/Cell-based-meat.aspx (accessed on 23 January 2023).
  34. Good Food Institute. Cultivated Meat and Seafood—State of the Industry Report; Good Food Institute: Washington, DC, USA, 2021. [Google Scholar]
  35. Rolland, N.C.M.; Markus, C.R.; Post, M.J. The effect of information content on acceptance of cultured meat in a tasting context. PLoS ONE 2020, 15, e0231176. [Google Scholar] [CrossRef] [Green Version]
  36. Valente, J.d.P.S.; Fiedler, R.A.; Sucha Heidemann, M.; Molento, C.F.M. First glimpse on attitudes of highly educated consumers towards cell-based meat and related issues in Brazil. PLoS ONE 2019, 14, e0221129. [Google Scholar] [CrossRef] [Green Version]
  37. Mancini, M.C.; Antonioli, F. Exploring consumers’ attitude towards cultured meat in Italy. Meat Sci. 2019, 150, 101–110. [Google Scholar] [CrossRef]
  38. Dupont, J.; Fiebelkorn, F. Attitudes and acceptance of young people toward the consumption of insects and cultured meat in Germany. Food Qual. Prefer. 2020, 85, 103983. [Google Scholar] [CrossRef]
  39. Wilks, M.; Phillips, C.J.C.; Fielding, K.; Hornsey, M.J. Testing potential psychological predictors of attitudes towards cultured meat. Appetite 2019, 136, 137–145. [Google Scholar] [CrossRef]
  40. Siegrist, M.; Hartmann, C. Perceived naturalness, disgust, trust and food neophobia as predictors of cultured meat acceptance in ten countries. Appetite 2020, 155, 104814. [Google Scholar] [CrossRef]
  41. Wendt, M.-C.; Weinrich, R. A systematic review of consumer studies applying the Food Technology Neophobia Scale: Lessons and applications. Food Qual. Prefer. 2023, 106, 104811. [Google Scholar] [CrossRef]
  42. Baum, C.M.; Bröring, S.; Lagerkvist, C.-J. Information, attitudes, and consumer evaluations of cultivated meat. Food Qual. Prefer. 2021, 92, 104226. [Google Scholar] [CrossRef]
  43. Michel, F.; Hartmann, C.; Siegrist, M. Consumers’ associations, perceptions and acceptance of meat and plant-based meat alternatives. Food Qual. Prefer. 2021, 87, 104063. [Google Scholar] [CrossRef]
  44. Michel, F.; Knaapila, A.; Hartmann, C.; Siegrist, M. A multi-national comparison of meat eaters’ attitudes and expectations for burgers containing beef, pea or algae protein. Food Qual. Prefer. 2021, 91, 104195. [Google Scholar] [CrossRef]
  45. Weinrich, R.; Strack, M.; Neugebauer, F. Consumer acceptance of cultured meat in Germany. Meat Sci. 2020, 162, 107924. [Google Scholar] [CrossRef]
  46. Wilks, M.; Phillips, C.J.C. Attitudes to in vitro meat: A survey of potential consumers in the United States. PLoS ONE 2017, 12, e0171904. [Google Scholar] [CrossRef] [Green Version]
  47. Good Food Institute. Anticipatory Life Cycle Assessment and Techno-Economic Assessment of Commercial Cultivated Meat Production; Good Food Institute: Washington, DC, USA, 2021. [Google Scholar]
  48. Sinke, P.; Odegard, I. LCA of Cultivated Meat—Future Projections for Different Scenarios; CE Delft: Delft, The Netherlands, 2021. [Google Scholar]
  49. Mattick, C.S.; Landis, A.E.; Allenby, B.R.; Genovese, N.J. Anticipatory Life Cycle Analysis of In Vitro Biomass Cultivation for Cultured Meat Production in the United States. Environ. Sci. Technol. 2015, 49, 11941–11949. [Google Scholar] [CrossRef]
  50. Stephens, N.; Di Silvio, L.; Dunsford, I.; Ellis, M.; Glencross, A.; Sexton, A. Bringing cultured meat to market: Technical, socio-political, and regulatory challenges in cellular agriculture. Trends Food Sci. Technol. 2018, 78, 155–166. [Google Scholar] [CrossRef]
  51. Treich, N. Cultured Meat: Promises and Challenges. Environ. Resour. Econ. 2021, 79, 33–61. [Google Scholar] [CrossRef]
  52. Wilks, M.; Hornsey, M.; Bloom, P. What does it mean to say that cultured meat is unnatural? Appetite 2021, 156, 104960. [Google Scholar] [CrossRef]
  53. Byrne, D.V. Current Trends in Multidisciplinary Approaches to Understanding Consumer Preference and Acceptance of Food Products. Foods 2020, 9, 1380. [Google Scholar] [CrossRef]
  54. Fraeye, I.; Kratka, M.; Vandenburgh, H.; Thorrez, L. Sensorial and Nutritional Aspects of Cultured Meat in Comparison to Traditional Meat: Much to Be Inferred. Front. Nutr. 2020, 7, 35. [Google Scholar] [CrossRef] [Green Version]
  55. Siegrist, M.; Sütterlin, B. Importance of perceived naturalness for acceptance of food additives and cultured meat. Appetite 2017, 113, 320–326. [Google Scholar] [CrossRef]
  56. Siegrist, M.; Sütterlin, B.; Hartmann, C. Perceived naturalness and evoked disgust influence acceptance of cultured meat. Meat Sci. 2018, 139, 213–219. [Google Scholar] [CrossRef]
  57. Zickgraf, H.F.; Schepps, K. Fruit and vegetable intake and dietary variety in adult picky eaters. Food Qual. Prefer. 2016, 54, 39–50. [Google Scholar] [CrossRef]
Figure 1. Respondent clusters based on potential engagement and perceptions of cultivated meat, determined with k -means clustering of 572 respondents into 3 clusters. Image was created with the factoextra package [30].
Sustainability 15 04009 g001
Table 1. Survey questions to determine cultivated meat perceptions of consumers resident in Aotearoa New Zealand.
Outcome Area of InterestQuestions/StatementsLabels on 7-Point Likert Scale
1.
How often do you eat:
Meat consumption frequency
a.
Meat, including poultry
1 = 7 days per week,
2 = 4–6 days per week,
3 = 1–3 days per week, 4 = fortnightly,
5 = monthly,
6 = meat: less than monthly/plant-based products: I have tried them once,
7 = never
PBMA consumption frequency
b.
Plant-based products
Awareness of CM
2.
I am aware of cultivated meat (sometimes called: in vitro meat, lab-grown meat, and/or clean meat)
1 = strongly disagree,
2 = disagree,
3 = somewhat disagree,
4 = neither agree nor disagree,
5 = somewhat agree,
6 = agree,
7 = strongly agree
Perceived product attributes of CM relative to conventional meat
3.
Compared to conventional meat, I think cultivated meat would be:
1 = strongly disagree to 7 = strongly agree
a.
Cooked and used in the same way
b.
Tastier
c.
Healthier
d.
More animal friendly
e.
More environmentally sustainable
f.
Safer
g.
More ethical
h.
More natural
i.
More expensive
Perceived product attributes of CM relative to PBMAs
4.
Compared to plant-based meat alternatives, I think cultivated meat would be:
1 = strongly disagree to 7 = strongly agree
a.
Cooked and used in the same way
b.
Tastier
c.
Healthier
d.
More animal friendly
e.
More environmentally sustainable
f.
Safer
g.
More ethical
h.
More natural
i.
More expensive
Potential willingness to engage with CM
5.
If cultivated meat was available in New Zealand:
1 = strongly disagree to 7 = strongly agree
a.
I would be willing to taste cultivated meat.
b.
I would be willing to eat cultivated meat on a regular basis.
c.
Cultivated meat would be a more attractive alternative to meat than plant-based meat alternatives (e.g., tofu, vegetarian burgers, sausages, Quorn, falafels)
6.
Based on your current knowledge, please indicate how often you would purchase cultivated meat instead of conventional meat if it was available in New Zealand?
1 = never,
2 = rarely,
3 = occasionally,
4 = sometimes,
5 = regularly,
6 = often,
7 = always
Table 2. Respondent demographics and neophobia scores (n = 572).
DemographicCategoriesTotal (n)%
Identified genderMale26847
Female 30453
GenerationMillennial31956
Gen X25344
Meat consumption frequencyLow (less than 1 d/w)17530
Medium (1–3 d/w)17631
High (4–6 d/w)22139
PBMA consumption frequency Tried once14024
Low (less than 1 d/w)18432
Medium (1–3 d/w)13223
High (4–6 d/w)11620
Neophobia scores (mean ± SE)Low (23 ± 0.2)14726
Medium (37 ± 0.1)29050
High (44 ± 0.2)13524
Ethnicity New Zealand European 33959
Māori 508.6
Samoan 71
Cook Islands Māori 10.1
Tongan 10.1
Niuean 10.1
Chinese 386.6
Indian 5710
Other 7813
Location Rural12021
Urban38968
In between rural and urban6311
Annual yearly household income (NZD)<20,0005610
20,000–49,99911821
50,000–99,999921938
100,000–199,99913223
>200,000112
Prefer not to say366
Table 3. Mean ± SE and associated p-values of factors associated with potential engagement with cultivated meat (n = 572 respondents).
Awareness of CMWillingness to Taste CMWillingness to Eat CM RegularlyAttractiveness of CM vs. PBMAWillingness to Purchase CM
Mean ± SEp 1Mean ± SEp 1Mean ± SEp 1Mean ± SEp 1Mean ± SEp 1
Awareness of CMNot awareN/A4.5 ± 0.06 a<0.00014.0 ± 0.06 a<0.00014.1 ± 0.07 a<0.00013.2 ± 0.06 a<0.0001
Aware5.3 ± 0.06 b4.6 ± 0.06 b4.7 ± 0.07 b4.0 ± 0.07 b
GenderMen4.5 ± 0.06 a0.0365.0 ± 0.060.274.6 ± 0.06 a0.00014.7 ± 0.06 a<0.00013.9 ± 0.07 a<0.0001
Women4.2 ± 0.07 b4.9 ± 0.074.0 ± 0.07 b4.1 ± 0.07 b3.3 ± 0.06 b
Age groupMillennial4.5 ± 0.07 a0.0224.9 ± 0.060.864.4 ± 0.060.274.4 ± 0.070.803.8 ± 0.06 a0.045
Gen X4.1 ± 0.07 b4.9 ± 0.064.2 ± 0.074.3 ± 0.073.4 ± 0.07 b
Meat consumption frequencyLow4.5 ± 0.070.264.3 ± 0.07 a0.0354.3 ± 0.070.104.3 ± 0.070.273.8 ± 0.070.23
Medium4.2 ± 0.064.5 ± 0.06 a4.5 ± 0.064.5 ± 0.063.7 ± 0.06
High4.2 ± 0.074.2 ± 0.07 a4.2 ± 0.074.3 ± 0.073.4 ± 0.06
PBMA consumption frequencyTried once3.9 ± 0.07 a0.00034.8 ± 0.070.094.0 ± 0.07 a0.0384.3 ± 0.080.363.1 ± 0.06 a0.0002
Low4.2 ± 0.07 a,b5.1 ± 0.064.4 ± 0.06 b4.5 ± 0.063.6 ± 0.06 b
Medium4.4 ± 0.06 b,c4.9 ± 0.064.3 ± 0.06 a,b4.2 ± 0.073.7 ± 0.06 b
High4.7 ± 0.07 c4.8 ± 0.064.6 ± 0.07 b4.5 ± 0.074.1 ± 0.08 c
Neophobia classLow4.5 ± 0.08 a0.0194.4 ± 0.08 a<0.00014.4 ± 0.080.814.4 ± 0.080.843.7 ± 0.070.38
Medium4.3 ± 0.06 a4.3 ± 0.06 b4.3 ± 0.064.4 ± 0.063.6 ± 0.07
High4.1 ± 0.07 a4.3 ± 0.07 b4.3 ± 0.074.4 ± 0.073.6 ± 0.07
Values are mean ± SEM. CM: cultivated meat; PBMA: plant-based meat alternative. 1 p-values were determined by running a linear effects model with awareness of CM, gender, age, meat/PBMA consumption frequency, and neophobia class as fixed factors, allowing interactions between gender, age, and meat frequency consumption. For a, b, c, different superscript letters within a column indicate significant differences (p < 0.05) between respondent demographic groups with more than two levels (i.e., PBMA consumption frequency, neophobia class, and meat consumption frequency). Post hoc tests were performed using the Dunn test with Benjamini-Hochberg procedure to correct for multiple comparisons.
Table 4. PC1 and PC2 loadings, mean ratings, and p-value for comparison of product attribute perceptions of CM relative to conventional meat and PBMAs.
PC1 2 Loading (54%)PC2 2
Loading (14%)
CM vs. Conventional MeatCM vs. PBMAsp 1
Cooking and use0.28−0.324.9 ± 0.054.8 ± 0.050.027
Tastiness0.310.294.1 ± 0.054.3 ± 0.06<0.0001
Healthiness0.36−0.114.3 ± 0.064.3 ± 0.060.94
Animal welfare0.34−0.415.1 ± 0.064.7 ± 0.06<0.0001
Environmental sustainability0.35−0.295.0 ± 0.064.7 ± 0.06<0.0001
Safety0.380.214.3 ± 0.064.2 ± 0.060.057
Ethics0.38−0.194.7 ± 0.064.3 ± 0.06<0.0001
Naturalness0.380.523.8 ± 0.074.0 ± 0.07<0.0001
Cost0.14−0.385.0 ± 0.065.0 ± 0.060.60
PC: principal component, CM: cultivated meat; PBMA: plant-based meat alternatives. 1 p-values were determined by mixed-effects models, with comparator (i.e., conventional meat or PBMAs) as a fixed effect and respondent as a random effect. 2 PC1 and PC2 were determined with principal component analysis (PCA), including all product attribute ratings of CM relative to conventional meat and PBMAs.
Table 5. Mean ± SE and associated p-values for factors associated with product attribute ratings for cultivated meat relative to conventional meat (n = 572 respondents).
Cooking UseTastyHealthyAnimal WelfareEnvironmentSafetyEthicsNaturalnessCost
Mean ± SEp1Mean ± SEp 1Mean ± SEp 1Mean ± SEp 1Mean ± SEp 1Mean ± SEp 1Mean ± SEp 1Mean ± SEp 1Mean ± SEp 1
Awareness of CMNot aware4.6 ± 0.06 a<0.00013.9 ± 0.05 a<0.00014.1 ± 0.05 a<0.00014.9 ± 0.06 a<0.00014.7 ± 0.06 a<0.00014.1 ± 0.06 a<0.00014.4 ± 0.06 a<0.00013.5 ± 0.06 a0.00094.8 ± 0.06 a0.0004
Aware5.2 ± 0.05 b4.3 ± 0.06 b4.5 ± 0.06 b5.4 ± 0.06 b5.3 ± 0.06 b4.5 ± 0.06 b5.1 ± 0.06 b4.0 ± 0.08 b5.2 ± 0.05 b
GenderMen5.0 ± 0.050.194.4 ± 0.05 a0.00054.5 ± 0.05 a0.0265.2 ± 0.050.0525.1 ± 0.060.264.5 ± 0.06 a0.0324.9 ± 0.060.064.1 ± 0.07 a0.00254.9 ± 0.060.25
Women4.9 ± 0.063.9 ± 0.06 b4.2 ± 0.06 b5.0 ± 0.064.9 ± 0.064.1 ± 0.06 b4.6 ± 0.063.5 ± 0.07 b5.1 ± 0.06
Age groupMillennial4.9 ± 0.050.664.2 ± 0.060.254.5 ± 0.050.115.1 ± 0.060.655.0 ± 0.060.794.4 ± 0.060.194.9 ± 0.06 a0.0413.9 ± 0.070.305.0 ± 0.060.43
Gen X4.9 ± 0.063.9 ± 0.054.1 ± 0.065.1 ± 0.065.0 ± 0.064.1 ± 0.064.6 ± 0.07 b3.6 ± 0.075.0 ± 0.06
Meat consumption frequencyLow4.7 ± 0.06 a0.0344.3 ± 0.06 a0.0064.4 ± 0.060.254.9 ± 0.07 a0.0114.8 ± 0.060.154.4 ± 0.060.124.7 ± 0.070.104.2 ± 0.07 a0.00054.9 ± 0.060.068
Medium4.9 ± 0.05 a4.3 ± 0.05 a4.4 ± 0.055.2 ± 0.06 a,b5.1 ± 0.054.4 ± 0.054.9 ± 0.053.9 ± 0.06 a4.9 ± 0.05
High5.1 ± 0.05 b3.8 ± 0.05 b4.2 ± 0.065.3 ± 0.06 b5.1 ± 0.064.1 ± 0.064.7 ± 0.073.3 ± 0.07 b5.2 ± 0.06
PBMA consumption frequencyTried once4.8 ± 0.060.0583.7 ± 0.05 a<0.00013.9 ± 0.06 a0.0135.2 ± 0.070.325.0 ± 0.070.493.9 ± 0.06 a0.0024.5 ± 0.070.173.3 ± 0.07 a<0.00015.3 ± 0.06 a0.020
Low5.1 ± 0.054.1 ± 0.05 b4.3 ± 0.06 b5.2 ± 0.055.0 ± 0.054.3 ± 0.06 b4.8 ± 0.063.7 ± 0.07 b4.9 ± 0.06 b
Medium4.9 ± 0.054.2 ± 0.05 b4.4 ± 0.05 b,c5.1 ± 0.065.0 ± 0.064.4 ± 0.05 b,c4.8 ± 0.063.8 ± 0.06 b4.9 ± 0.05 b
High4.8 ± 0.064.6 ± 0.06 c4.7 ± 0.06 c5.0 ± 0.064.9 ± 0.064.7± 0.06 c4.8 ± 0.074.5 ± 0.07 c5.0 ± 0.05 b
Neophobia classLow5.3 ± 0.05 a0.00043.8 ± 0.05 a0.0134.1 ± 0.060.095.7 ± 0.06 a<0.00015.4 ± 0.06 a0.00064.1 ± 0.070.405.1 ± 0.06 a0.0423.1 ± 0.07 a<0.00015.2 ± 0.060.083
Medium4.8 ± 0.05 b4.2 ± 0.05 b4.4 ± 0.054.9 ± 0.06 b4.8 ± 0.06 b4.4 ± 0.064.7 ± 0.06 b3.9 ± 0.06 b4.9 ± 0.05
High4.8 ± 0.06 b4.2 ± 0.06 b4.3 ± 0.064.9 ± 0.06 b4.9 ± 0.06 b4.3 ± 0.064.6 ± 0.07 b4.2 ± 0.07 b5.0 ± 0.06
PBMA: plant-based meat alternatives. 1 p-values were determined by running a linear effects model with awareness of CM, gender, age, meat/PBMA consumption frequency, and neophobia class as fixed factors, allowing interactions between gender, age, and meat frequency consumption. For a,b,c, different superscript letters within a column indicate significant differences (p < 0.05) between respondent demographic groups. Post hoc tests were performed using the Dunn test with Benjamini-Hochberg procedure to correct for multiple comparisons.
Table 6. Mean ± SE and associated p-values of factors associated with product attribute ratings for cultivated meat relative to PBMAs (n = 572 respondents).
Cooking UseTastyHealthyAnimal WelfareEnvironmentSafetyEthicsNaturalnessCost
Mean ± SEp 1Mean ± SEp 1Mean ± SEp 1Mean ± SEp 1Mean ± SEp 1Mean ± SEp 1Mean ± SEp 1Mean ± SEp 1Mean ± SEp 1
Awareness of CMNot aware4.7 ± 0.05 a0.014.1 ± 0.06 a<0.00014.1 ± 0.05 a0.00224.6 ± 0.060.104.4 ± 0.06 a0.00014.0 ± 0.06 a0.00134.3 ± 0.06 a0.0243.9 ± 0.06 a0.0474.8 ± 0.06 a0.0003
Aware4.9 ± 0.05 b4.6 ± 0.06 b4.5 ± 0.06 b4.8± 0.064.9 ± 0.05 b4.4 ± 0.06 b4.6 ± 0.06 b4.1 ± 0.07 b5.2 ± 0.05 b
GenderMen4.9 ± 0.050.214.6 ± 0.06 a0.0144.6 ± 0.05 a0.00274.9 ± 0.060.0544.8 ± 0.050.0784.4 ± 0.06 a0.0094.6 ± 0.060.114.2 ± 0.060.0854.9 ± 0.060.34
Women4.7 ± 0.064.2 ± 0.06 b4.1 ± 0.06 b4.6 ± 0.074.5 ± 0.064.0 ± 0.06 b4.3 ± 0.063.8 ± 0.075.0 ± 0.06
Age groupMillennial4.8 ± 0.050.784.5 ± 0.060.0774.5 ± 0.06 a0.0144.8 ± 0.060.474.8 ± 0.050.104.3 ± 0.060.334.6 ± 0.060.0824.2 ± 0.060.185.0 ± 0.060.99
Gen X4.8 ± 0.064.2 ± 0.064.1 ± 0.06 b4.7 ± 0.074.5 ± 0.064.1 ± 0.064.3 ± 0.073.8 ± 0.075.0 ± 0.05
Meat consumption frequencyLow4.7 ± 0.060.294.4 ± 0.06 a,b0.0394.5 ± 0.060.264.6 ± 0.070.174.5 ± 0.060.064.4 ± 0.070.0594.5 ± 0.070.624.4 ± 0.07 a0.0354.9 ± 0.060.55
Medium4.8 ± 0.054.5 ± 0.06 b4.4 ± 0.054.8 ± 0.064.8 ± 0.054.3 ± 0.064.5 ± 0.054.1 ± 0.06 a4.9 ± 0.05
High4.9 ± 0.054.2 ± 0.06 a4.1 ± 0.064.8 ± 0.064.6 ± 0.063.9 ± 0.054.4 ± 0.063.7 ± 0.07 b5.1 ± 0.05
PBMA consumption frequencyTried once4.8 ± 0.060.944.1 ± 0.06 a0.0164.0 ± 0.06 a<0.00014.8 ± 0.070.644.6 ± 0.060.793.9 ± 0.06 a0.00084.3 ± 0.070.473.6 ± 0.07 a<0.00015.1 ± 0.060.087
Low4.8 ± 0.054.3 ± 0.06 a,b4.2 ± 0.05 a,b4.7 ± 0.064.7 ± 0.054.1 ± 0.06 a4.4 ± 0.063.9 ± 0.07 a,b5.0 ± 0.05
Medium4.8 ± 0.054.4 ± 0.06 a,b4.3 ± 0.05 b4.7 ± 0.064.6 ± 0.054.2 ± 0.05 a4.5 ± 0.054.1 ± 0.06 b4.9 ± 0.05
High4.8 ± 0.054.7 ± 0.06 b4.9 ± 0.06 c4.8 ± 0.064.7 ± 0.064.7 ± 0.06 b4.6 ± 0.064.7 ± 0.06 c4.8 ± 0.06
Neophobia classLow5.0 ± 0.060.0634.7 ± 0.060.304.0 ± 0.05 a0.0344.9 ± 0.070.584.6 ± 0.060.733.8 ± 0.06 a0.0034.4 ± 0.070.813.3 ± 0.07 a<0.00015.2 ± 0.060.34
Medium4.7 ± 0.054.8 ± 0.054.4 ± 0.06 b4.7 ± 0.064.7 ± 0.054.3 ± 0.05 b4.5 ± 0.064.2 ± 0.06 b5.0 ± 0.05
High4.8 ± 0.064.9 ± 0.054.5 ± 0.06 b4.7 ± 0.064.7 ± 0.064.4 ± 0.07 b4.5 ± 0.064.3 ± 0.06 b4.8 ± 0.05
PBMA: plant-based meat alternatives. 1 p-values were determined by running a linear effects model with awareness of CM, gender, age, meat/PBMA consumption frequency, and neophobia class as fixed factors, allowing interactions between gender, age, and meat frequency consumption. For a,b,c, different superscript letters within a column indicate significant differences (p < 0.05) between respondent demographic groups. Post hoc tests were performed using the Dunn test with Benjamini-Hochberg procedure to correct for multiple comparisons.
Table 7. Correlations between potential engagement with cultivated meat and product attribute perceptions of cultivated.
Cooking and UseTastinessHealthinessAnimal FriendlinessEnvironmentSafetyEthicsNaturalnessCost
CM vs. conventional meat:
Willingness to try CM0.480.280.350.56 *0.53 *0.390.55 *0.170.26
Willingness to eat CM regularly0.430.470.55 *0.410.480.60 *0.55 *0.51 *0.12
Attractiveness of CM vs. PBMA0.400.400.480.400.450.52 *0.470.420.18
Willingness to purchase CM0.350.450.450.340.380.52 *0.480.430.03
CM vs. PBMAs:
Willingness to try CM0.430.440.290.370.410.320.380.160.28
Willingness to eat CM regularly0.420.54 *0.480.410.440.51 * 0.480.420.17
Attractiveness of CM vs. PBMA0.350.57 *0.470.380.440.480.450.430.15
Willingness to purchase CM0.300.440.390.300.390.430.420.370.08
CM: cultivated meat; PBMA: plant-based meat alternatives. Spearman correlations between outcomes of potential engagement with cultivated meat and product attribute perceptions of cultivated meat compared to conventional meat and PBMAs. * Correlations were deemed relevant if r > 0.5 (p-values were all p < 0.0001).
Table 8. Clustering of the survey respondents.
Total SampleCluster 1 ‘Negative Cluster’ (n,%)Cluster 2 ‘Neutral Cluster’ (n,%)Cluster 3 ‘Positive Cluster’ (n,%)
Total sample 49 (9%)284 (50%)239 (41%)
GenderMen47%18 (37%)117 (41%) *133 (56%) *
Women53%31 (63%)167 (59%) *106 (44%) *
Age groupMillennial56%23 (47%)146 (51%)150 (63%) *
Gen X44%26 (53%)138 (49%)89 (37%) *
Meat consumption frequencyLow meat30%20 (41%)68 (24%) *87 (36%) *
Medium meat31%10 (20%)86 (30%)80 (33%)
High meat39%19 (39%)130 (46%) *72 (30%) *
PBMA consumption frequencyTried once PBMA24%15 (31%)82 (29%)43 (18%) *
Low PBMA32%13 (27%)100 (35%)71 (30%)
Medium PBMA23%9 (18%)70 (25%)53 (22%)
High PBMA20%12 (24%)32 (11%) *72 (30%) *
Neophobia scoreLow26%12 (24%)74 (26%)61 (26%)
Medium50%22 (45%)149 (52%)119 (50%)
High24%15 (31%)61 (21%)59 (25%)
Awareness of CM 3.8 ± 2.0 a3.9 ± 0.06 a4.8 ± 0.06 b
CM vs. conventional meatCooking and use 2.7 ± 0.07 a4.8 ± 0.04 b5.6 ± 0.04 c
Tastiness2.0 ± 0.05 a3.7 ± 0.9 b5.0 ± 0.05 c
Healthiness1.9 ± 0.04 a4.0 ± 0.9 b5.3 ± 0.04 c
Animal welfare2.6 ± 0.06 a4.9 ± 0.05 b5.9 ± 0.04 c
Environmental sustainability2.4 ± 0.06 a4.8 ± 0.05 b5.8 ± 0.9 c
Safety1.8 ± 0.04 a3.9 ± 0.04 b5.3 ±0.05 c
Ethics2.0 ± 0.06 a4.4 ± 0.05 b5.7 ± 0.04 c
Naturalness1.6 ± 0.04 a3.2 ± 0.05 b4.9 ± 0.05 c
Cost3.9 ± 0.09 a5.0 ± 0.05 b5.3 ± 0.05 c
CM vs. PBMAsCooking and use 2.8 ± 0.06 a4.6 ± 0.05 b5.5 ± 0.05 c
Tastiness2.2 ± 0.05 a4.0 ± 0.04 b5.3 ± 0.05 c
Healthiness2.0 ± 0.05 a3.9 ± 0.9 b5.3 ± 0.05 c
Animal welfare2.5 ± 0.06 a4.4 ± 0.05 b5.5 ± 0.05 c
Environmental sustainability2.2 ± 0.05 a4.3 ± 0.9 b5.5 ± 0.04 c
Safety1.8 ± 0.05 a3.7 ± 0.9 b5.2 ± 0.05 c
Ethics2.0 ± 0.05 a4.0 ± 0.05 b5.4 ±0.05 c
Naturalness2.0 ± 0.06 a3.6 ± 0.05 b5.0 ± 0.05 c
Cost3.8 ± 0.09 a4.9 ± 0.05 b5.3 ± 0.05 c
Potential engagementWillingness to try 2.4 ± 0.06 a4.6 ± 0.05 b5.8 ± 0.04 c
Willingness to eat regularly1.8 ± 0.05 a3.8 ± 0.05 b5.4 ± 0.04 c
Attractiveness CM vs. PBMA1.7 ± 0.04 a4.0 ± 0.05 b5.4 ± 0.05 c
Willingness to purchase1.6 ± 0.04 a3.0± 0.05 b4.7 ± 0.05 c
* Subgroups that are different from total sample (e.g., compared to the total sample, Cluster 2 has lower proportions of low meat frequency and higher proportions of high meat frequency respondents), determined by comparison of standardized residuals of Chi-square goodness-of-fit test (i.e., standardized residual of >1.96 indicates p < 0.05). a,b,c different superscript letters for the different CM perceptions indicate differences between clusters (p < 0.05), determined with Dunn testing and Benjamini-Hochberg corrections for multiple comparisons.
Disclaimer/Publisher’s Note: The statements, opinions and data contained in all publications are solely those of the individual author(s) and contributor(s) and not of MDPI and/or the editor(s). MDPI and/or the editor(s) disclaim responsibility for any injury to people or property resulting from any ideas, methods, instructions or products referred to in the content.

