
Probabilistic Forecast and Risk Assessment of Flash Droughts Based on Numeric Weather Forecast: A Case Study in Zhejiang, China

Abstract
1. Introduction
2. Methodology
2.1. Flash Drought Identification
2.2. Probabilistic Forecast for Flash Droughts
2.2.1. Generalized Bayesian Model
2.2.2. Probabilistic Flash Drought Forecasting
2.3. Verification Methods
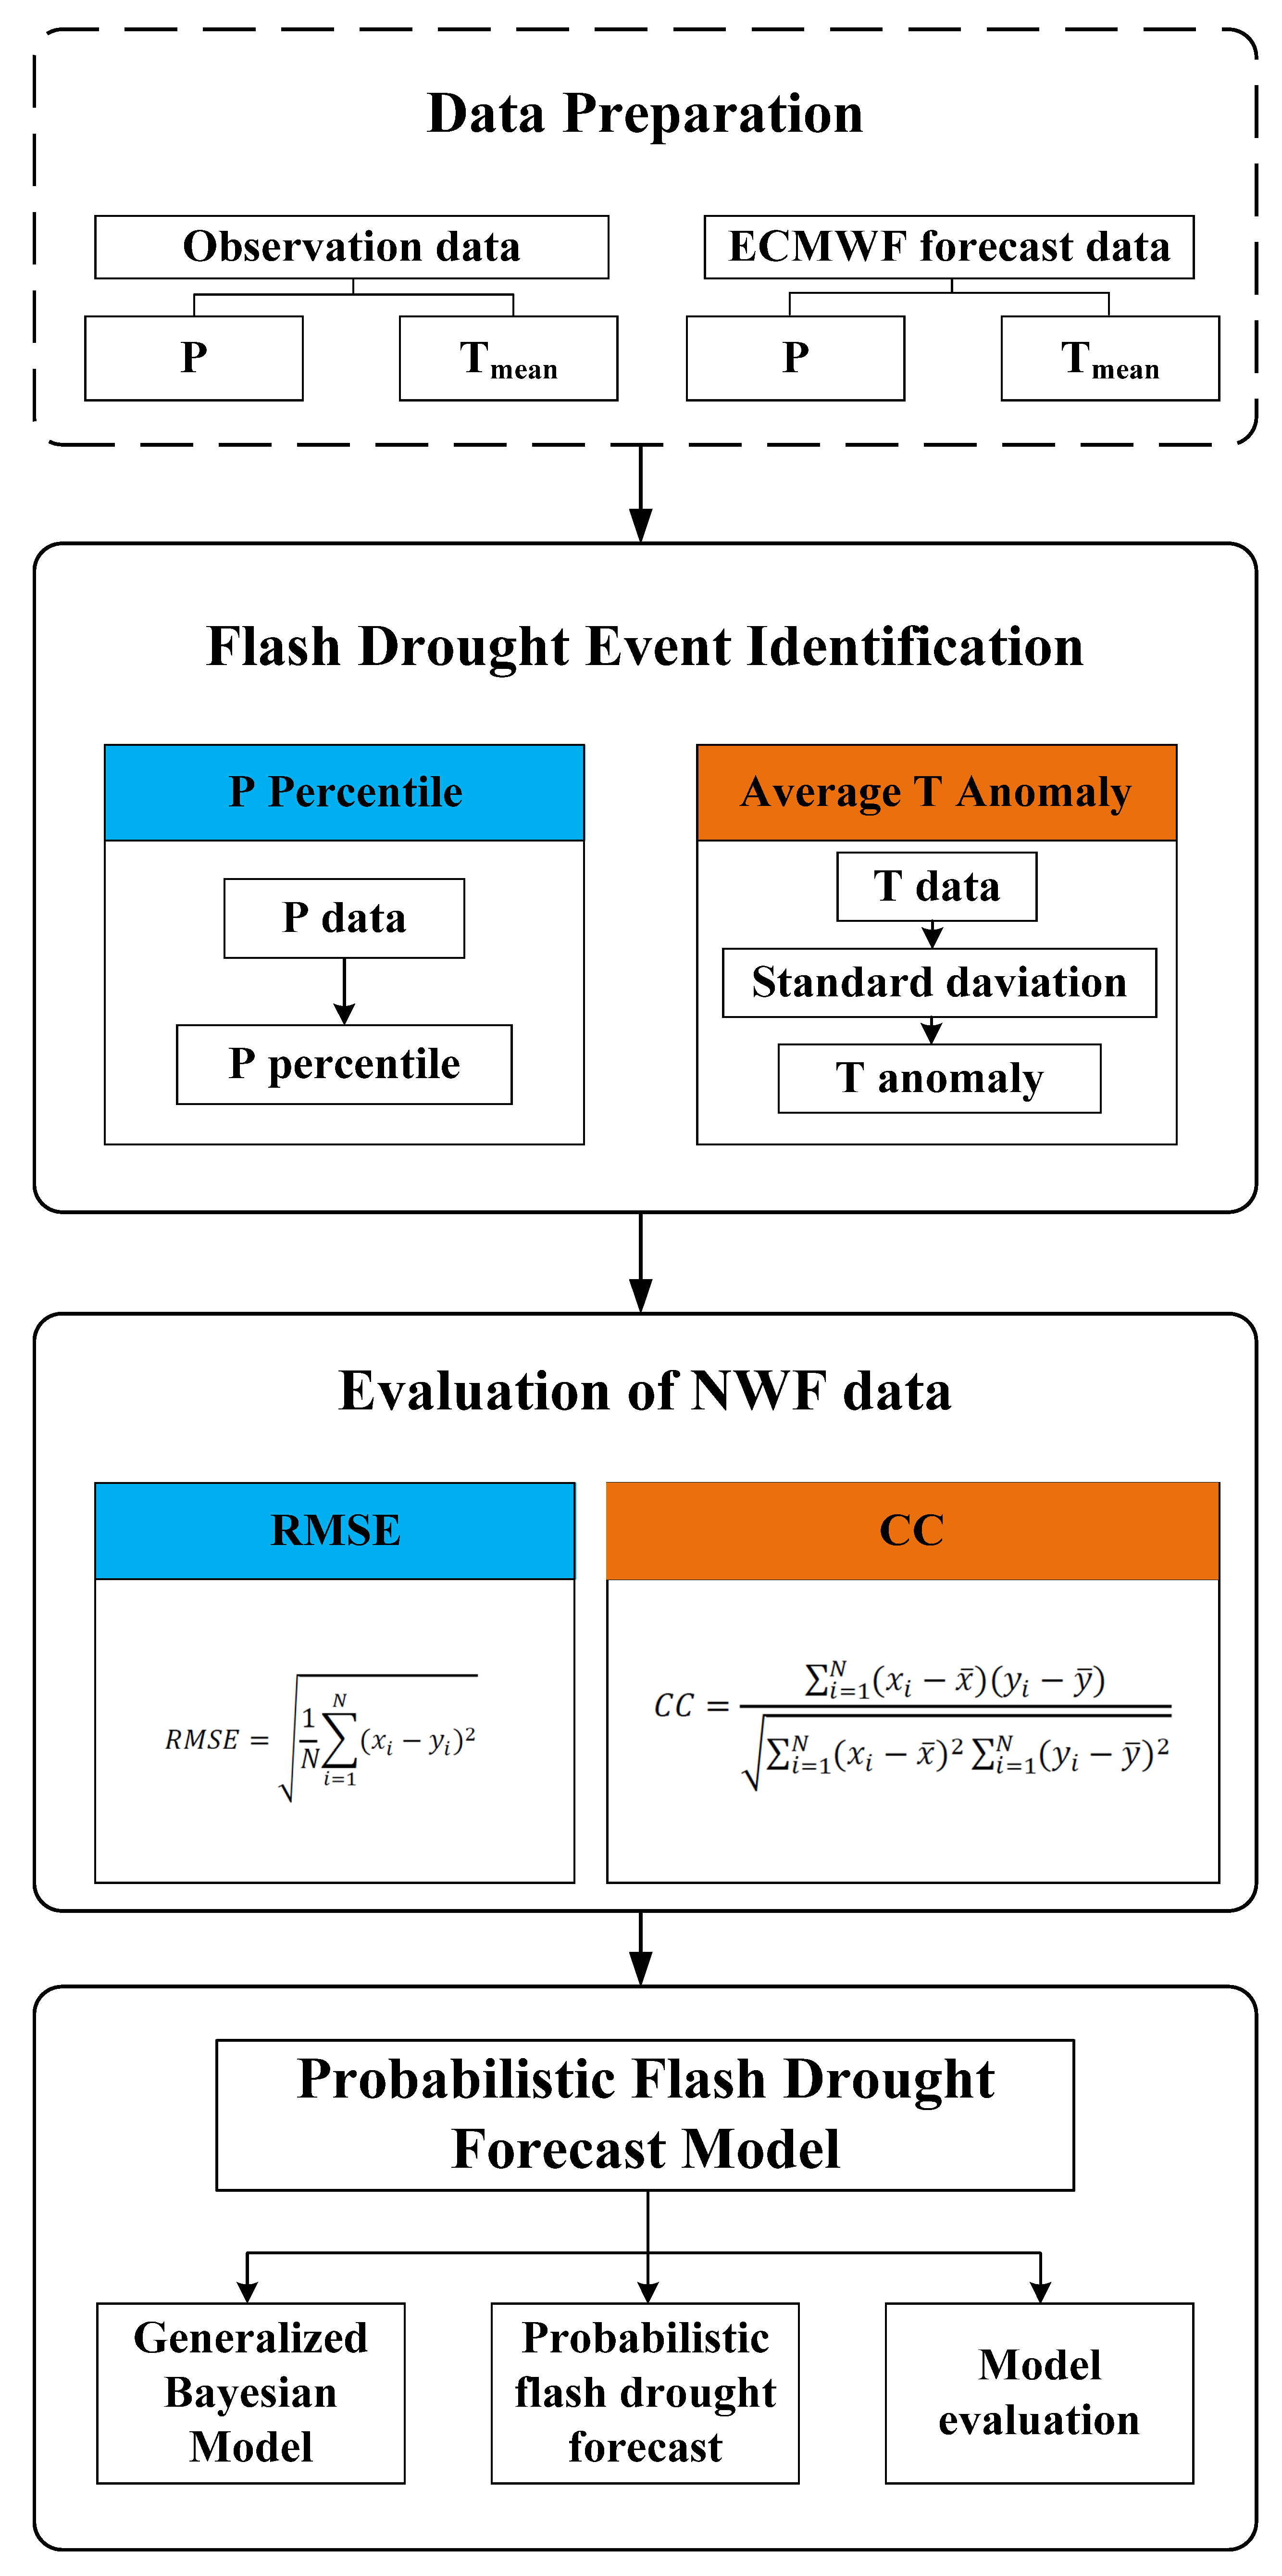
2.4. General Framework
3. Study Area and Data Sources
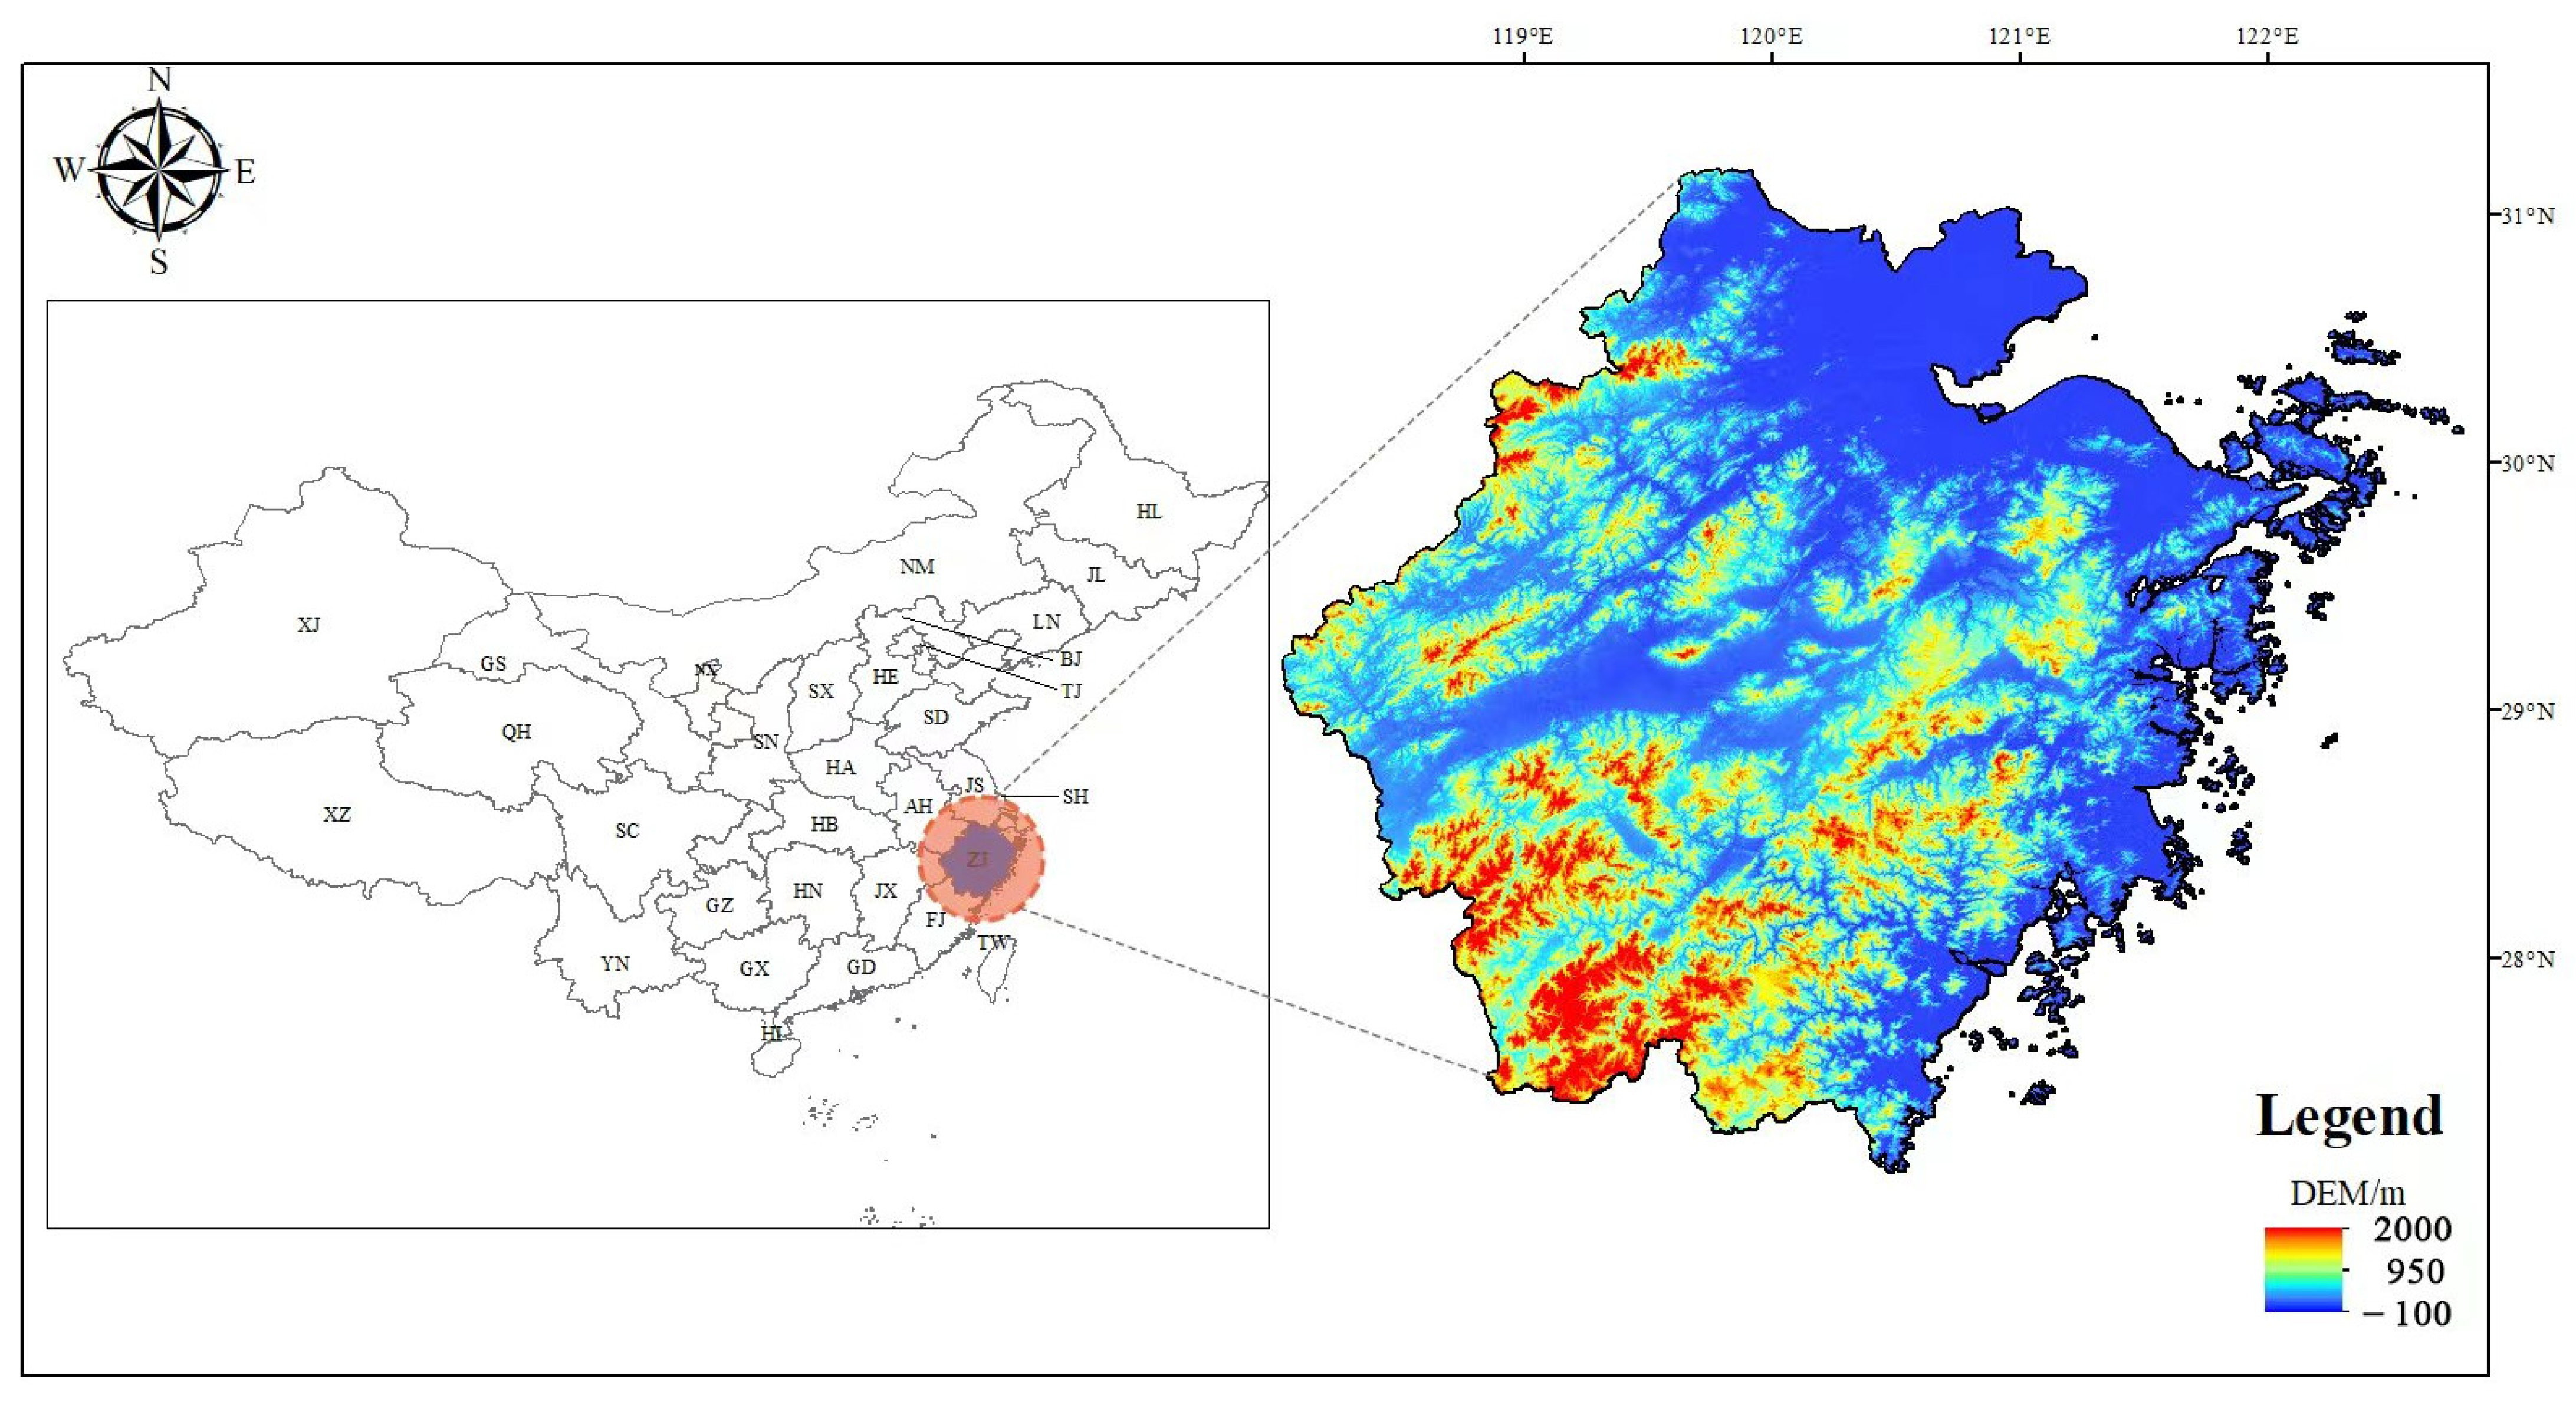
3.1. Study Area
3.2. Data Sources
4. Results and Discussions
4.1. Flash Drought Identification for Zhejiang Province
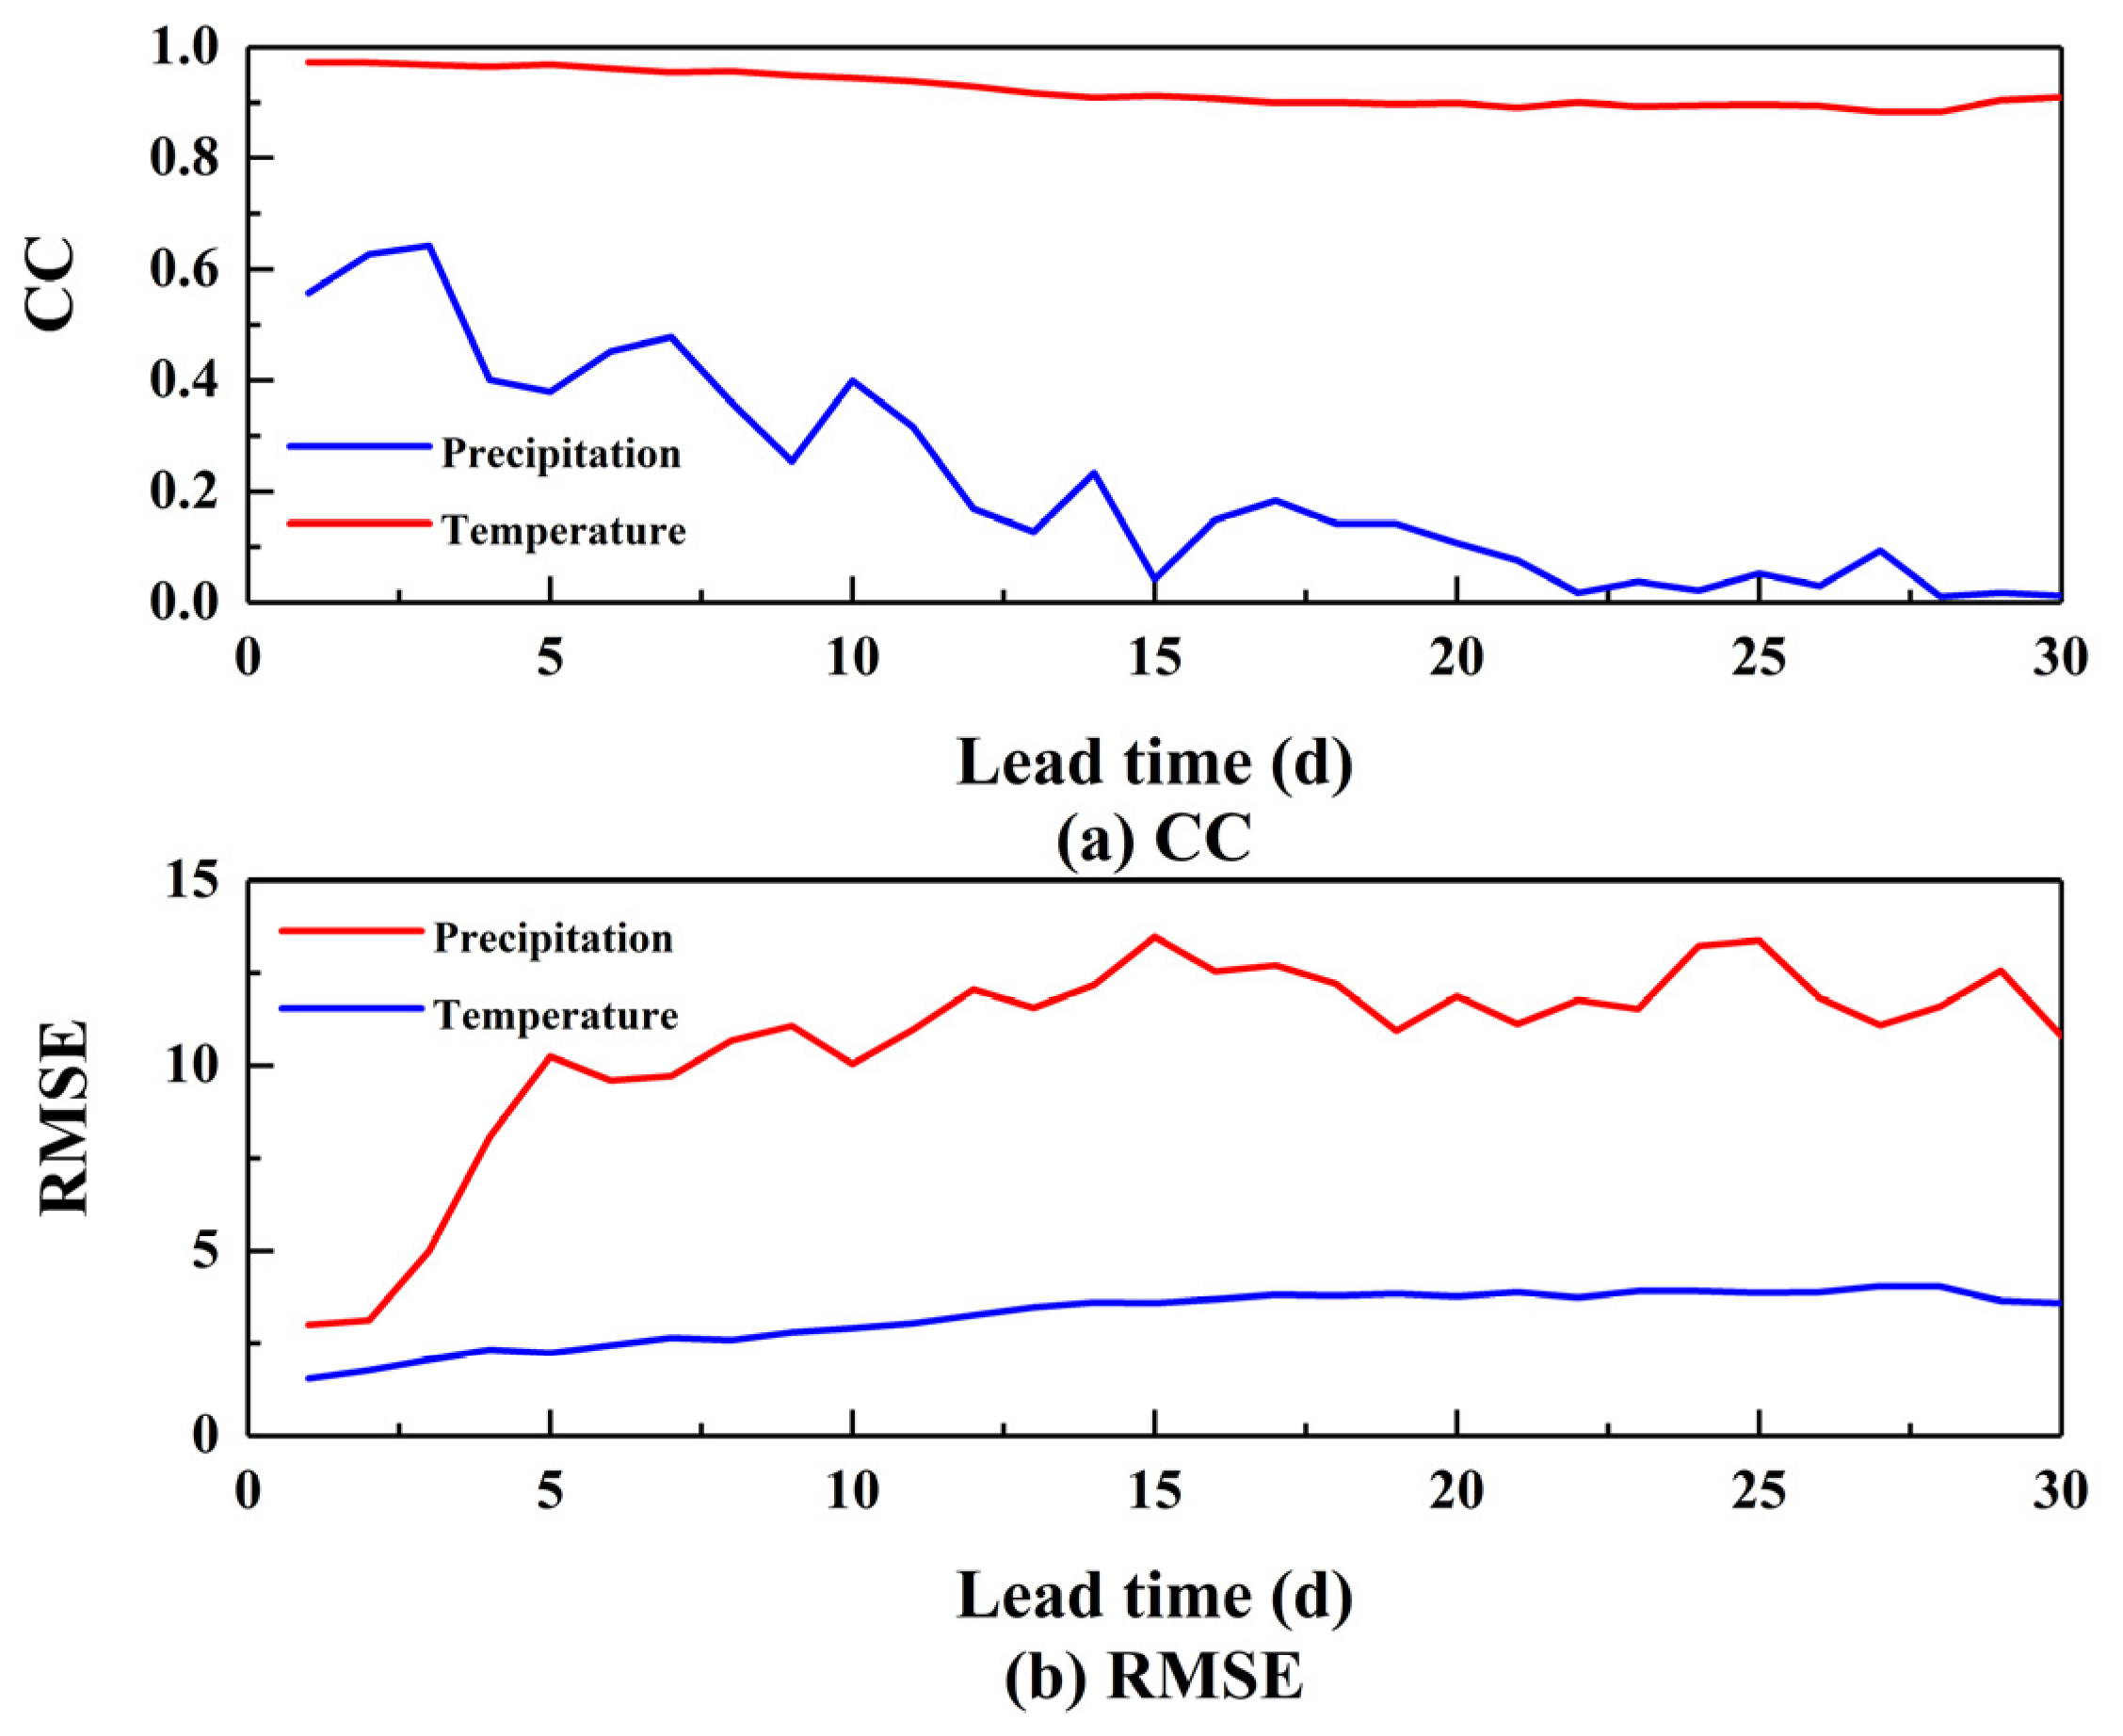
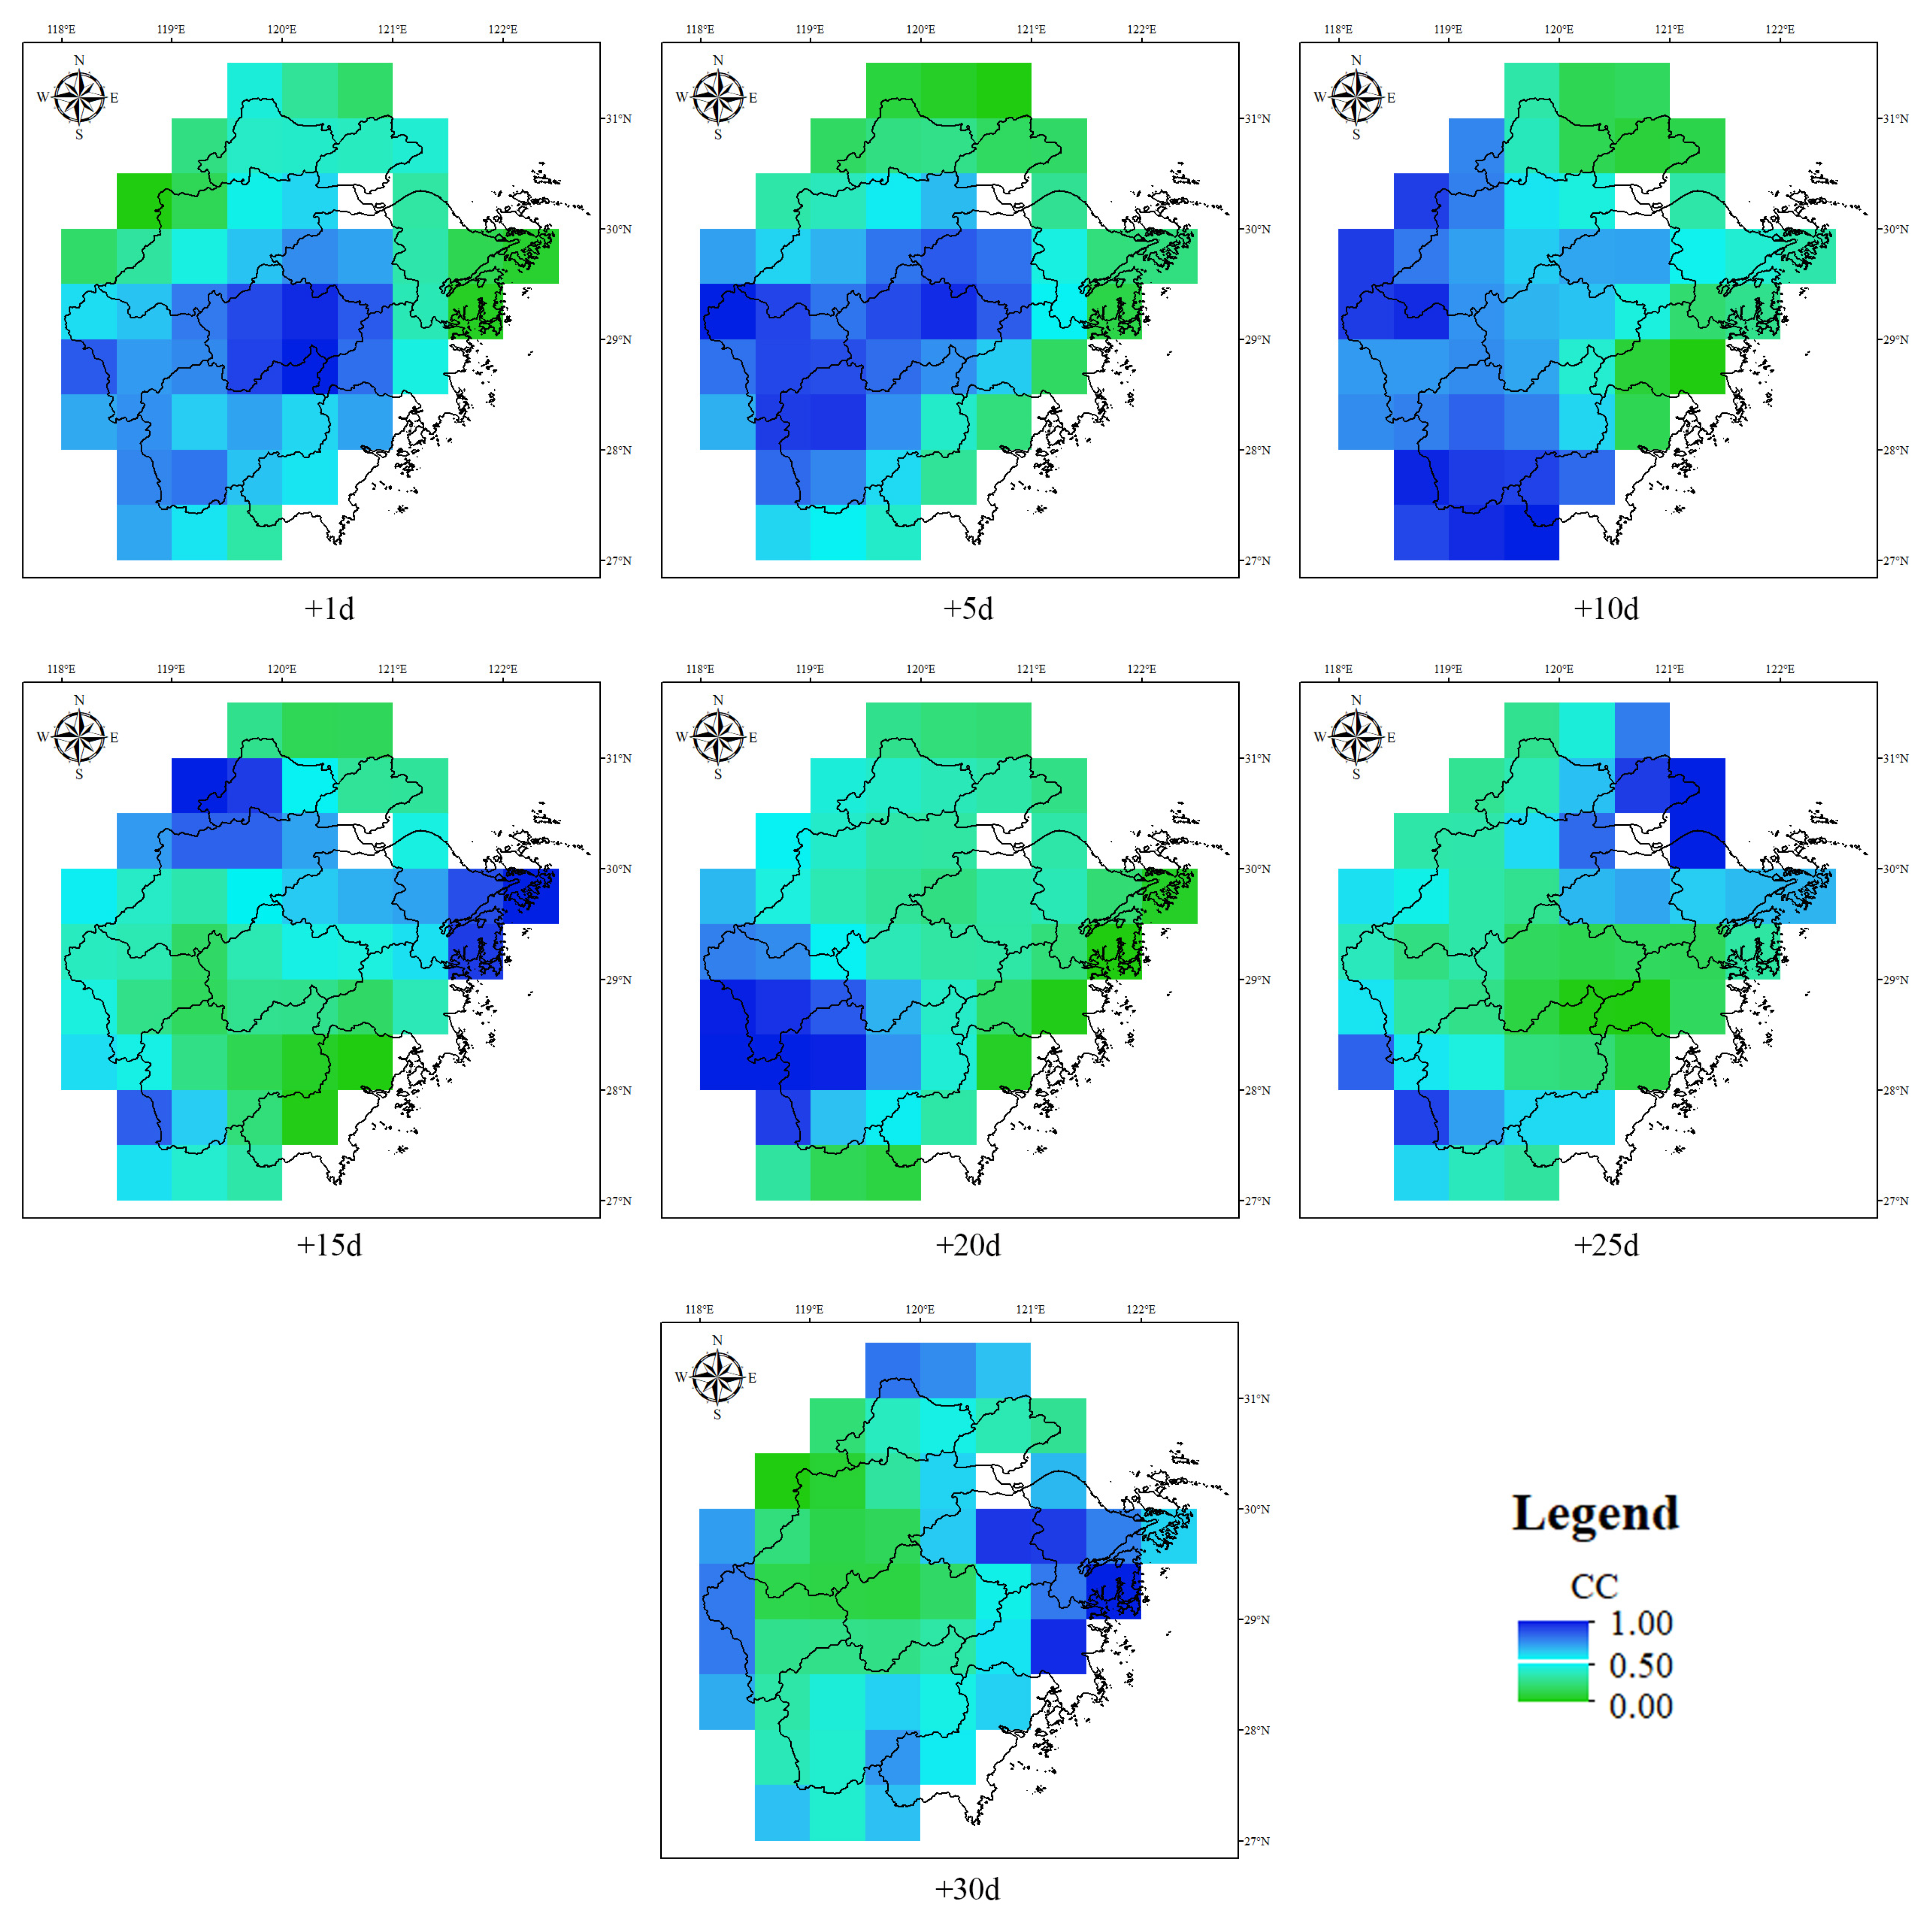
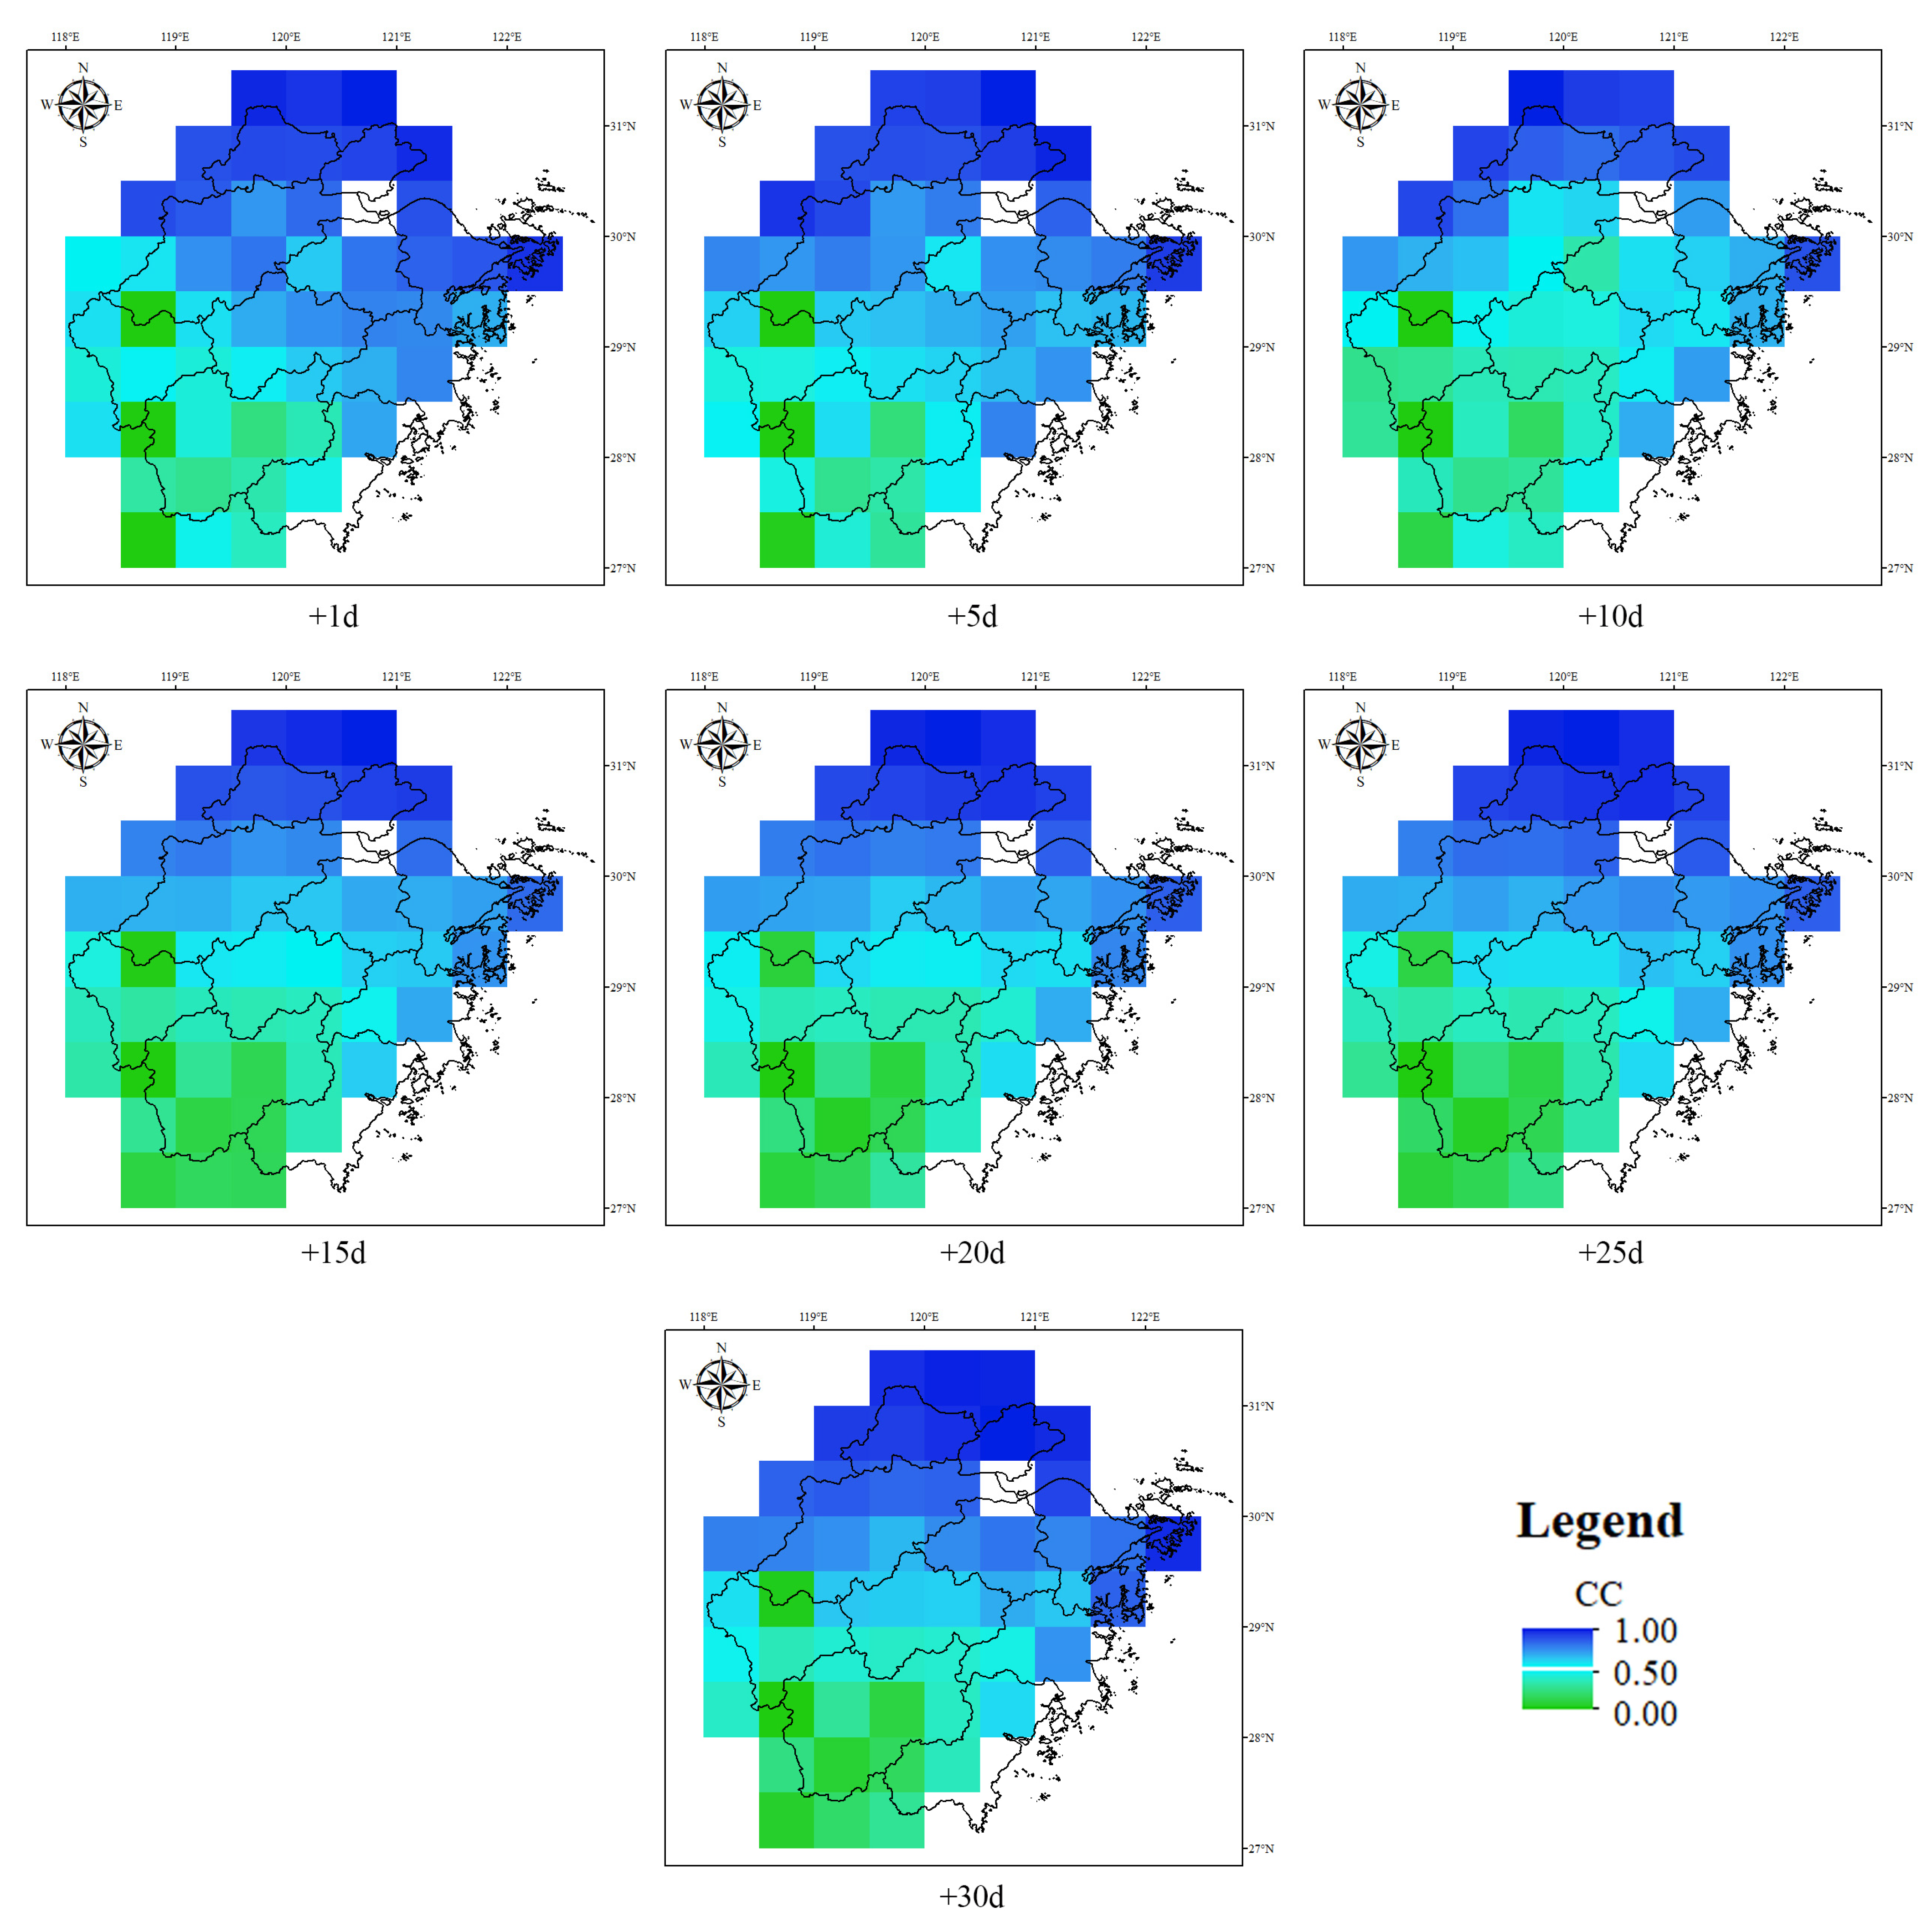
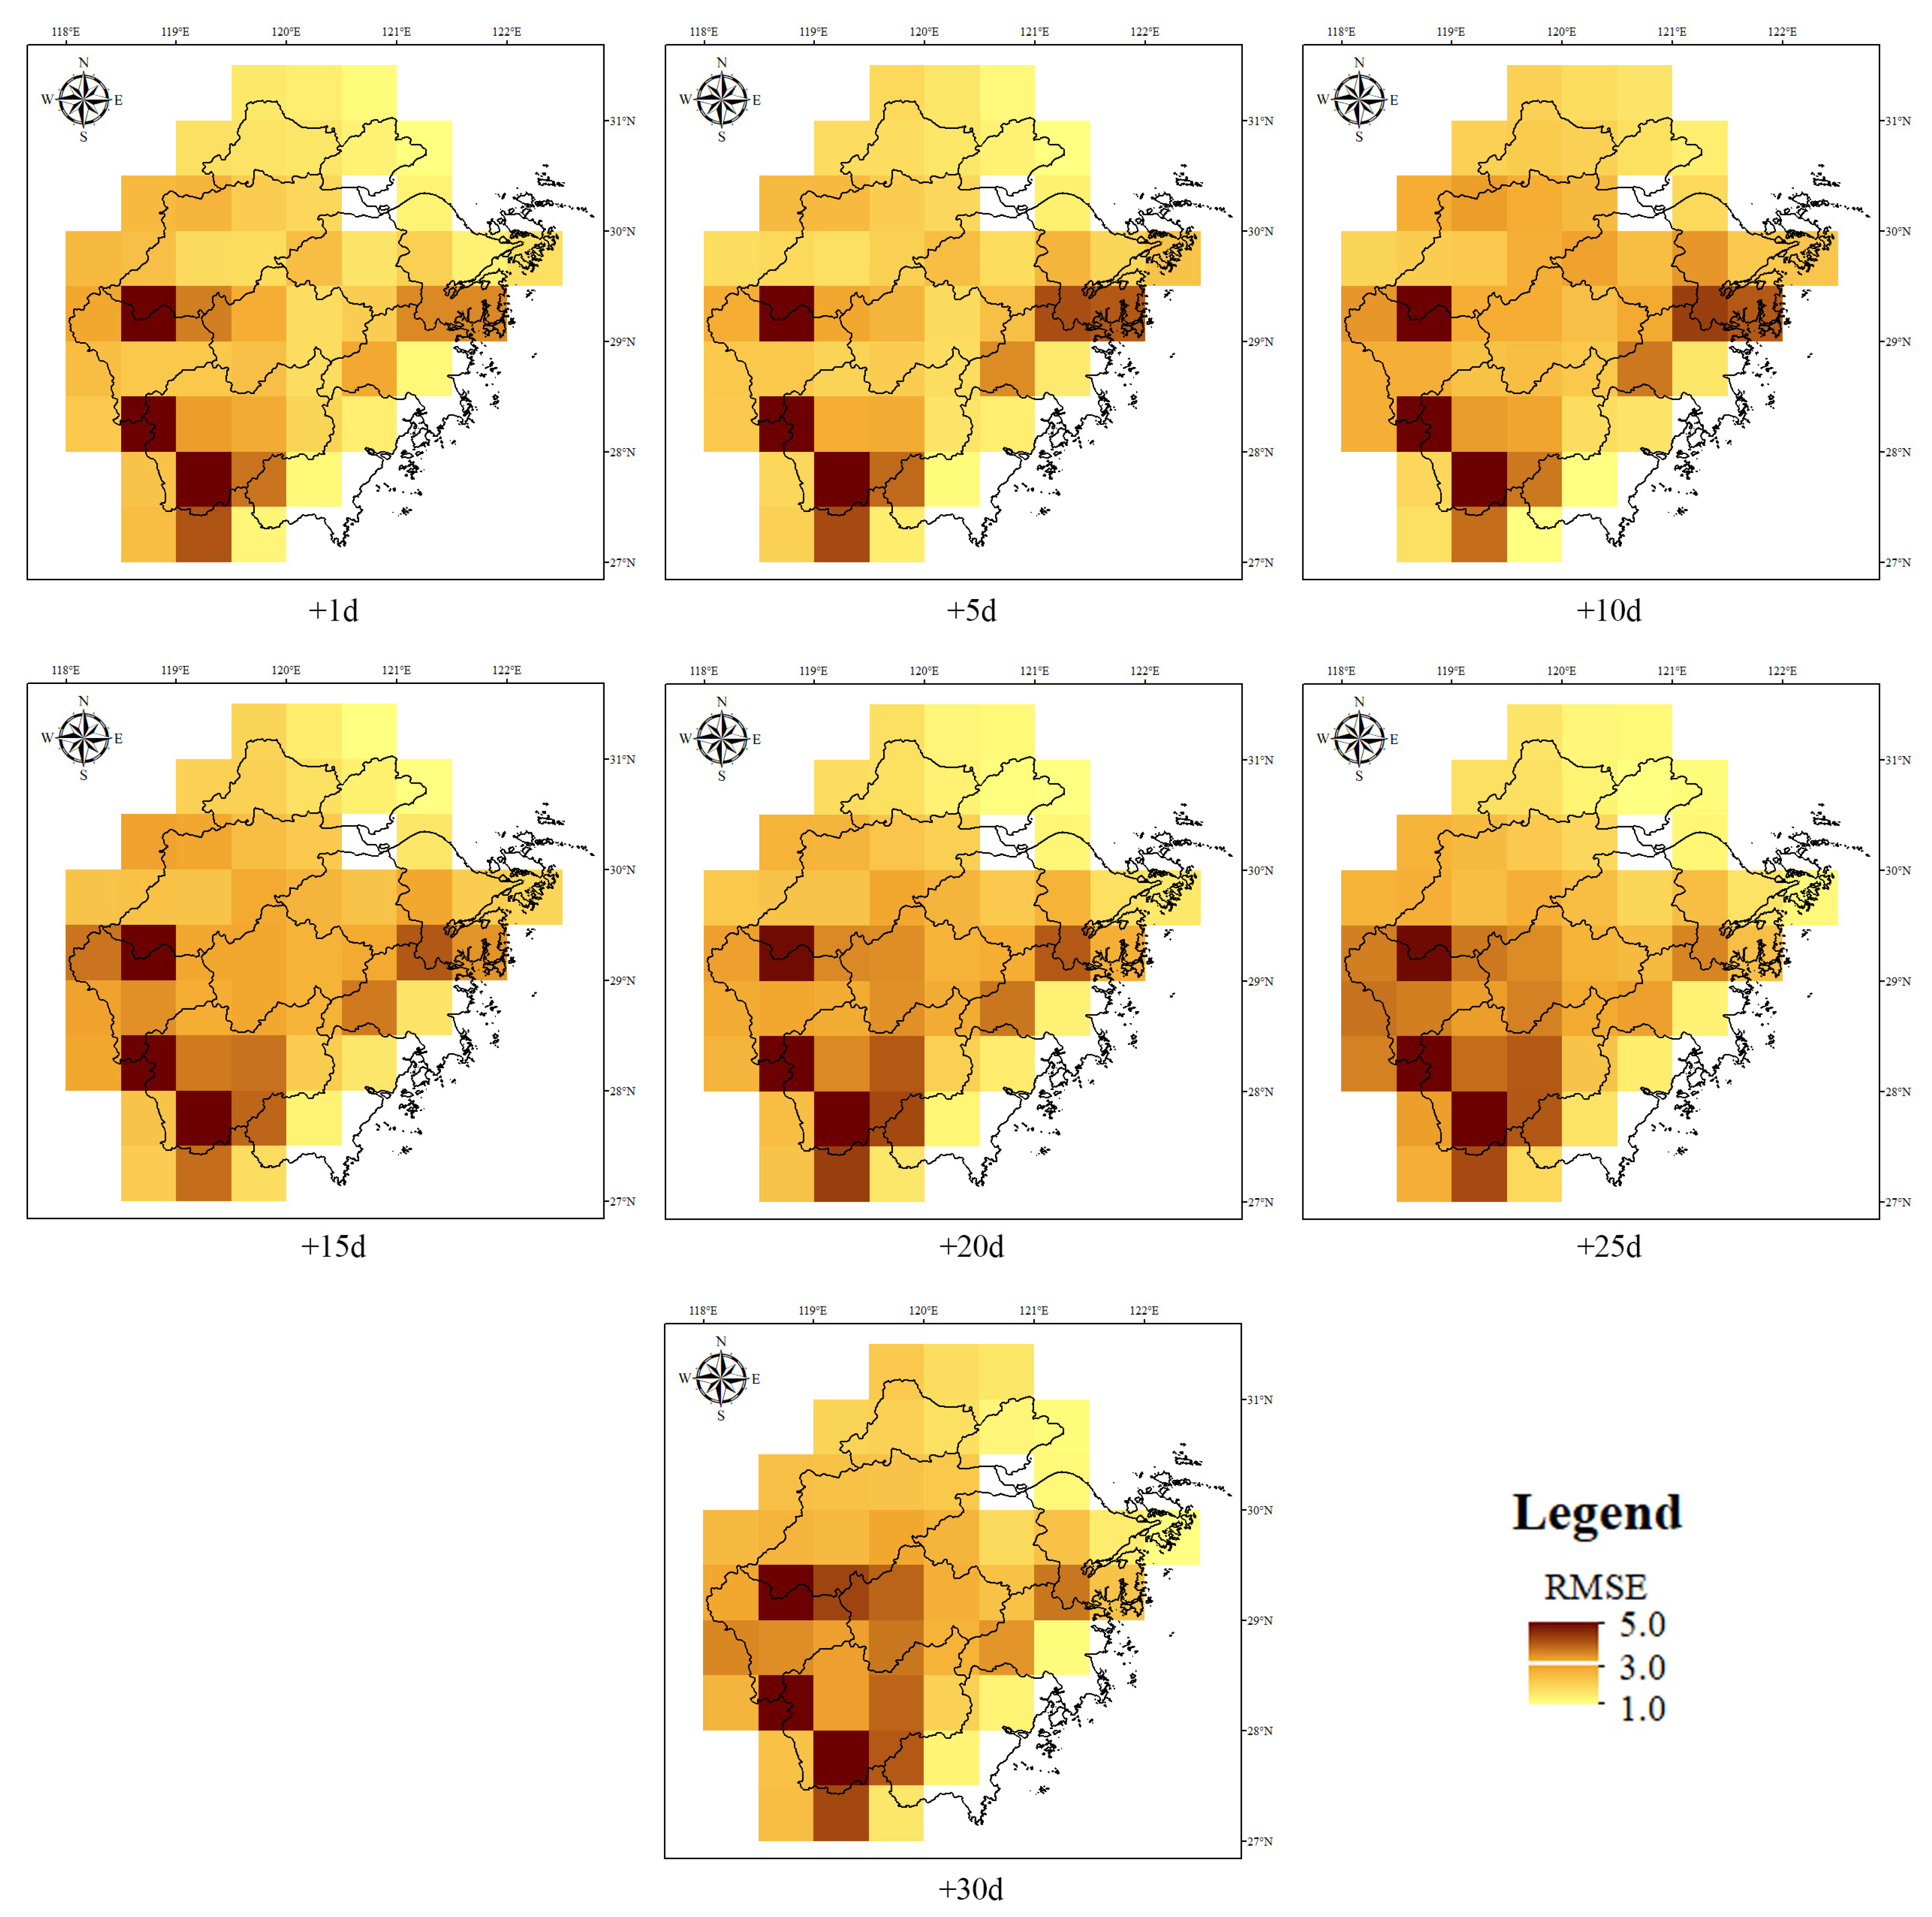
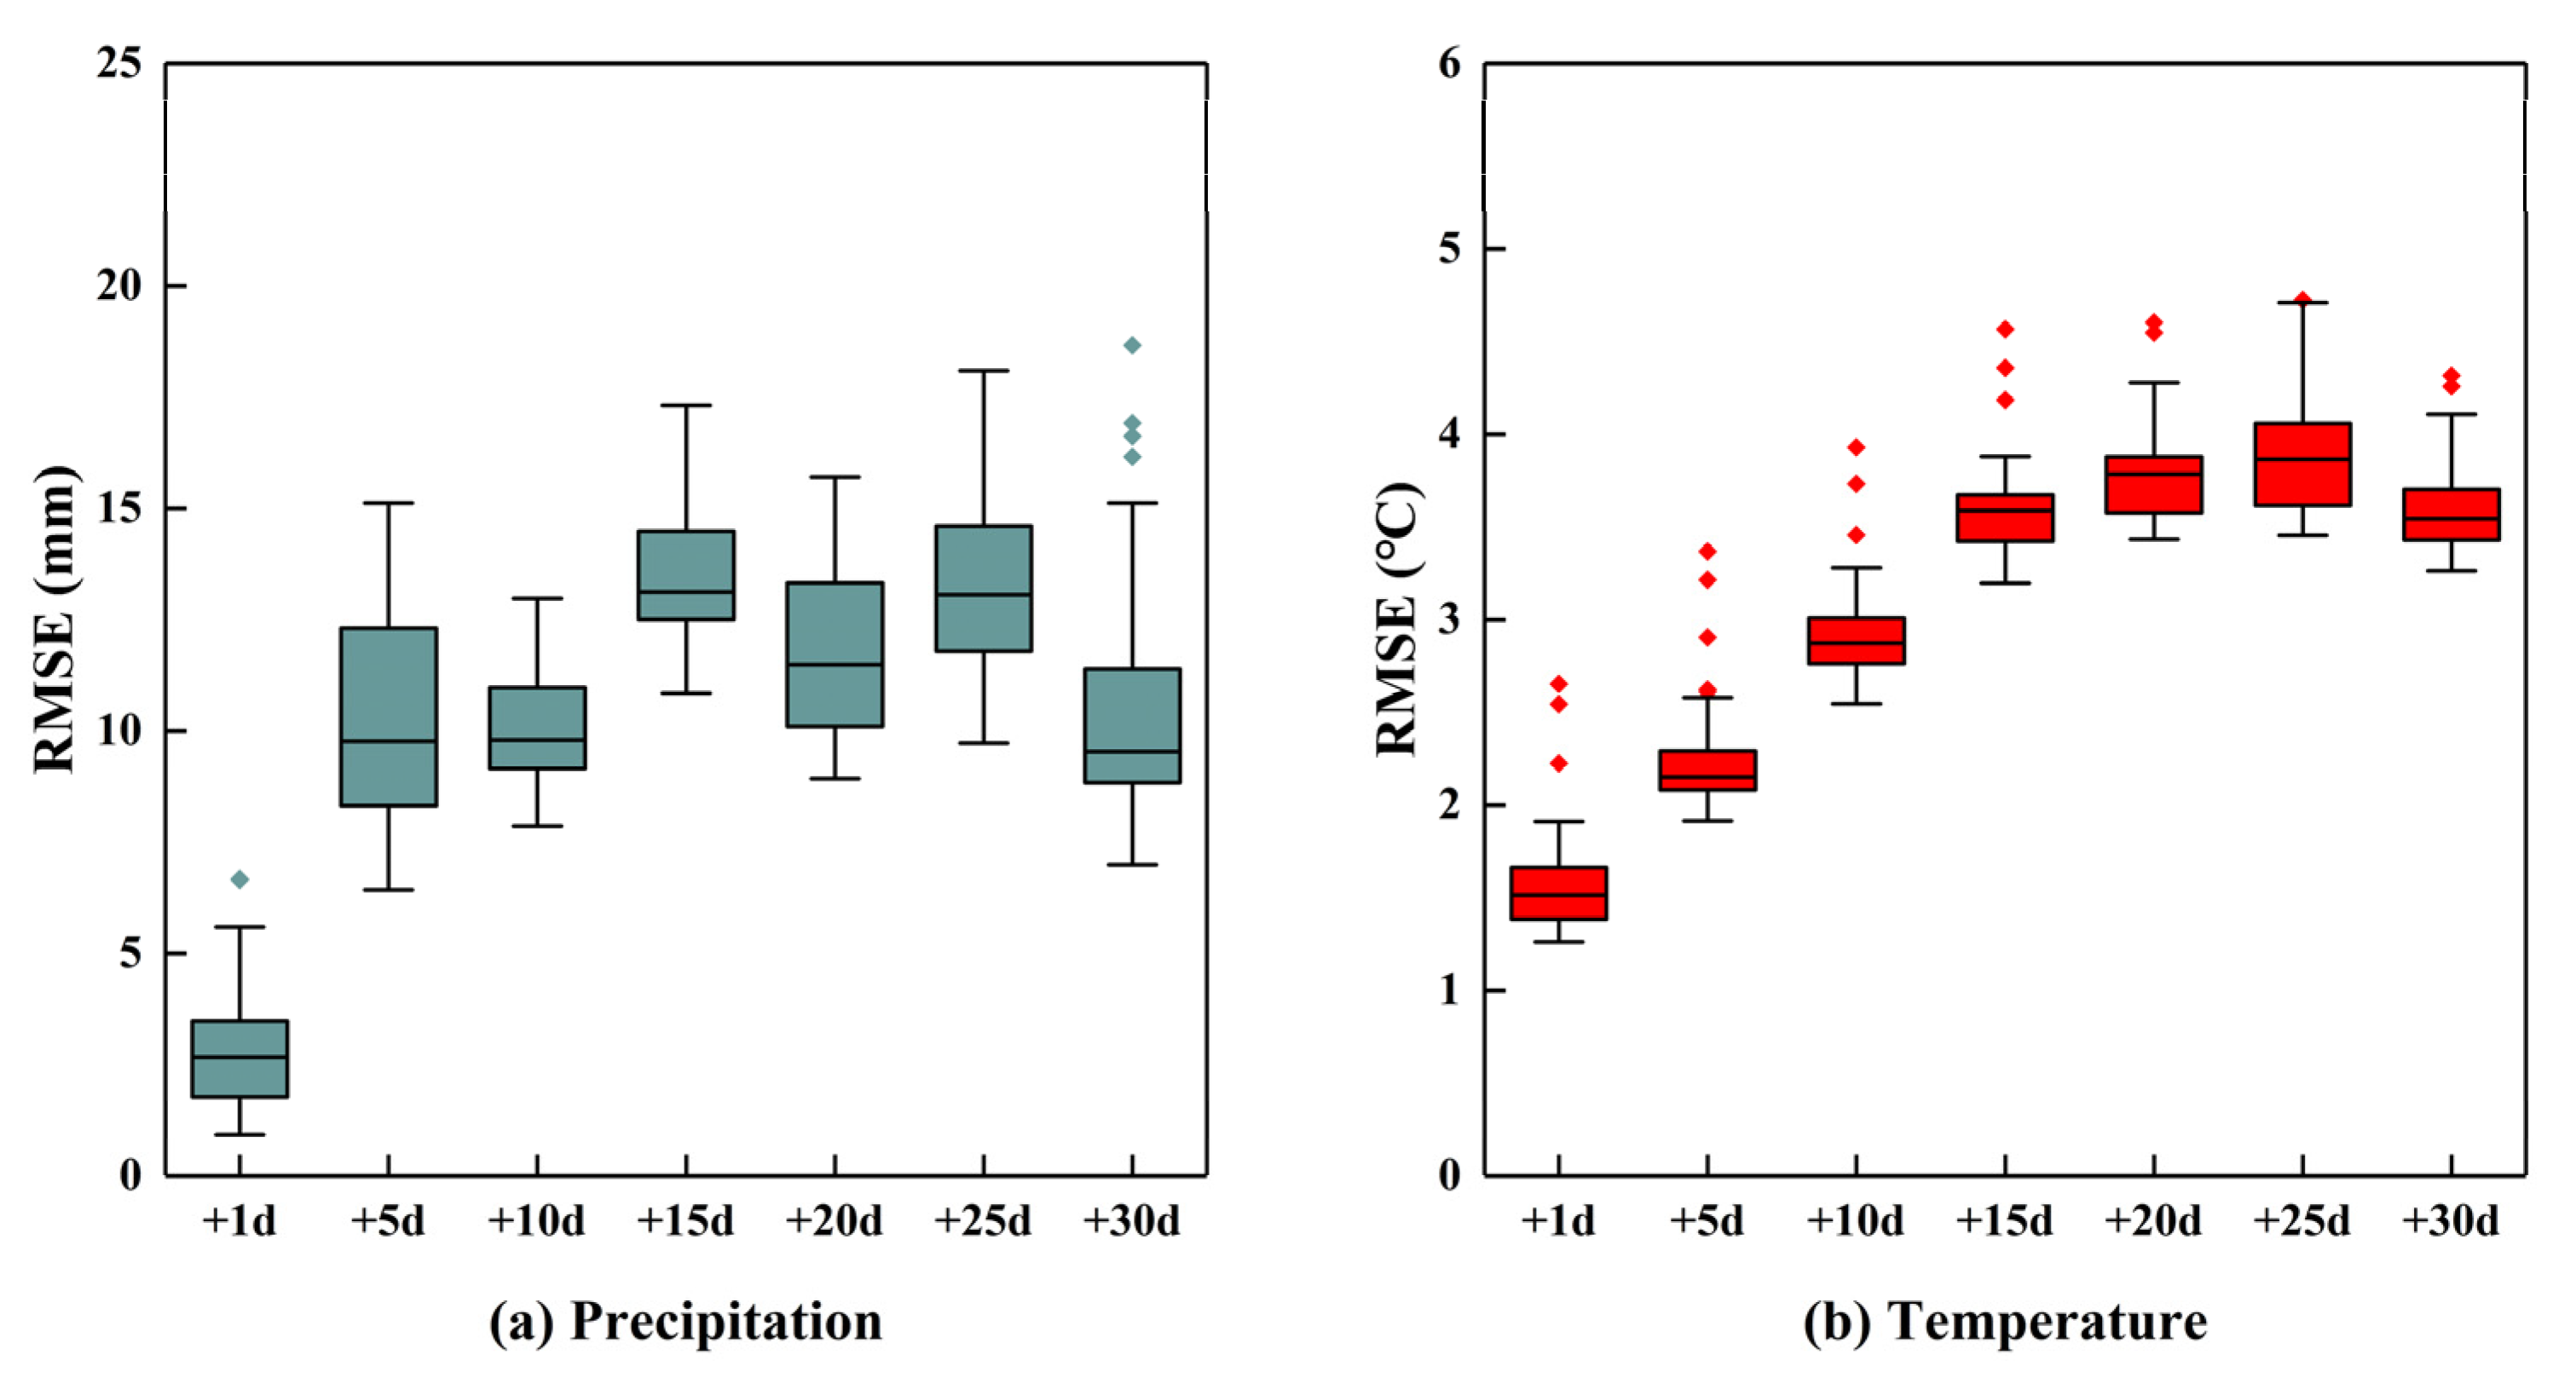
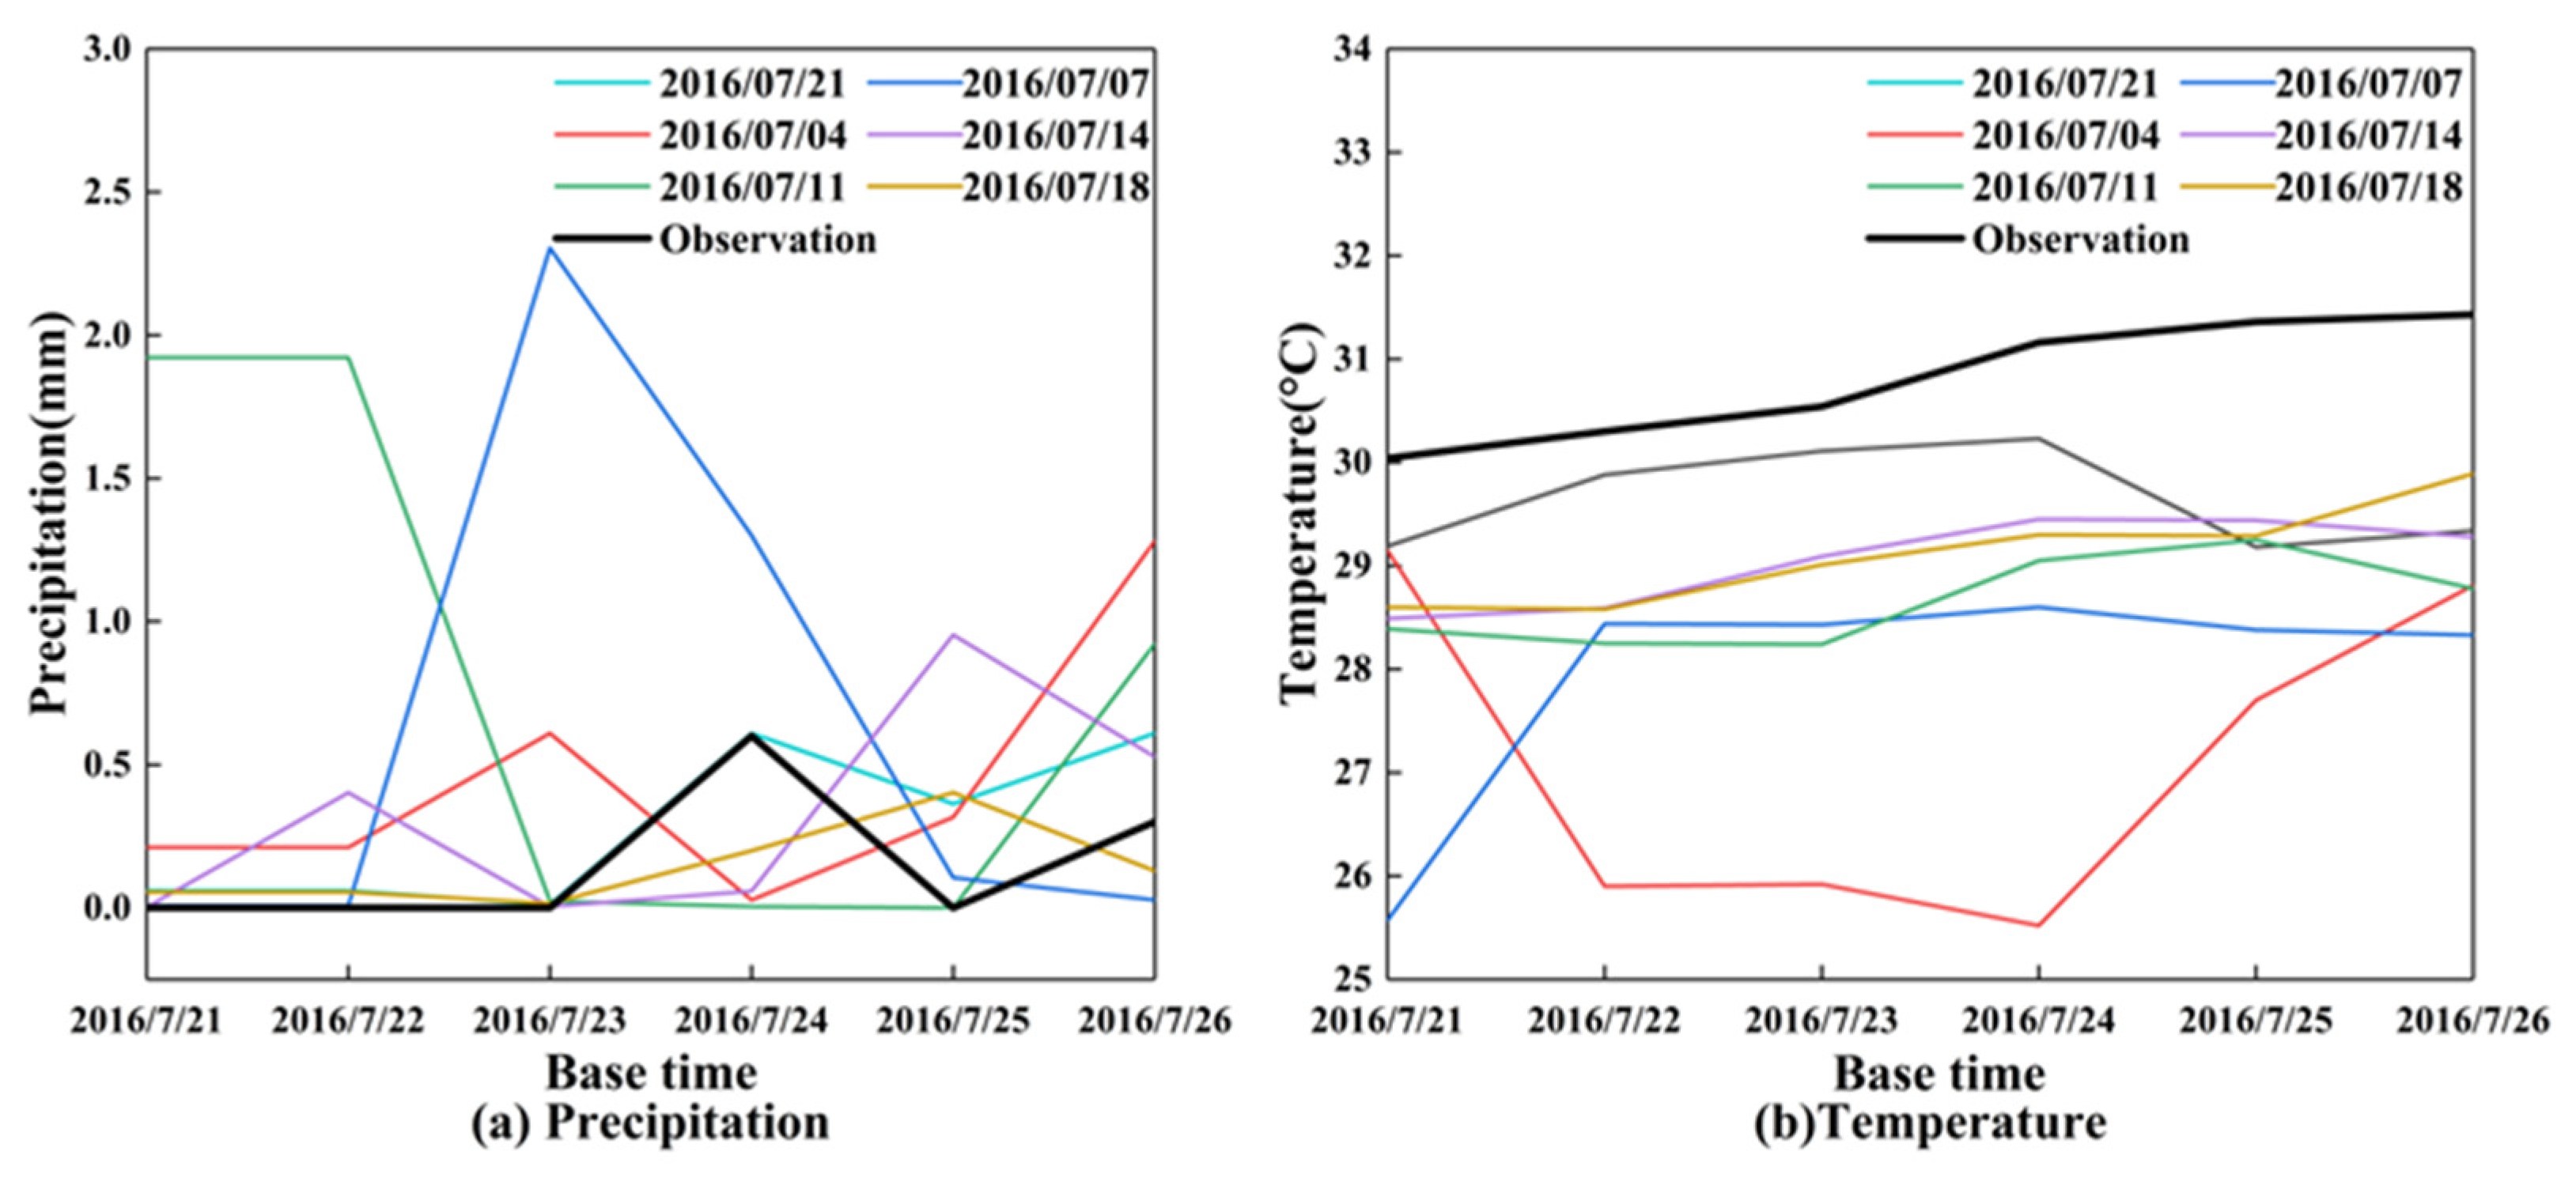
4.2. Performance Assessment of NWF
4.3. Evaluation of Probabilistic Flash Drought Forecasting
4.4. Limitations and Future Work
5. Conclusions
Author Contributions
Funding
Institutional Review Board Statement
Informed Consent Statement
Data Availability Statement
Conflicts of Interest
References
- Wilhite, D.A.; Glantz, M.H. Understanding the drought phenomenon: The role of definitions. Water Int. 1985, 10, 111–120. [Google Scholar] [CrossRef]
- Mishra, A.K.; Singh, V.P. A review of drought concepts. J. Hydrol. 2010, 391, 202–216. [Google Scholar] [CrossRef]
- Aghakouchak, A.; Farahmand, A.; Melton, F.S.; Teixeira, J.; Anderson, M.C.; Wardlow, B.D.; Hain, C.R. Remote sensing of drought: Progress, challenges and opportunities. Rev. Geophys. 2015, 52, 452–480. [Google Scholar] [CrossRef]
- Apurv, T.; Sivapalan, M.; Cai, X. Understanding the Role of Climate Characteristics in Drought Propagation. Water Resour. Res. 2017, 53, 9304–9329. [Google Scholar] [CrossRef]
- Dai, A. Drought under global warming: A review. Wiley Interdiscip. Rev. Clim. 2011, 2, 45–65. [Google Scholar] [CrossRef]
- Dai, A. Increasing drought under global warming in observations and models. Nat. Clim. Change 2013, 3, 52–58. [Google Scholar] [CrossRef]
- Crausbay, S.D.; Ramirez, A.R.; Carter, S.L.; Cross, M.S.; Hall, K.R.; Bathke, D.; Betancourt, J.; Colt, S.; Cravens, A.; Dalton, M.S.; et al. Defining ecological drought for the twenty-first century. B Am. Meteorol. Soc. 2017, 98, 2543–2550. [Google Scholar] [CrossRef]
- Vicente-Serrano, S.M.; Quiring, S.M.; Peña-Gallardo, M.; Yuan, S.S.; Domínguez-Castro, F. A review of environmental droughts: Increased risk under global warming? Earth-Science Rev. 2020, 201, P102953. [Google Scholar] [CrossRef]
- Oktin, J.A.; Svoboda, M.; Hunt, E.D.; Al, E. Flash droughts: A review and assessment of the challenges imposed by rapid-onset in the United States. Bull. Amer. Meteor. Soc. 2018, 18, 911–919. [Google Scholar]
- Zhang, M.; Yuan, X. Rapid reduction in ecosystem productivity caused by flash drought based on decade-long FLUXNET observations. Hydrol. Earth Syst. Sci. 2020, 24, 5579–5593. [Google Scholar] [CrossRef]
- Li, J.; Wang, Z.L.; WU, X.S.; Al, E. A new framework for tracking flash drought events in space and time. Catena 2020, 194, 104763. [Google Scholar] [CrossRef]
- Hoerlng, M.; Eischeid, J.; Kumar, A.; Al, E. Causes and predictability of the 2012 great Plains drought. Bull. Amer. Meteor. Soc. 2014, 95, 269–282. [Google Scholar] [CrossRef]
- Svoboda, M.; LeComte, D.; Hayes, M.; Heim, R.; Gleason, K.; Angel, J.; Rippey, B.; Tinker, R.; Palecki, M.; Stooksbury, D.; et al. The drought monitor. B. Am. Meteorol. Soc. 2002, 83, 1181–1190. [Google Scholar] [CrossRef]
- Liu, Y.; Zhu, Y.; Ren, L.L.; Otkin, J.A.; Hunt, E.D.; Yang, X.L.; Yuan, F.; Jiang, S.H. Flash droughts characterization over China: From a perspective of the rapid intensification rate. Sci. Total Environ. 2020, 704, 135373. [Google Scholar] [CrossRef]
- Mo, K.C.; Lettenmaier, D.P. Heat wave flash droughts in decline. Geophys. Res. Lett. 2015, 42, 2823–2829. [Google Scholar] [CrossRef]
- Mo, K.C.; Lettenmaier, D.P. Precipitation deficit flash droughts higher risk of flash drought over China. J. Hydrometeorol. 2016, 17, 1169–1184. [Google Scholar] [CrossRef]
- Ford, T.W.; Labosier, C.F. Meteorological conditions and associated with the onset of flash drought in the Eastern United States. Agr. Forest Meteorol. 2017, 247, 414–423. [Google Scholar] [CrossRef]
- Anderson, M.; Hain, C.; Otkin, J.; Zhan, X.; Mo, K.; Svoboda, M.; Wardlow, B.D.; Pimstein, A. An Intercomparison of Drought Indicators Based on Thermal Remote Sensing and NLDAS-2 Simulations with U.S. Drought Monitor Classifications. J. Hydrometeorol. 2013, 14, 1035–1056. [Google Scholar] [CrossRef]
- Noguera, I.; Domínguez-Castro, F.; Vicente-Serrano, S.M. Characteristics and trends of flash droughts in Spain, 1961–2018. Ann. N. Y. Acad. Sci. 2019, 1472, 155–172. [Google Scholar] [CrossRef] [PubMed]
- Liu, Y.; Zhu, Y.; Ren, L.L.; Al, E. Two different methods for flash drought identification: Comparison of their strengths and limitations. J. Hydrometeorol. 2020, 21, 691–704. [Google Scholar] [CrossRef]
- Otkin, J.A.; Anderson, M.C.; Hain, C.; Al, E. Assessing the evolution of soil moisture and vegetation conditions during 2012 United States flash drought. Agr. Forest Meteorol. 2016, 218, 230–242. [Google Scholar] [CrossRef]
- Zhang, L.; Liu, Y.; Ren, L.; Teuling, A.J.; Zhu, Y.; Wei, L.; Zhang, L.; Jiang, S.; Yang, X.; Fang, X.; et al. Analysis of flash droughts in China using machine learning. Hydrol. Earth Syst. Sci. 2022, 26, 3241–3261. [Google Scholar] [CrossRef]
- Kam, J.; Sheffield, J.; Yuan, X.; Wood, E.F. Did a skillful prediction of sea surface temperatures help or hinder forecasting of the 2012 Midwestern US drought? Environ. Res. Lett. 2014, 9, 34005. [Google Scholar] [CrossRef]
- Hao, Z.C.; Singh, V.P.; Xia, Y.L. Seasonal drought prediction: Advances, challenges, and future prospects. Rev. Geophys. 2018, 56, 108–141. [Google Scholar] [CrossRef]
- Paimazumder, D.; Done, J.M. Potential predictability sources of the 2012 U.S. drought in observations and a regional model ensemble. J. Geophys. Res. Atmos. 2016, 121, 12581–12592. [Google Scholar] [CrossRef]
- Pendergrass, A.G.; Meehl, G.A.; Pulwarty, R.; Hobbins, M.; Hoell, A.; AghaKouchak, A.; Bonfils, C.; Gallant, A.; Hoerling, M.; Hoffmann, D.; et al. Flash droughts present a new challenge for subseasonal-to-seasonal prediction. Nat. Clim. Change 2020, 10, 191–199. [Google Scholar] [CrossRef]
- Teuling, A.J. A hot future for European droughts. Nat. Clim. Change 2018, 8, 360–369. [Google Scholar] [CrossRef]
- Wang, L.; Yuan, X.; Xie, Z.; Wu, P.; Li, Y. Increasing flash droughts over China during the recent global warming hiatus. Sci. Rep. 2016, 6, 30571. [Google Scholar] [CrossRef]
- Hobbins, M.T.; Andrew, W.; Mcevoy, D.J.; Huntington, J.L.; Charles, M.; Martha, A.; Christopher, H. The Evaporative Demand Drought Index. Part I: Linking Drought Evolution to Variations in Evaporative Demand. J. Hydrometeorol. 2016, 17, 1745–1761. [Google Scholar] [CrossRef]
- Bauer, P.; Thorpe, A.; Brunet, G. The quiet revolution of numerical weather prediction. Nature 2015, 525, 47–55. [Google Scholar] [CrossRef]
- Su, X.; Yuan, H.; Zhu, Y.; Luo, Y.; Wang, Y. Evaluation of TIGGE ensemble predictions of Northern Hemisphere summer precipitation during 2008–2012. J. Geophys. Res. Atmos. 2014, 119, 7292–7310. [Google Scholar] [CrossRef]
- Li, W.; Duan, Q.; Miao, C.; Ye, A.; Gong, W.; Di, Z. A review on statistical postprocessing methods for hydrometeorological ensemble forecasting. Wiley Interdiscip. Rev. Water 2017, 4, e1246. [Google Scholar] [CrossRef]
- Jha, S.K.; Shrestha, D.L.; Stadnyk, T.A.; Coulibaly, P. Evaluation of ensemble precipitation forecasts generated through post-processing in a Canadian catchment. Hydrol. Earth Syst. Sci. 2018, 22, 1957–1969. [Google Scholar] [CrossRef]
- Cuo, L.; Pagano, T.C.; Wang, Q.J. A Review of Quantitative Precipitation Forecasts and Their Use in Short- to Medium-Range Streamflow Forecasting. J. Hydrometeorol. 2011, 12, 713–728. [Google Scholar] [CrossRef]
- Zhang, Y.Q.; You, Q.L.; Chen, C.C.; Li, X. FLash droughts in a typical humid and subtropical basin: A case study in the Gan River Basin, China. J. Hydrol. 2017, 551, 162–176. [Google Scholar] [CrossRef]
- Osman, M.; Zaitchik, B.F.; Badr, H.S.; Christian, J.I.; Tadesse, T.; Otkin, J.A.; Anderson, M.C. Flash drought onset over the contiguous United States: Sensitivity of inventories and trends to quantitative definitions. Hydrol. Earth Syst. Sci. 2021, 25, 565–581. [Google Scholar] [CrossRef]
- Wu, L.; Seo, D.; Demargne, J.; Brown, J.D.; Cong, S.; Schaake, J. Generation of ensemble precipitation forecast from single-valued quantitative precipitation forecast for hydrologic ensemble prediction. J. Hydrol. 2011, 399, 281–298. [Google Scholar] [CrossRef]
- Cai, C.; Wang, J.; Li, Z. Assessment and modelling of uncertainty in precipitation forecasts from TIGGE using fuzzy probability and Bayesian theory. J. Hydrol. 2019, 577, 123995. [Google Scholar] [CrossRef]
- Ma, F.; Luo, L.; Ye, A.; Duan, Q. Drought characteristics and propagation in the semi-arid Heihe River basin in northwestern China. J. Hydrometeorol. 2019, 20, 59–77. [Google Scholar] [CrossRef]
- Yuan, X.; Wang, L.; Wu, P.; Ji, P. Anthropogenic shift towards higher risk of flash drought over China. Nat. Commun. 2019, 10, 4661. [Google Scholar] [CrossRef]
- Arnal, L.; Cloke, H.L.; Stephens, E.; Wetterhall, F.; Prudhomme, C.; Neumann, J.; Krzeminski, B.; Pappenberger, F. Skilful seasonal forecasts of streamflow over Europe? Hydrol. Earth Syst. Sci. 2018, 22, 2057–2072. [Google Scholar] [CrossRef]
- Yun, W.T. WWRP WWRP/WCRP Sub-Seasonal to Seasonal Prediction Project (S2S) Phase II Proposal; S2S News Letter; World Meteorological Organizatio: Geneva, Switzerland, 30 March 2018. [Google Scholar]
- Bougeault, P.; Toth, Z.; Bishop, C.; Brown, B.; Burridge, D.; Chen, D.H.; Ebert, B.; Fuentes, M.; Hamill, T.M.; Mylne, K.; et al. The THORPEX Interactive Grand Global Ensemble. Bull. Am. Meteorol. Soc. 2010, 91, 1059–1072. [Google Scholar] [CrossRef]
- Yuan, X.; Wood, E.F. Multimodel seasonal forecasting of global drought onset. Geophys. Res. Lett. 2013, 40, 4900–4905. [Google Scholar] [CrossRef]
- Seager, R.; Hoerling, M. Atmosphere and ocean origins of North American droughts. J. Climate 2014, 27, 4581–4606. [Google Scholar] [CrossRef]
- Schubert, S.D.; Stewart, R.E.; Wang, H.; Berbery, E.H.; Cai, W.; Hoerling, M.P.; Kanikicharla, K.K.; Koster, R.D.; Lyon, B.; Mariotti, A.; et al. Global Meteorological Drought: A Synthesis of Current Understanding with a Focus on SST Drivers of Precipitation Deficits. J. Climate 2016, 29, 3989–4019. [Google Scholar] [CrossRef]
- Cai, C.; Wang, J.; Li, Z. Improving TIGGE Precipitation Forecasts Using an SVR Ensemble Approach in the Huaihe River Basin. Adv. Meteorol. 2018, 2018, 1–15. [Google Scholar] [CrossRef]
- Cai, C.; Wang, J.; Li, Z.; Shen, X.; Wen, J.; Wang, H.; Wu, C. A New Hybrid Framework for Error Correction and Uncertainty Analysis of Precipitation Forecasts with Combined Postprocessors. Water 2022, 14, 3072. [Google Scholar] [CrossRef]


| Base Time | RMSE | |
|---|---|---|
| Precipitation (mm) | Temperature (°C) | |
| 04 July | 0.60 | 1.44 |
| 07 July | 1.09 | 4.31 |
| 11 July | 0.94 | 2.57 |
| 14 July | 0.53 | 2.25 |
| 18 July | 0.27 | 1.80 |
| 21 July | 0.22 | 1.76 |
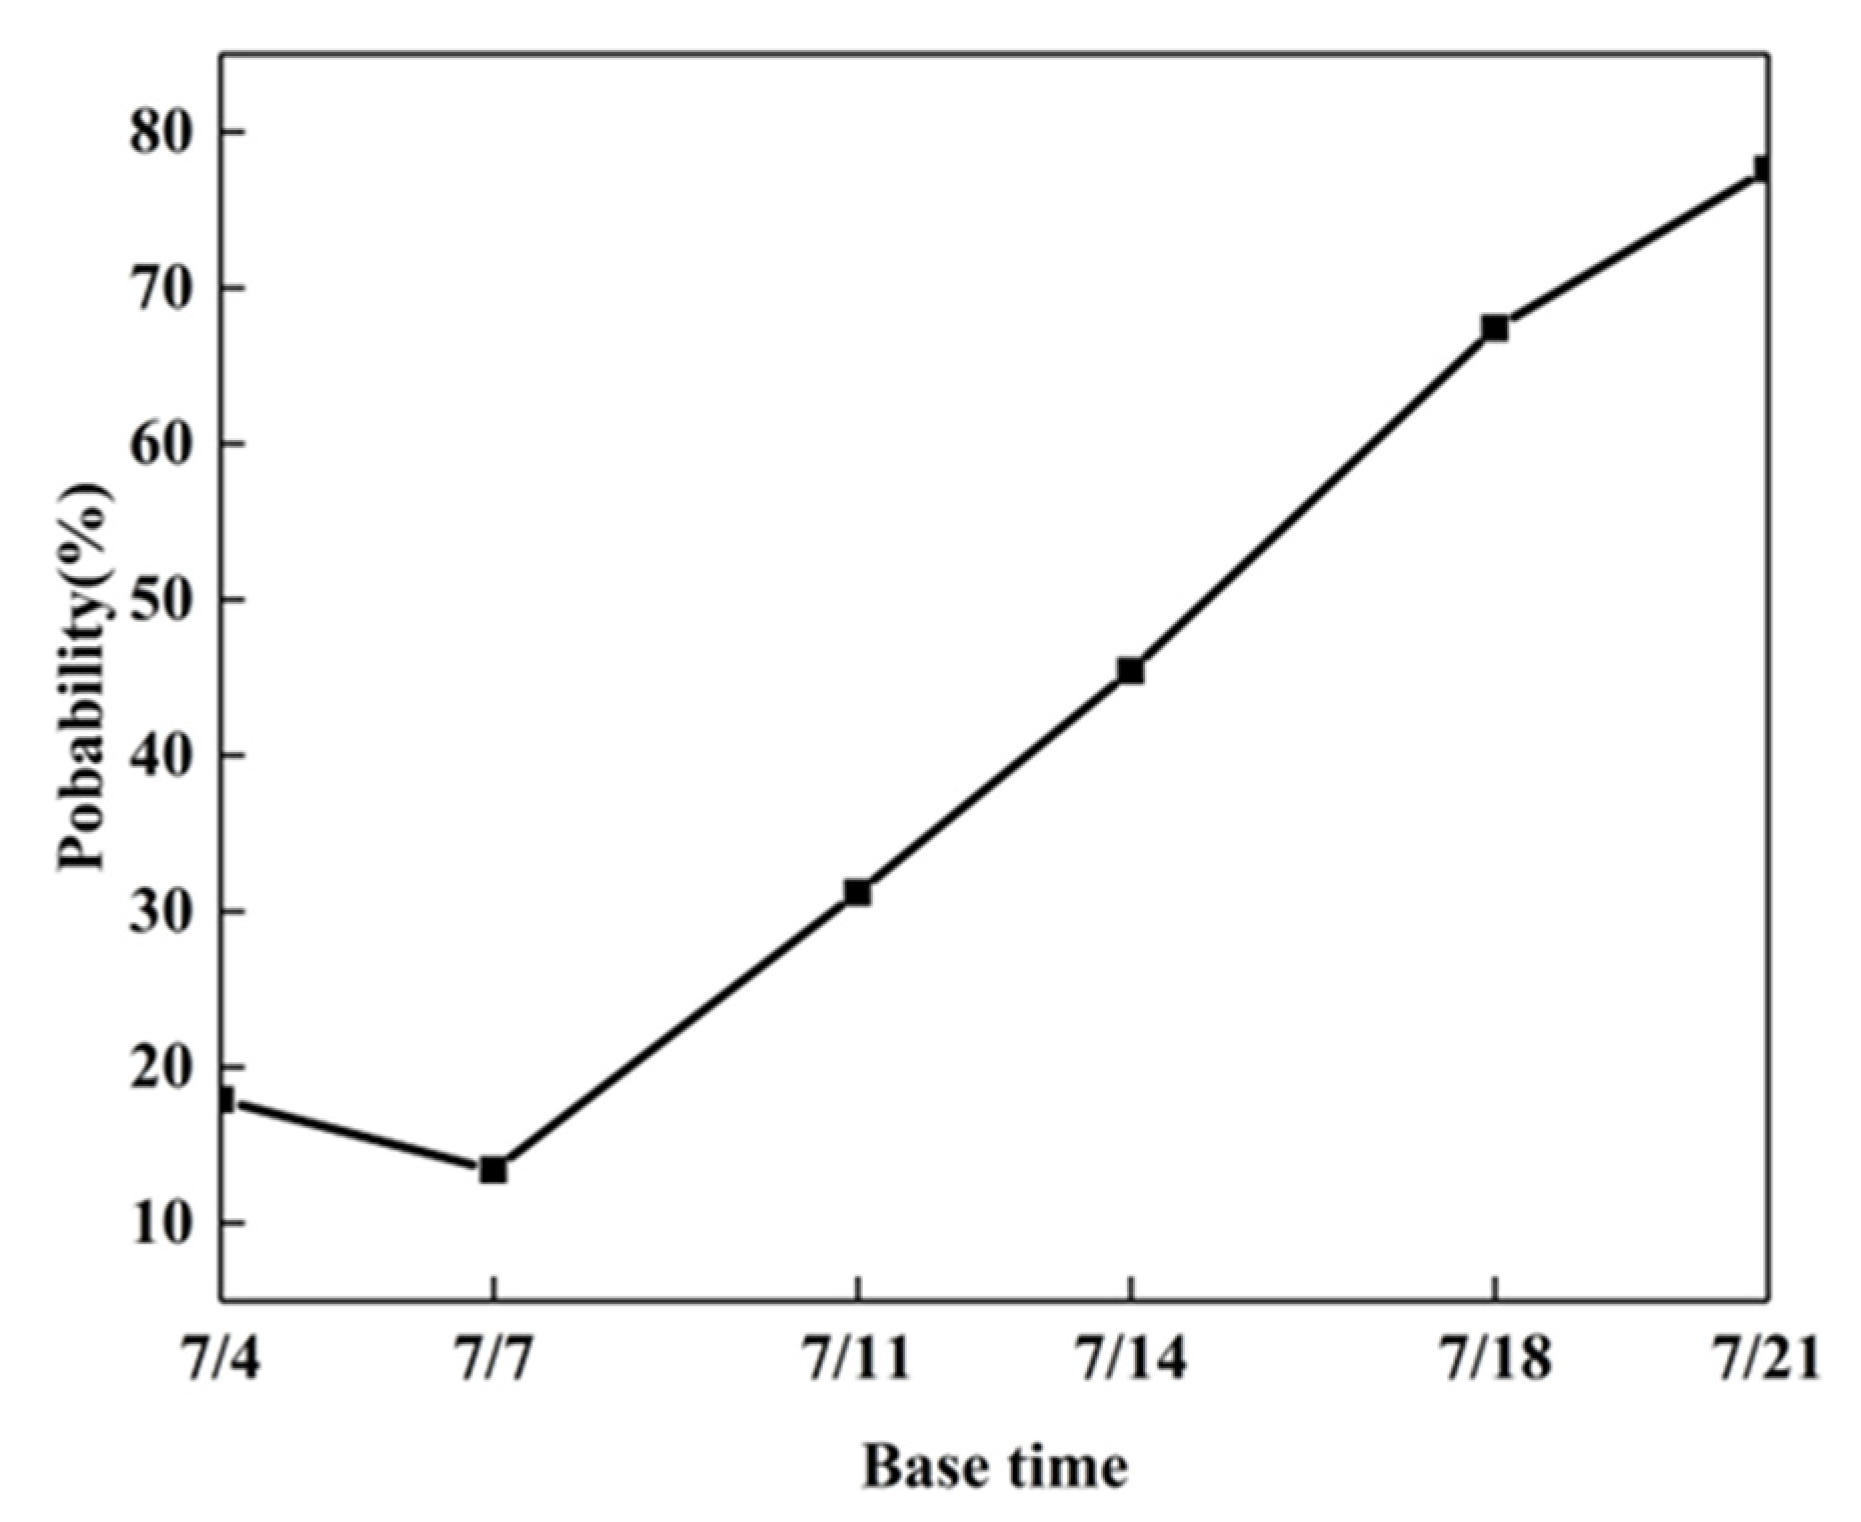
| Base Time | Probability of Flash Drought (%) | |
|---|---|---|
| Probabilistic Forecast | Raw NWF | |
| 04 July | 17.9 | 0.0 |
| 07 July | 13.4 | 0.0 |
| 11 July | 31.2 | 0.0 |
| 14 July | 45.4 | 0.0 |
| 18 July | 67.4 | 100.0 |
| 21 July | 77.6 | 100.0 |
Disclaimer/Publisher’s Note: The statements, opinions and data contained in all publications are solely those of the individual author(s) and contributor(s) and not of MDPI and/or the editor(s). MDPI and/or the editor(s) disclaim responsibility for any injury to people or property resulting from any ideas, methods, instructions or products referred to in the content. |
© 2023 by the authors. Licensee MDPI, Basel, Switzerland. This article is an open access article distributed under the terms and conditions of the Creative Commons Attribution (CC BY) license (https://creativecommons.org/licenses/by/4.0/).
Share and Cite
Wen, J.; Hua, Y.; Cai, C.; Wang, S.; Wang, H.; Zhou, X.; Huang, J.; Wang, J. Probabilistic Forecast and Risk Assessment of Flash Droughts Based on Numeric Weather Forecast: A Case Study in Zhejiang, China. Sustainability 2023, 15, 3865. https://doi.org/10.3390/su15043865
Wen J, Hua Y, Cai C, Wang S, Wang H, Zhou X, Huang J, Wang J. Probabilistic Forecast and Risk Assessment of Flash Droughts Based on Numeric Weather Forecast: A Case Study in Zhejiang, China. Sustainability. 2023; 15(4):3865. https://doi.org/10.3390/su15043865
Chicago/Turabian StyleWen, Jinhua, Yian Hua, Chenkai Cai, Shiwu Wang, Helong Wang, Xinyan Zhou, Jian Huang, and Jianqun Wang. 2023. "Probabilistic Forecast and Risk Assessment of Flash Droughts Based on Numeric Weather Forecast: A Case Study in Zhejiang, China" Sustainability 15, no. 4: 3865. https://doi.org/10.3390/su15043865
APA StyleWen, J., Hua, Y., Cai, C., Wang, S., Wang, H., Zhou, X., Huang, J., & Wang, J. (2023). Probabilistic Forecast and Risk Assessment of Flash Droughts Based on Numeric Weather Forecast: A Case Study in Zhejiang, China. Sustainability, 15(4), 3865. https://doi.org/10.3390/su15043865