Seismic Performance of an Exterior Joint between a Square Steel Tube Column and an H-Shape Steel Beam


Abstract
:1. Introduction
2. Test Overview
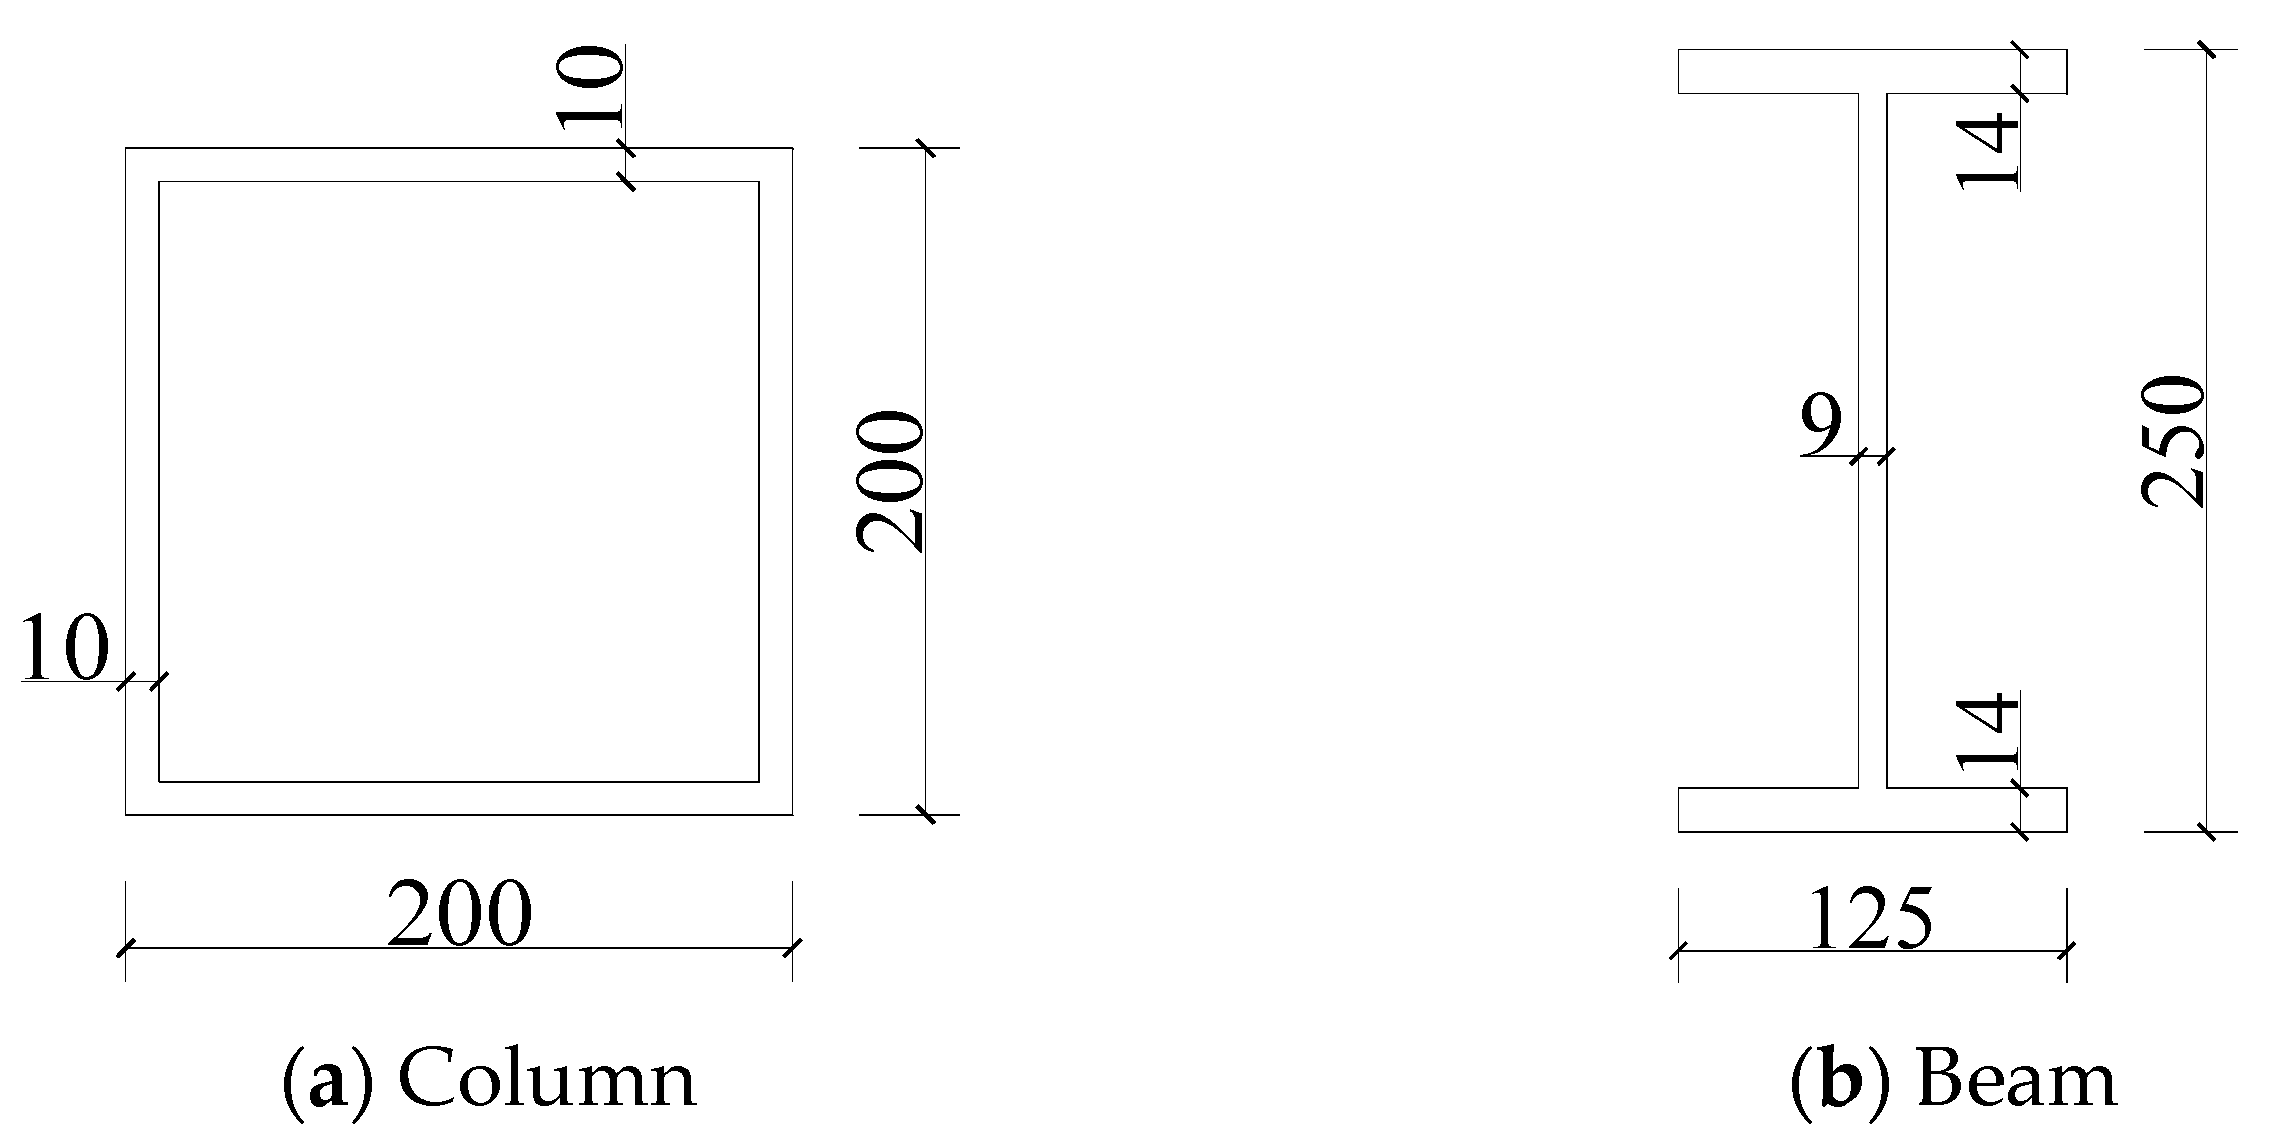
2.1. Component Design
2.2. Material Properties Test
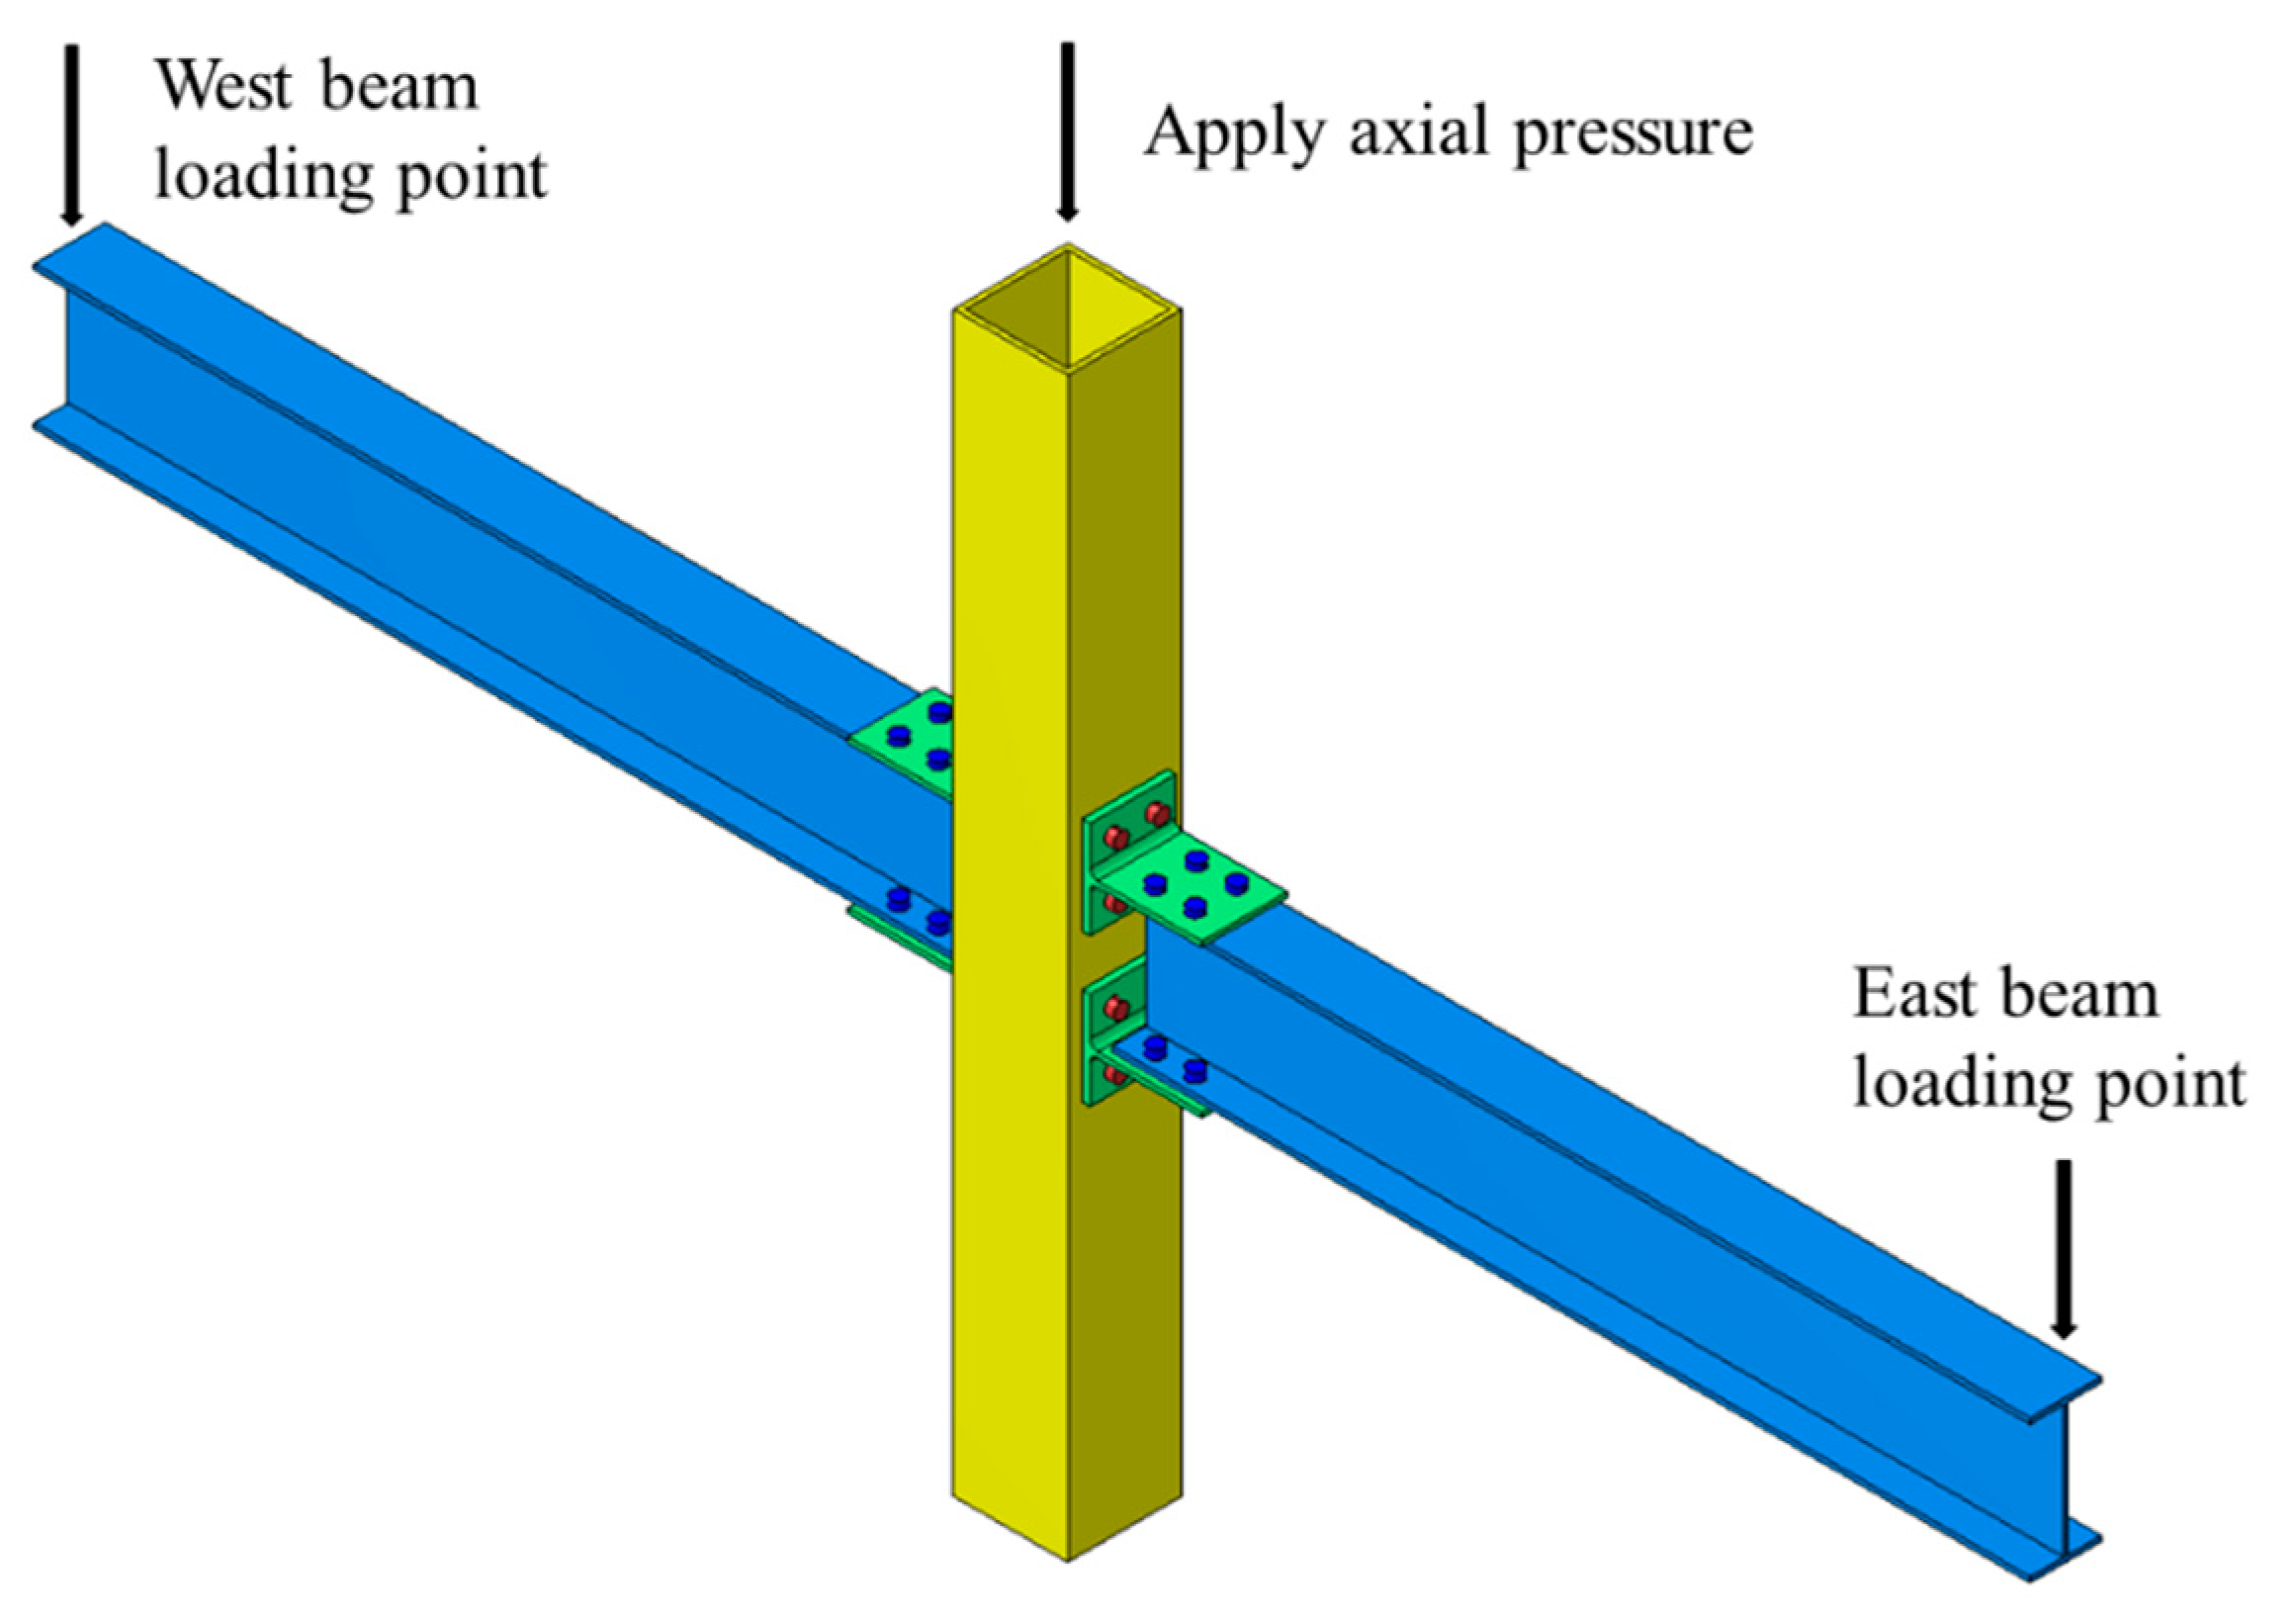
2.3. Test Device
3. Test Scheme
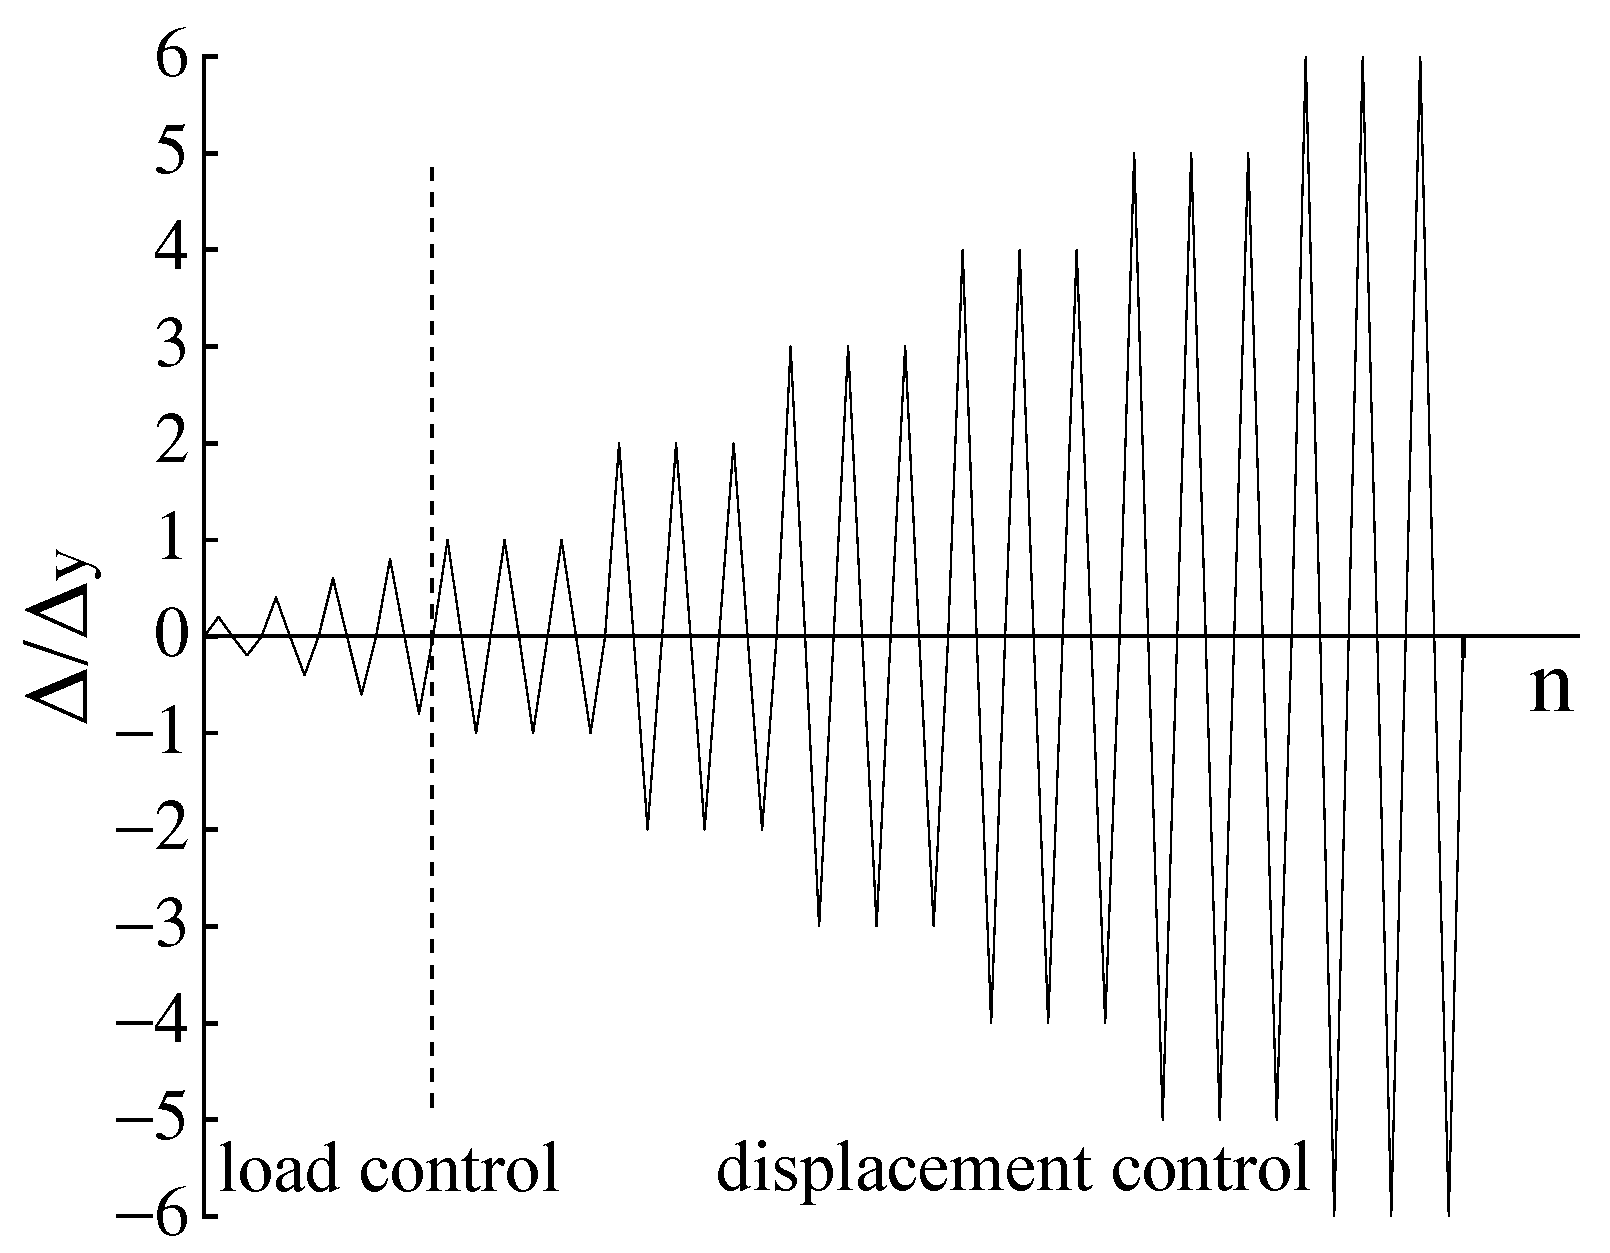
3.1. Loading System
3.2. Measurement Solution
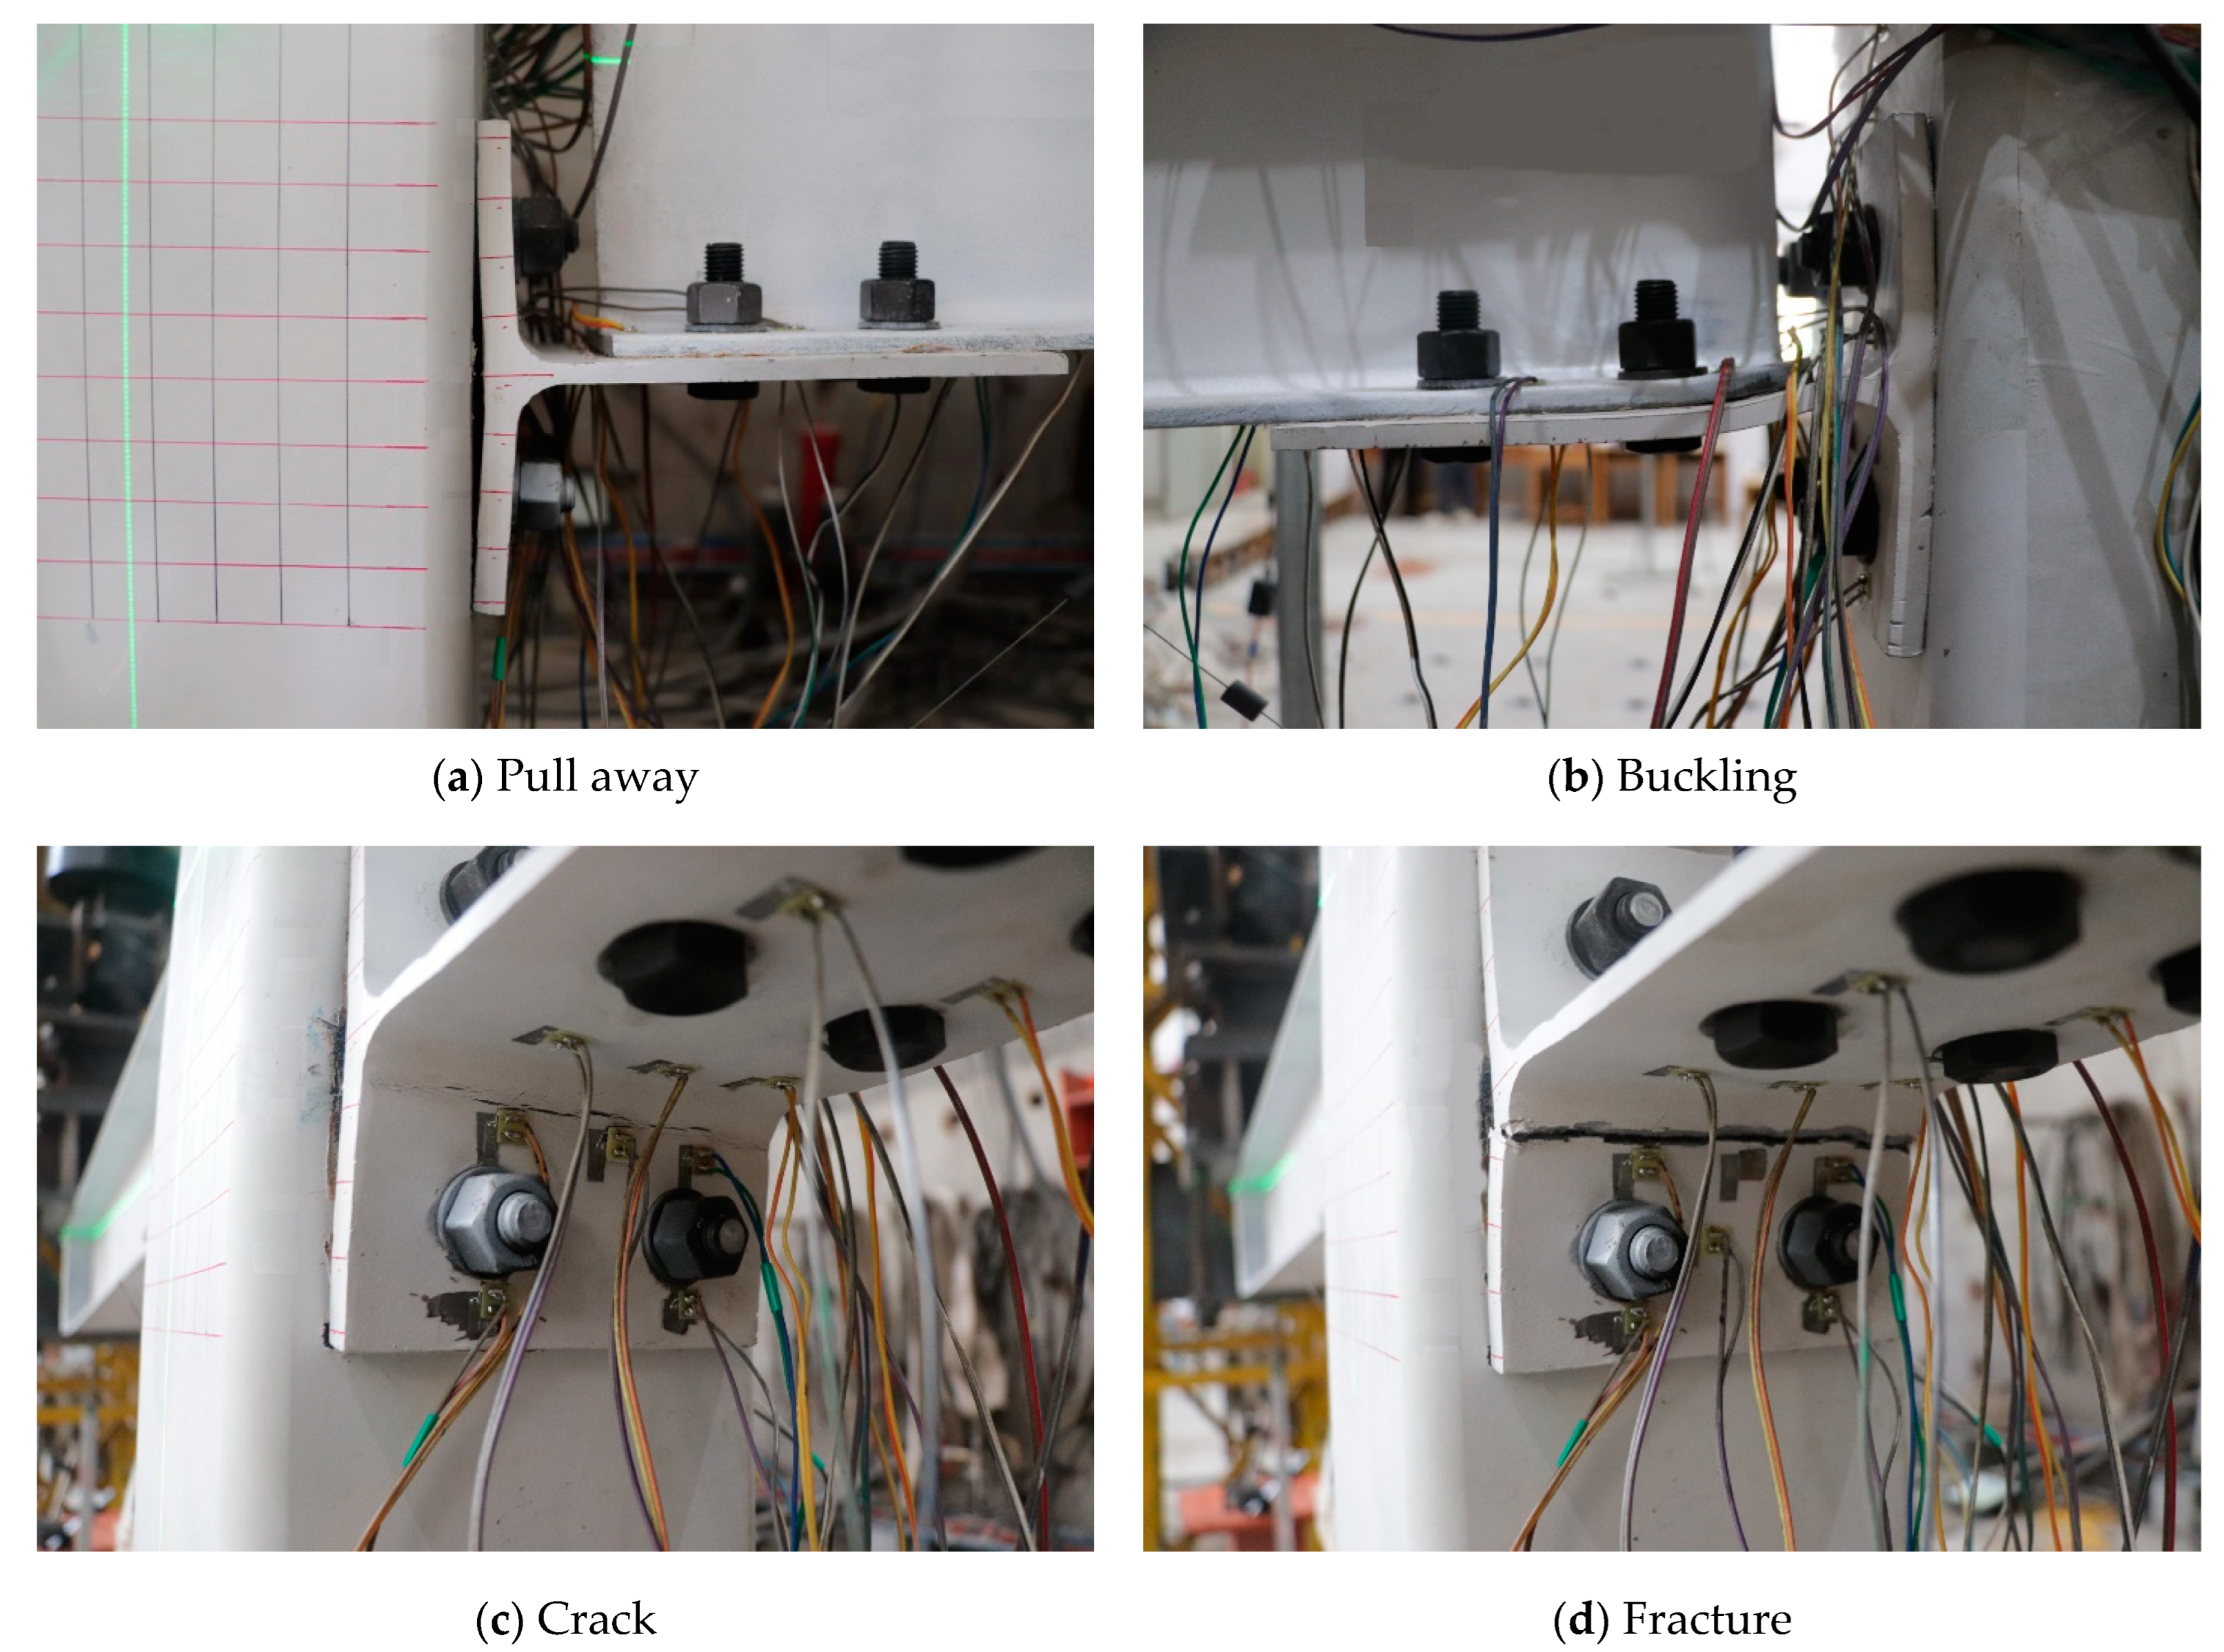
4. Test Phenomena
5. Test Results and Analyses
5.1. Test Results
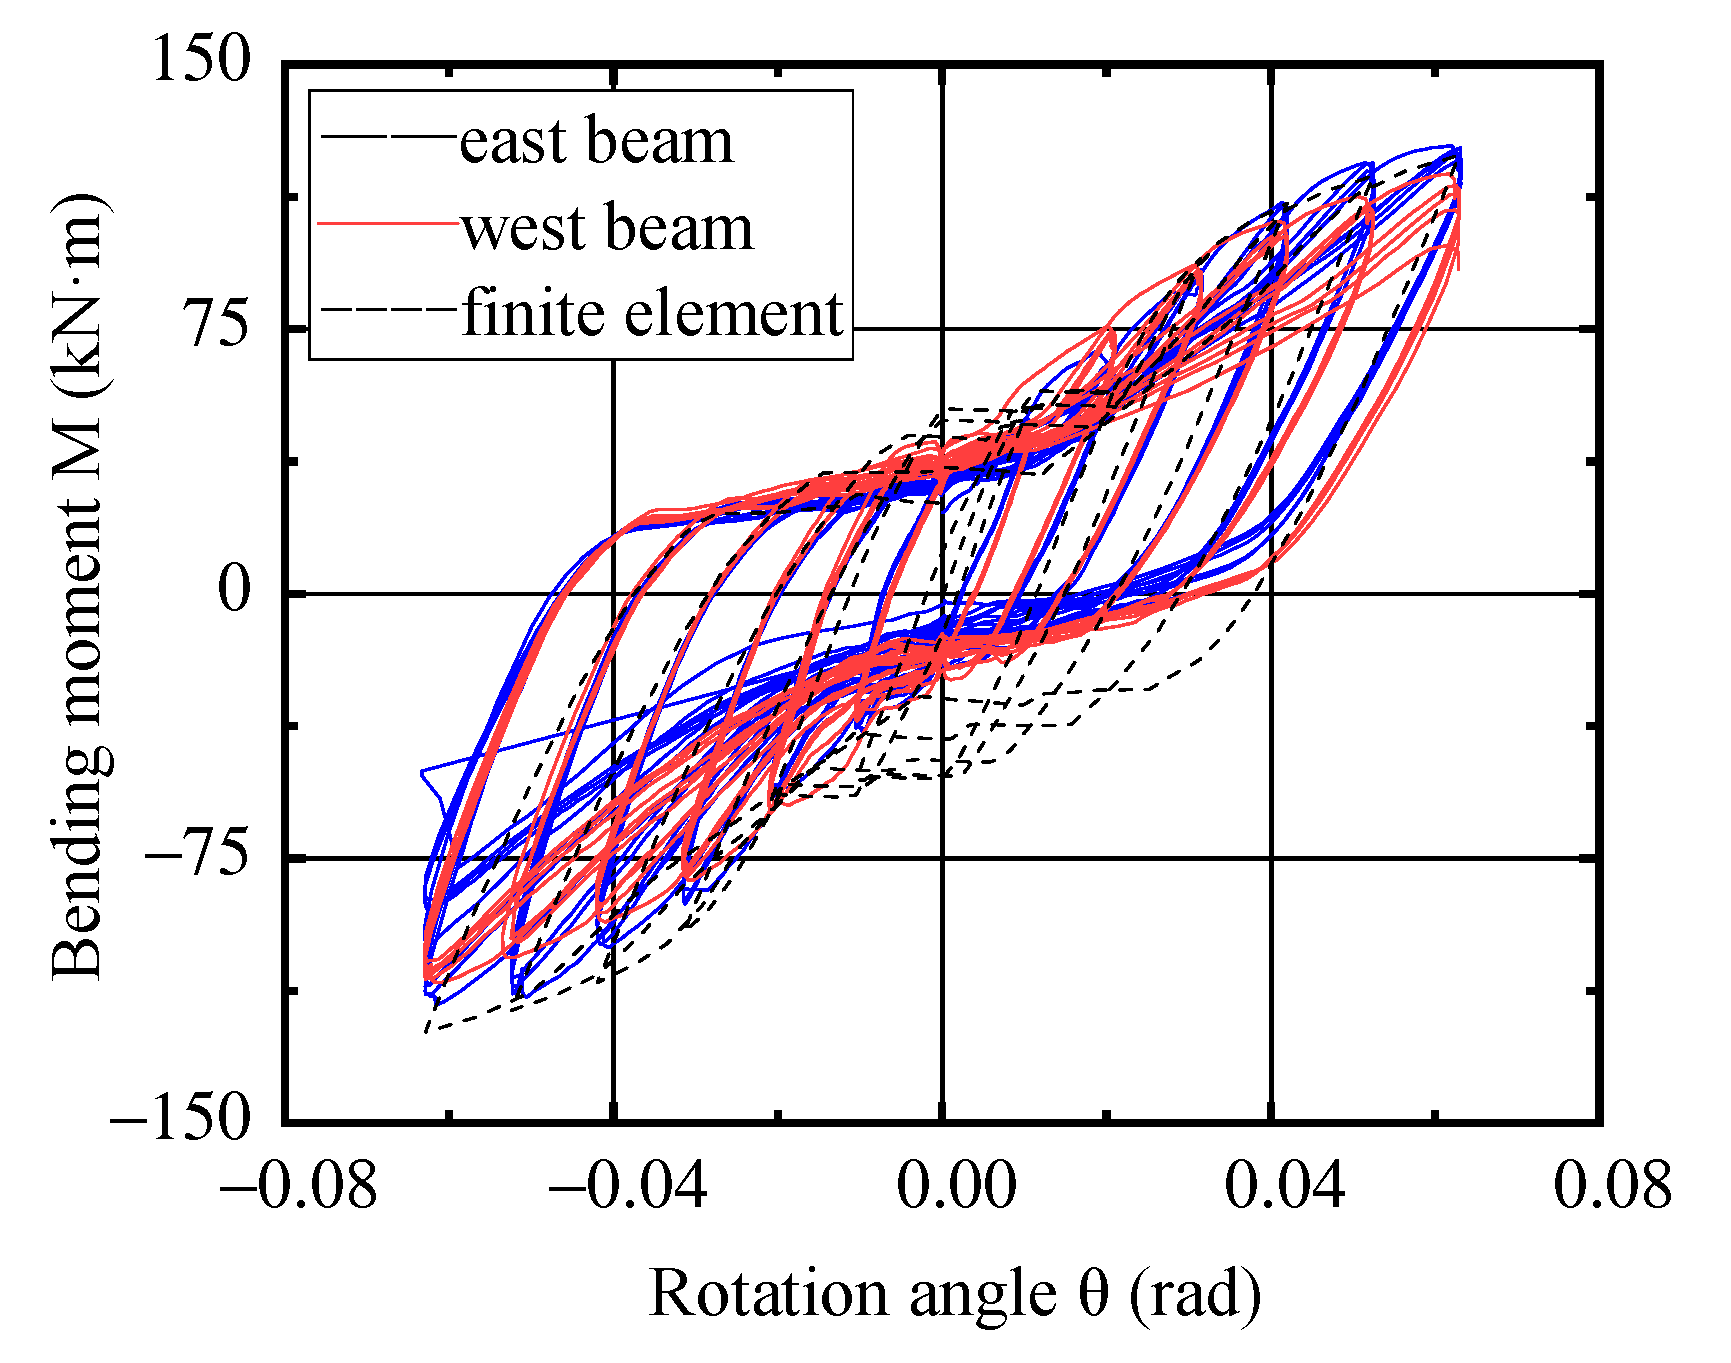
5.2. Hysteretic Characteristics
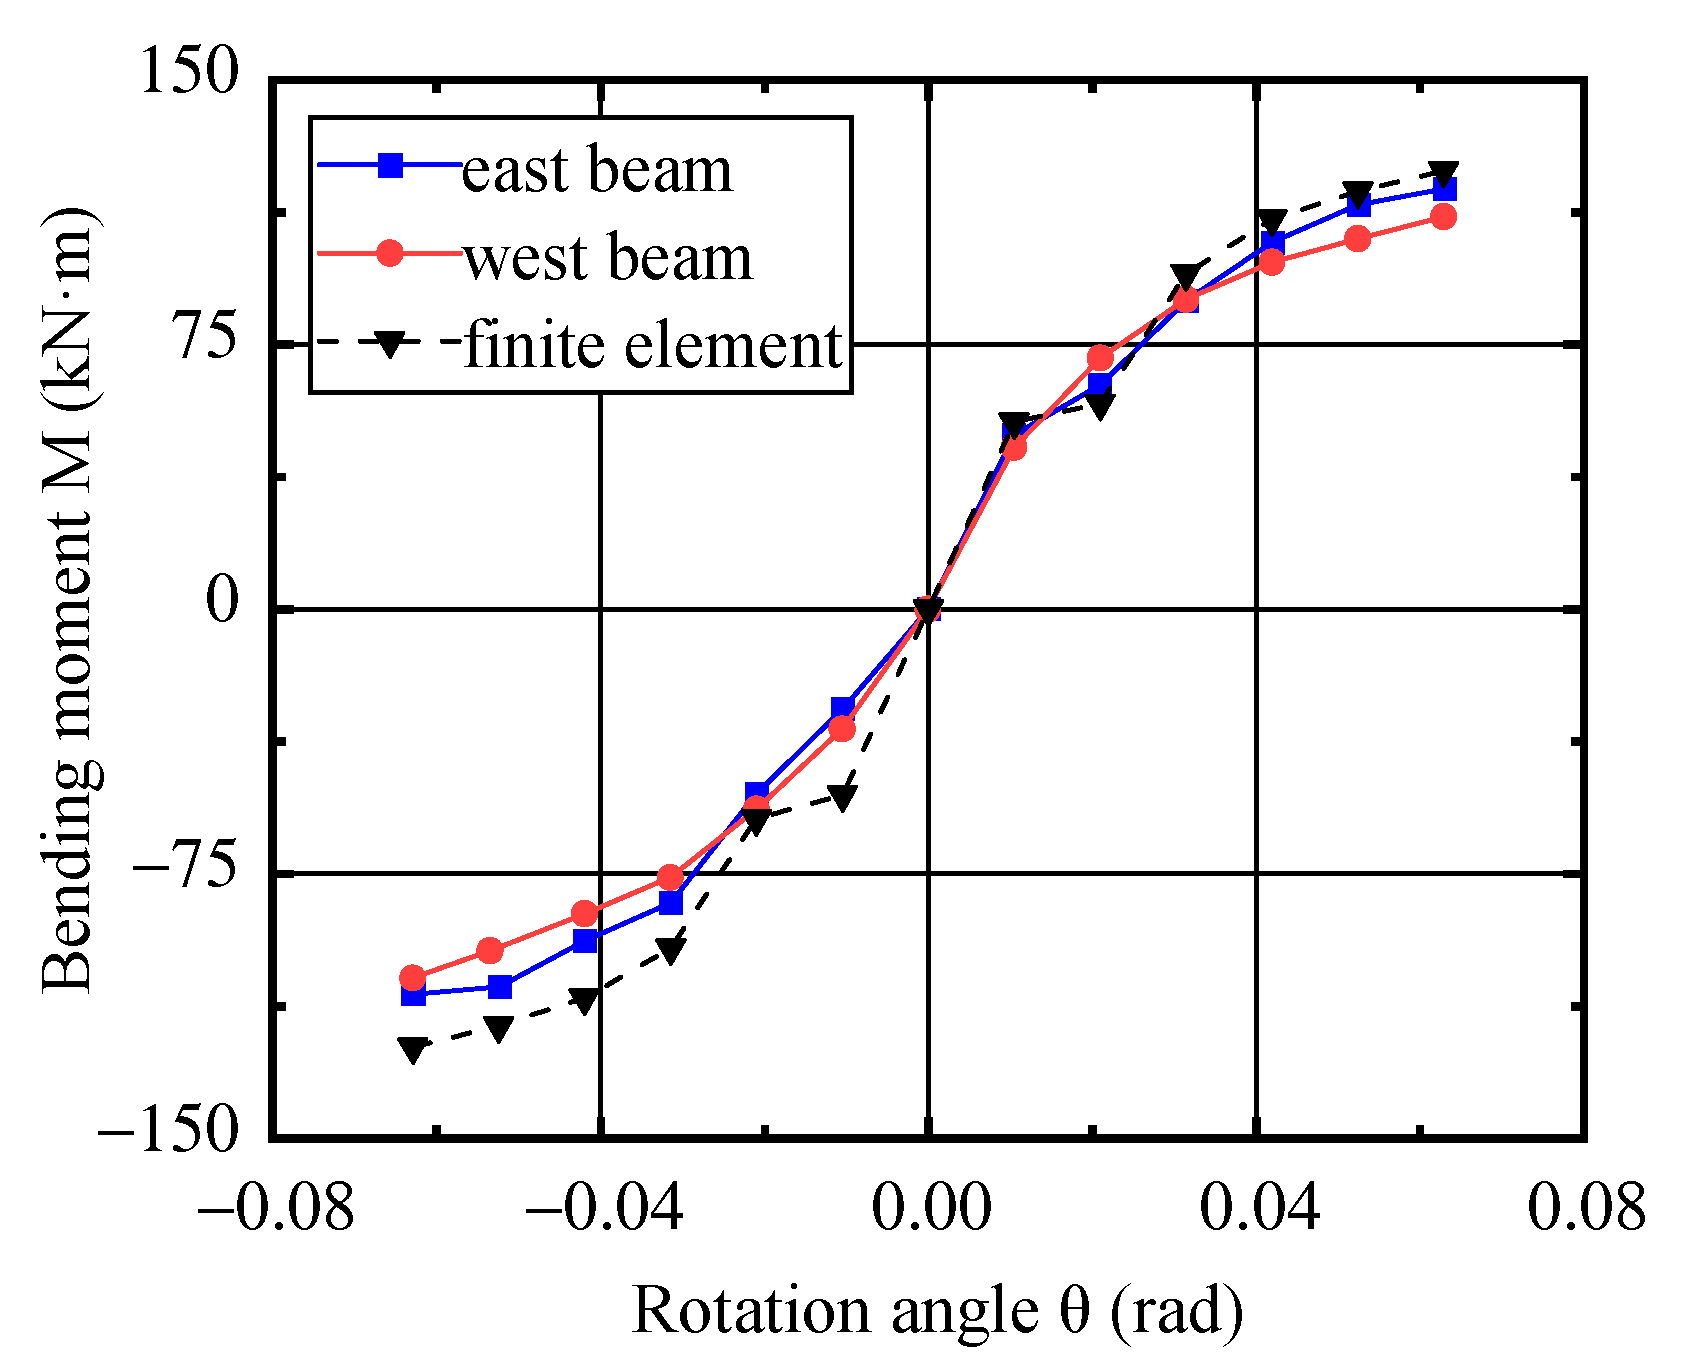
5.3. Skeleton Curve
5.4. Analysis of Rotational Stiffness Degradation
5.5. Ductility
5.6. Energy Dissipation Capacity
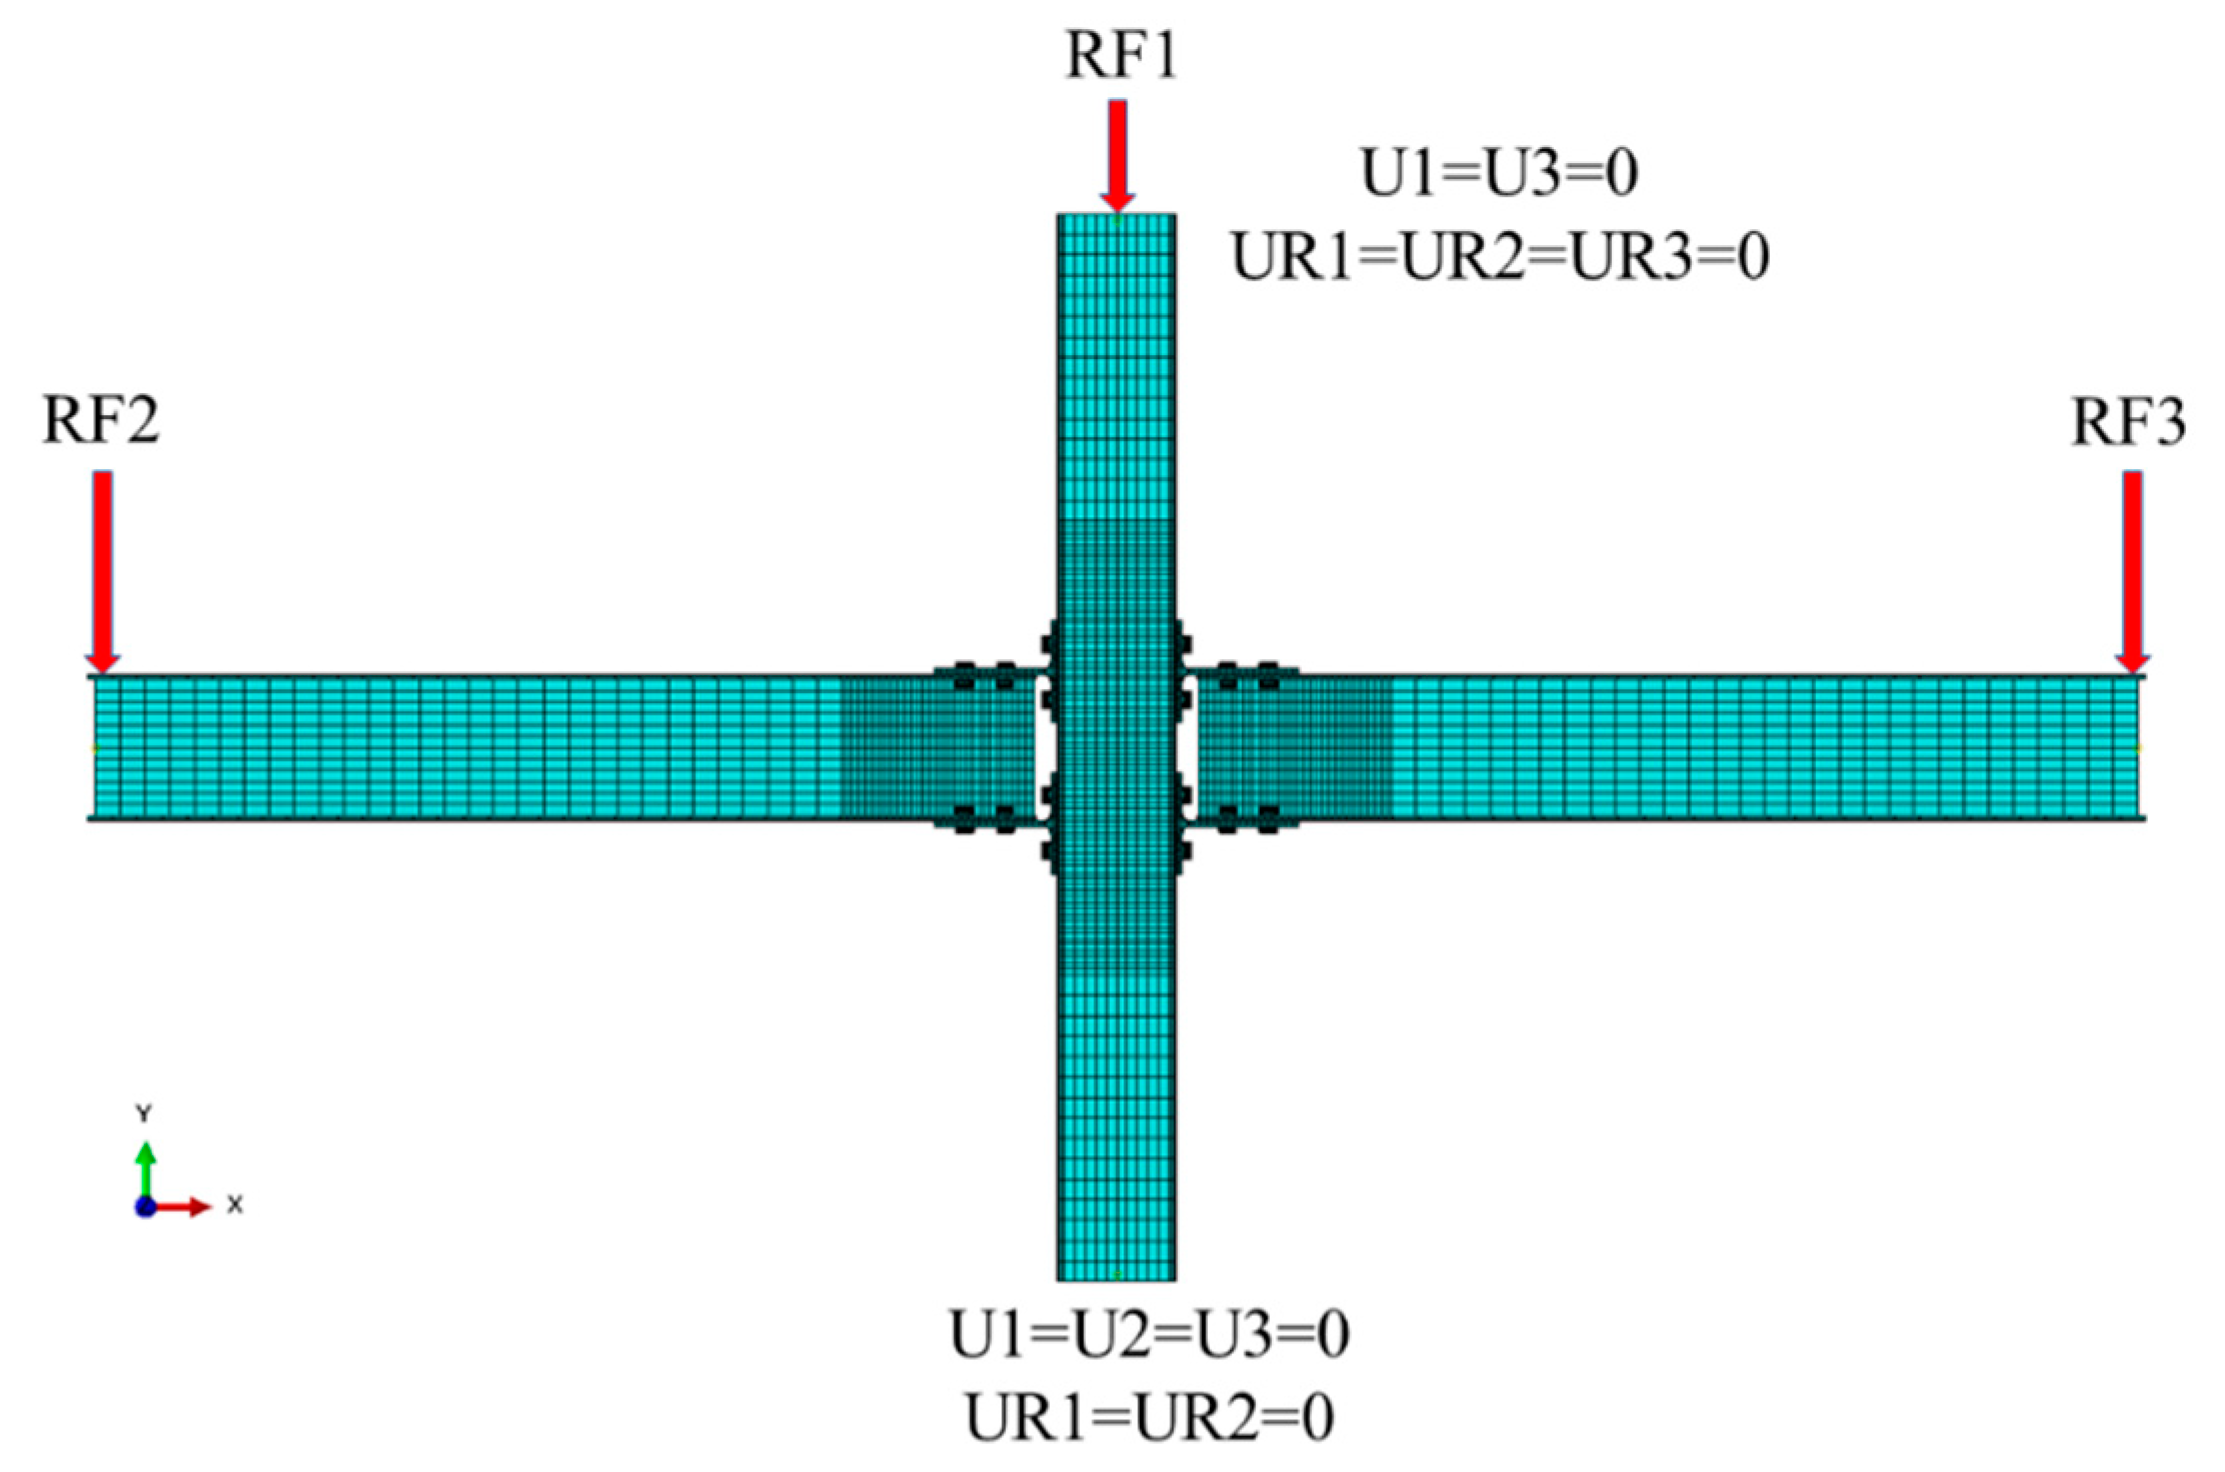
6. Finite Element Analysis
7. Strain Analysis
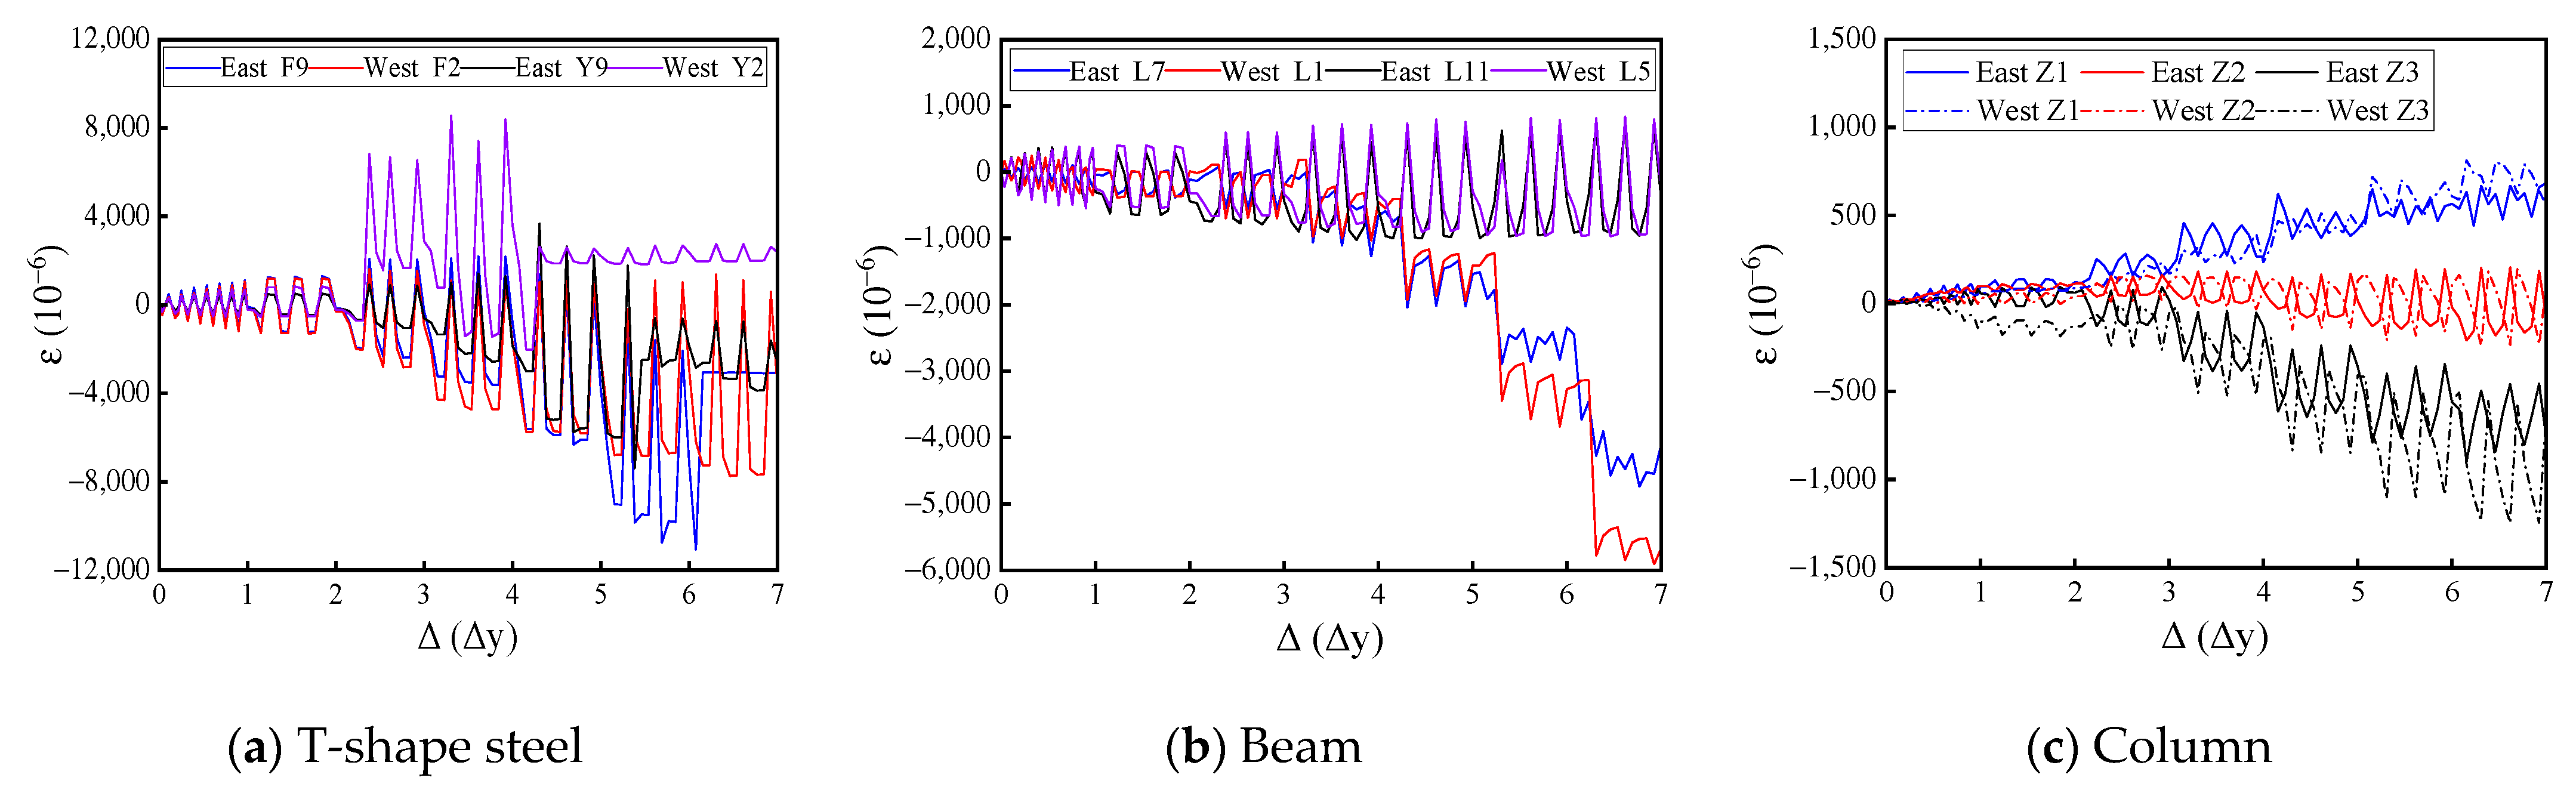
7.1. Overall Strain Analysis
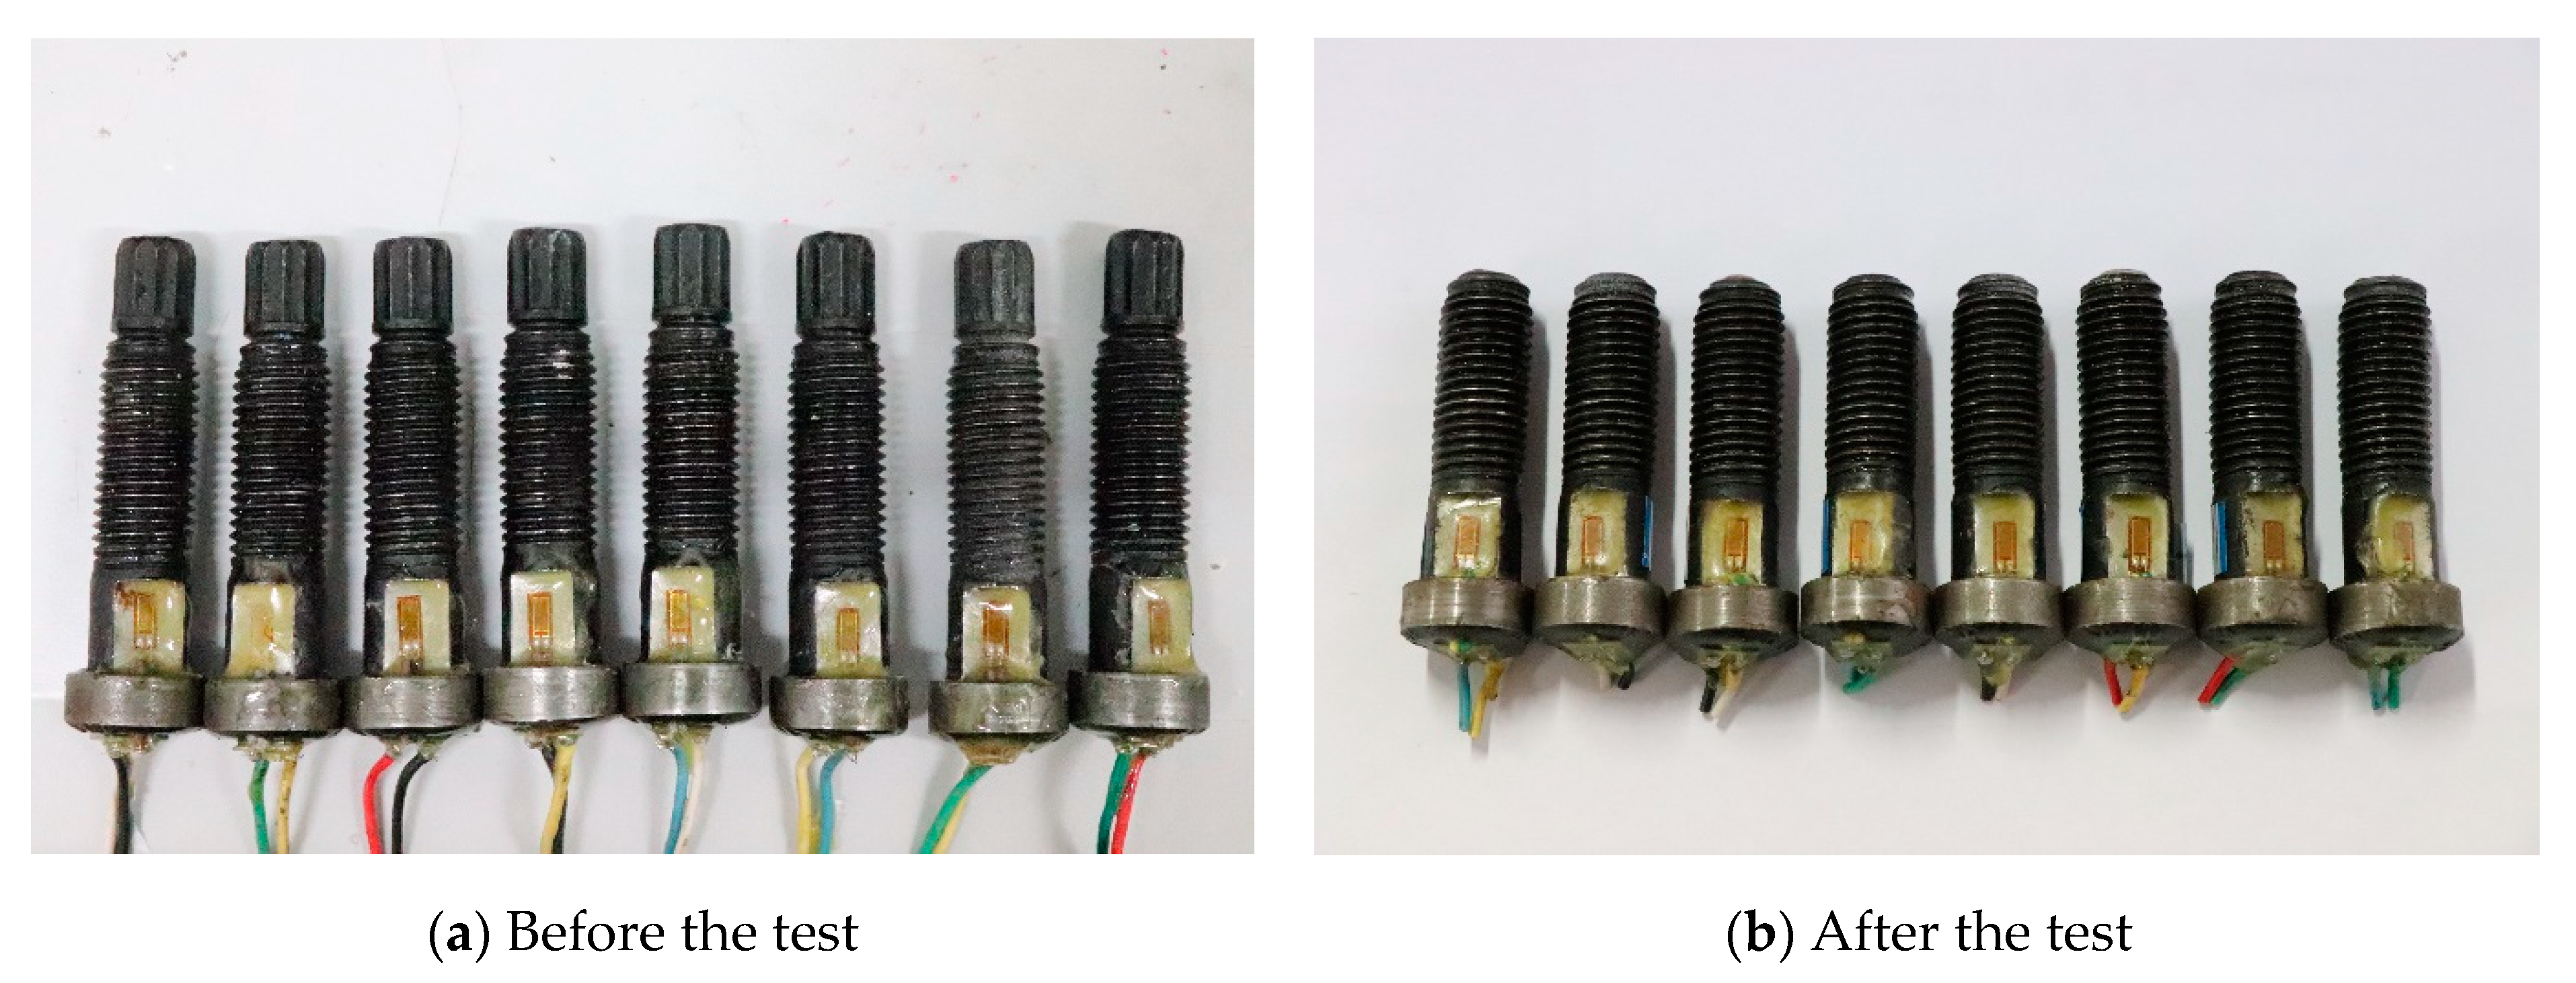
7.2. Bolt Strain Analysis
8. Conclusions
- When the beam end loading method was adopted in this type of semi-rigid joint, the force and deformation of the beam ends on either side were not completely synchronous, leading to slight differences in the seismic performance between either side of the joint. As the loading stage increased, the trend of both joint sides remained the same, indicating that the stability of the joint was good;
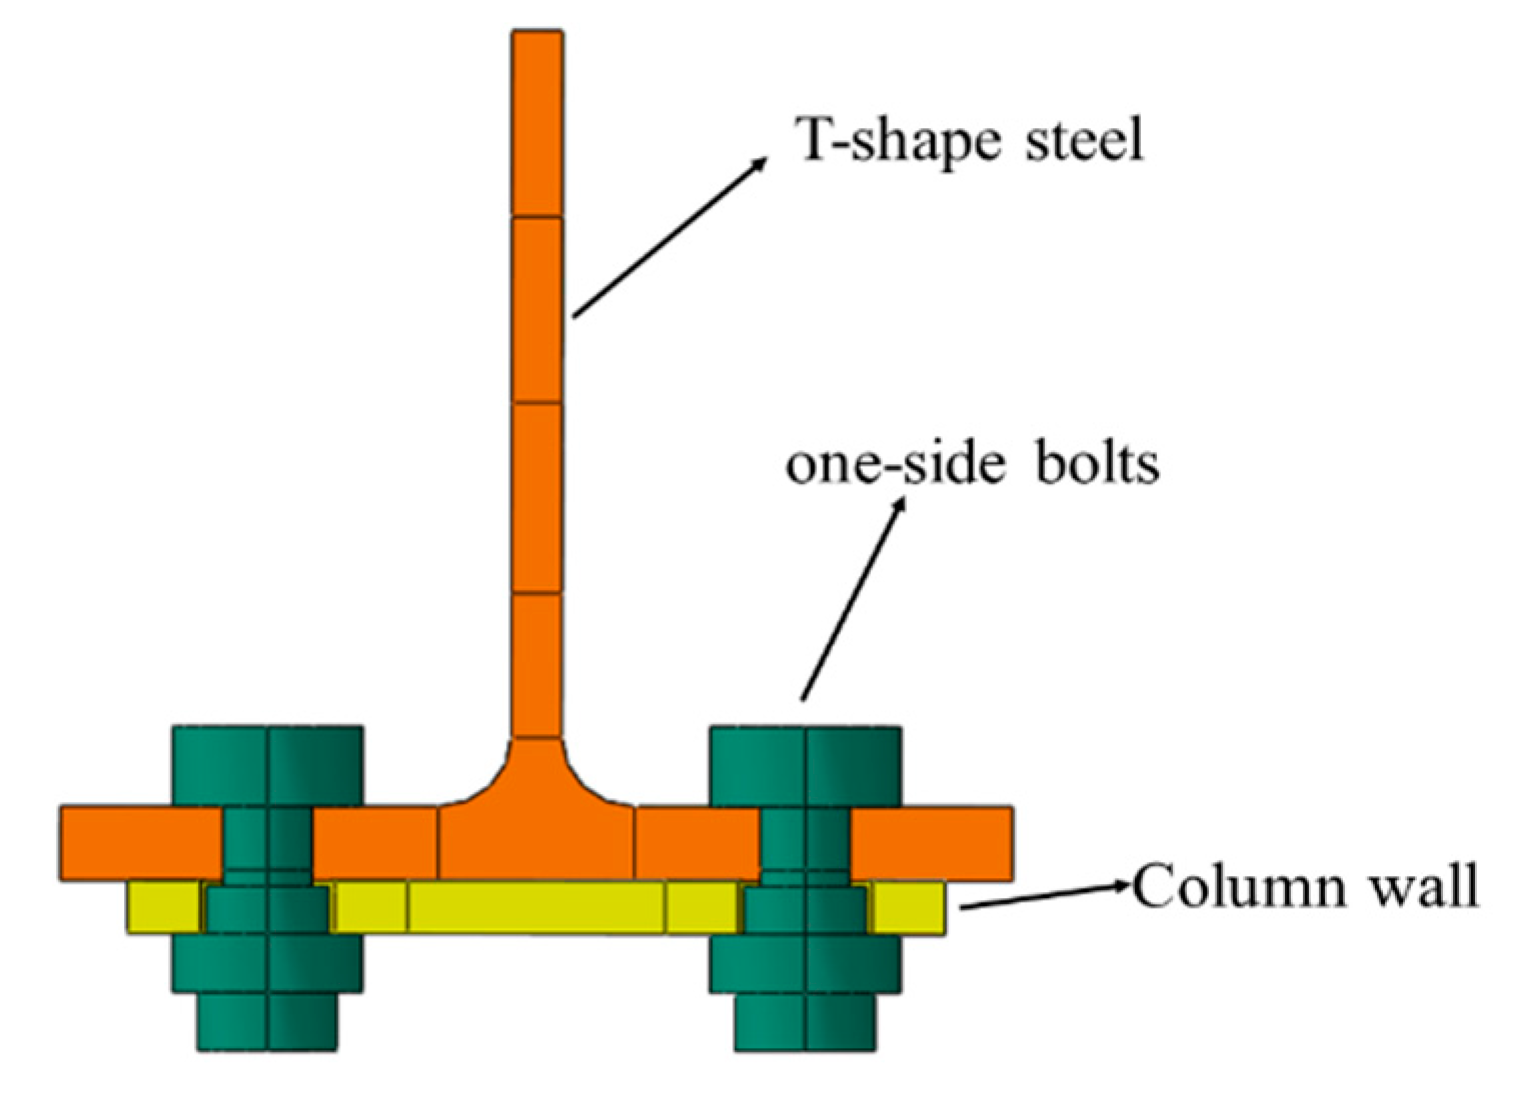
- In the semi-rigid beam–column joints, with T-shape steel as the connector, the energy was mainly dissipated through plastic deformations in the T-shape steel. The plastic hinge appeared mainly at the junction of the T-shape steel web and flange, where plastic deformation was the largest;
- The test results are in good agreement with the finite element results, which indicates that the finite element numerical analysis method can be used to study the seismic performance of the joint member;
- The one-side bolts had superior performance and were more suitable for connecting the steel tube column-enclosed space. The strain value increased steadily during the test loading process. After the test, the yield strain was not reached, and there was no obvious plastic deformation, showing good mechanical characteristics. Therefore, it is recommended that such one-side bolts be applied in practical engineering.
Author Contributions
Funding
Institutional Review Board Statement
Informed Consent Statement
Data Availability Statement
Conflicts of Interest
References
- Wang, X.W. Research and Application of Mechanical Behavior of Split T-Shape Steel Beam-Column Connection; Luoyang Institute of Technology: Luoyang, China, 2009. [Google Scholar]
- Chang, X.; Sun, J.Q.; Wang, S.R.; Kang, A.Z.; Peng, J.C. Horizontally loaded steel pipe piles anchored in bare and hard rock under deep water condition: Parametric analysis. Ocean. Eng. 2022, 266, 112715. [Google Scholar]
- Li, G.Q.; Duan, L.; Lu, Y.; Zhang, L.; Jiang, W.H. Bearing capacity performance of one-way bolted joints of H-shape steel beam and rectangular steel tube column flush end plate. J. Tongji Univ. 2018, 46, 162–169. [Google Scholar]
- Li, D.S.; Tao, Z.; Wang, Z.B. Test study on static behavior of concrete-filled steel tubular column-steel beam one-side bolts connection. J. Hunan Univ. 2015, 42, 43–49. [Google Scholar] [CrossRef]
- Jia, S.S.; Wang, Y.; Wang, X.J.; Liu, X.L. Study on seismic performance and restoring force model of one-side bolts connection between rectangular steel tube column and H-shape steel beam. J. Build. Struct. 2020, 41, 168–179. [Google Scholar] [CrossRef]
- Liu, Y.Z.; Christian, M.C.; Ahmed, Y.E. Behavior of open beam-to-tubular column angle connections under combined loading conditions. Steel Compos. Struct. Int. J. 2014, 16, 157–185. [Google Scholar] [CrossRef]
- Wang, W.; Li, W.; Chen, Y.; Jian, X. Cyclic behavior of endplate connections to tubular columns with novel slip-critical blind bolts. Eng. Struct. 2017, 148, 949–962. [Google Scholar] [CrossRef]
- Zhou, S.Z.; Wu, C.F.; Sun, Q.; Zhang, W.C.; Zhang, M.; Liu, M.; Wang, P.J.; Zhao, H.; Shang, Y.W. Mechanical behavior of threaded anchored one-side bolts endplate connections between steel tubular columns and steel beams. Dev. Build. Steel Struct. 2021, 23, 22–29. [Google Scholar] [CrossRef]
- Ban, H.Y.; Kong, S.Y.; Xie, C.F.; Wang, B.X. Study on strain relaxation and shear resistance of new high strength bolt unilateral connection. Ind. Constr. 2019, 49, 146–150+161. [Google Scholar] [CrossRef]
- Wang, Y.; Jia, S.S.; Chai, W.J. Test study and numerical simulation of T-stub connections with one-side high-strength bolts. J. Tianjin Univ. 2018, 51, 78–85. [Google Scholar]
- He, Z.F.; He, M.S.; Jiao, J.; Li, W.Z. Study on seismic performance of new one-side all-bolt joints and ordinary all-bolt joints. Build. Struct. 2017, 47, 63–68. [Google Scholar] [CrossRef]
- Lee, J.; Goldsworthy, H.M.; Goldsworthy; Gad, E.F. Blind bolted moment connection to unfilled hollow section columns using extended T-stub with back face support. Eng. Struct. 2011, 33, 1710–1722. [Google Scholar] [CrossRef]
- General Administration of Quality Supervision, Inspection, and Quarantine, Ministry of Construction of the People’s Republic of China. Steel Structure Engineering Construction Quality Acceptance Specification: GB50205—2020; China Planning Press: Beijing, China, 2020. [Google Scholar]
- General Administration of Housing Quality Supervision, Inspection, and Quarantine of the People’s Republic of China. Tensile Test of Metallic Materials Part 1: Test Method at Room Temperature: GB/T228.1—2010; China Standards Press: Beijing, China, 2011. [Google Scholar]
- Ministry of Housing and Urban-Rural Development of the People’s Republic of China. Code for the Seismic Test of Buildings JGJ/T101—2015; China Construction Industry Press: Beijing, China, 2015. [Google Scholar]
- Bu, X.; Gu, Q.; Wang, X.W. Test study on seismic behavior of mid-column space joints of T-shape steel beam-column connection frame. Eng. Mech. 2017, 34, 105–116. [Google Scholar]


| Component | Cross-Sectional Dimensions/mm | Grade |
|---|---|---|
| Column | 200 × 10 × 10 | Q235B |
| Beam | HN 250 × 125 × 6 × 9 | Q235B |
| T-shape steel | HN 210 × 170 × 9 × 14 | Q235B |
| Component | t/mm | /MPA | /MPA | /GPA | /% | /% |
|---|---|---|---|---|---|---|
| Column | 10 | 345 | 491 | 209 | 30.3 | 0.165 |
| Beam | 6 | 280 | 442 | 196 | 34.5 | 0.143 |
| 9 | 252 | 440 | 199 | 32.2 | 0.127 | |
| T-shape steel | 9 | 289 | 463 | 207 | 30.7 | 0.148 |
| 14 | 269 | 447 | 197 | 33.0 | 0.136 |
| Beam Position | Yield Stage | Limit Stage | ||
|---|---|---|---|---|
| Displacement/mm | Load/KN | Displacement/mm | Load/KN | |
| east | 17.24 | 30.09 | 104.52 | 72.15 |
| −17.29 1 | −17.13 | −103.92 | −66.13 | |
| west | 17.25 | 27.80 | 103.88 | 67.41 |
| −17.27 | −21.23 | −103.82 | −63.32 | |
| The Beam Number | |||
|---|---|---|---|
| East | 25.22 | 63.09 | 2.51 |
| West | 25.47 | 62.91 | 2.47 |
| Beam Position | |||
|---|---|---|---|
| East | 7.35 | 1.014 | 0.161 |
| West | 7.41 | 1.169 | 0.186 |
| Project | ||||
|---|---|---|---|---|
| test | 23.71 1 | 67.26 | 2.49 | 0.174 |
| finite element | 28.68 | 75.24 | 2.57 | 0.189 |
| differentials (%) | 17.3 | 10.6 | 3.1 | 7.9 |
Disclaimer/Publisher’s Note: The statements, opinions and data contained in all publications are solely those of the individual author(s) and contributor(s) and not of MDPI and/or the editor(s). MDPI and/or the editor(s) disclaim responsibility for any injury to people or property resulting from any ideas, methods, instructions or products referred to in the content. |
© 2023 by the authors. Licensee MDPI, Basel, Switzerland. This article is an open access article distributed under the terms and conditions of the Creative Commons Attribution (CC BY) license (https://creativecommons.org/licenses/by/4.0/).
Share and Cite
Lin, Y.; Wang, X.; Gong, J.; Wang, S.; Sun, H.; Liu, H. Seismic Performance of an Exterior Joint between a Square Steel Tube Column and an H-Shape Steel Beam. Sustainability 2023, 15, 3856. https://doi.org/10.3390/su15043856
Lin Y, Wang X, Gong J, Wang S, Sun H, Liu H. Seismic Performance of an Exterior Joint between a Square Steel Tube Column and an H-Shape Steel Beam. Sustainability. 2023; 15(4):3856. https://doi.org/10.3390/su15043856
Chicago/Turabian StyleLin, Yongle, Xinwu Wang, Jian Gong, Shuren Wang, Haisu Sun, and Huanhuan Liu. 2023. "Seismic Performance of an Exterior Joint between a Square Steel Tube Column and an H-Shape Steel Beam" Sustainability 15, no. 4: 3856. https://doi.org/10.3390/su15043856
APA StyleLin, Y., Wang, X., Gong, J., Wang, S., Sun, H., & Liu, H. (2023). Seismic Performance of an Exterior Joint between a Square Steel Tube Column and an H-Shape Steel Beam. Sustainability, 15(4), 3856. https://doi.org/10.3390/su15043856