Article

Renewable and Non-Renewable Energy Consumption and Its Impact on Economic Growth

by
Hosein Mohammadi
1,*,
Sayed Saghaian
2,* and
Bahareh Zandi Dareh Gharibi
1
1
Department of Agricultural Economics, College of Agriculture, Ferdowsi University of Mashhad, Mashhad 9177948978, Iran
2
Department of Agricultural Economics, College of Agriculture, Food and Environment, University of Kentucky, Lexington, KY 40536, USA
*
Authors to whom correspondence should be addressed.
Sustainability 2023, 15(4), 3822; https://doi.org/10.3390/su15043822
Submission received: 13 January 2023 / Revised: 14 February 2023 / Accepted: 17 February 2023 / Published: 20 February 2023

Abstract

:
Energy is an important factor in boosting and sustaining the economic growth level of a country. The aim of this study was to investigate the relationship between energy consumption and the economic growth of selected developed and developing countries from 1993–2019. For this purpose, we used the Pedroni co-integration method to determine the long-term relationship between economic growth and energy consumption. To estimate the long-term parameters, the panel fully modified OLS method and the Dumitrescu and Hurlin heterogeneous panel causality estimation technique were used, and the causality direction between variables was considered. The results showed that energy consumption had a positive and significant effect on the economic growth of both groups of countries. The causality analysis revealed the existence of a protection effect between renewable energy consumption and economic growth in developed countries. Hence, policies that lead to an increase in independent growth in these countries can effectively impact their growth. On the other hand, the existence of the feedback effect in developing countries shows that storage policies and reduced energy consumption may pose a threat to economic growth in these countries.

1. Introduction

The sustainability of economic growth, amongst other preconditions, depends on the effective use of production input factors [1]. Energy is an important factor of growth for all countries [2]. Traditional energy sources such as oil, natural gas, and coal are the most effective drivers of economic growth, providing more than 80% of the energy consumption [3,4]. The demand for traditional energy sources in recent decades has increased for various reasons, including social and economic developments [5]. On the other hand, environmental concerns, the depletion of fossil fuel reserves, energy price shocks, non-renewable features of oil, natural gas and coal as energy sources, and global warming have caused renewable energies to be considered as an alternative to traditional energy sources [6,7]. For example, while world energy consumption was 355.486 quad Btu in 1993, this consumption had risen to 601.117 quad Btu by 2019. The share of oil, coal, and natural gas was, respectively, 32.82%, 27.26%, and 24.37% successful in meeting this demand by 2019. In other words, 84% of the world’s energy needs in 2019 were met with traditional energy sources [8]. Many international environmental and energy organizations, such as the International Energy Agency (EIA) and the International Renewable Energy Agency (IRENA), have claimed that renewable energy resources can offer a significant opportunity for economic development and environmental quality improvement for many countries around the world [9]. Therefore, it’s important to understand the dynamics between renewable energy consumption and economic growth [10]. In this frame, the relationship between energy consumption and economic growth is based on four hypotheses of growth, conservation, feedback, and neutrality. The growth hypothesis claims that there is a one-way causal relationship between energy consumption and economic growth. According to this hypothesis, energy-saving policies have a negative effect on economic growth [11]. The conservation hypothesis implies that economic growth causes energy consumption. This position implies that an increase in economic growth leads to an increase in energy consumption [12]. As a result of this hypothesis, energy-saving policies and demand management policies will have no negative effect on economic growth [9]. The feedback hypothesis indicates that energy consumption and economic growth are interdependent and complementary [13]. This hypothesis is supported when there is a two-way/mutual causality relationship between energy consumption and economic growth. In this case, the increase/decrease in energy use leads to an increase/decrease in economic growth, and similarly, the increase/decrease in economic growth leads to an increase/decrease in energy use [9,14]. Lastly, the neutrality hypothesis postulates that there is no causality relationship between energy consumption and economic growth [13]. In this case, reducing energy use through energy conservation policies will have no impact on economic growth [15]. These four hypotheses have provided the foundation for empirical tests investigating the energy consumption–growth relationship [16].
Figure 1 shows the non-renewable energy consumption in quadrillion Btu and the GDP (constant 2015 US $) for developed countries from 1993–2019 (World Bank data). The overall growth of non-renewable energy consumption and economic growth suggests that the growth hypothesis and the feedback hypothesis are more applicable in developed countries than the conservation hypothesis or the neutral hypothesis.
Figure 2 shows the non-renewable energy consumption in quadrillion Btu and the GDP (constant 2015 US $) for developing countries from 1993–2019 (World Bank data). The overall growth of non-renewable energy consumption and economic growth suggests that the growth hypothesis and the feedback hypothesis are more applicable in developed countries than the conservation hypothesis or the neutral hypothesis.

2. Literature Review

Considering the four hypotheses of growth, feedback, conservation, and neutrality, many studies have examined the relationship between energy consumption and economic growth in different countries and different periods of time, which indicates different results [17]. Empirical evidence on the direction of causality, the presence, and the nature of the long-run relationship among the variables varies according to countries and regions, study periods, econometric approaches, and the sources and nature of energy consumed [16]. In this context, [18] examined the relationship between renewable energy and industrial production from 1981–2013 in the USA with monthly data using the wavelet coherence method, and the results support the growth hypothesis. The results of [13] showed a two-way causality between energy consumption and GDP from 1970–2012 for Canada, Japan, and the United States. Authors of [19] examined the relationship between energy consumption and economic growth and how democracy moderates this relationship from 1971 to 2013 in 16 sub-Saharan African (SSA) countries, and their results confirm the feedback hypothesis for energy consumption and growth. In [20] the impacts of renewable energy consumption on German economic growth were considered and the results showed that renewable energy consumption in Germany consolidates the country’s economic growth prospects. The causality analysis, on the other hand, revealed the existence of a feedback effect between renewable energy consumption and economic growth. In [11], the relationship between renewable energy consumption and economic growth from 1990–2012 in nine Black Sea and Balkan countries was considered. The results showed a long-term balance relationship between renewable energy consumption and economic growth, and renewable energy consumption had a positive impact on economic growth. Analysis results support the growth hypothesis in Bulgaria, Greece, Macedonia, Russia, and Ukraine; the feedback hypothesis in Albania, Georgia, and Romania; and the neutrality hypothesis in Turkey. According to the panel dataset including all nine countries, the results support the feedback hypothesis. With the findings, it was concluded that renewable energy consumption has a significant impact on economic growth in Balkan and Black Sea Countries. In [21], the authors examined the effect of renewable and non-renewable electricity generation on economic growth from 1980–2012 in 174 countries. The result showed a strong positive and statistically significant relationship between renewable and non-renewable electricity generation and growth. Authors of [22] examined the dynamics between energy consumption and economic growth in Ecuador from 1970–2015. The result showed a one-way causality from energy consumption to economic growth. In [23], the authors analyzed the existing literature on the relationship between energy consumption and economic growth in the six Gulf Cooperation Council (GCC) countries (Saudi Arabia, United Arab Emirates, Bahrain, Qatar, Oman, and Kuwait) from 2006–2019. The result of this study revealed that 18% of the observations supported the growth hypothesis, 26% supported the conservation hypothesis, 43% supported the feedback hypothesis, and 13% supported the neutral hypothesis. In [24], authors examined the impact of the COVID-19 pandemic on electricity consumption and the economic growth nexus using 30 European countries’ quarterly data between 2015Q1 and 2021Q3. The result showed that there is bi-directional causality between electricity consumption and economic growth. In [25], the authors compared the impact of renewable and non-renewable electricity consumption on economic growth for 10 newly industrialized countries from 1990 to 2015. The result showed that both renewable and non-renewable energies have a positive and significant long-run effect on economic growth. Furthermore, Granger causality tests suggested short-run and long-run bidirectional causality relationships between renewable electricity consumption and economic growth.
Moreover, some studies have examined the relationship between energy consumption and economic growth in the agricultural sector. In [26] the authors examined the relationship between energy consumption, agricultural growth, and export using time series econometric techniques, including causality and co-integration tests, from 1967–2015. The results showed that there is unidirectional causality from energy consumption to agricultural growth and a one percent increase in energy-use results, including a 1.29 percent rise in agricultural growth in the long-run. In [27], the authors examined the relationship between carbon emissions, energy consumption, and economic growth in the agricultural sector using data from China’s main grain-producing areas between 1996 and 2015. The results showed that there is a unidirectional causality from agricultural energy consumption to agricultural carbon emissions and agricultural economic growth.
Due to the importance of energy consumption on economic growth, especially in developing countries, the main objective of this study was to examine and compare the impact of renewable energy consumption (REC) and non-renewable energy consumption (NREC) on economic growth in developed and developing countries. While there are many studies on the relationship between energy consumption and economic growth, most studies did not separate the two types of energy. Other studies looked at the impact of renewable energy or non-renewable energy, while some have compared the impact of the two. This study tries to fill this gap. Accordingly, unlike other studies, beyond estimating the impact of REC and NREC on economic growth, the analysis involved to two groups of developing and developed countries. This allows us to investigate and compare the effect of two types of energy consumption on economic growth. We used a panel data approach to gain a sample from developed and developing countries from 1993–2019. The hypothesis of the research is:
Hypothesis 1 (H1).
The effect of energy consumption on economic growth is different in developed and developing countries.

3. Materials and Methods

3.1. Methods

In this study, the production function that labor, capital, and renewable and non-renewable energy are considered as its inputs is defined as follows:
Y i t = f K i t ,   L i t ,   R E C i t ,   N R E C i t
In Equation (1), Yit is economic growth or GDP growth, Kit is capital stock, Lit is labor force, RECit is total renewable energy use, and NRECit is total non-renewable energy consumption. Equation (1) was transformed into a log-linear specification by taking all the variable’s logarithms. The logarithmic equation will have advantages, such as avoiding problems caused by dynamic dataset conditions [17] and more consistent and efficient results [28]. For these reasons, Equation (1) is modeled as with log-linear function as follows:
l n Y i t = β 0 + β 1 i K i t + β 2 i L i t + β 3 i R E C i t + β 4 i N R E C i t + ε i t
In Equation (2), i and t indexes show the number of countries and the time-period. β1, β2, β3, and β4 are the elasticity of capital, labor, and renewable and non-renewable energy consumption, and εit is the stochastic error term. Equation (2) was estimated with the panel data approach and to estimate the long-term parameters, the panel fully modified ordinary least squares (panel FMOLS) method was used. Finally, the causality test among all variables was undertaken using the Dumitrescu and Hurlin [29] method. The significant advantage of this test is that it takes into consideration the dependence among the countries and heterogeneity. Moreover, it can be performed when the time dimension (T) is higher or lower than the cross-section dimension (N). In this method, analysis is performed with 2 stable series, and if the series used in the analysis are not stable, they should be stabilized by taking their discrepancy [11].

3.2. Data Description and Model Variables

In this study, the theoretical model was estimated using a panel data analysis approach from 1993–2019 for 59 countries, including 30 developed and 29 developing countries. The list of countries is in Appendix A. The variables have been calculated and reported in the form of natural logarithms for better scaling. A description of research variables and their sources and units are explained in Table 1.

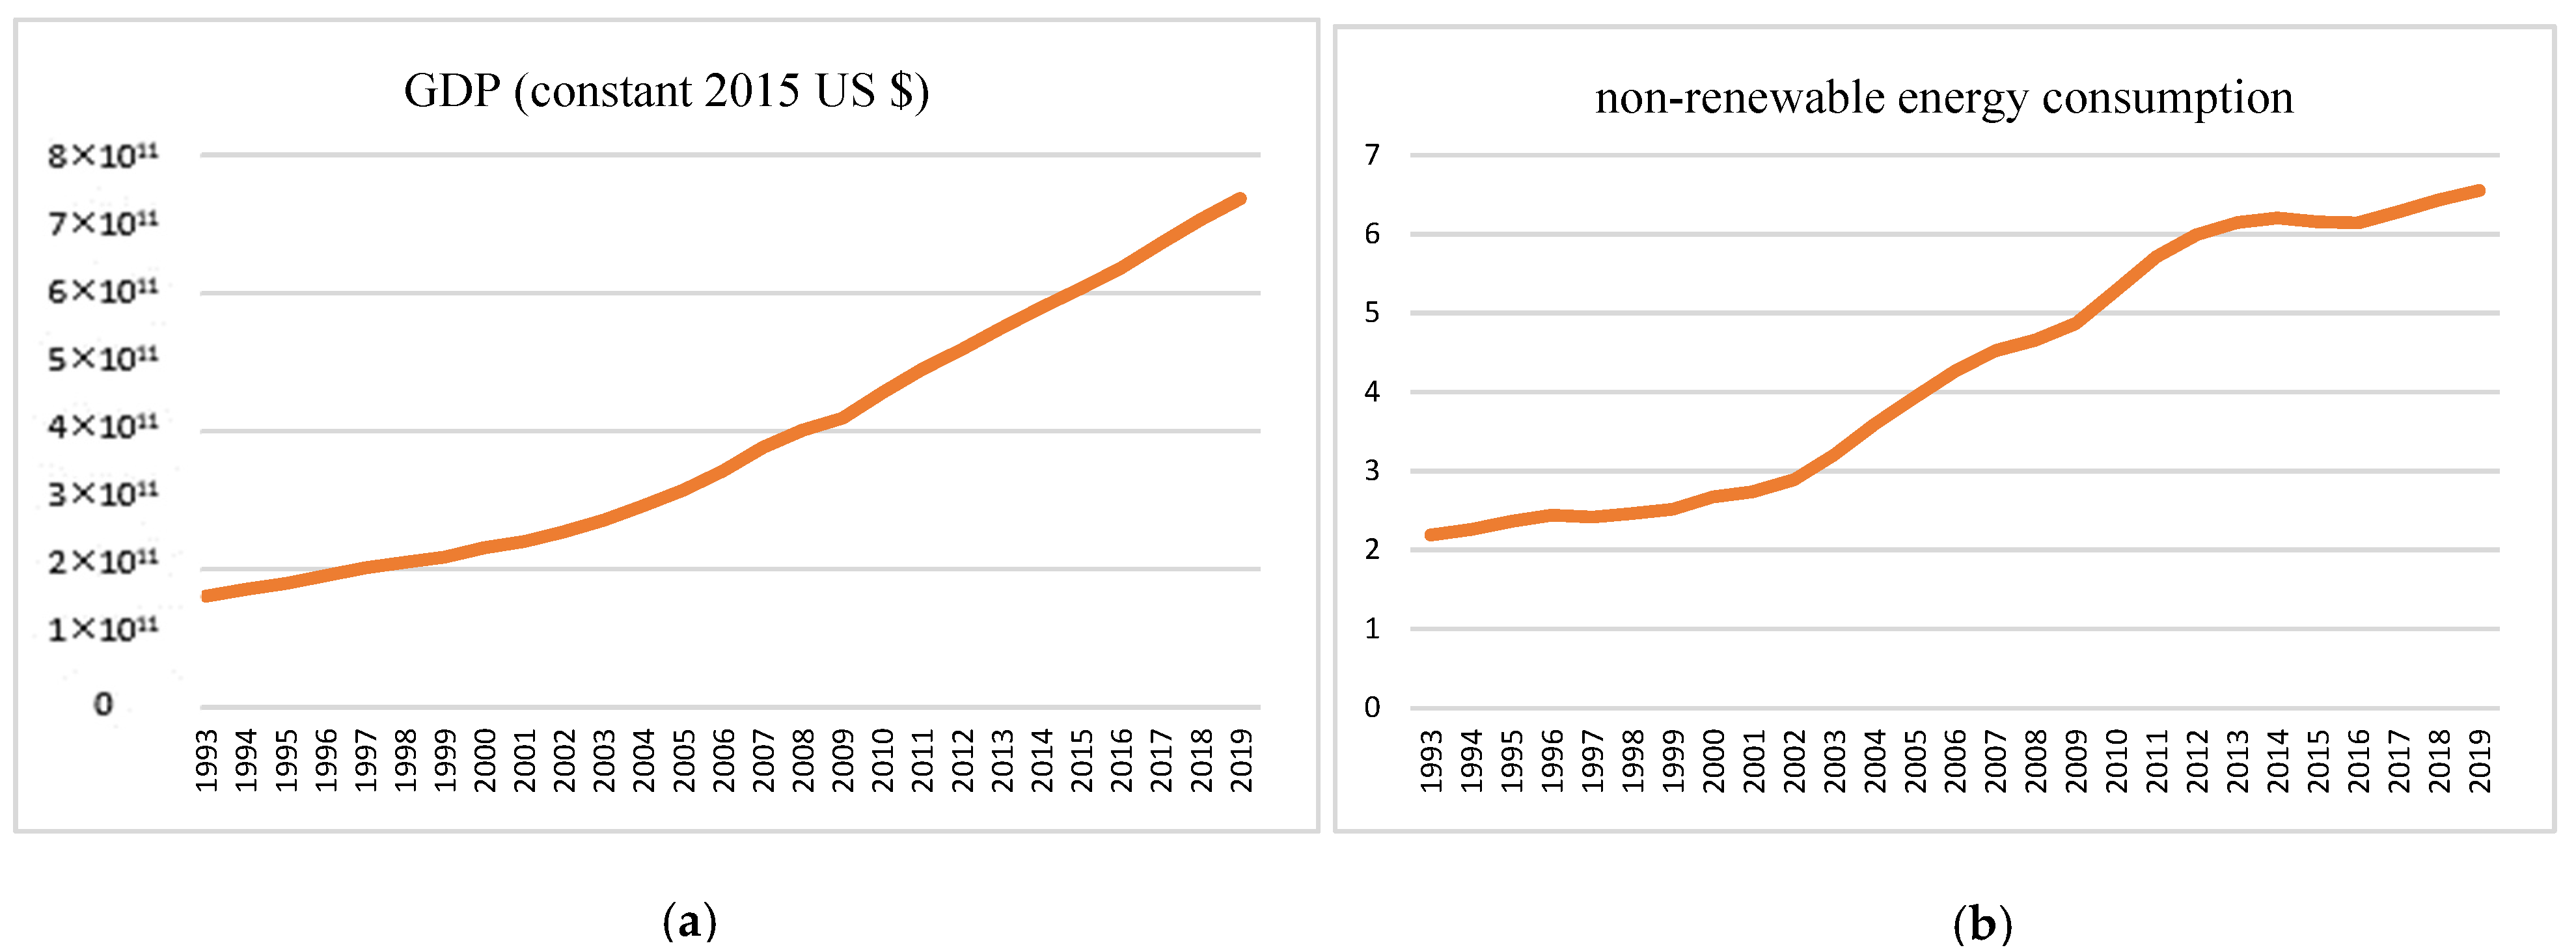
4. Results and Discussions

The descriptive statistics of variables are presented in Table 2. According to Table 2, in developing and developed countries lnGDP is positively correlated with lnK, lnL, LnRE, and LnNRE. To further investigate the relationship between variables, reliable statistical methods, such as co-integration and causality analysis, were tested for the exact examination of the relationship between the studied variables.
Before estimating the effects of renewable and non-renewable energy consumption on economic growth, some tests are necessary. First, to avoid any spurious regression problems, a unit root test is used for the stationary status of the variables. Since the results shown in Table 3 confirmed the existence of cross-sectional dependence (CD) between variables, traditional panel unit root tests developed under the independence assumption of the errors are invalid. A panel unit root test CD should be appropriate. Therefore, we used the cross-sectionally augmented IPS (CIPS) panel unit root test developed by [30]. In Table 4, the results of stationary tests for all variables are reported.
The results of panel unit root tests are presented in Table 4. The results indicate that all variables, except LRE in developed countries, are not stationary at their levels, but become stationary at their first differences at 1%, 5%, and 10% level of significance. Furthermore, in developing countries, only LRE and LL variables are not stationary at their level. This suggests that there is at least one co-integrating relationship between growth and all the explanatory variables. Hence, a long-run equilibrium relationship between the variables is possible. According to the results, we must check the co-integration relationship between the variables.
In this paper, the co-integration relationship between all variables is tested using Kao’s residual co-integration tests and the panel co-integration tests of Pedroni. The empirical results in developed and developing countries support the hypothesis of co-integration among all variables. Therefore, the empirical results confirm to the existence of a long-term equilibrium between real GDP, renewable energy use, non-renewable energy use, capital, and labor force (Table 5 and Table 6).
According to the Pedroni test results, three of the seven test statistics in developed countries support the co-integration relationship between lGDP, lK, lL, lRE, and lNRE, and the results of the Pedroni test in developing countries shows five of the seven test statistics are significant.
The Kao test results in both developed and developing countries support the hypothesis of co-integration among all variables.
After confirming the long-run relationship between the variables, the next step is to estimate this relationship. The FMOLS method was used, and the empirical findings are reported in Table 7. The results of panel FMOLS show that in developed countries, coefficients for lnRE, lnNRE, K, and lnL are positive and statistically significant at 1% level of significance. In addition, since all series are in logarithms, all estimated coefficients of the long-term relationship can be interpreted as long-run elasticity. The results show that a one percent increase in renewable energy consumption, non-renewable energy consumption, capital, and the labor force would increase GDP by 0.121, 0.201, 0.477, and 0.540 percent, respectively. Our empirical findings are like those of [11], which showed evidence for the significant and positive impact of renewable consumption on economic growth in the long term. Furthermore, studies showed the impact of both renewables and non-renewable energies on long-term economic growth [9]. The effect of the labor force variable on economic growth is high and significant, which indicates the high productivity of labor in developed countries.
According to Table 7, coefficients for lnRE, lnNRE, and lnK are positive and statistically significant at the 1% and lnL is positive and statistically significant at 5% in developing countries. Based on these results, a one percent increase in renewable energy consumption, non-renewable energy consumption, capital, and labor would increase lGDP by 0.042, 0.235, 0.195, and 0.283 percent, respectively. Therefore, there will be an increase in economic growth in these countries. In addition, compared to developed countries, the labor force has less impact on the economic growth of developing countries because despite the high level of inputs in these countries, their productivity is relatively lower.
Results of the short- and long-run ARDL estimation for developed countries are shown in Table 8. The results indicate that in the short-run and long-run, NRE will have a positive impact on economic growth in developed countries. It means that an increase in the NRE by 1% leads to an increase in economic growth by 0.456% in the long-run and by 0.078% in the short-run. The lag of error correction term (ECTt−1) represents the speed of adjustment of GDP to its long-run equilibrium following a shock. The coefficient of −0.105 is negative and significant at the 1% level. These results indicate the existence of a stable long-run relationship between LREC, LNRE, LK, LL, and LGDP. The same results suggest that a deviation from the long-run equilibrium level of real GDP in one year is corrected by 10.5% in the next year.
Results of the short- and long-run ARDL estimations for developing countries are shown in Table 9. The results indicate that coefficients for NRE in the short-run and long-run will have a positive and significant impact on economic growth in developing countries. It means that an increase in the NRE by 1% leads to an increase in economic growth by 0.042% in the short-run and 0.169% in the long-run. Furthermore, an increase in the RE by 1% leads to an increase in economic growth by 0.012% in the short run. The lag of error correction term (ECTt−1) is −0.240 and is significant at the 1% level. These results indicate the existence of a stable long-run relationship between LREC, LNRE, LK, LL, and LGDP. The results suggest that a deviation from the long-run equilibrium level of real GDP in one year is corrected by 24% in the next year.
The results of the heterogeneous panel causality test for the developed and developing countries are presented in Table 10. According to the results, there is a two-way causality relationship between lnK and lnGDP, between lnNRE and LnGDP, and a one-way relationship between LnGDP and LnRE, and LnGDP and LnL. These results support the conservation hypothesis between economic growth and renewable energy consumption, and the feedback hypothesis between non-renewable energy consumption and economic growth in developed countries.
The results of causality tests in developing countries show that all variables have a two-way causality with economic growth. These results support the feedback hypothesis between energy consumption (non-renewable and renewable) and economic growth.

5. Conclusions, Implications, and Limitations

5.1. Main Findings

One of the most important economic goals of all countries, especially developing countries, is to achieve high rates of economic growth. Energy, as one of the key factors of production, plays an important role in production and economic growth. The main objective of this study was to investigate the relationship between renewable and non-renewable energy consumption and economic growth using a panel data framework between developed and developing countries from 1993–2019. Experimental results of the Pedroni co-integration test provide proof for the existence of a long-term equilibrium between economic growth, energy consumption from renewable and non-renewable sources, labor, and capital. The parameters for this relationship are estimated by the panel FMOLS method developed by Pedroni. According to the estimation of long-term results, we conclude that renewable and non-renewable energy consumption have a positive and significant impact on economic growth in developed and developing countries.
The empirical result for the direction of the relationship between energy consumption (renewable and non-renewable) and economic growth is estimated by the panel causality analysis developed by [29], which showed that the conservation hypothesis supported economic growth and renewable energy consumption in developed countries. Our empirical findings are like those reported by [31] in Italy, which showed the causal flow from economic growth to energy consumption becomes dominant at lower scales (up to four years).
Furthermore, the feedback hypothesis supported energy consumption (renewable and non-renewable) and economic growth in developing countries. Our empirical findings are like those reported by [32] which showed evidence for the feedback link between non-renewable energy consumption and gross domestic product in Algeria.

5.2. Theoretical and Practical Implications

Based on our findings, the policy implications are addressed as follows. Considering that NREC plays an important role in causing pollution by emitting CO2, it is recommended to create a context for private sector investment in existing and planned renewable energy projects along with the management of economic activities. In addition to significantly reducing pollution, this approach can also improve the path of economic growth.
The empirical result showed that economic growth is a factor that supports energy consumption and, in this case, energy saving, and energy supply shocks do not affect economic growth in a negative way. Therefore, energy conservation is not a good way to influence economic growth in developed countries, but policies that lead to an increase in independent growth in these countries can have a more effective impact on the growth of these countries.
Energy consumption and economic growth are interdependent and complement each other in developing countries. On the one hand, growth feeds on energy consumption. On the other, a higher energy consumption is sponsored by increased economic growth. Consequently, energy-saving policies and energy supply shocks affect economic growth in a negative way, and accordingly, this negativity is reflected in energy consumption. Given the existence of a two-way relationship between energy consumption and economic growth in developing countries, the use of this input is one of the key factors affecting economic growth in these countries. Therefore, an increase economic growth will increase energy consumption, and increasing energy consumption will increase economic growth. As a result, energy policies, especially storage policies and reduced energy consumption, may pose a threat to economic growth in these countries. On the other hand, policies that lead to increased energy efficiency can eliminate the harmful effects of the inefficient increase in traditional energy sources. Therefore, it is necessary to take precautionary measures to curtail energy policies.
The limitations of the present study included missing observations and the non-availability of data due to the non-development of the renewable sector, especially in developing countries. Moreover, this study considered an aggregate of the total energy consumption. To gain a better understanding, future studies may study and compare energy consumption sources such as wind, solar, and hydropower in two groups of countries. It may help decision makers better understand the causality relationship between energy consumption and economic growth in specific sectors.

Author Contributions

Conceptualization, S.S. and H.M.; methodology, H.M. and B.Z.D.G.; software, H.M. and B.Z.D.G. validation, S.S., H.M. and B.Z.D.G.; formal analysis, H.M. and B.Z.D.G.; investigation, S.S., H.M. and B.Z.D.G.; resources, S.S. and H.M.; data curation, B.Z.D.G. and H.M.; writing—original draft preparation, S.S. and H.M.; writing—review and editing, S.S.; visualization, H.M. and B.Z.D.G.; supervision, S.S.; project administration, S.S. and H.M.; funding acquisition, S.S. All authors have read and agreed to the published version of the manuscript.

Funding

This research received no external funding.

Institutional Review Board Statement

Not applicable.

Informed Consent Statement

Not applicable.

Data Availability Statement

The data presented in this study are available on request from the corresponding authors. The data are not publicly available due to privacy concerns.

Acknowledgments

The authors would like to thank the editors and the reviewers. Sayed Saghaian acknowledges the support from the United States Department of Agriculture, National Institute of Food and Agriculture, Hatch project No. KY004063, under accession number 7002927.

Conflicts of Interest

The authors declare no conflict of interest.

Appendix A

Table A1. Countries in the sample.
Developed Countries
AustraliaGermanyNorwayUnited Kingdom
AustriaHong Kong SARNew ZealandChile
ArgentinaIrelandPortugalDenmark
BelgiumIcelandSpainItaly
CanadaJapanSwitzerlandRussian
FranceKorea, RepSwedenRomania
FinlandLuxembourgSingapore
GreeceNetherlandsUnited States
Developing Countries
AlbaniaCubaPanama
AlgeriaDominican RepublicPeru
ArmeniaEcuadorSri Lanka
AzerbaijanGeorgiaThailand
BelarusIran (Islamic Republic of)Trinidad and Tobago
BrazilLebanonTunisia
BulgariaMalaysiaTurkey
ChinaMauritiusUkraine
ColombiaMexicoUruguay
Costa RicaMongolia

References

  1. Hasanov, F.; Bulut, C.; Suleymanov, E. Review of energy-growth nexus: Panel analysis for ten Eurasian oil exporting countries. Renew. Sustain. Energy Rev. 2017, 73, 369–386. [Google Scholar] [CrossRef]
  2. Ahmed, M.; Azam, M. Causal nexus between energy consumption and economic growth for high-, middle- and low-income countries using frequency domain analysis. Renew. Sustain. Energy Rev. 2016, 60, 653–678. [Google Scholar] [CrossRef]
  3. Mulugetta, Y.; Ben Hagan, E.; Kammen, D. Energy access for sustainable development. Env. Res. Lett. 2019, 14, 020201. [Google Scholar] [CrossRef] [Green Version]
  4. Ellabban, O.; Abu-Rub, H.; Blaabjerg, F. Renewable energy resources: Current status, future prospects and their enabling technology. Renew. Sustain. Energy Rev. 2014, 39, 748–764. [Google Scholar] [CrossRef]
  5. Aslan, A.; Apergis, N.; Yildirim, S. Causality between energy consumption and GDP in the US: Evidence from wavelet analysis. Front. Energy 2014, 8, 1–8. [Google Scholar] [CrossRef]
  6. Marques, A.C.; Fuinhas, J.A. Is renewable energy effective in promoting growth? Energy Policy 2012, 46, 434–442. [Google Scholar] [CrossRef]
  7. Sadorsky, P. Renewable energy consumption and income in emerging economies. Energy Policy 2009, 37, 4021–4028. [Google Scholar] [CrossRef]
  8. Energy Information Administration, EIA. Available online: http://www.eia.gov/todayinenergy/detail.cfm?Id=3270 (accessed on 12 December 2017).
  9. Kahia, M.; Aïssa, M.S.B.; Lanouar, C. Renewable and non-renewable energy use-economic growth nexus: The case of MENA Net Oil Importing Countries. Renew. Sustain. Energy Rev. 2017, 71, 127–140. [Google Scholar] [CrossRef]
  10. Apergis, N.; Payne, J.E. Renewable, and non-renewable energy consumption-growth nexus: Evidence from a panel error correction model. Energy Econ. 2012, 34, 733–738. [Google Scholar] [CrossRef]
  11. Koçak, E.; Şarkgüneşi, A. The renewable energy and economic growth nexus in Black Sea and Balkan countries. Energy Policy 2017, 100, 51–57. [Google Scholar] [CrossRef]
  12. Owusu Appiah, M. Investigating the multivariate Granger causality between energy consumption, economic growth and CO2 emissions in Ghana. Energy Policy 2018, 112, 198–208. [Google Scholar] [CrossRef]
  13. Mutascu, M. A bootstrap panel Granger causality analysis of energy consumption and economic growth in the G7 countries. Renew. Sustain. Energy Rev. 2016, 63, 166–171. [Google Scholar] [CrossRef]
  14. Salim, R.A.; Rafiq, S. Why do some emerging economies proactively accelerate the adoption of renewable energy? Energy Econ. 2012, 34, 1051–1057. [Google Scholar] [CrossRef]
  15. Tang, C.F.; Tan, E.C. Exploring the nexus of electricity consumption, economic growth, energy prices and technology innovation in Malaysia. Appl. Energy 2013, 104, 297–305. [Google Scholar] [CrossRef]
  16. Espoir, D.K.; Sunge, R.; Bannor, F. Economic growth, renewable and nonrenewable electricity consumption: Fresh evidence from a panel sample of African countries. Energy Nexus 2023, 9, 100165. [Google Scholar] [CrossRef]
  17. Bhattacharya, M.; Paramati, S.R.; Ozturk, I.; Bhattacharya, S. The effect of renewable energy consumption on economic growth: Evidence from top 38 countries. Appl. Energy 2016, 162, 733–741. [Google Scholar] [CrossRef]
  18. Bilgili, F. Business cycle co-movements between renewables consumption and industrial production: A continuous wavelet coherence approach. Renew. Sustain. Energy Rev. 2015, 52, 325–332. [Google Scholar] [CrossRef]
  19. Adams, S.; Klobodu, E.K.M.; Opoku, E.E.O. Energy consumption, political regime, and economic growth in sub-Saharan Africa. Energy Policy 2016, 96, 36–44. [Google Scholar] [CrossRef]
  20. Rafindadi, A.A.; Ozturk, I. Impacts of renewable energy consumption on the German economic growth: Evidence from combined cointegration test. Renew. Sustain. Energy Rev. 2017, 75, 1130–1141. [Google Scholar] [CrossRef]
  21. Atems, B.; Hotaling, C. The effect of renewable and nonrenewable electricity generation on economic growth. Energy Policy 2018, 112, 111–118. [Google Scholar] [CrossRef]
  22. Pinzon, K. Dynamics between energy consumption and economic growth in Ecuador: A granger causality analysis. Econ. Anal. Policy 2018, 57, 88–101. [Google Scholar] [CrossRef] [Green Version]
  23. AlKhars, M.; Miah, F.; Qudrat-Ullah, H.; Kayal, A. A Systematic Review of the Relationship between Energy Consumption and Economic Growth in GCC Countries. Sustainability 2020, 12, 3845. [Google Scholar] [CrossRef]
  24. Guler, H.; Haykır, O.; Oz, S. Does the electricity consumption and economic growth nexus alter during COVID-19 pandemic? Evidence from European countries. Electr. J. 2021, 35, 107144. [Google Scholar] [CrossRef]
  25. Azam, M.; Rafiq, M.; Shafique, H.; Zhang, M.; Ateeq, J. Analyzing the relationship between economic growth and electricity consumption from renewable and non-renewable sources: Fresh evidence from newly industrialized countries. Sustain. Energy Technol. 2020, 44, 100991. [Google Scholar] [CrossRef]
  26. Ghaseminejad Raeeni, A.A.; Hosseini, S.; Moghaddasi, R. How energy consumption is related to agricultural growth and export: An econometric analysis on Iranian data. Energy Rep. 2019, 5, 50–53. [Google Scholar] [CrossRef]
  27. Zhang, L.; Pang, J.; Chen, X.; Lu, Z. Carbon emissions, energy consumption and economic growth: Evidence from the agricultural sector of China’s main grain-producing areas. Sci. Total Environ. 2019, 665, 1017–1025. [Google Scholar] [CrossRef] [PubMed]
  28. Shahbaz, M.; Zeshan, M.; Afza, T. Is energy consumption effective to spur economic growth in Pakistan? New evidence from bounds test to level relationships and Granger causality tests. Econ. Model. 2012, 29, 2310–2319. [Google Scholar] [CrossRef] [Green Version]
  29. Dumitrescu, E.I.; Hurlin, C. Testing for Granger non-causality in heterogeneous panels. Econ. Model. 2012, 29, 1450–1460. [Google Scholar] [CrossRef] [Green Version]
  30. Pesaran, M.H. A simple panel unit root test in the presence of cross-section dependence. J. Appl. Econom. 2007, 22, 265–312. [Google Scholar] [CrossRef] [Green Version]
  31. Magazzino, C.; Mutascu, M.; Mele, M.; Asumadu Sarkodie, S. Energy consumption and economic growth in Italy: A wavelet analysis. Energy Rep. 2021, 7, 1520–1528. [Google Scholar] [CrossRef]
  32. Amri, F. The relationship amongst energy consumption (renewable and nonrenewable), and GDP in Algeria. Renew. Sustain. Energy Rev. 2017, 76, 62–71. [Google Scholar] [CrossRef]
Figure 1. (a) GDP (constant 2015 US $) for developed countries from 1993–2019; (b) non-renewable energy consumption in quadrillion Btu for developed countries from 1993–2019.
Sustainability 15 03822 g001
Figure 2. (a) GDP (constant 2015 US $) for developing countries from 1993–2019; (b) non-renewable energy consumption in quadrillion Btu for developing countries from 1993–2019.
Sustainability 15 03822 g002
Table 1. Description of variables and their source.
VariableDescriptionUnitSource
GDPGross Domestic ProductConstant 2015 US DollarsWorld Bank
KGross fixed capital formationConstant 2015 US DollarsWorld Bank
LTotal population aged 15 and older who supply labor for the production of goods and services-World Bank
RERenewable energy consumptionquadrillion BtuEIA
NRENon-renewable energy consumptionquadrillion BtuEIA
Table 2. Descriptive statistics and correlation matrix for variables.
Developed Countries
Descriptive StatisticsLnLLnKLnGDPLnNRELnRE
Mean15.83630.00226.9050.823−1.368
Median15.52729.81226.7110.497−1.306
Maximum18.92933.66830.6234.5472.439
Minimum11.90425.68122.775−3.477−5.357
Std. Dev.1.5001.4161.4031.5961.537
Observations810810810810810
LnGDP 1
LnK 10.991
LnL10.8990.911
LnRE0.6610.6420.667 1
LnNRE0.9550.9260.93210.594
Developing Countries
Mean15.62728.06424.943−3.195−0.438
Median15.38327.72024.683−2.987−0.733
Maximum20.50034.04830.2912.8734.898
Minimum13.05523.24121.730−10.176−3.875
Std. Dev.1.6031.7551.6732.2401.733
Observations783783783783783
LnGDP 1
LnK 10.981
LnL10.9160.925
LnRE0.8900.8810.882 1
LnNRE0.7690.7180.73210.539
Table 3. Pesaran’s test and Frees’ test of cross-sectional independence.
Developed Countries
TestStatisticProbability
Pesaran (CD)103.427 ***0.0000
Friedman730.086 ***0.0000
Frees26.720 ***Critical values from Frees’ Q distribution
alpha = 0.10: 0.1035
alpha = 0.05: 0.1350
alpha = 0.01: 0.1947
Developing Countries
TestStatisticProbability
Pesaran (CD)45.893 ***0.0000
Friedman320.158 ***0.0000
Frees10.479Critical values from Frees’ Q distribution
alpha = 0.10: 0.1124
alpha = 0.05: 0.1470
alpha = 0.01: 0.2129
Notes: CD-test has N (0, 1) distribution, under H0: cross-sectional independence. *** represents significance levels of 1%.
Table 4. Panel unit root test results for developed and developing countries, 1993–2019.
Developed Countries
VariableStatisticCIPS
Critical Values
10%5%1%
LGDP−1.829−2.07−2.15−2.3
LRE−2.809 ***
LNRE−1.454
LK−1.515
LL−1.768
∆LGDP−3.382 ***
∆LRE−5.381 ***
∆LNRE−5.295 ***
∆LK−3.514 ***
∆LL−3.808 ***
Developing Countries
VariableStatisticCIPS
Critical Values
10%5%1%
LGDP−2.437 ***−2.07−2.15−2.3
LRE−1.513
LNRE−2.144 ***
LK−2.359 ***
LL−1.110
∆LGDP−3.713 ***
∆LRE−4.547 ***
∆LNRE−4.653 ***
∆LK−4.257 ***
∆LL−3.487 ***
All variables are in natural logarithms. *** represents significance levels of 1%, respectively. CIPS test assumes cross-sectional dependence in the form of a single, unobserved common factor, and the null hypothesis in the series is I (1).
Table 5. Pedroni co-integration tests for developed and developing countries, 1993–2019.
Developed Countries
Within-DimensionBetween-Dimension
StatisticProbStatisticProb.
Panel v-Statistic6.290 ***0.0000
Panel rho-Statistic2.0110.97793.5970.999Group rho-Statistic
Panel PP-Statistic−2.888 ***0.0019−2.581 ***0.0049Group PP-Statistic
Panel ADF-Statistic−1.0170.1545−0.7400.229Group ADF-Statistic
Developing Countries
Panel v-Statistic5.196 ***0.0000
Panel rho-Statistic−0.8090.2093.7840.999Group rho-Statistic
Panel PP-Statistic−8.267 ***0.0000−1.694 ***0.045Group PP-Statistic
Panel ADF-Statistic−3.971 ***0.00001.950 ***0.974Group ADF-Statistic
Notes: null hypothesis: no co-integration. Trend assumption: deterministic intercept and trend. Lag selection: automatic SIC with a max lag of three. Newey–West bandwidth selection with Bartlett kernel is used. *** designates the significance at the 1% significance level.
Table 6. Kao co-integration test for developed and developing countries, 1993–2019.
Developed Countries
t-StatisticProb.
ADF−4.6844 ***0.0000
Residual variance0.000627
HAC variance0.000716
Developing Countries
t-StatisticProb.
ADF−5.219 ***0.0000
Residual variance0.002
HAC variance0.002
Notes: null hypothesis: no co-integration. Trend assumption: no deterministic trend. Automatic lag selection based on SIC with max lag of five. *** designates the significance at the 1% significance level.
Table 7. Parameter estimation using FMOLS for developed and developing countries, 1993–2019.
Developed Countries
VariableCoefficientt-StatisticProb
LnRE0.121 ***8.7890.0000
LnNRE0.201 ***4.7260.0000
LnK0.477 ***22.6600.0000
LnL0.540 ***7.5500.0000
Developing Countries
LnRE0.042 ***10.5920.0001
LnNRE0.235 ***56.2930.0000
LnK0.195 ***8.8140.0000
LnL0.283 **−23.5210.0230
Notes: *** designates the significance at the 1% significance level. Designates the significance at the 5% significance level.
Table 8. Long- and short-run estimates for developed countries. Selected model: ARDL (1, 2, 2, 2).
Long-Run Analysis
VariableCoefficient.Standard ErrorT-Statisticp-Values
LnRE0.187 ***0.00920.5880.0000
LnNRE0.456 ***0.04110.9270.0000
LnK0.254 ***0.01417.6020.0000
LnL0.166 **0.0871.9090.0567
Short-Run Analysis
Constant1.771 ***0.5323.3230.0010
∆ LnRE0.0100.0081.1750.240
∆ LnRE(−1)−0.0150.013−1.2140.224
∆ LnNRE0.078 **0.0312.5280.011
∆ LnNRE(−1)0.047 **0.0232.0650.039
∆ LnK0.230 ***0.0259.2000.0000
∆ LnK(−1)−0.0140.011−1.2670.205
∆ LnL0.0880.1040.8500.395
∆ LnL(−1)−0.0190.097−0.1990.842
ECT(−1)−0.105 ***0.031−3.3050.0010
Notes: *** designates the significance at the 1% significance level. ** designates the significance at the 5% significance level.
Table 9. Long- and short-run estimates for developing countries. Selected model: ARDL (1, 1, 1, 1).
Long-Run Analysis
VariableCoefficient.Standard ErrorT-Statisticp-Values
LnRE0.0150.0101.5270.1273
LnNRE0.169 ***0.0218.0220.0000
LnK0.267 ***0.00927.8710.0000
LnL0.296 ***0.0417.2280.0000
Short-Run Analysis
Constant3.063 ***0.6025.0850.0000
∆ LnRE0.012 **0.0061.9010.057
∆ LnNRE0.042 **0.0202.0500.040
∆ LnK0.101 ***0.0195.3470.0000
∆ LnL−0.2220.281−0.7900.429
trend0.005 ***0.0013.5210.0005
ECT(−1)−0.240 ***0.047−5.0100.0000
Notes: *** designates the significance at the 1% significance level. ** designates the significance at the 5% significance level.
Table 10. Heterogeneous panel causality test results for developed and developing countries.
Developed Countries Developing Countries
Wald-StatProb. Wald-StatProb.
LnK→LnGDP3.995 ***0.0000 LnK→LnGDP3.713 ***0.0000
LnGDP→LnK8.123 ***0.0000 LnGDP→LnK2.837 ***0.0000
LnL→LnGDP2.7160.275 LnL→LnGDP4.249 ***0.0000
LnGDP→LnL7.578 ***0.0000 LnGDP→LnL2.679 ***0.0000
LnRE→LnGDP2.5720.439 LnRE→LnGDP2.061 ***0.0000
LnGDP→LnRE4.523 ***0.0000 LnGDP→LnRE4.931 ***0.0000
LnNRE→LnGDP3.188 ** 0.033 LnNRE→LnGDP3.558 ***0.0018
LnGDP→LnNRE6.517 ***0.0000 LnGDP→LnNRE4.102 ***0.0000
Notes: “→” means the direction of the causality relationship. *** illustrates 1% statistical significance. ** illustrates 5% statistical significance.
Disclaimer/Publisher’s Note: The statements, opinions and data contained in all publications are solely those of the individual author(s) and contributor(s) and not of MDPI and/or the editor(s). MDPI and/or the editor(s) disclaim responsibility for any injury to people or property resulting from any ideas, methods, instructions or products referred to in the content.

