


Abstract
Oil monitoring for wind turbine gearboxes can reflect wear and lubrication conditions, and better identify pits on the tooth surface, fatigue wear, and other early faults. However, oil monitoring with one or several single predicting models brings inaccuracy due to the intrinsic merits and demerits of the models. In this work, oil monitoring and fault pre-warning of wind turbine gearboxes were studied based on oil inspection data of three wind turbines that have been working continuously for 3.5 years. The Grey Model (GM) and the Double Exponential Smoothing (DES) were combined by a modified inverse-variance weighting method proposed in this work, which used relative errors to calculate weight coefficients, reducing the errors and improving the accuracy as a whole. The predicted data were compared with the measured data to verify the predicting accuracy. Subsequently, a statistical method and linear regression method were adopted to jointly develop a pre-warning threshold for the oil inspection data. Comparing the predicted data with the threshold, the results showed that one of the wind turbines was in a warning state. The prediction was validated by an endoscope inspection of the gearbox, which found that some parts were slightly worn.
1. Introduction
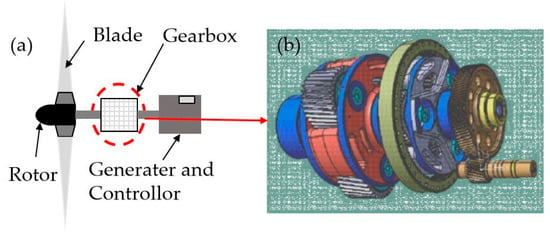
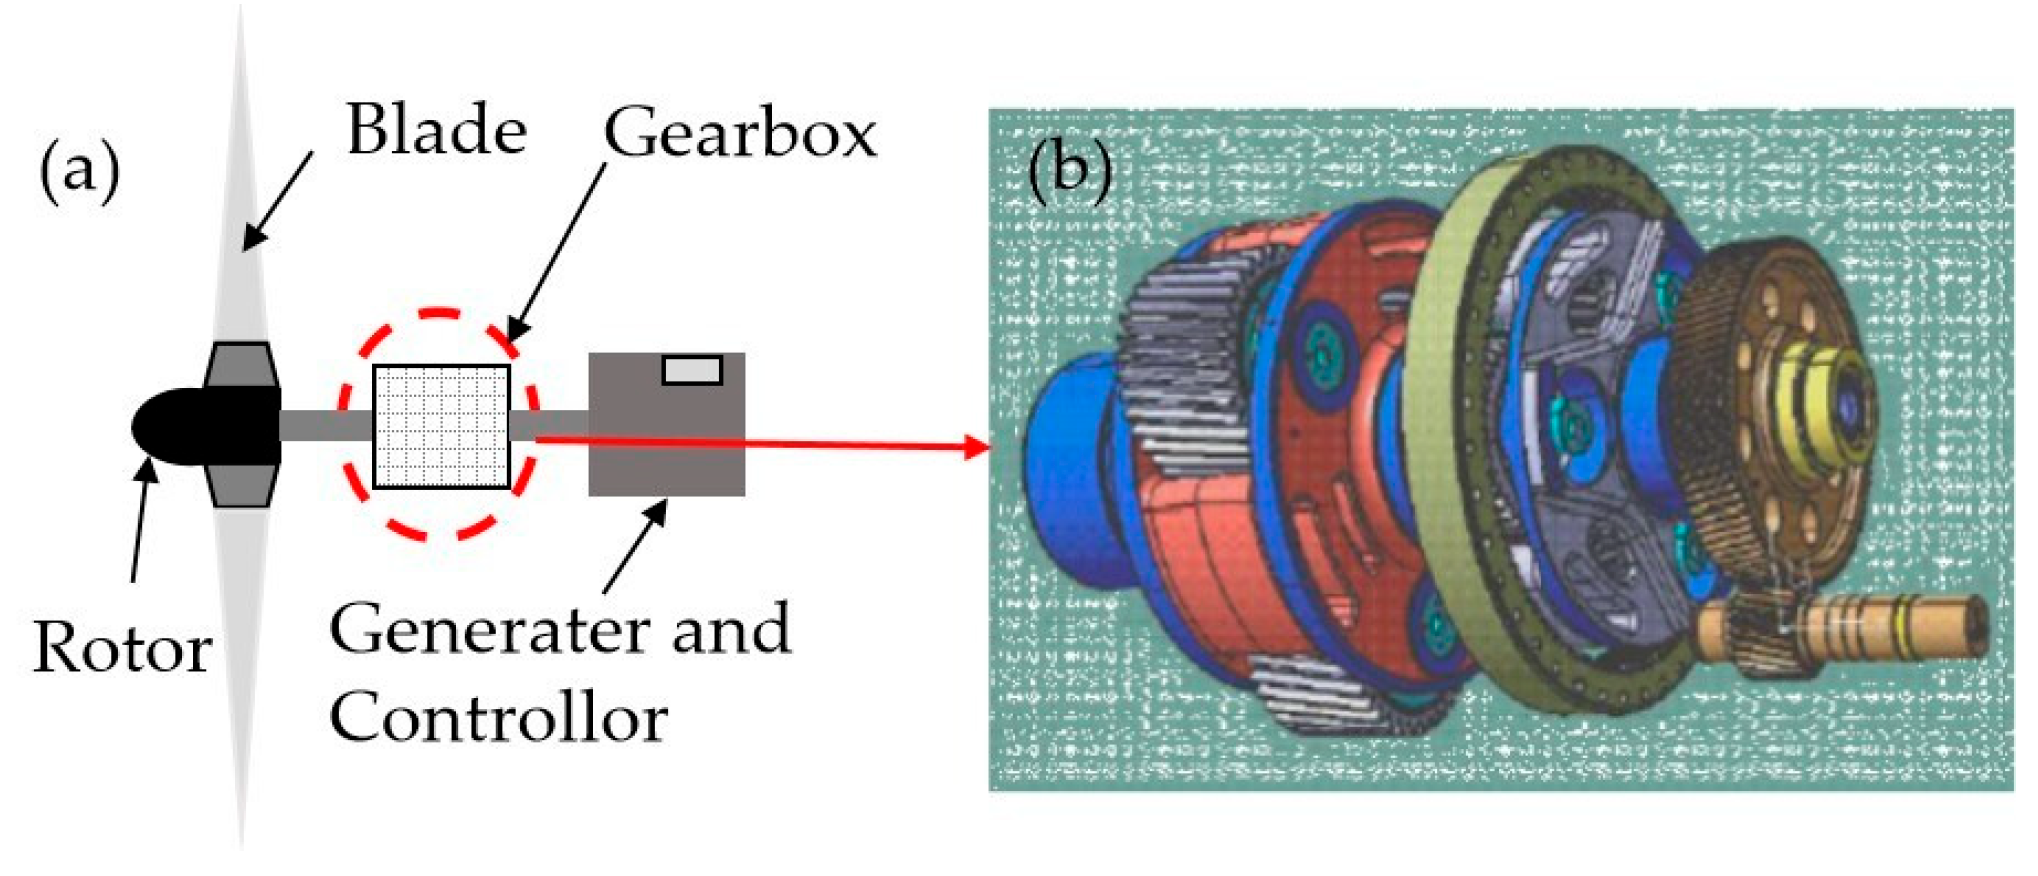
Wind energy is a clean energy that has been increasingly utilized by many countries to achieve carbon neutrality. Wind electricity generation reached a record of 273 TWh in 2021 with 17% growth, and the increasing trend continues [1]. A diagram of a wind turbine gearbox is shown in Figure 1. The gearbox transmits mechanical energy generated by the wind turbine blades to the generator for power generation. It is the core device for power transmission in a wind turbine. Once the gearbox fails, the whole wind turbine will not function properly because of a chain reaction [2]. It is estimated that 60% of mechanical equipment failure or fault is related to gear failure [3]. Among all the typical wind turbine faults, gearbox failure takes a proportion of 4% [4]. In addition, most wind turbines are built in high mountains, wilderness, islands, offshore, and other harsh natural environments where maintenance is extremely difficult [5]. Therefore, it is significant and necessary to carry out state monitoring and fault warning of wind turbine gearboxes and to pay close attention to their operating conditions.
Figure 1.
Gearbox of a wind turbine. (a) key parts of a wind turbine; (b) a wind turbine gearbox.
Under such circumstances, many monitoring systems with diagnostic algorithms have been developed, such as WP4086 developed by Denmark Mita-Teknik, which applied frequency domain techniques to process the signals [6]. In comparison, SKF WindCon3.0 developed by Sweden SKF used both time and frequency domain signal processes to monitor the conditions [7]. Some prediction methods can be applied to tell whether the gearbox is in good condition. The method can be classified into four categories: physics-based prognostic method, AI-based prognostic method, stochastic-based prognostic techniques, and combined prognostic techniques [8]. The method can be also briefly categorized into model-based prognosis, data-driven prognosis, and hybrid prognosis [4]. Some research cases with different methods are introduced in Table 1.
Table 1.
Research cases with different methods on wind turbine gearbox prognosis.
Most of the above prognoses and predictions paid attention to the bearing of the gearbox, which differs from the prediction of the gear’s condition. Offline detection and analysis of the wind turbine gearbox oil is the main technical way to evaluate the current lubrication and wear state of the gears in a gearbox. The operation of the wind turbine gearbox has its own characteristics, namely the variable speed and variable load due to the unstable wind [20]. In addition, the cost of a single wind turbine is less than thermal power or hydropower units. The installation of an online monitor system needs to consider and balance its performance, accuracy, and cost. In comparison, offline detection, such as sampling oil detection, is not restricted by the space for monitoring system installation or expensive online sensors [21,22].
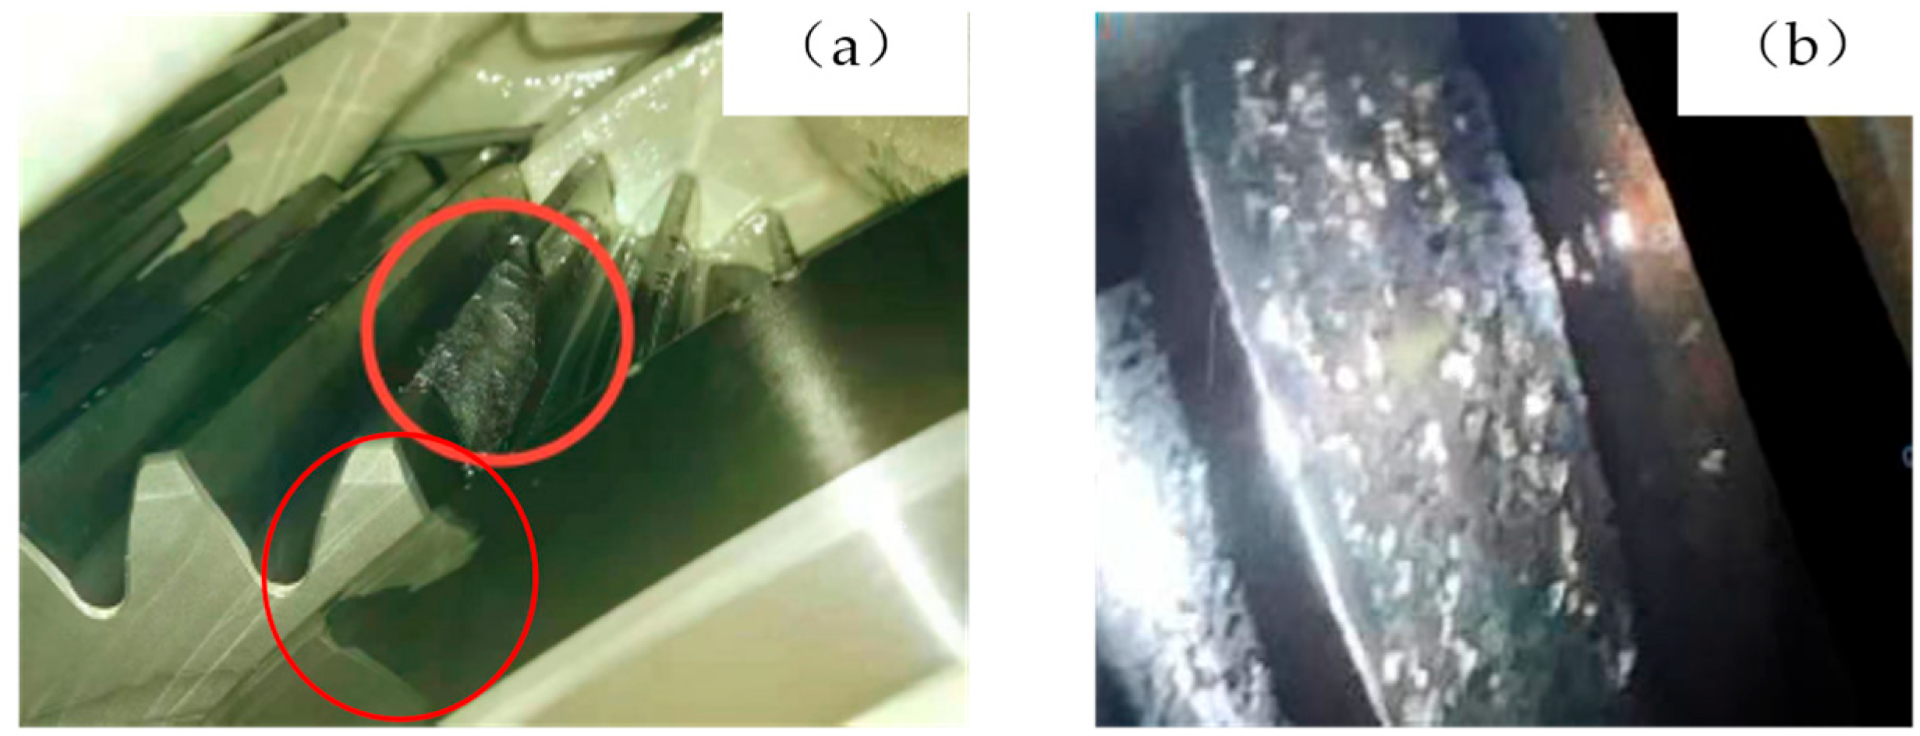
As shown in Figure 2, two main types of gear failures, tooth fracture and pitting erosion, can generate metal particles contaminating lubrication oil. At the same time, the performance of the lubricating oil also directly affects the lubrication and wear state of the gearbox. Therefore, regular sampling and analyzing the lubricating oil’s particle concentration changing trend and physical and chemical performance can reflect the change in the running conditions of the wind turbine gearbox. It is conducive to the early detection of abnormal equipment operation.
Figure 2.
The failure of gears: (a) tooth fracture; (b) pitting erosion.
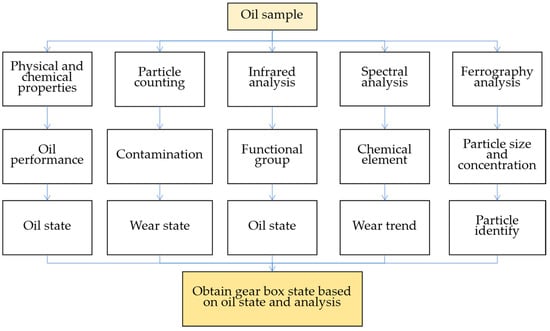
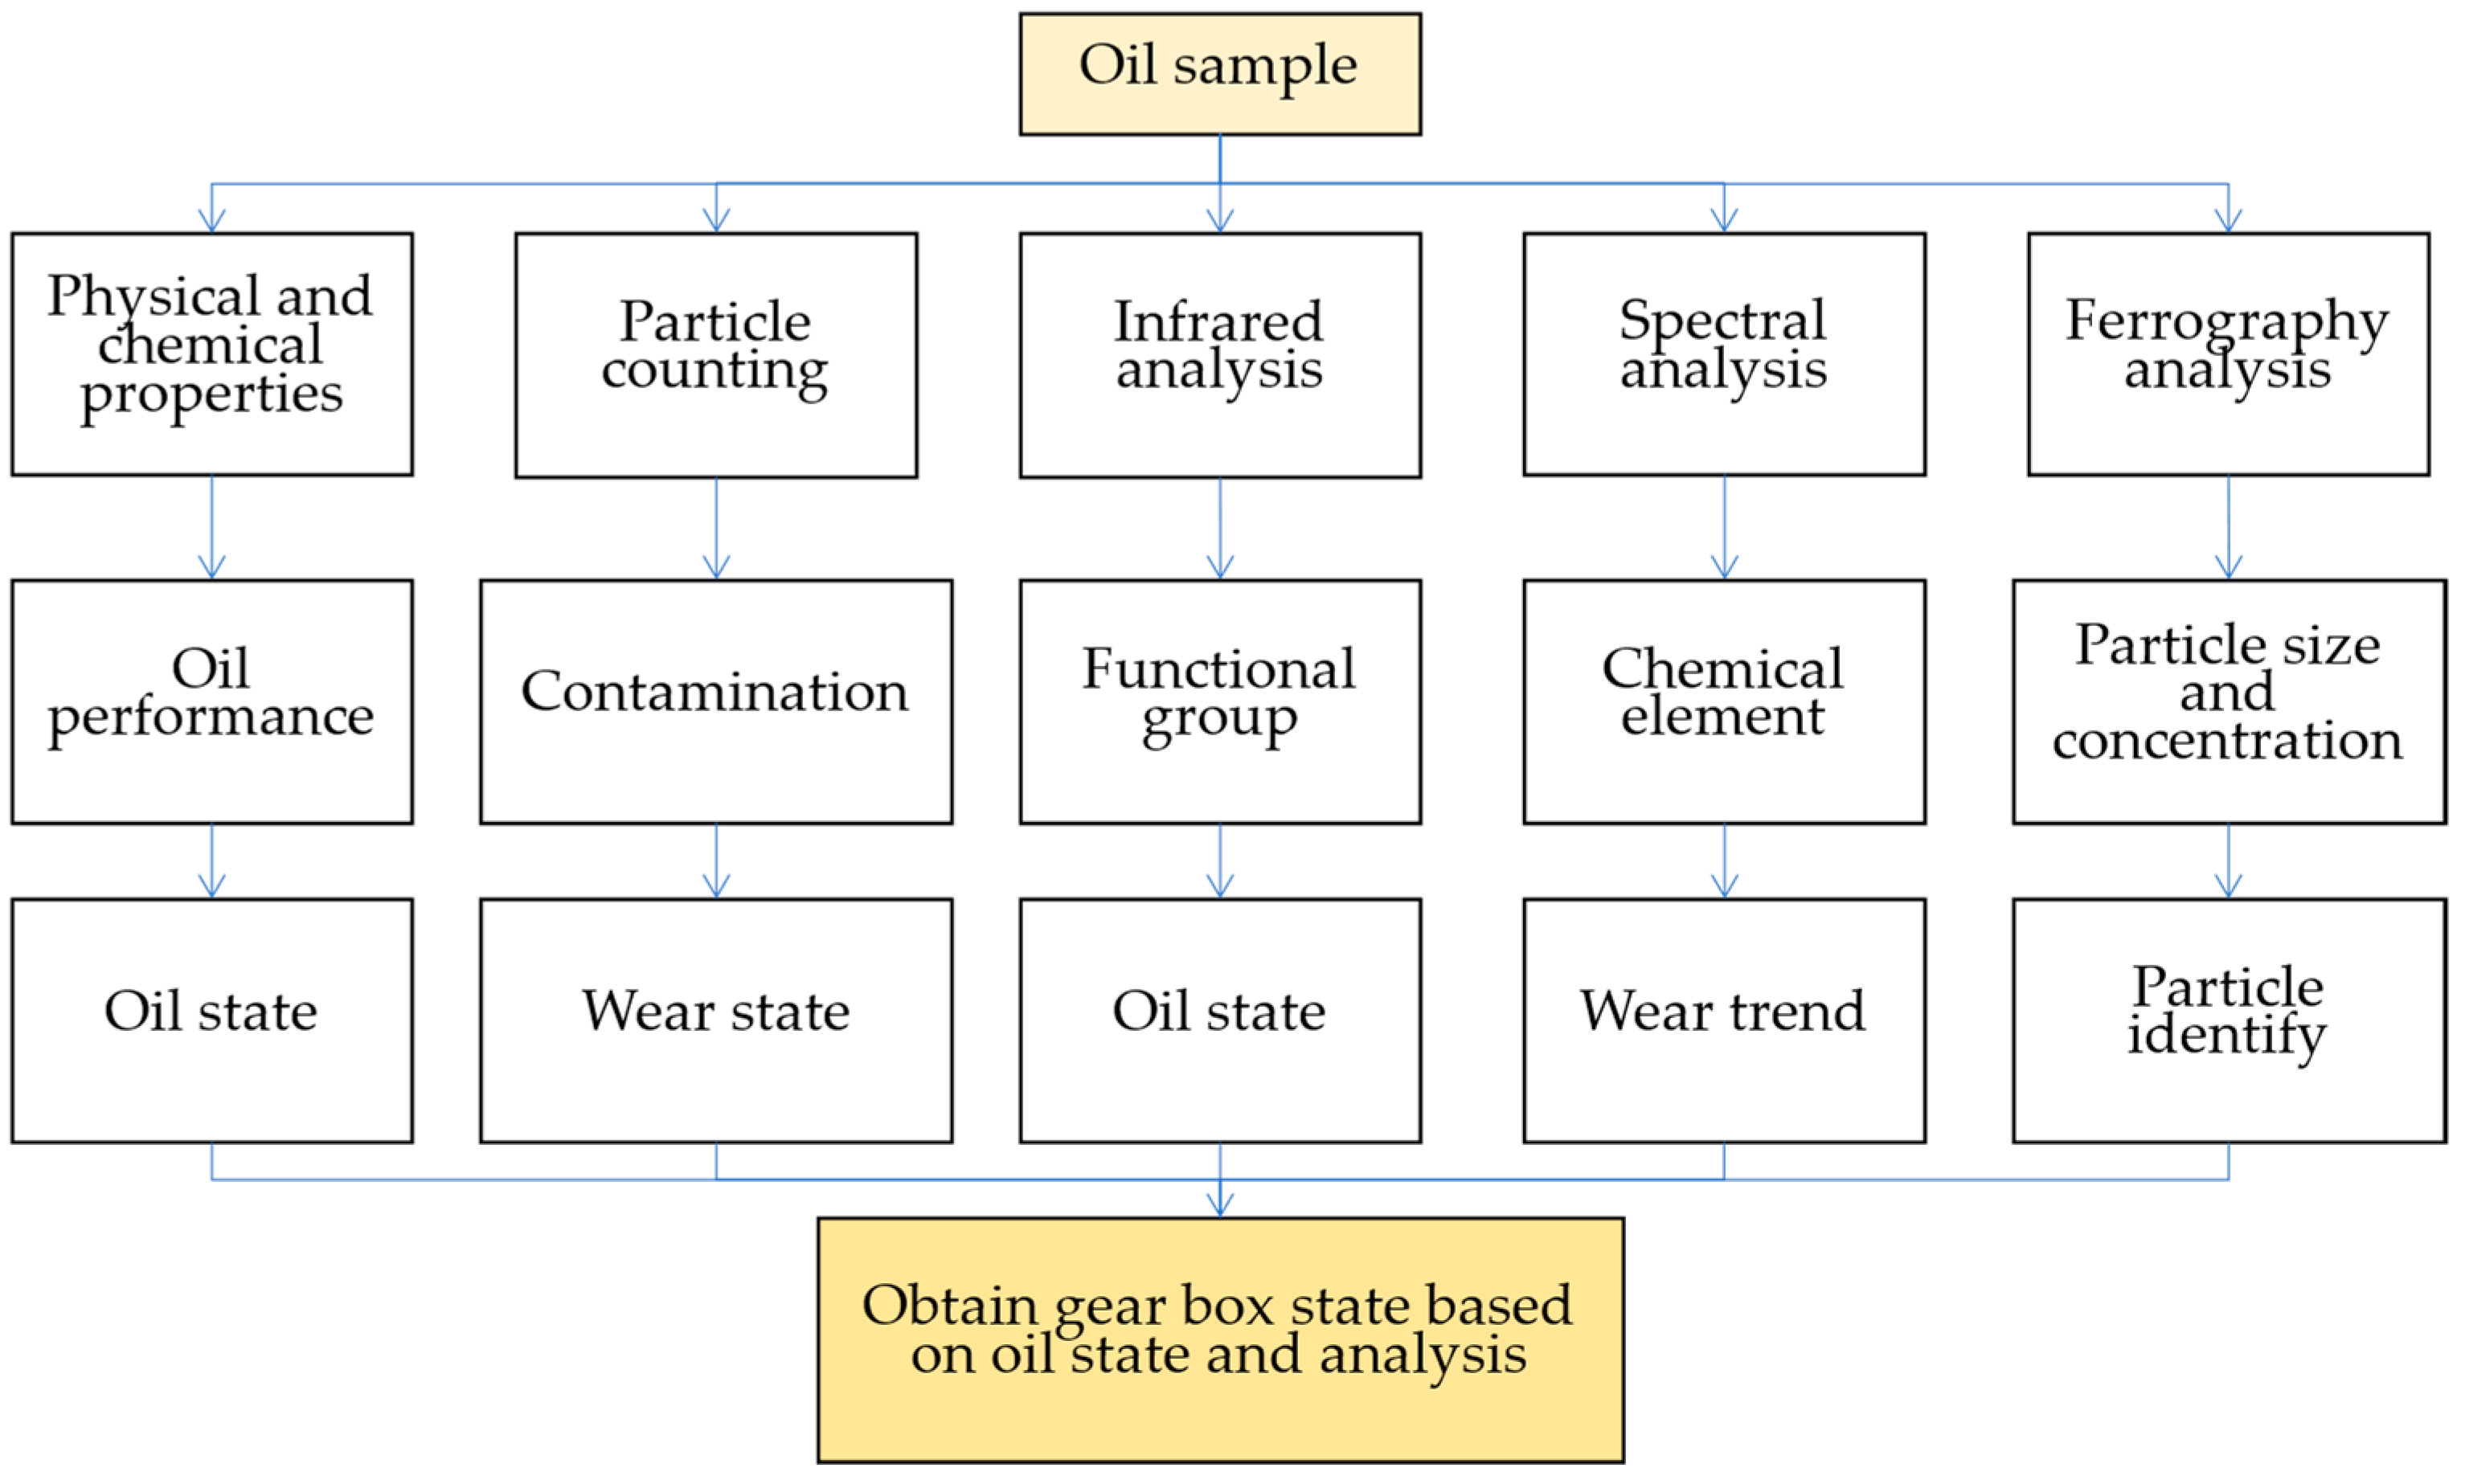
Oil analysis includes many aspects, such as physical properties, particle counting, infrared analysis, spectral analysis, and ferrography analysis. The details of these aspects are shown in Figure 3. Depending on the requirement, some aspects will be chosen to conduct corresponding tests under test standards.
Figure 3.
Main contents of oil testing.
With the test data, some prediction models can be applied to evaluate the gear conditions. The first-order Grey Model of one variable (GM (1,1)) is one of the popular predicting methods with its ability to predict based on partially known parameters [23]. The Grey Model, proposed by Deng [24], in 1982, is particularly suitable for short-term forecasting uncertain problems with small samples. The GM (1,1) has been applied together with the wavelet packet de-noising method to successfully predict the oil temperature of a wind turbine gearbox [25]. The GM (1,1) was also combined with other predicting models by variable weights to predict the oil temperature of a wind turbine gearbox [26].
In addition, the exponential smoothing method was also popular in prediction [27]. It was successfully applied to wind speed forecasts in wind farms by importing an adaptive dynamic cubic exponential smoothing model [28]. The proposed model was verified to have more stability by comparing it with the traditional cubic exponential smoothing and grey prediction model.
This work aims to predict the oil properties of wind turbine gearboxes and to pre-warn the failure of gears. The combined method proposed by Bates and Granger [29] shows many advantages and it was implemented in this study. The GM (1,1) and Double Exponential Smoothing (DES) were combined by the reciprocal method of variance. Different from other methods in calculating the weight of each prediction with absolute error, the relative errors were applied to achieve more accuracy. Then, a statistical method and a linear regression method were used to formulate the pre-warning threshold. The method was applied for state monitoring and fault pre-warning on wind turbines in a wind farm. The effectiveness and practicability were verified by successful fault pre-warning compared with the endoscope inspection results of gears.
The paper was structured as follows. Firstly, the tested parameters for the gearbox oil and their values were presented. Then, the critical parameters were chosen to carry out prediction and pre-warming. With the chosen parameters, in the Section 3, the prediction model and pre-warning model were developed. Subsequently, the prediction and pre-warning results were demonstrated and validated. In the end, conclusions were made from this study.
2. Materials and Data
This study chose oil sampled from 3 wind turbines with possible problematic situations that have been operating for 3.5 consecutive years in an inland wilderness wind farm. The oil was sampled every 6 months and the oil filter was replaced every 12 months. Each time 100 mL to 200 mL gearbox oil was sampled to test the viscosity, acid value, contamination degree, and spectral elements, under the standards shown in Table 2.
Table 2.
Test standards.
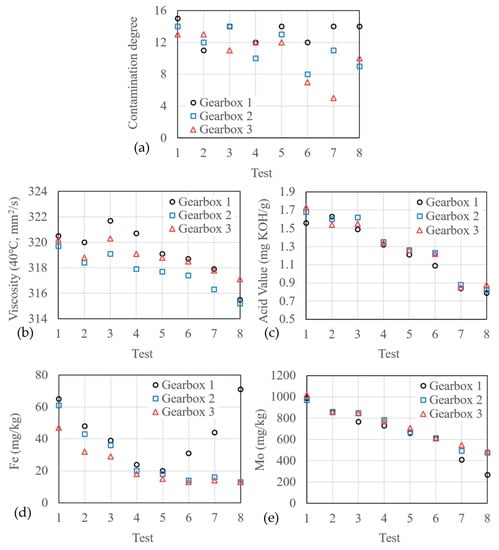
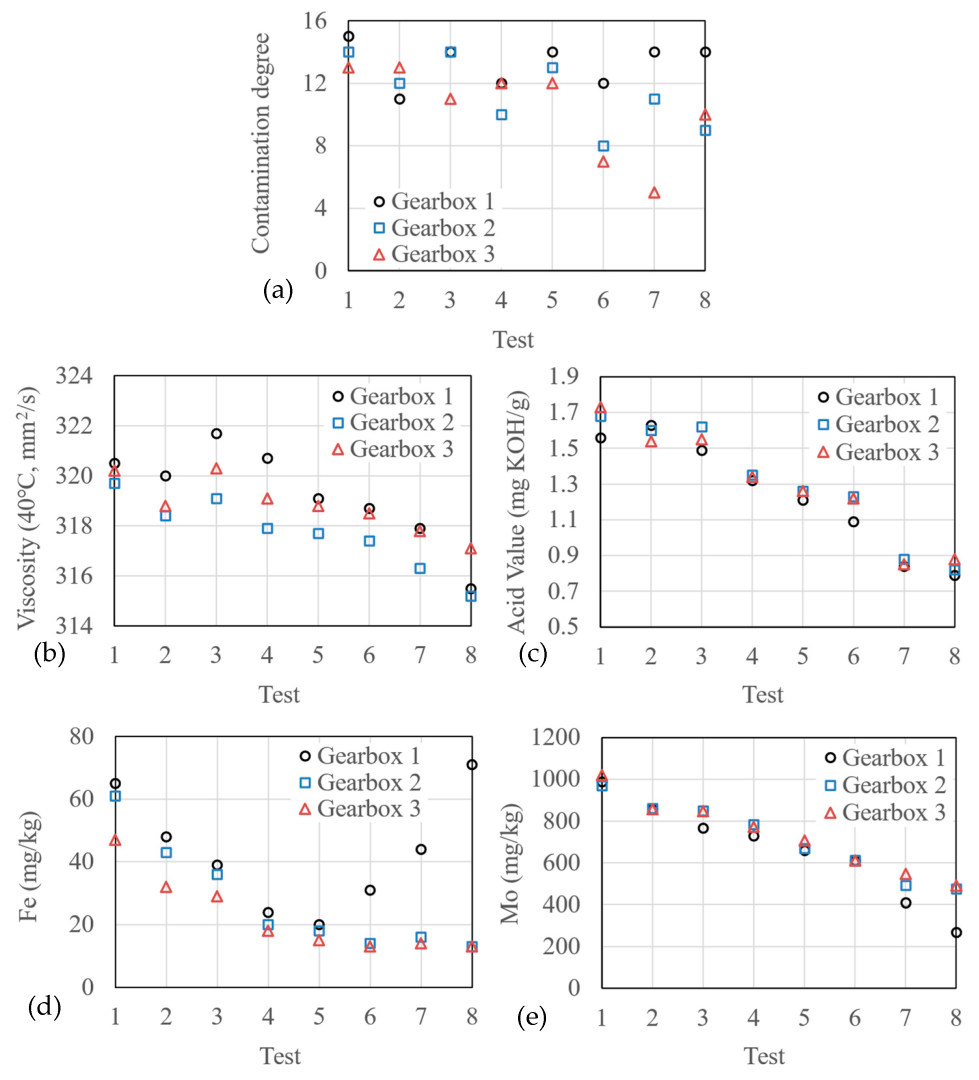
The tested oil properties are shown in Figure 4. By measuring the size and quantity of contamination particles in the oil, different sizes and quantity intervals were graded, and the pollution was expressed as grades 1–15. The lower the pollution degree, the cleaner the oil was. The fluctuation of the oil contamination degree can be found in Figure 4a. This was caused by the produced particle contamination and filter replacement. During the operation of the gearbox, contamination from the external environment entered the gearbox. Additionally, wear of gears, bearings, and other mechanical components also produced particle pollution. At the same time, replacing the filter element of the gearbox filter brought out some pollutants and reduced the degree of pollution inside the gearbox.
Figure 4.
Oil properties in each test for 3 wind turbine gearboxes: (a) Contamination degree; (b) Viscosity; (c) Acid value; (d) Fe concentration; (e) Mo concentration.
Figure 4b shows the viscosity is in a slow decline trend with a small fluctuation amplitude. When the lubricating oil is oxidized or contaminated by external high-viscosity substances, such as grease and high-viscosity oil, the viscosity will increase [30]. Whereas when the internal macromolecular chain of the lubricating oil is broken or contaminated by external low-viscosity substances, such as coolant, the viscosity will decrease. According to the experience of the wind energy industry and the viscosity classification system, the proper viscosity of lubricating oil should generally not exceed ±10% of the actual starting viscosity [31]. The initial lubricating oil viscosity in this study was 320 mm2/s, which was within the workable range.
The acid value can be found in Figure 4c. As the wind turbine running time increased, the acid value was constantly declining. The oil acid value in operation should not exceed 2 mg KOH/g according to the experience of the wind power industry and test of oxidation characteristics standard [32]. The acid values of the oil samples are lower than the warning value, indicating that the oxidation degree is low.
Spectral elements were selected as two typical elements, iron (Fe) and molybdenum (Mo). Iron elements can directly reflect the wear situation inside the gearbox. With molybdenum, as the anti-wear additive of lubricating oil, the decreased content will aggravate the wear of the tooth surface. These two elements changed significantly with the running of the gearbox. The change in iron in an overall lifespan is normally a “bathtub curve”. It can be seen from Figure 4d that the iron and molybdenum concentrations of gearbox 1 were different from the other two.
3. Methodology
Among these five oil properties, the contamination degree is largely affected by filter replacement. In addition, the filter replacement maintained the gearbox in a workable contamination degree. Therefore, this unpredictable disturbing factor is unsuitable to be involved in the predicting model. The viscosity and acid value are also in the normal range in all the samples. Such factors in a normal range are not included in the model since whether they are normal values brings no indication, and abnormal values mean it is likely too late for any prediction
3.1. Prediction Model
The combined GM (1,1) and double exponential smoothing model was established by the modified inverse-variance weighting method. The separate models were established first.
3.1.1. Establishment of GM (1,1)
For GM (1,1), the data series of Fe or Mo concentration can be represented as
Applying accumulated generating operator (1-AGO) obtains
where
A dynamic model of the first-order differential equation (whitenization equation) can be developed for the series
where is the development coefficient representing the development trend of , and is the grey action quantity reflecting the change relationship of [33]. Defining which were estimated by the least squares method:
where
Solving Equation (4), the discrete-time response function of GM (1,1) was obtained
Performed accumulated subtraction and obtained , namely,
3.1.2. Establishment of Double Exponential Smoothing Model
The Double Exponential Smoothing (DES) was conducted based on simple exponential smoothing, and the DES formula was
where and represent the DES value in periods t and t−1; is the simple exponential smoothing value in period t; is smoothing coefficient (0 < < 1).
The linear model prediction formula was
where is the predicting value of period T.
The initial smoothing value can be determined by .
The smoothing coefficient represents the responding speed to time series changes, determining the ability to predict and correct random errors. The determination of should meet the requirement of minimizing errors. Therefore, this work set a bunch of values for the Fe and Mo concentration in each gearbox. Then, the best value was chosen for the combined model to avoid overfitting and underfitting.
3.1.3. Combined Model
A modified inverse-variance weighting method was developed where the relative errors were used to calculate the variance. For the time series of Fe or Mo concentration , two independent predicting methods were used in this study. The GM (1,1) and DES predicted series can be expressed by and , and the corresponding weights were and . Then, the combined prediction was
The corresponding weights and can be found by
where and are the average absolute value of the relative error for each predicted sequence. They can be calculated by
3.2. Pre-Warning
To accurately diagnose the operation of the gearbox, the abnormal boundary value of the monitoring parameters of the oil should be scientifically formulated based on the prediction data. The statistical method and linear regression method showed great maneuverability and reasonable accuracy so these two methods were applied to set the threshold and discussed below.
3.2.1. Statistical Method
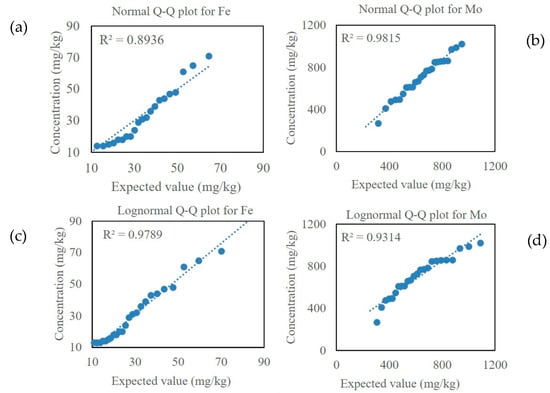
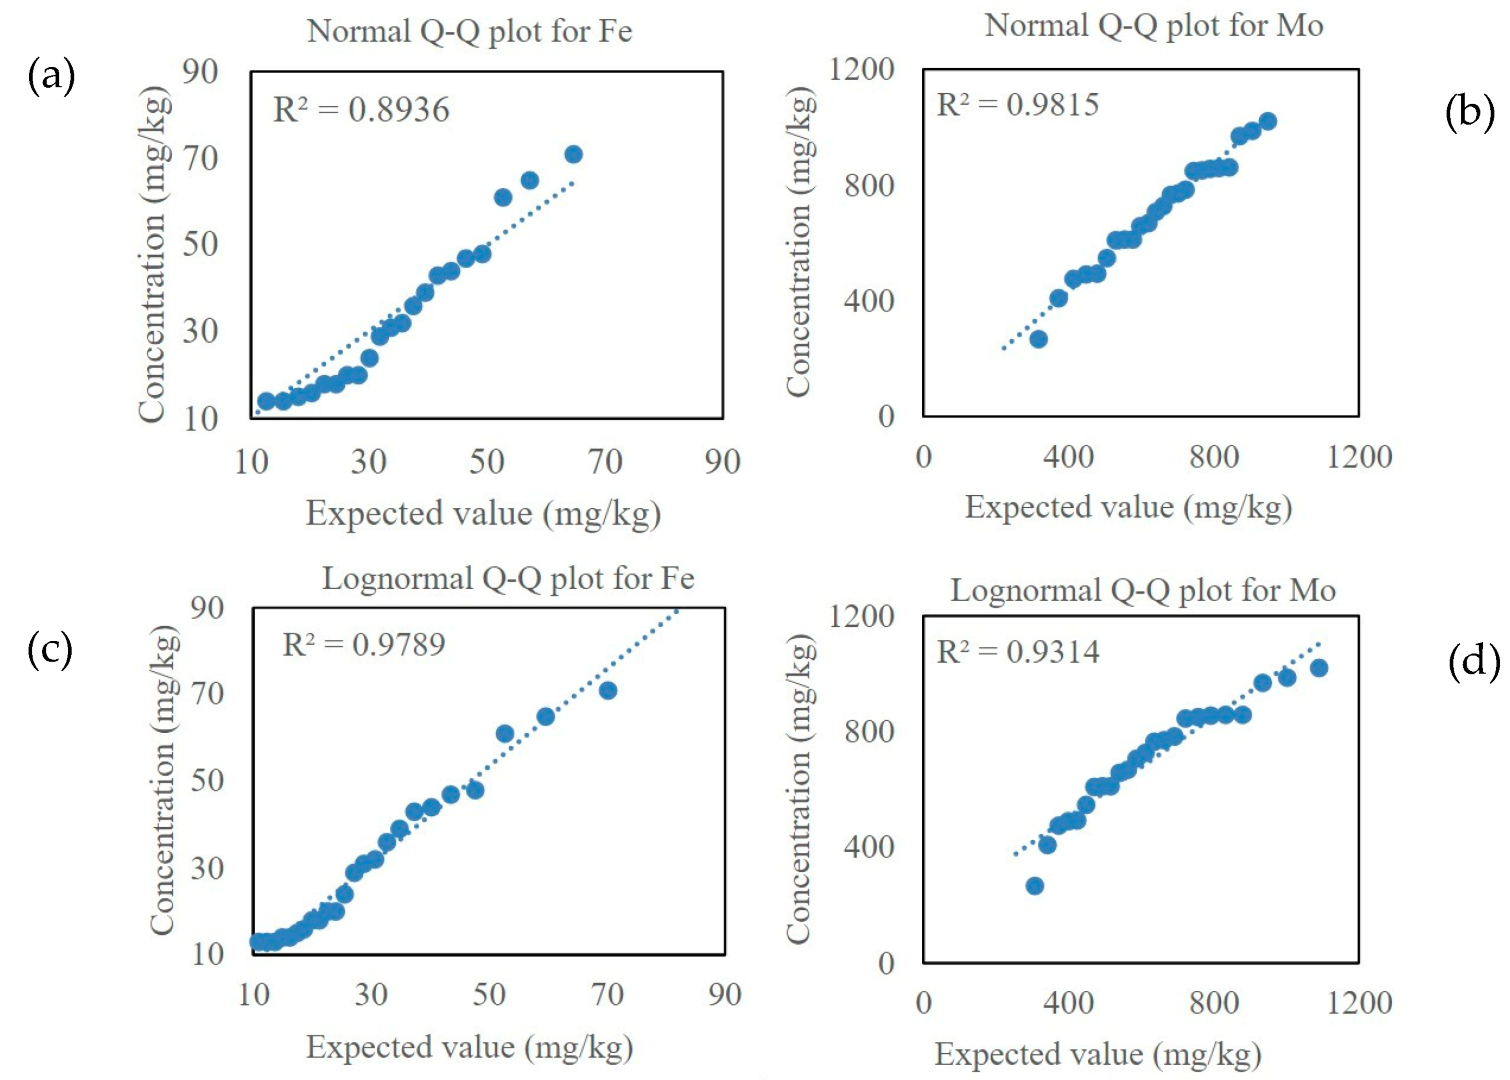
The Q-Q plot is shown in Figure 5 to verify the distribution type of Fe and Mo. The R2 values indicate that Mo is close to normal distribution and Fe is close to lognormal distribution.
Figure 5.
Q-Q plot for Fe and Mo. (a) Normal Q-Q plot for Fe; (b) Normal Q-Q plot for Mo; (c) Lognormal Q-Q plot for Fe; (d) Lognormal Q-Q plot for Mo.
Therefore, the lognormal distribution can be transformed to normal distribution and the confidence intervals can be applied to perform pre-warning. According to the normal distribution properties, when the gearbox was under normal operation, the probability of the tested value falling between and was 95.45% and 99.73%, respectively. and are the mean value and standard deviation of Mo or (Fe) concentration with tests.
With the "small-probability event" theory, can be set as the pre-warning threshold, and can be set as the warning threshold. The detailed thresholds are shown in Table 3.
Table 3.
The threshold for normal, pre-warning, and warning conditions.
3.2.2. Linear Regression Method
The linear regression method used tested values to fit a line . The pre-warning line and warning line can be created by and . and can be estimated by the least square method. can be found by
where and are the average of and t.
4. Results and Discussion
4.1. Predicted Results and Discussion
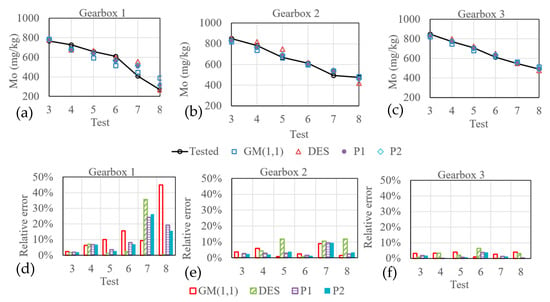
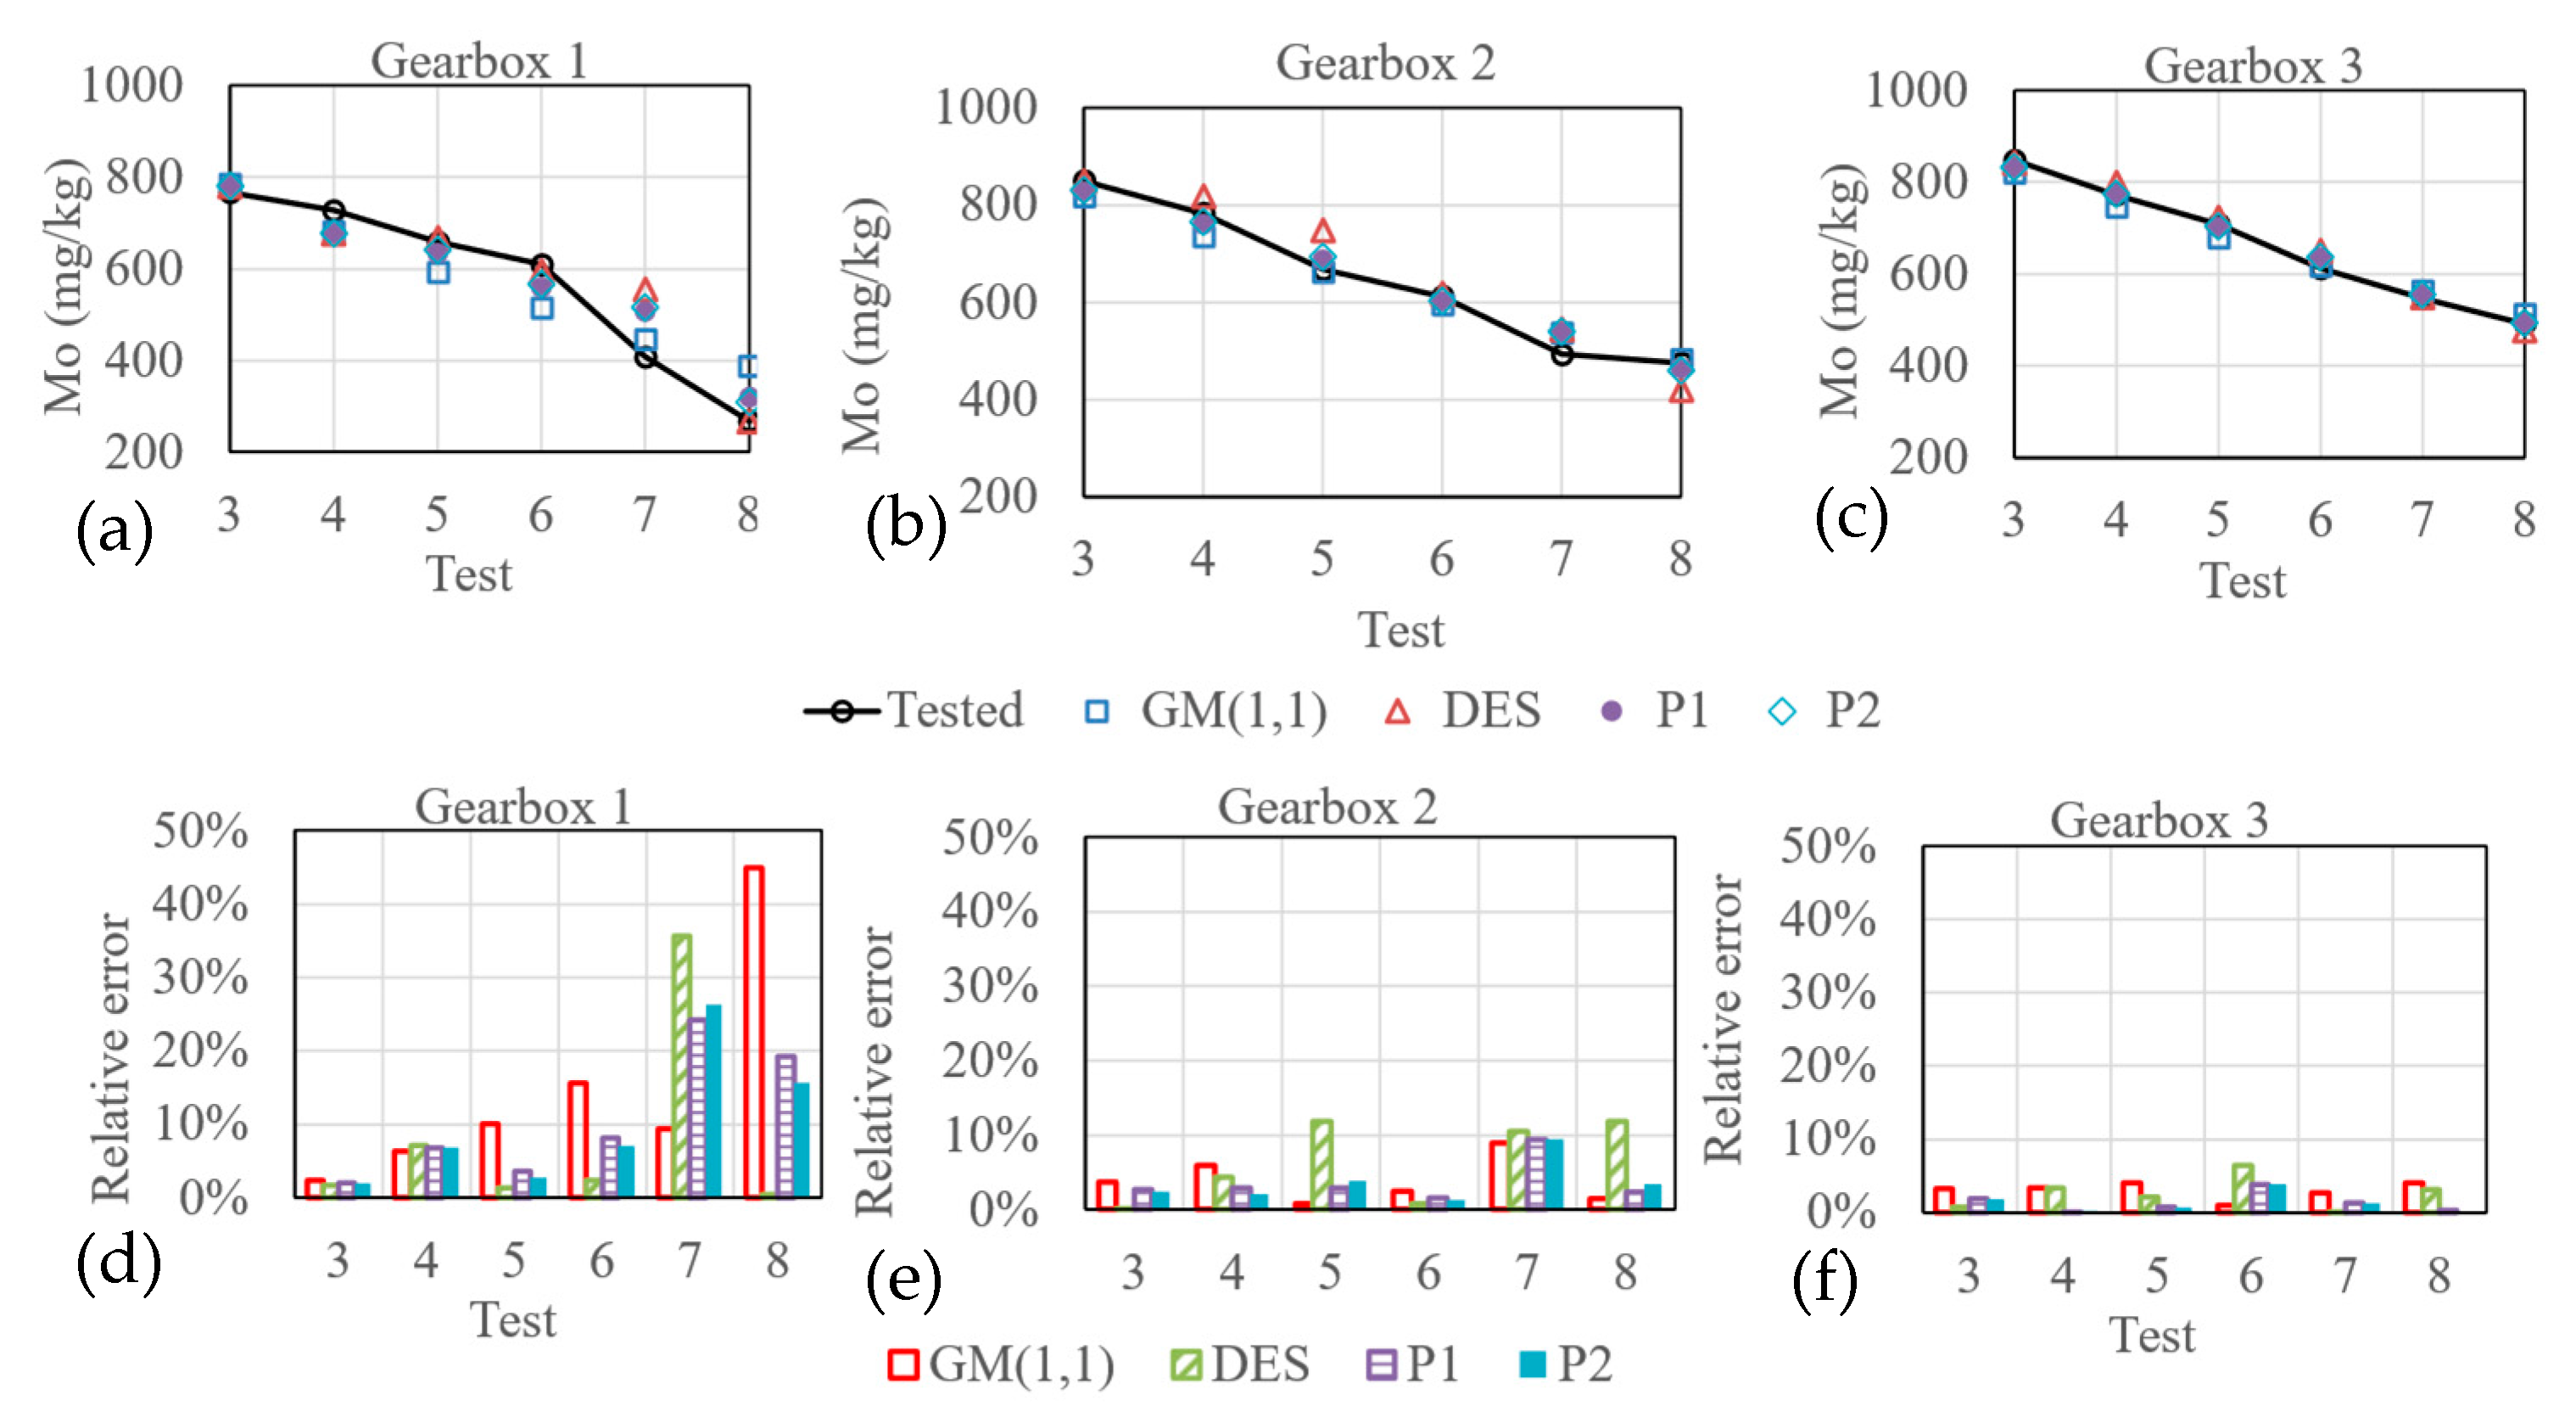
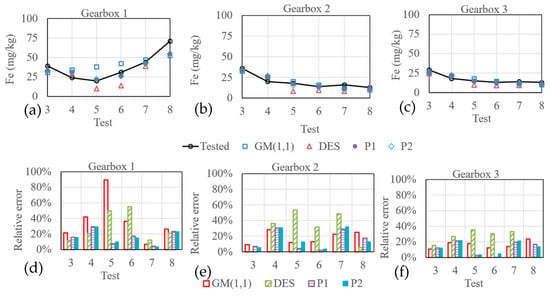
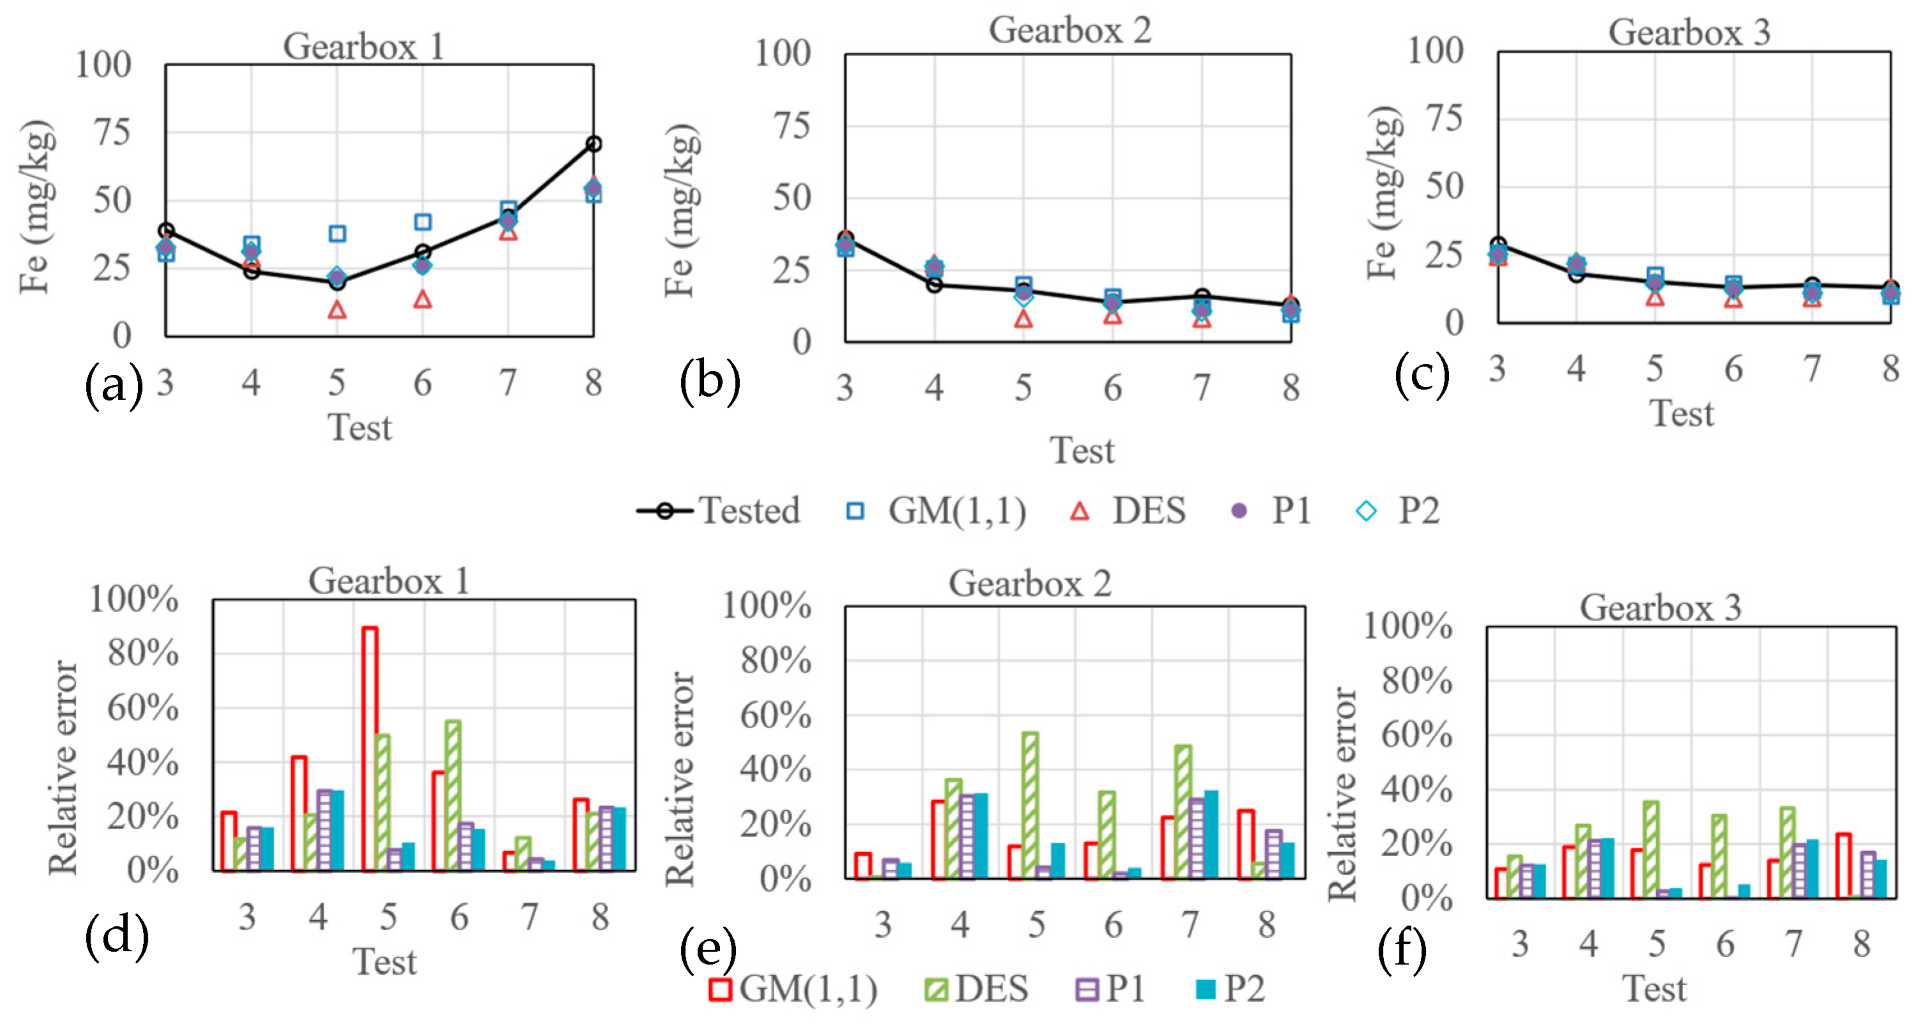
The predicted results and their relative errors are shown in Figure 6 and Figure 7 where P1 is the inverse-variance weighting method using absolute errors and P2 is the modified inverse-variance weighting method using relative errors in this study. Since the first two values cannot be predicted by DES, all demonstrated values start from the third test. Table 4 gives the values of and for GM (1,1), smoothing coefficient , and weights for P1 and P2.
Figure 6.
Comparison between tested and predicted results for Mo concentration, and their relative errors. Concentration: (a) Gearbox 1; (b) Gearbox 2; (c) Gearbox 3. Relative error: (d) Gearbox 1; (e) Gearbox 2; (f) Gearbox 3.
Figure 7.
Comparison between tested and predicted results for Fe concentration, and their relative errors. Concentration: (a) Gearbox 1; (b) Gearbox 2; (c) Gearbox 3. Relative error: (d) Gearbox 1; (e) Gearbox 2; (f) Gearbox 3.
Table 4.
The coefficients and factors in predicted model.
The GM (1,1) has practical meaning when the absolute value of the development coefficient is less than two. The model error increases rapidly with the development coefficient increase.
For Mo concentration in gearbox 1, the average relative error of the DES prediction model is the smallest, 8.098%, but there are a number of data points with obvious deviations, and the maximum relative error is 35.67%. Whereas the maximum relative error of the combined prediction model is smaller than other methods. The gearbox 2 prediction results for Mo show that P1 has the smallest average relative error, 3.63%. The maximum relative error is 9.36%. Results from P2 have a similar performance to P1. In gearbox 3 prediction, the P2 demonstrates the best results. The average relative error is 1.375% and the maximum relative error is 3.93%. P1 shows slightly lower accuracy than P2.
For Fe concentration in gearbox 1, P1 and P2 predicted similar results. The average relative error is about 15%, which is much better than GM (1,1) and DES. The maximum relative error is about 30%, much smaller than the GM (1,1) and DES predicted results. Similar predicting results can be found for gearbox 2. The average relative error of predicted Fe concentration for P1 is the smallest and P2 shows close predicted values to P1. The average relative error is also about 15%, much lower than the single predicting method. Predictions for the gearbox 3 Fe concentration obtain the best accuracy. The P2 method achieves a maximum relative error of 3.93% and an average relative error of 1.375%.
Generally, the combined prediction models perform much better than the single prediction model in both single value and overall trend. P2 and P1 show similar predicted results but P2 has slightly better accuracy than P1.
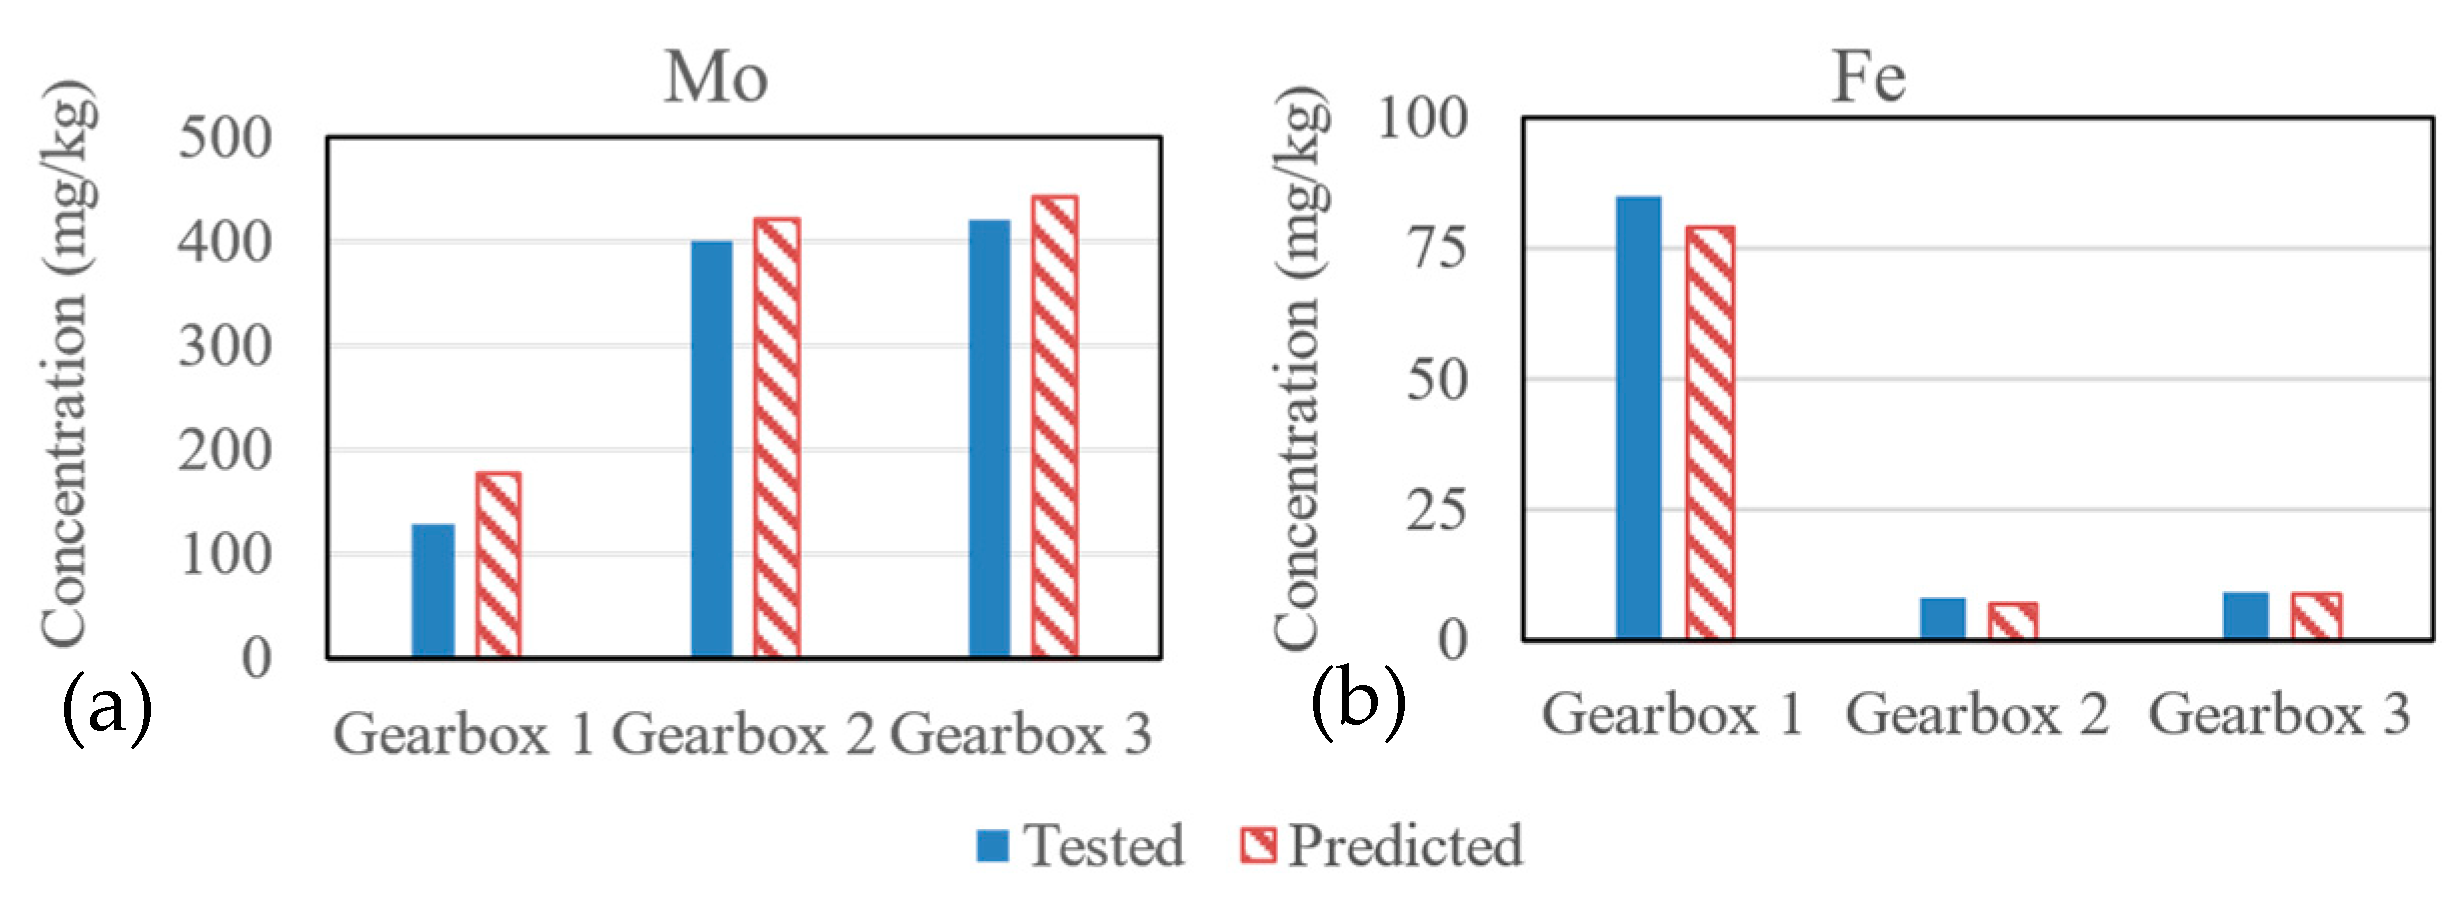
To further verify the combined predicting model, the model was applied to predict the next value of Mo and Fe, and then compared with the results of test 9. The results are shown in Figure 8. It can be seen that the predicted results with the proposed method match well with the tested value.
Figure 8.
Comparison between tested and predicted results for test 9. (a) Concentration for Mo; (b) Concentration for Fe.
4.2. Pre-Warning Results and Discussion
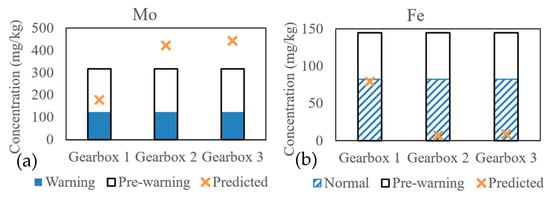
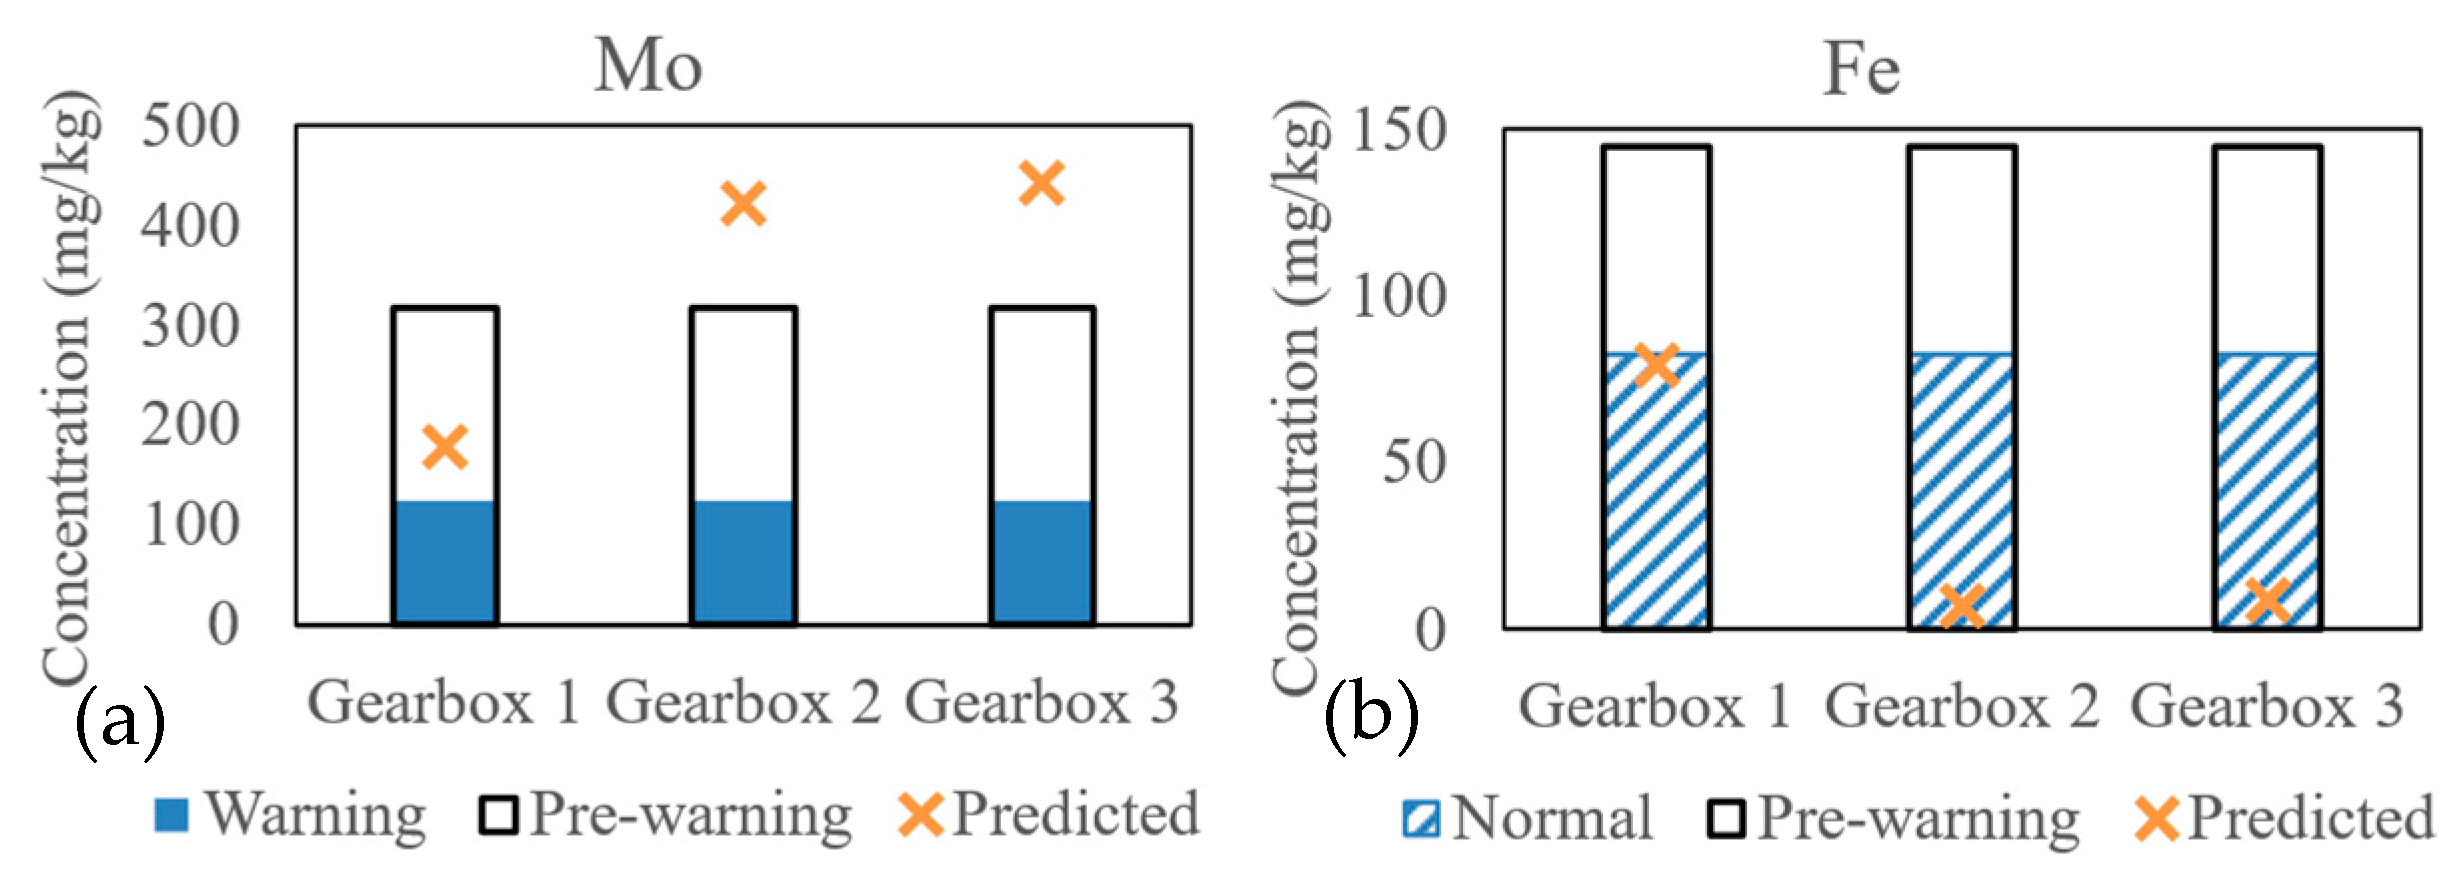
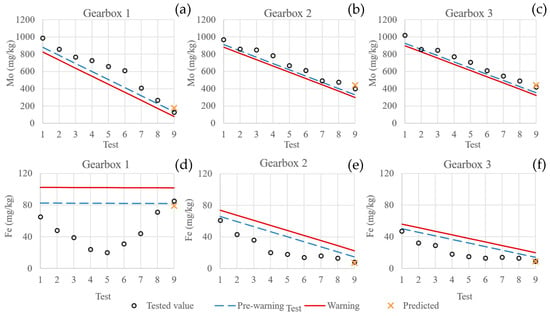
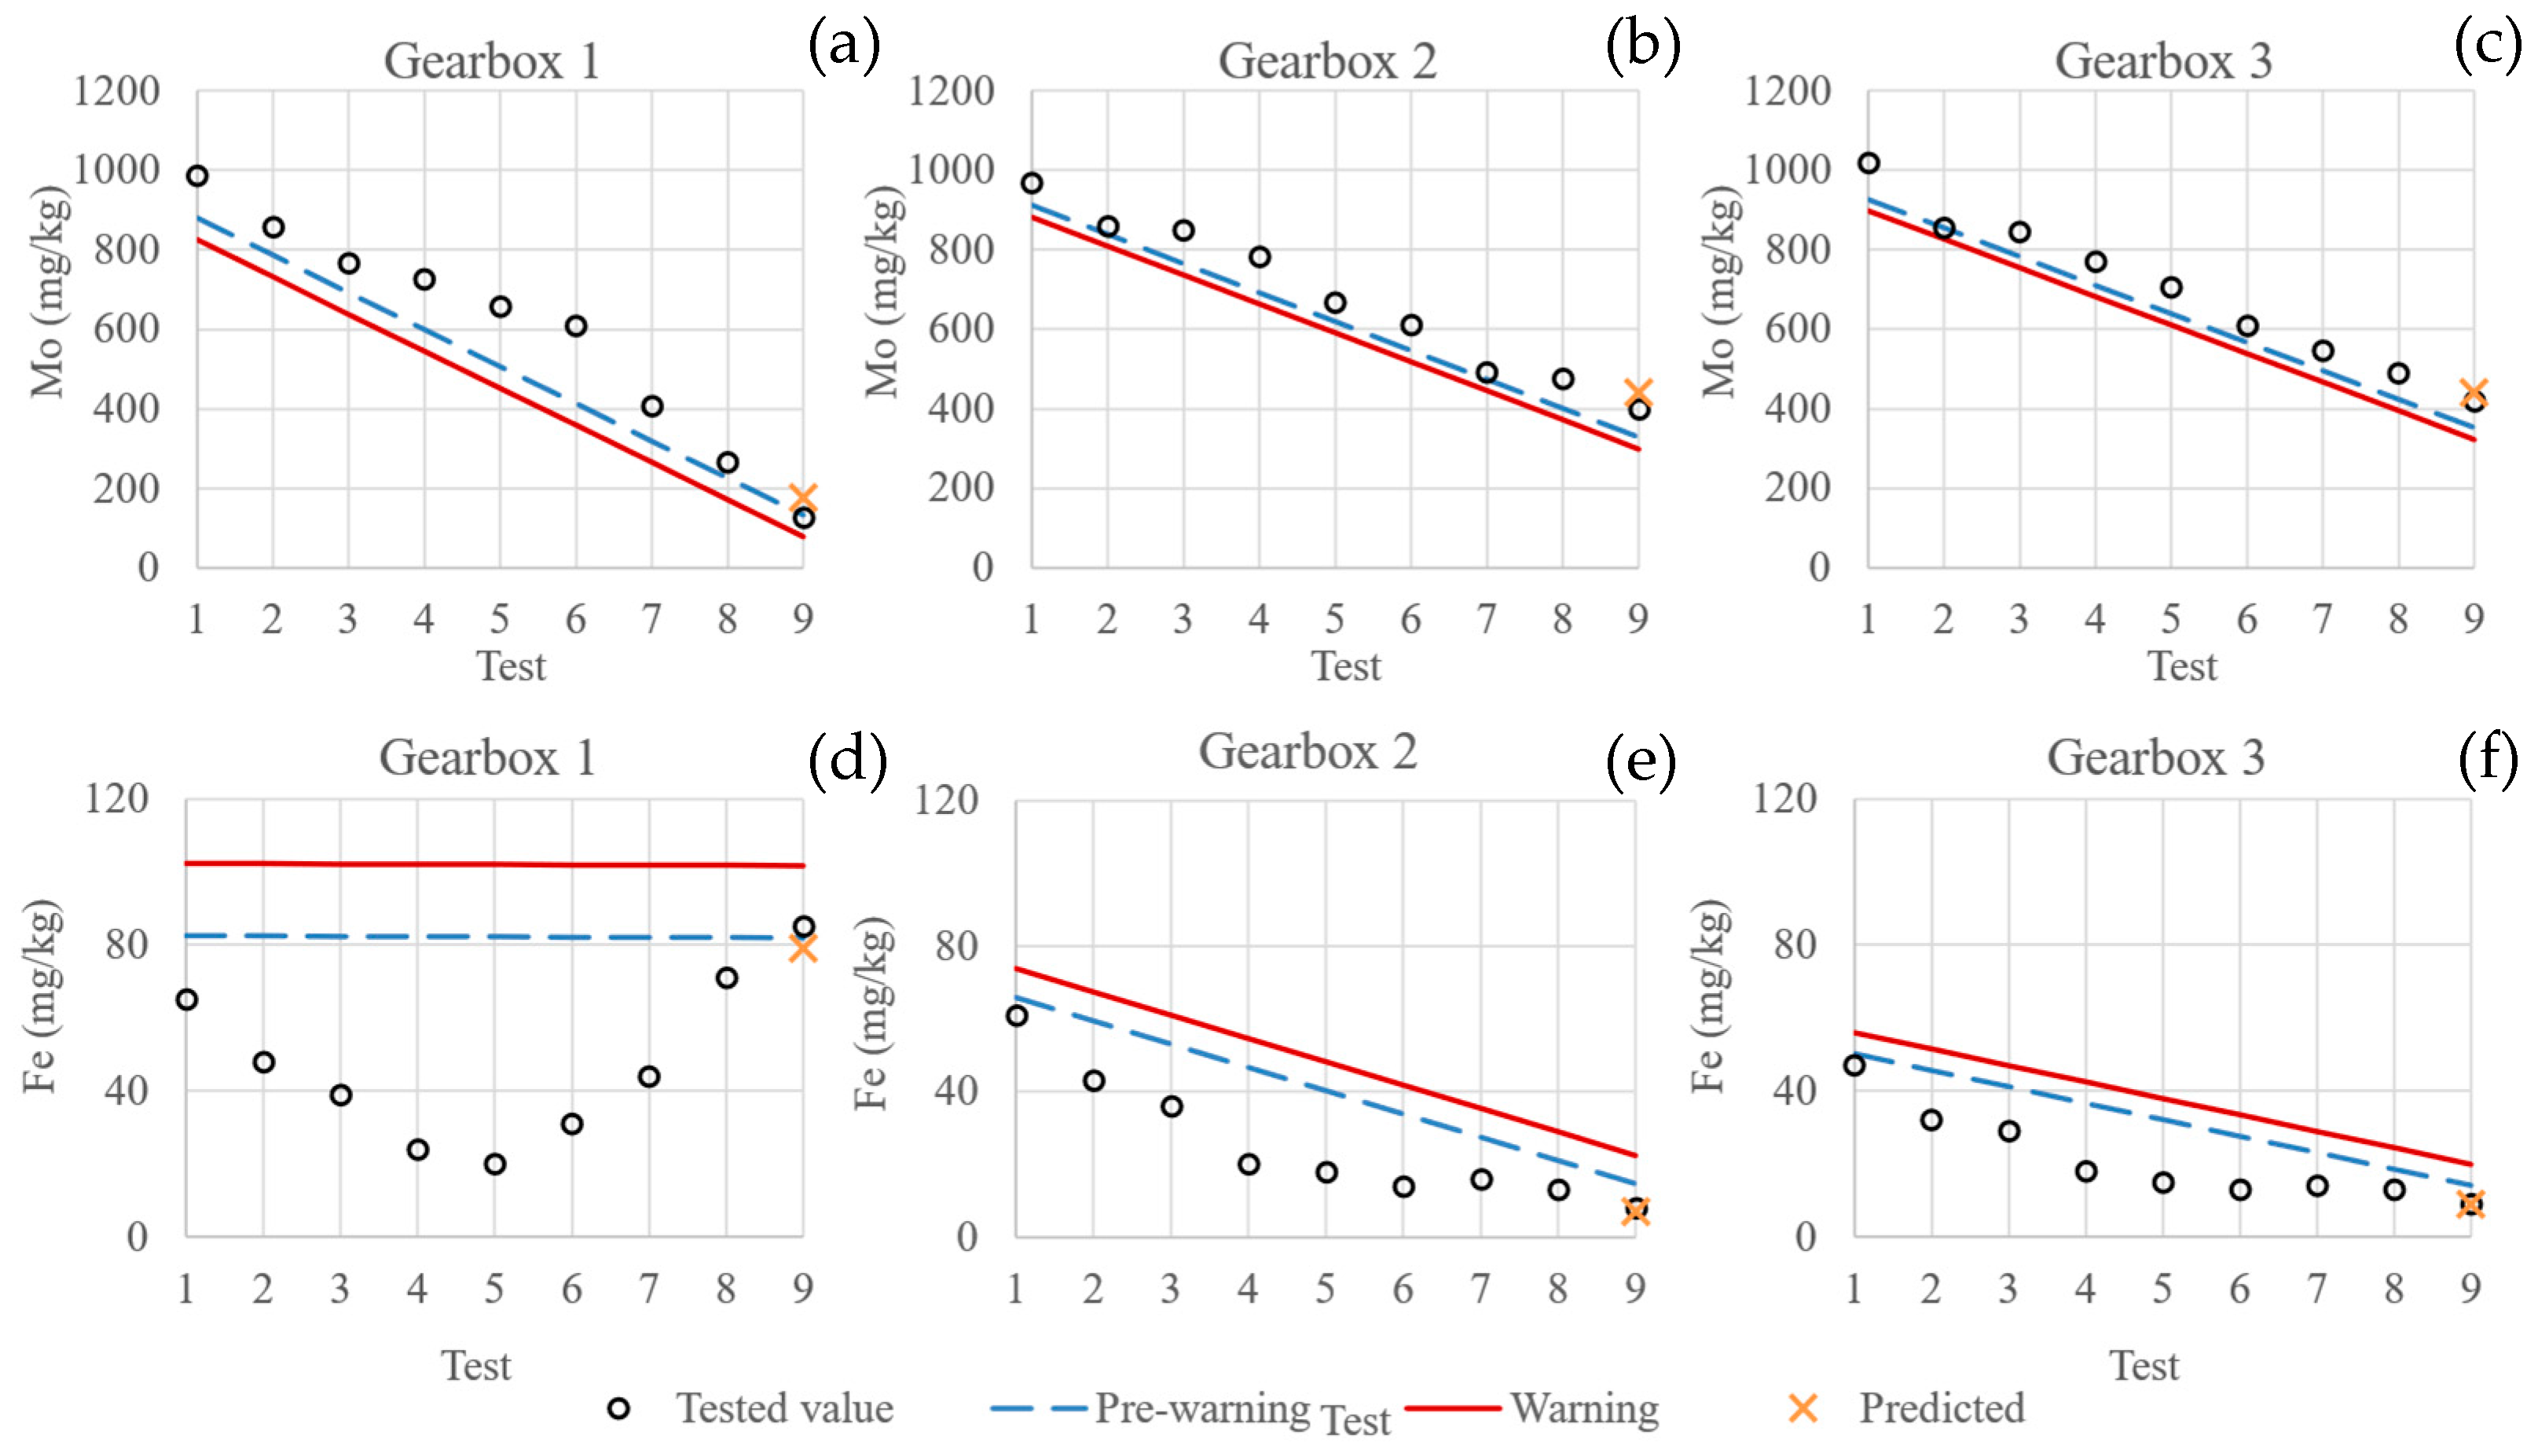
Based on the statistical method and linear regression method, tested data from eight time periods were used to obtain the normal threshold, pre-warning, and warning threshold. The lower threshold of the Fe concentration and the upper threshold of Mo are neglected in the results below and discussion because these two thresholds cannot indicate oil properties. Then, the test 9 data were used to compare with the threshold and forecast the working conditions of gearboxes. The thresholds and comparisons are shown in Figure 9 and Figure 10.
Figure 9.
The threshold of pre-warning and warning conditions by statistical method, and comparisons with data of test 9. (a) Concentration for Mo; (b) Concentration for Fe.
Figure 10.
The threshold of pre-warning and warning conditions by linear regression method, and comparisons with data of test 9. Concentration for Mo: (a) Gearbox 1; (b) Gearbox 2; (c) Gearbox 3. Concentration for Fe: (d) Gearbox 1; (e) Gearbox 2; (f) Gearbox 3.
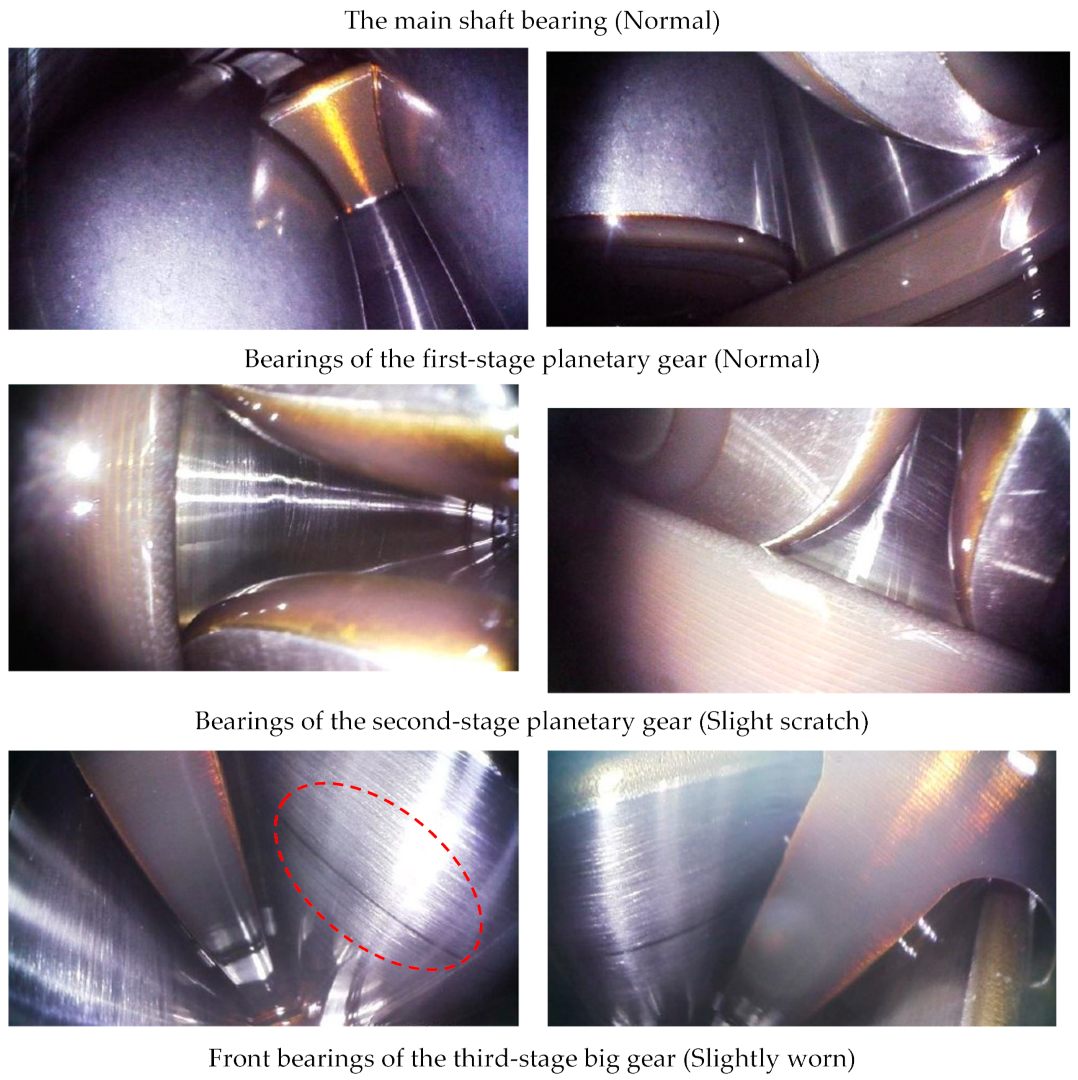
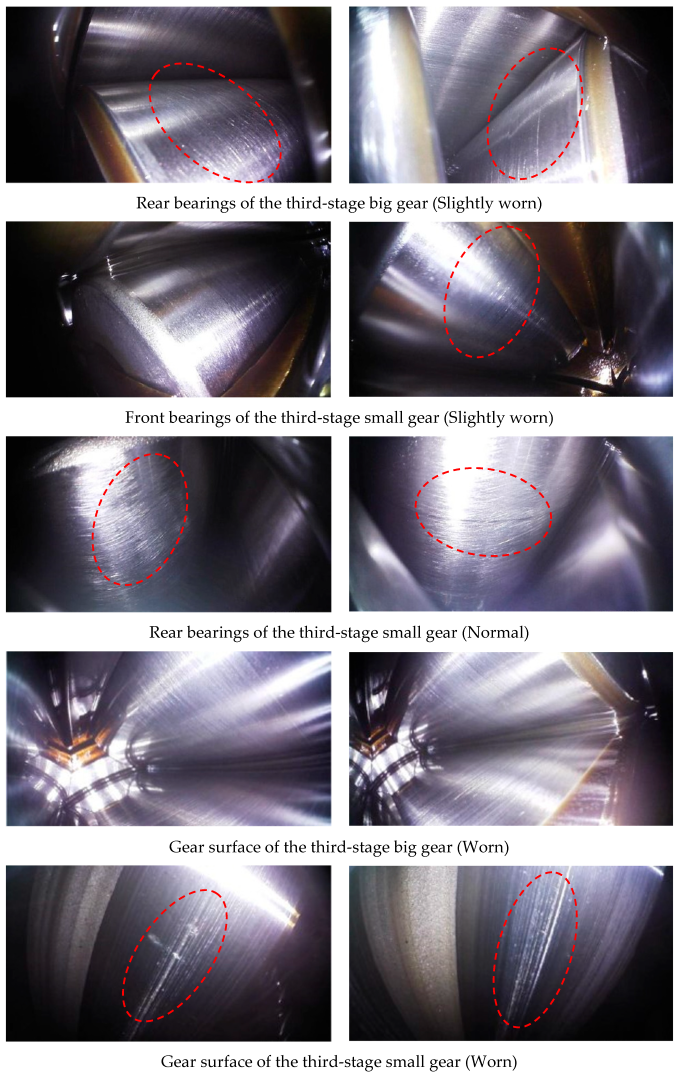
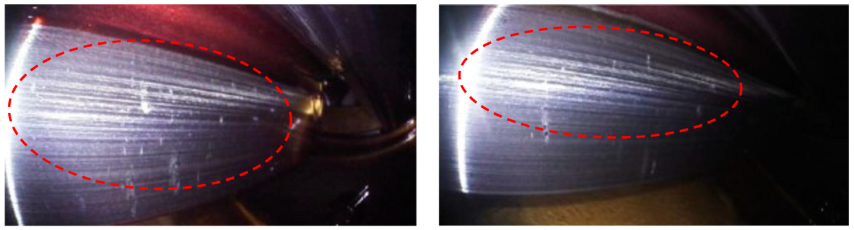
The results indicate that for gearbox 1, the predicted Mo concentration is in the pre-warning region, and Fe concentration is at the edge of the pre-warning region, with the statistical method. The linear regression method also shows gearbox 1 is in the boundary of the pre-warning condition. The combination of these two pre-warning results implies gearbox 1 may not be in good condition. While for the prediction results for gearbox 2 and gearbox 3, results show the gearboxes are in normal condition. To verify the prediction, an endoscope inspection of gearbox 1 was performed and the inspection results are shown in Appendix A. The endoscope inspection indicates some wear in the gears, particularly the third-stage gear surface, which verifies the fault pre-warning method proposed in this study.
5. Conclusions
This work studied gearbox oil monitoring and fault pre-warning of three wind turbines operating in a wind farm for 3.5 consecutive years. A combined predicting method was proposed in which GM (1,1) and DES were weighted by different weights, and the predicted results were verified by the tested results. From the perspective of relative error, the combined prediction model was improved to reduce the prediction error. The error was reduced by 10% compared with the single prediction method. Additionally, the relative-error-based combined predicting method was also a little more accurate than the absolute-error-based combined method. Both the statistical method and linear regression method were applied to build the pre-warning scheme. Through analyzing the oil inspection data of wind turbines 1, 2, and 3, it was found that the data of wind turbine 1 were in the warning range. Through the endoscope inspection of gearbox 1, the wear of some parts was found. It showed slight scratches on the bearings of the second-stage planetary gear. Slight wear also appeared on the front and rear bearings of the third-stage big gear, and on the front bearings of the third-stage small gear. It was worth noting that apparent wear appeared on the gear surface of the third-stage big gear, and small gear. These results of the endoscope inspection validated the pre-warning model. The research outcomes provide a quick and easy technique for wind turbine operation and maintenance.
The proposed method also has some drawbacks, such as the model can only predict the next period of results, and could not accurately predict further results due to the limitations of GM. Therefore, models with time series-based capabilities can be joined to make a more powerful combined model, and this could be future work for offline monitoring and prediction.
Author Contributions
Conceptualization, J.Z. and X.X.; methodology, J.C., O.O. and J.L.; validation, J.C. and J.L.; formal analysis, J.L.; investigation, J.Z. and J.C.; resources, X.X. and X.Z.; data curation, J.Z. and J.C.; writing—original draft preparation, X.Z.; writing—review and editing, J.C., O.O. and J.L.; supervision, X.X.; project administration, X.X. and X.Z.; funding acquisition, X.X. and J.C. All authors have read and agreed to the published version of the manuscript.
Funding
This work is funded by key scientific and technological project of Hunan Province (2021GK1150). This work is funded by Hunan Province’s research and development plan in key fields (2021WK2007).
Institutional Review Board Statement
Not applicable.
Informed Consent Statement
Not applicable.
Data Availability Statement
Data were presented in the paper.
Acknowledgments
We are grateful for resources from the High-Performance Computing Center of Central South University.
Conflicts of Interest
The authors declare no conflict of interest.
Appendix A. The Endoscope Inspection Results
Figure A1.
The main shaft bearing (Normal).
References
- IEA. Wind Electricity; IEA: Paris, France, 2022; Available online: https://www.iea.org/reports/wind-electricity (accessed on 11 November 2022).
- Gu, H.; Liu, W.Y.; Gao, Q.W.; Zhang, Y. A review on wind turbines gearbox fault diagnosis methods. J. Vibroeng. 2021, 23, 26–43. [Google Scholar] [CrossRef] [Scilit]
- Tang, G.; Pang, E.; Wang, X. Research on gear fault diagnosis based on EMD. Mach. Tool Hydraul. 2013, 41, 188–190. (In Chinese) [Google Scholar]
- Gao, Z.; Liu, X. An Overview on Fault Diagnosis, Prognosis and Resilient Control for Wind Turbine Systems. Processes 2021, 9, 300. [Google Scholar] [CrossRef] [Scilit]
- Crabtree, C.; Feng, Y.; Tavner, P. Detecting incipient wind turbine gearbox failure: A signal analysis method for on-line condition monitoring. In Proceedings of the European Wind Energy Conference, Warsaw, Poland, 20–23 April 2010. [Google Scholar]
- Cao, Y.; Cao, Y.; Wu, G.; Li, Q.; Shi, Y. The analysis of monitoring system of wind turbine. Appl. Mech. Mater. 2014, 487, 595–600. [Google Scholar] [CrossRef] [Scilit]
- Yang, W.; Tavner, P.J.; Crabtree, C.J.; Feng, Y.; Qiu, Y. Wind turbine condition monitoring: Technical and commercial challenges. Wind Energy 2014, 17, 673–693. [Google Scholar] [CrossRef] [Scilit]
- Rezamand, M.; Kordestani, M.; Carriveau, R.; Ting, D.; Orchard, M.; Saif, M. Critical Wind Turbine Components Prognostics: A Comprehensive Review. IEEE Trans. Instrum. Meas. 2020, 69, 9306–9328. [Google Scholar] [CrossRef] [Scilit]
- Gray, C.; Watson, S. Physics of failure approach to wind turbine condition based maintenance. Wind Energy 2009, 13, 395–405. [Google Scholar] [CrossRef] [Scilit]
- Breteler, D.; Kaidis, C.; Tinga, T.; Loendersloot, R. Physics based methodology for wind turbine failure detection, diagnostics & prognostics. In Proceedings of the European Wind Energy Association Annual Conference and Exhibition (EWEA), Paris, France, 17–20 November 2015; pp. 1–9. [Google Scholar]
- Zhu, J.; Yoon, J.; He, D.; Qiu, B.; Bechhoefer, E. Online condition monitoring and remaining useful life prediction of particle contaminated lubrication oil. In Proceedings of the IEEE Conference Prognostics Health Manage. (PHM), Gaithersburg, MD, USA, 24–27 June 2013; pp. 1–14. [Google Scholar]
- Zhu, J.; Yoon, J.; He, D.; Bechhoefer, E. Online particle contaminated lubrication oil condition monitoring and remaining useful life prediction for wind turbines. Wind Energy 2015, 18, 1131–1149. [Google Scholar] [CrossRef] [Scilit]
- Pan, Y.; Hong, R.; Chen, J.; Singh, J.; Jia, X. Performance degradation assessment of a wind turbine gearbox based on multi-sensor data fusion. Mech. Mach. Theory 2019, 137, 509–526. [Google Scholar] [CrossRef] [Scilit]
- Teng, W.; Zhang, X.; Liu, Y.; Kusiak, A.; Ma, Z. Prognosis of the remaining useful life of bearings in a wind turbine gearbox. Energies 2016, 10, 32. [Google Scholar] [CrossRef] [Scilit]
- Hussain, S.; Gabbar, H. Vibration analysis and time series prediction for wind turbine gearbox prognostics. Int. J. Progn. Health Manag. 2013, 4, 69–79. [Google Scholar] [CrossRef] [Scilit]
- Peng, J.; Kimmig, A.; Niu, Z.; Wang, J.; Liu, X.; Wang, D.; Ovtcharova, J. Wind turbine failure prediction and health assessment based on adaptive maximum mean discrepancy. Int. J. Electr. Power Energy Syst. 2022, 134, 107391. [Google Scholar] [CrossRef] [Scilit]
- Fan, X.; Yang, X.; Li, X.; Wang, J. A particle-filtering approach for remaining useful life estimation of wind turbine gearbox. In Proceedings of the International Conference on Chemical, Material, and Food Engineering, Kunming, Yunnan, China, 25–26 July 2015; Atlantis Press: Paris, France, 2015; pp. 198–200. [Google Scholar]
- Cheng, F.; Qu, L.; Qiao, W. Fault prognosis and remaining useful life prediction of wind turbine gearboxes using current signal analysis. IEEE Trans. Sustain. Energy 2018, 9, 157–167. [Google Scholar] [CrossRef] [Scilit]
- Ding, F.; Tian, Z.; Zhao, F.; Xu, H. An integrated approach for wind turbine gearbox fatigue life prediction considering instantaneously varying load conditions. Renew. Energy 2018, 129, 260–270. [Google Scholar] [CrossRef] [Scilit]
- Guo, P.; Infield, D.; Yang, X. Wind Turbine Gearbox Condition Monitoring Using Temperature Trend Analysis. Proc. Chin. Soc. Electr. Eng. 2011, 31, 129–136. (In Chinese) [Google Scholar]
- Gao, B.; He, Y.; Woo, W.L.; Tian, G.Y.; Liu, J.; Hu, Y. Multidimensional tensor-based inductive thermography with multiple physical fields for offshore wind turbine gear inspection. IEEE Trans. Ind. Electr. 2016, 63, 6305–6315. [Google Scholar] [CrossRef] [Scilit]
- Elforjani, M. Diagnosis and prognosis of real world wind turbine gears. Renew. Energy 2020, 147, 1676–1693. [Google Scholar] [CrossRef] [Scilit]
- Kayacan, E.; Ulutas, B.; Kaynak, O. Grey system theory-based models in time series prediction. Exp. Syst. Appl. 2010, 37, 1784–1789. [Google Scholar] [CrossRef] [Scilit]
- Deng, J.L. Control problems of grey systems. Syst. Control Lett. 1982, 1, 288–294. [Google Scholar] [CrossRef]
- Wang, R.; Gang, L. Trend Prediction of Oil Temperature for Wind Turbine Gearbox Based on Grey Theory. In Proceedings of the International Conference on Artificial Intelligence and Computational Intelligence (AICI), Taiyuan, China, 23–25 September 2011; pp. 280–285. [Google Scholar]
- Liang, T.; Yang, G.; Dong, Y.; Qian, S.; Xu, Y. Predicting Temperatures of Wind Turbine Gearbox by a Variable-Weight Combined Model. In Proceedings of the 24th International Conference on Automation and Computing (ICAC), Newcastle upon Tyne, UK, 6–7 September 2018; IEEE: Piscataway, NJ, USA; pp. 1–6. [Google Scholar] [CrossRef] [Scilit]
- Ostertagova, E.; Ostertag, O. Forecasting using simple exponential smoothing method. Acta Elect. Inf. 2012, 12, 62. [Google Scholar] [CrossRef] [Scilit]
- Wang, G.; Wang, S.; Liu, H.; Xue, Y.; Zhou, P. Self-adaptive and dynamic cubic ES method for wind speed forecasting. Power Syst. Prot. Control 2014, 42, 117–121. (In Chinese) [Google Scholar]
- Bates, M.; Granger, J. Combination of Forecasts. Oper. Res. Q. 1969, 20, 451–468. [Google Scholar] [CrossRef] [Scilit]
- Birova, A.; Pavlovičová, A.; Cvenroš, J. Lubricating oils based on chemically modified vegetable oils. J. Synth. Lubr. 2002, 18, 291–299. [Google Scholar] [CrossRef] [Scilit]
- Fitch, J. Trouble-Shooting Viscosity Excursions. Machinery and Lubrication. 2001. Available online: https://www.machinerylubrication.com/Read/185/viscosity-trouble-shooting (accessed on 16 January 2022).
- D943–20; Standard Test Method for Oxidation Characteristics of Inhibited Mineral Oils. ASTM: West Conshohocken, PA, USA, 2020. [CrossRef] [Scilit]
- Tan, X.; Xu, J.; Li, F.; Wu, M.; Chen, D.; Liang, Y. A new GM (1, 1) model suitable for short-term prediction of satellite clock bias. IET Radar Sonar Navig. 2022, 16, 2040–2052. [Google Scholar] [CrossRef] [Scilit]

Disclaimer/Publisher’s Note: The statements, opinions and data contained in all publications are solely those of the individual author(s) and contributor(s) and not of MDPI and/or the editor(s). MDPI and/or the editor(s) disclaim responsibility for any injury to people or property resulting from any ideas, methods, instructions or products referred to in the content. |
© 2023 by the authors. Licensee MDPI, Basel, Switzerland. This article is an open access article distributed under the terms and conditions of the Creative Commons Attribution (CC BY) license (https://creativecommons.org/licenses/by/4.0/).