Article

Multi-Scale Integration and Distribution of Soil Organic Matter Spatial Variation in a Coal–Grain Compound Area

1
School of Public Administration, North China University of Water Resources and Hydropower, Zhengzhou 450046, China
2
College of Surveying and Geo-Informatics, North China University of Water Resources and Hydropower, Zhengzhou 450046, China
3
College of Water Rsources, North China University of Water Resources and Hydropower, Zhengzhou 450046, China
*
Author to whom correspondence should be addressed.
Sustainability 2023, 15(4), 3780; https://doi.org/10.3390/su15043780
Submission received: 12 January 2023 / Revised: 12 February 2023 / Accepted: 15 February 2023 / Published: 18 February 2023

Abstract

:
Soil organic matter (SOM) scale effects are critical for crop growth and food security, especially in coal–grain complexes. However, few studies describe the spatial variation in SOM and its influencing factors at different sampling scales. Here, geostatistical theory and mathematical statistical methods were adopted to analyze the spatial variation characteristics of and structural differences in SOM in the coal mining subsidence area at Zhaogu No. 2 Mine at different sampling scales. The results showed that SOM varied spatially at large, medium, and small scales, and the coefficients of variation were 28.07%, 14.93%, and 14.31%, respectively, which are moderate values. The characteristic functions of the SOM content at different sampling scales differed, and the spatial structure scale effect was obvious. The spatial distribution of the SOM content fitted by the multiscale fitting model method was generally the same as the spatial distribution law of the SOM content fitted by the single scale kriging interpolation method; however, in terms of the detailed expression and spatial distribution of small-scale SOM content, the fitting model method was more accurate, and the accuracy increased by 36%. At the different sampling scales, sample size and soil type had specific effects on the SOM spatial distribution. These results provide research concepts and technical countermeasures for improving food security and the ecological environment in the coal–grain complex and help ensure sustainable agricultural lands.

1. Introduction

China has abundant coal resources. At present, the coal resource reserves that have been identified and surveyed account for approximately one-third of the world’s total coal reserves, and the annual output exceeds 3 billion tons, making China first in the world in terms of coal output [1,2,3]. The large-scale coal resource development also has led to many surface environmental damage problems, such as surface collapse, excavation losses, and compression, which substantially harmed the surface ecological environment and the life of mining residents with adverse impacts on the atmospheric carbon and nitrogen cycle [4,5,6,7]. The main coal mining method in China is borehole mining, which readily causes large-area surface subsidence above the goaf and produces a large number of cracks and fracture surfaces [8,9,10]. Coal mining has destroyed a large amount of land and vegetation, causing severe damage to general farmland [11,12]. Currently, the area of land subsidence caused by coal mining is more than 0.45 × 10⁶ hm2, and coal mining continues to increase. A large area of surface subsidence leads to spatial variation in cultivated soil nutrients in mining areas, resulting in reduced soil quality, and further affecting grain yield and straining the human–land relationship in mining areas [13,14,15,16]. Immense destruction of cultivated land has severely affected the ecological environment of coal–grain compound area and restricted the sustainable development of the social economy in these areas. Therefore, it is necessary to improve the quality of cultivated land in coal–grain compound area [17,18,19,20].
Soil is a basic natural resource that humans depend on for survival. It is gradually formed by a series of physical and chemical processes of the parent material under specific water, heat, and biological conditions [21,22,23,24]. Under the joint action of natural factors and human factors, soil forms a spatiotemporal continuum of nonuniform changes with high spatial variability. In an area with the same soil type, there are also significant spatial differences in soil characteristics, which is called spatial variation in soil [25,26,27,28,29]. As one of the most general attributes of soil resources, the abundance and deficiency of soil characteristics directly affect the quality of soil and thus the growth and reproduction of vegetation and crops [30]. High spatial variability in soil properties in coal–grain complex [31].
In addition, spatial variation of soil characteristics is greatly influenced by external factors, especially in soil fertility and quality [32,33,34]. Although the soil organic matter (SOM) content in soil is minimal, it is an indispensable part of the soil that provides various nutrients necessary for crop growth and development and is a key indicator for evaluating soil fertility [35,36]. The SOM can promote the soil’s ability to retain and supply fertilizers and can continuously improve cultivated land soil structure, enhance soil biological activity, and improve soil nutrient levels [37,38,39,40]. Therefore, it is important to study the SOM content and its spatial variation characteristics in coal–grain complex areas to strengthen ecological environmental protection and food security in mining areas [41,42].
Accurate information on the spatial variation in SOM is an important symbol of not only soil quality but also carbon storage in terrestrial ecosystems [43,44]. Thus, many of information on the content of SOM in space and time is needed. However, the accurate measurement of SOM content requires the acquisition of a large number of soil samples and thus considerable labor and material resources and time. It was found that due to the different scales of soil sampling, there are great differences in spatial variation, which is important for the management of precision agriculture production programs. In addition, soil fertilization and similar activities can be inconvenient [45,46]. Therefore, SOM samples need to be collected at different scales for better planning and management. In soil science, the scale effect mainly refers to the dependence of spatial variation in soil characteristics on sampling scale; that is, a certain spatial distribution feature of soil characteristics can only show a change rule at a specific sampling scale [47]. To better describe the spatial variability in soil characteristics and improve the accuracy of research results, most scholars have clearly noted that scale should be used to address practical problems. At present, most studies on the scale effect of spatial variation in soil properties focus on the comparison of soil properties at different scales. Paterson et al. [48] studied the variation law of spatial variation in soil characteristics with scale change in Australia and found that approximately 50% of the spatial variation occurred within the range of less than 10 km and 30% within the range of less than 1 km. Within that study area, the spatial variability in soil texture increased with increasing depth, the spatial variability in soil characteristics was highly random at small scale, and the randomness gradually decreased with increasing study scope. Jenerette et al. [49] used the landscape scale method to compare the degree of dependence of soil spatial variability to sampling range, as well as conducted an uncertainty analysis related to land use types and the regional scale of Phoenix. The results show that the spatial variation in soil total nitrogen and organic matter was very different at different scales. Suriyavirun et al. [50] studied the differences in soil characteristics and the spatial distribution of microorganisms at the field scale and found that soil characteristics and microorganisms were significantly different at different sampling scales. In summary, there are many studies on the spatial variability in soil properties, and they mainly focus their research on the spatial variability in soil properties at a single scale. Information on how to study the spatial variation in multiscale soil properties, how to obtain and apply multiscale spatial information, etc., is lacking, especially for soil organic matter.
Therefore, the aims of the present study are (1) to study the spatial variation characteristics and structural differences in SOM at different sampling scales; (2) to construct a multiscale fit model of the semivariance function of SOM and determine the distribution of SOM under the multiscale fit model; and (3) to analyze the main influencing factors of the spatial structure of SOM at different sampling scales and for land reclamation and ecological reconstruction in coal–grain composite areas.

2. Materials and Methods

2.1. Study Area

The study area is located in the Zhaogu No. 2 Mine in northwestern Henan Province, China (112.53°–113.63° E, 34.8°–35.5° N), as shown in Figure 1. The region is 55 km away from Jiaozuo city, 37 km away from Xinxiang city in the southeast, and 10 km away from Huixian city in the northeast. The study area is on the piedmont plain; the mountains present are primarily the Taihang Mountains; the ground elevation is generally 72–85 m; the lowest part is the coal mining subsidence area. The land is fertile; and the natural slope is 4–6%.
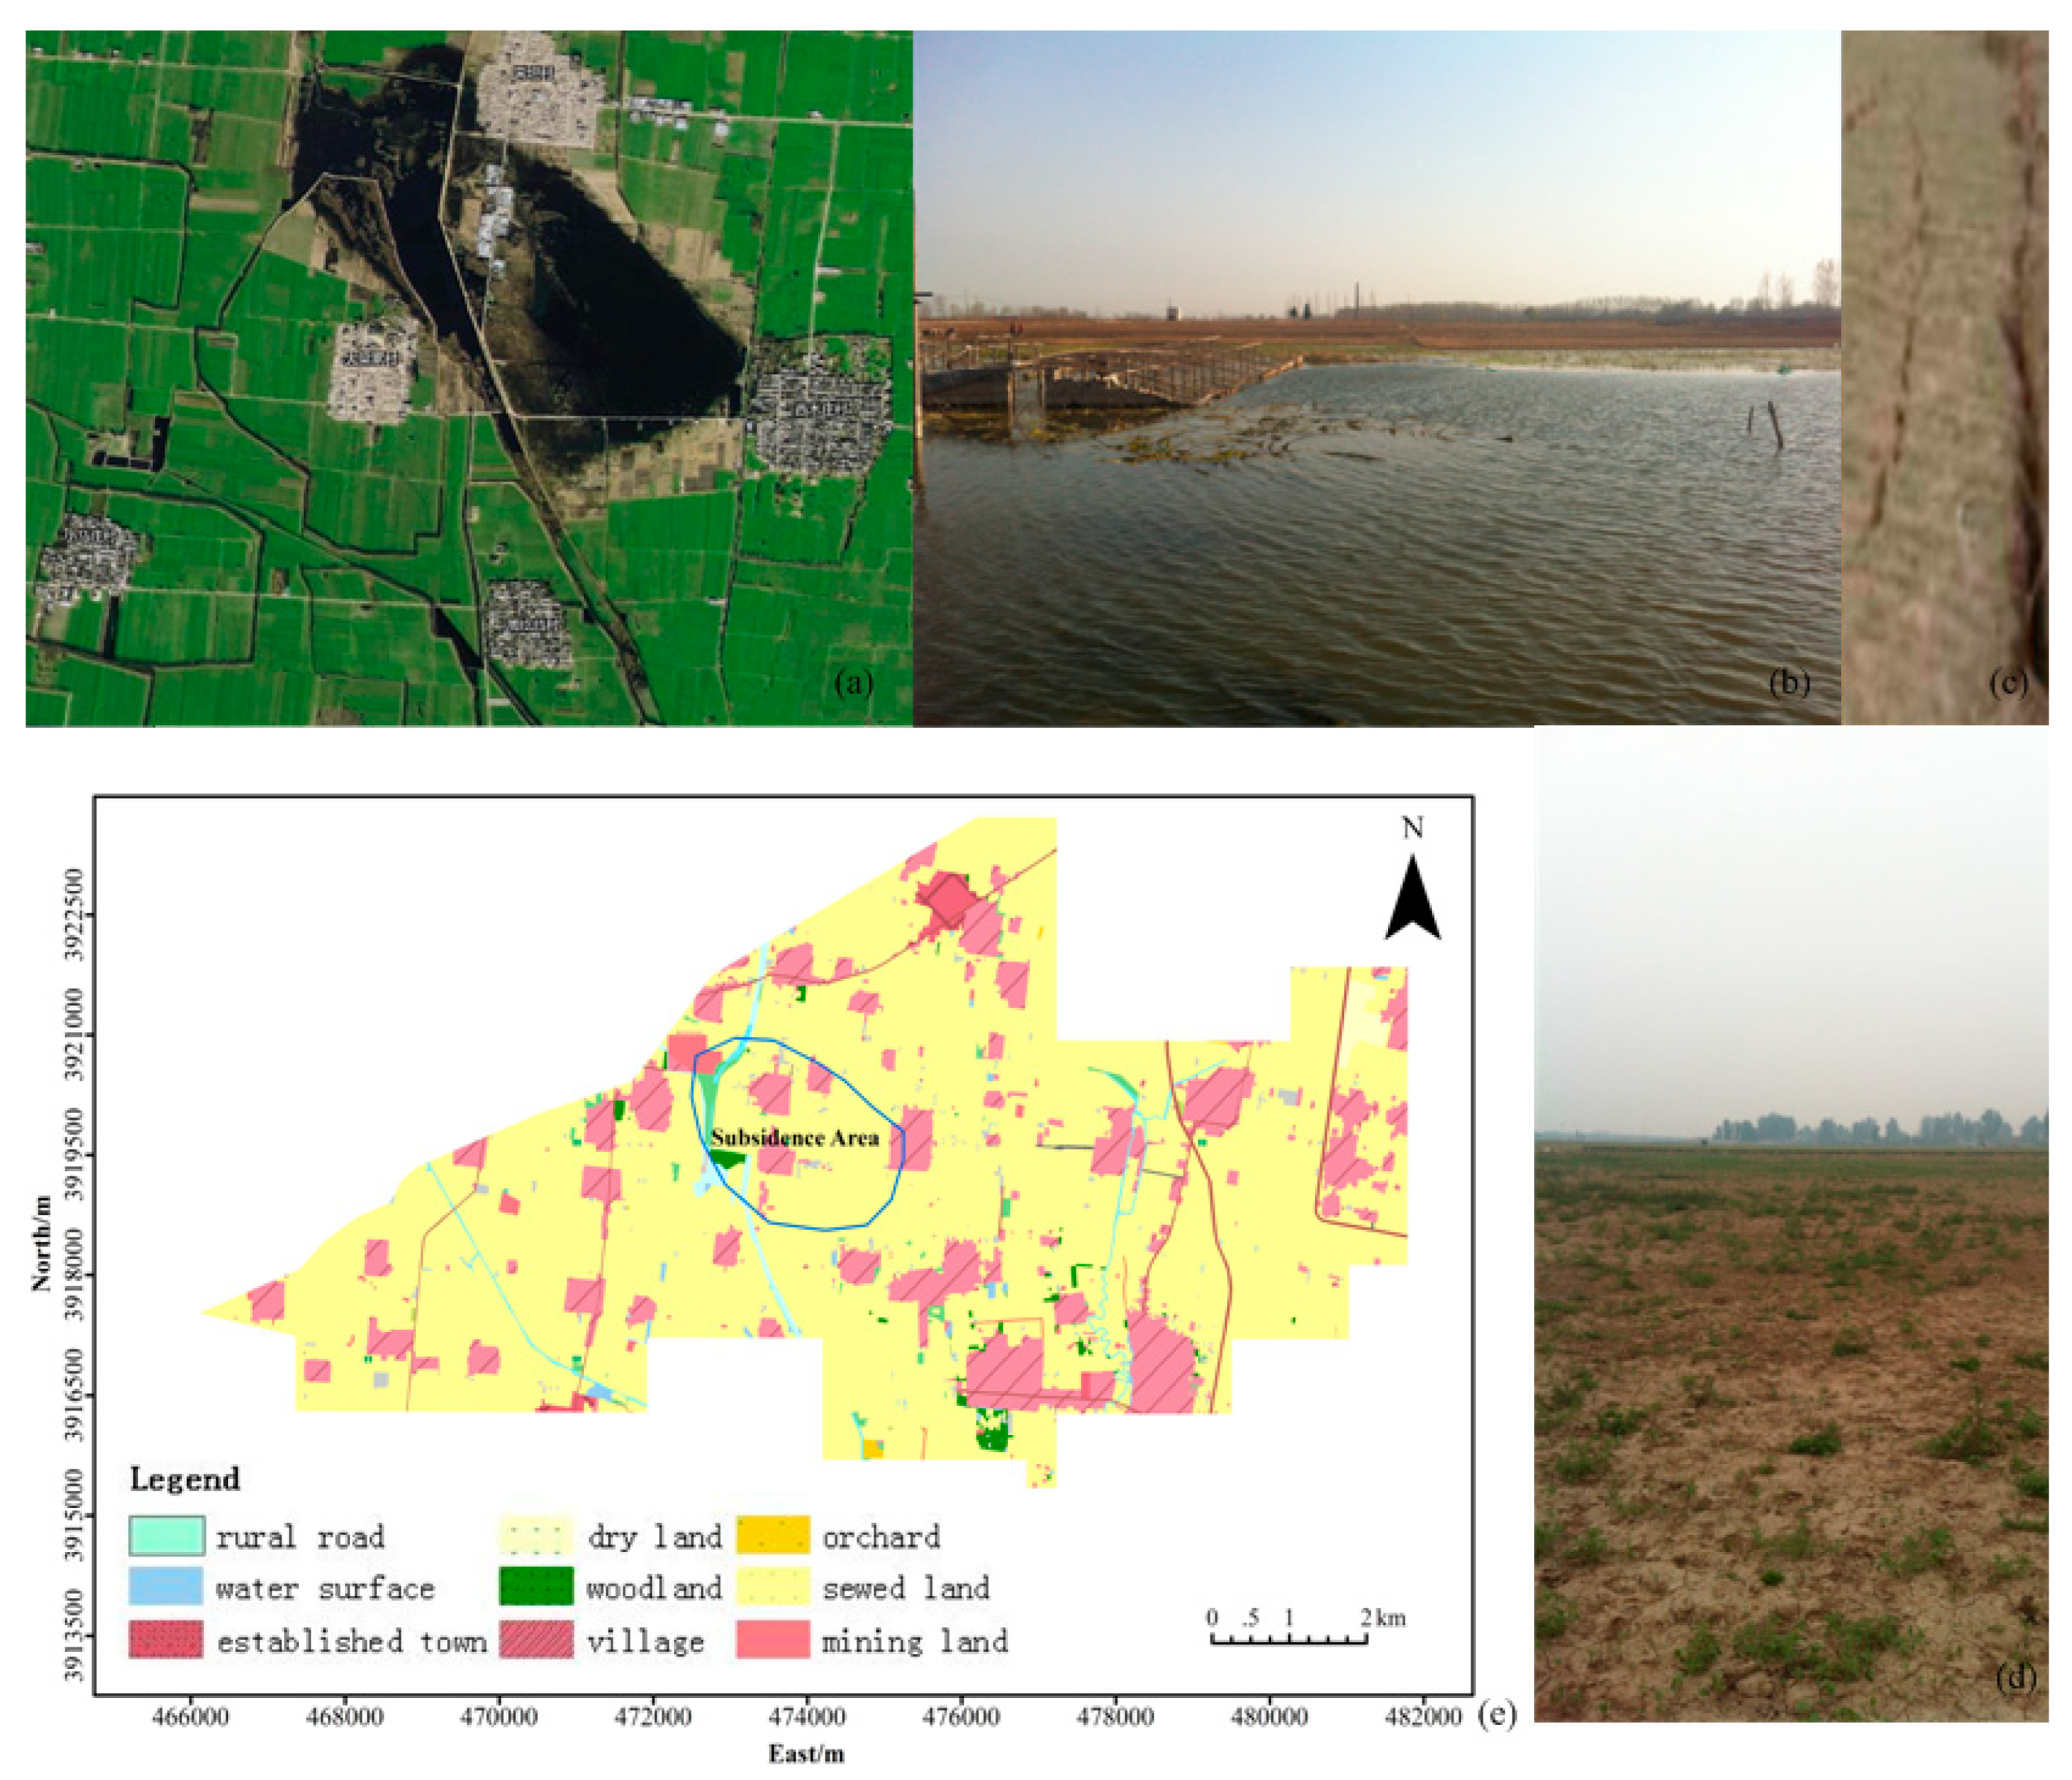
The study area is semiarid and semihumid. Spring is windy and rainy, summer is hot and rainy, autumn is cool, and winter is cold and dry. January is the coldest month; July is the hottest month. The average annual precipitation is approximately 589.1 mm, and the evaporation is 2039 mm. From July to September, there is substantial precipitation. The average monthly precipitation is 182.3 mm. The soil types at the test site were cinnamon soil, moisture soil, and paddy soil. The study area is rich in coal resources, and the identified coal reserves total approximately 1.2 billion tons. The main planted crops are wheat, rice, corn, etc., and the main economic crops are oilseeds, mushrooms, etc. Figure 2 shows the status of the research area. The total land area is 69.09 km2, including 39.38 km2 of cultivated land, 0.022 km2 of dry land, 10.21 km2 of irrigated land, and 0.079 km2 of forested land. Villages, towns, and roads cover an area of 7.389 km2. The surface area is 0.052 km2, and the subsidence area is 1.97 km2. The coal mining method in the study area is well mining, which is easy to cause a large area of surface subsidence above the goaf and produce a large number of cracks and fracture surfaces.

2.2. Soil Sampling

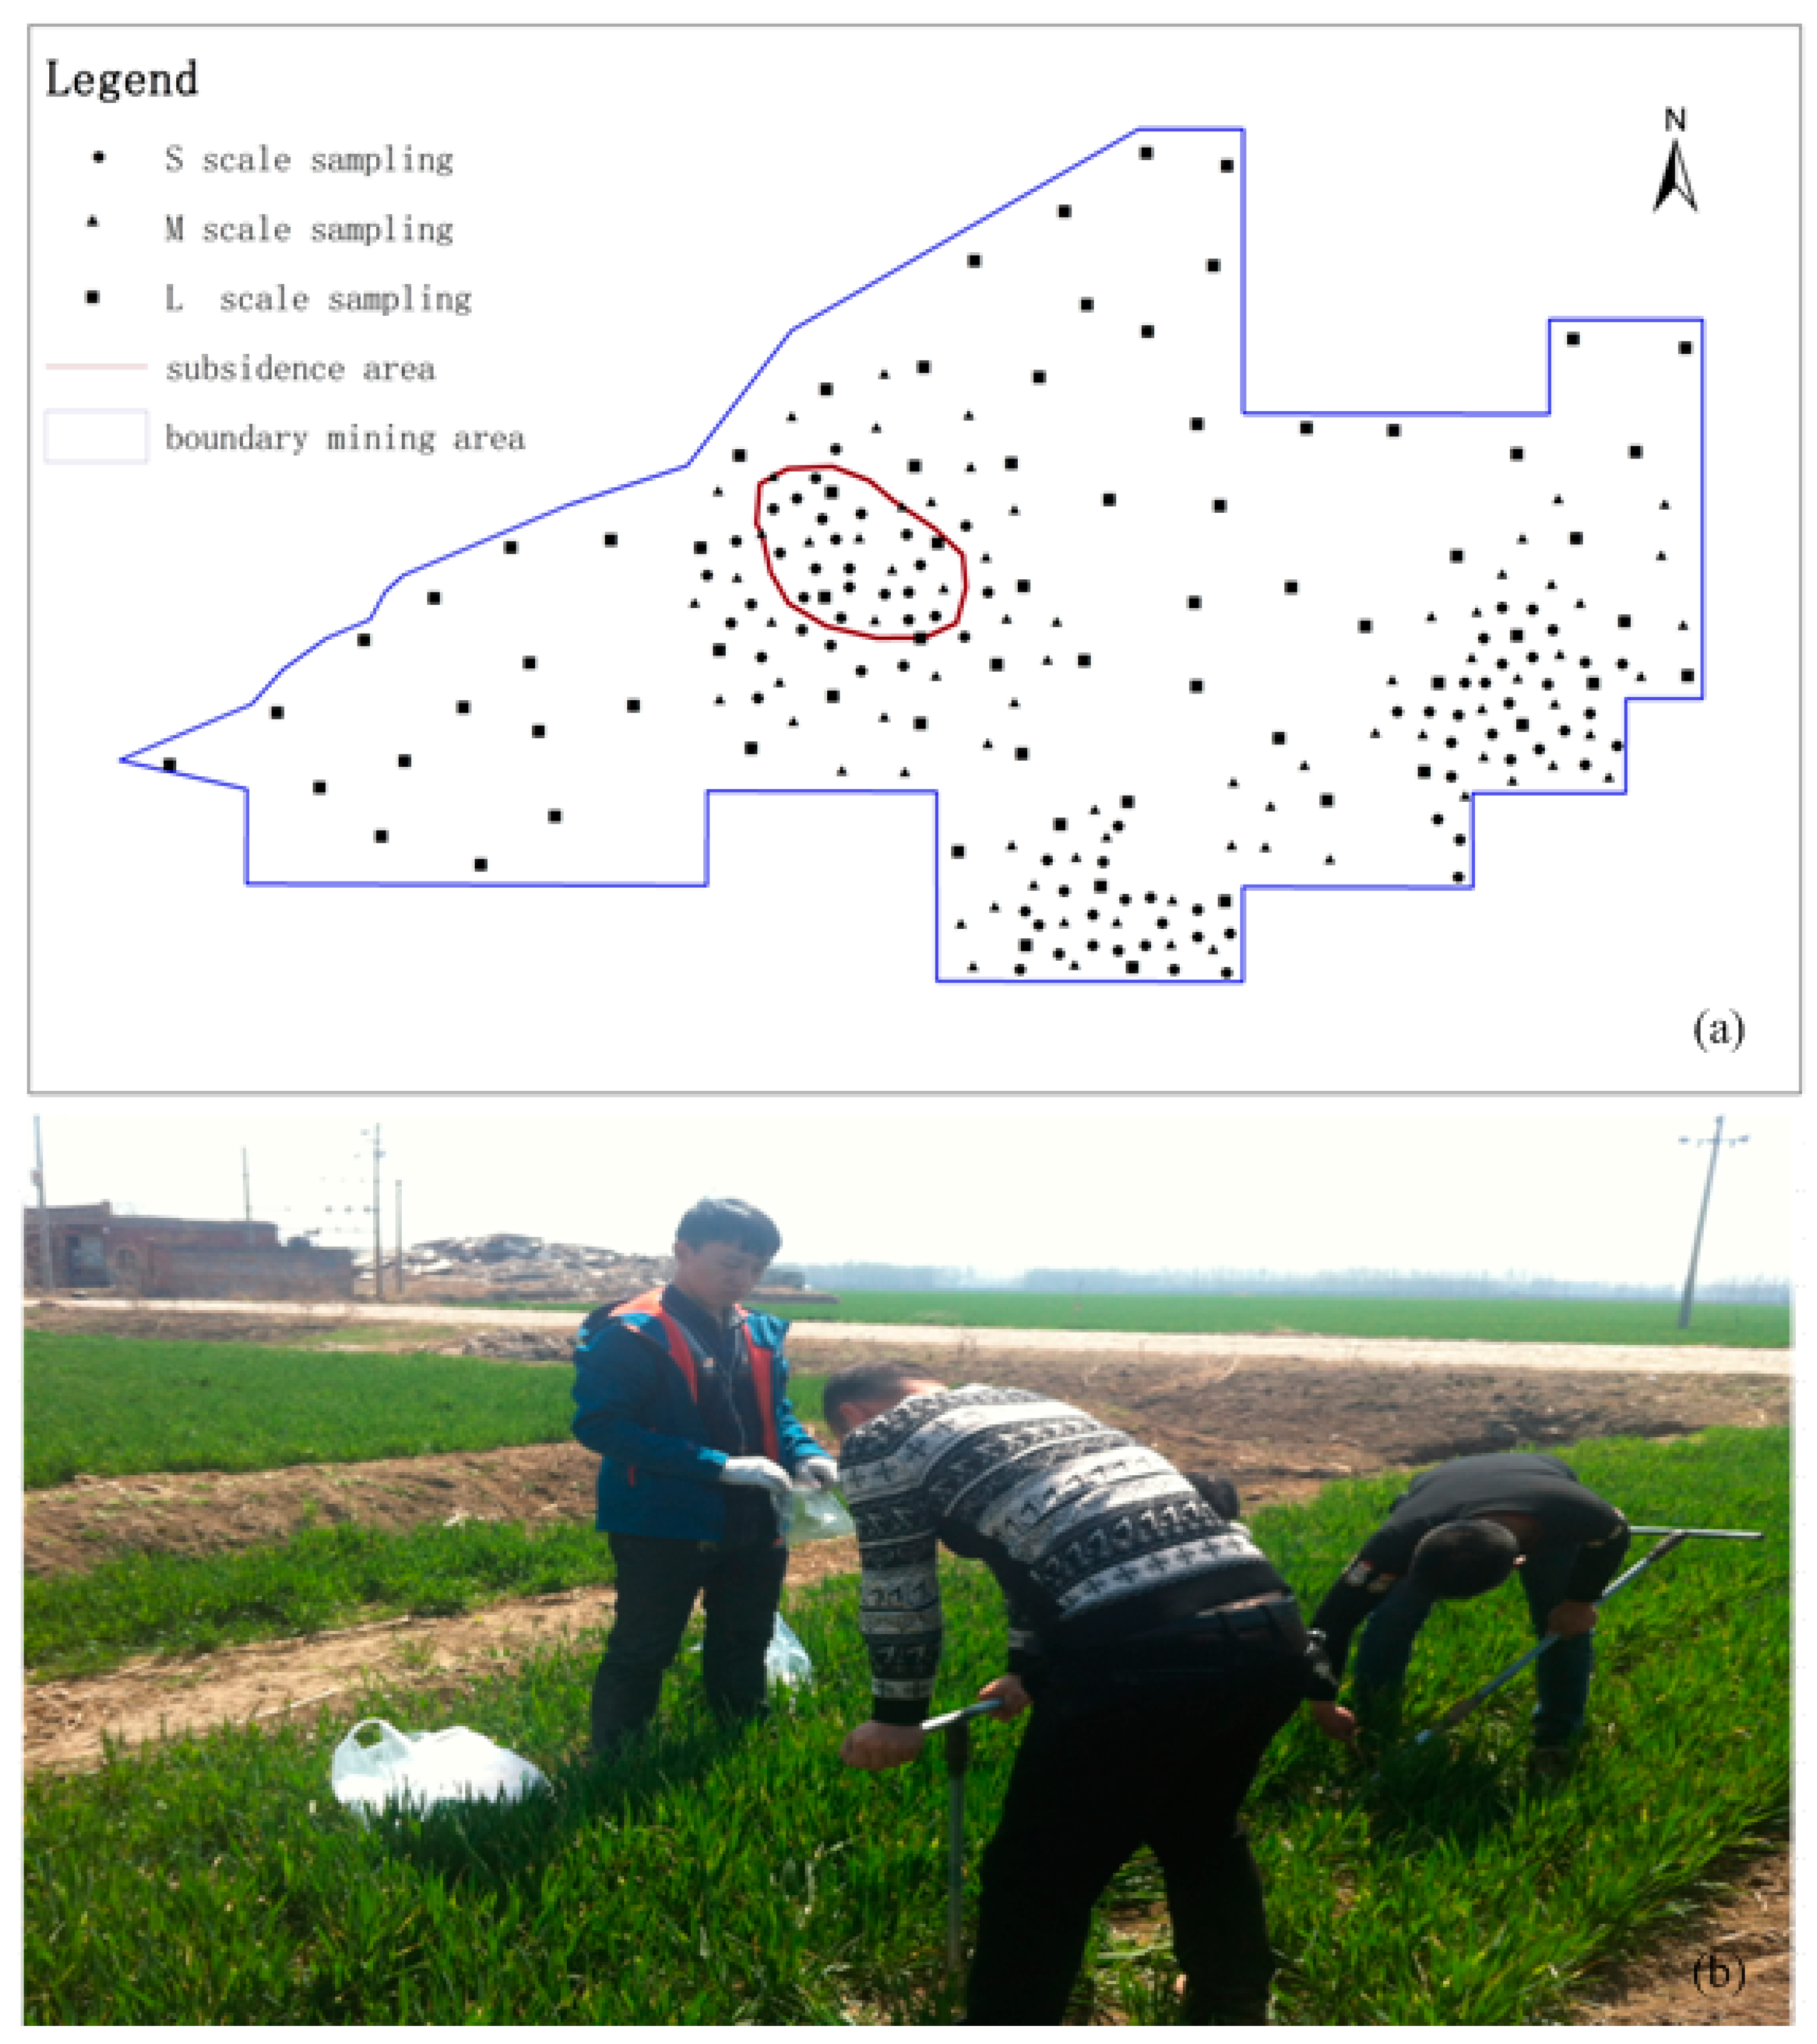
In this study, soil sampling was carried out in April 2022 in the coal–grain complex area of the Zhaogu No. 2 Mine, as shown in Figure 3. Grid nesting was implemented in the sample area, and 181 SOM samples were obtained. In order to obtain ideal experimental results, the principle of randomness and equivalence is followed during sampling. According to the sampling requirements, the design of sampling points conforms to the principles of comprehensiveness, representativeness, objectivity, feasibility, and continuity. Each sample site was 10 m in diameter, and soil samples were collected from 8–12 drill holes at a depth of 0–20 cm within the center of the circle and its radius. The soil samples representing this point were mixed. To study the scale effect of spatial variation of soil characteristics and explore the effect of multiscale fitting methods and different models on improving the accuracy of spatially estimating SOM, the actual situation of the study area was observed, the maximum sampling interval was 1000 m, and there were 72 sampling points. The distance of 1000 m was L scale. The representative coal mining subsidence area was selected as the first-level intensified area, and the sampling interval was 500 m, and there were 76 sampling points. The distance of 500 m was M scale. The same method was used as the interval of 250 m to generate a secondary sampling area with 79 samples. The distance of 250 m was S scale. Geographic coordinates of sampling points were recorded with handheld GPS. The sampling distribution is shown in Figure 3a. When collecting soil samples densely, the principles of randomness and fairness were used to uniformly select dense grids for soil sample collection, and sampling occurred using the quincunx shape. The SOM content was determined by the potassium diphosphate volumetric external heating method.

2.3. Research Methods

2.3.1. Semivariogram Model

Semi-variance function, also known as semi-variance function, is a key function in the study of soil variability in geostatistics. It reflects the spatial variation structure of variables in the study area, and can describe both structural changes of regionalized variables and random changes. It plays an extremely important role in determining the number of soil samples and the calculation of kriging interpolation. Semivariograms have been widely used in geostatistical analysis to evaluate the spatial dependence of soil properties based on regionalized variable theory and intrinsic assumptions [51]. In this paper, a variogram was used to study the soil organic matter content, and the semivariogram is expressed as:
γ ( h ) = 1 2 N ( h ) i = 1 N ( h ) [ Z ( x i ) Z ( x i + h ) ] 2
where γ ( h ) is the semivariogram, h is the spatial length; Z ( x i + h ) and Z ( x i ) represent the index measured data of the position of point x i + h and x i , respectively; and N ( h ) is the number of pairs of sample points separated by the lag distance h .

2.3.2. Multiscale Nested Model

The nested structure is the sum of multiple semivariance functions [51], and its expression is as follows:
γ ( h ) = γ 0 ( h ) + γ 1 ( h ) + γ 2 ( h ) + + γ i ( h ) = i = 0 n γ i ( h )
In the formula, γ ( h ) represents the microscopic change, which is the spatial structure that cannot be reflected at the minimum sampling scale, that is, the structural variance in the scale fit structure, and γ i ( h ) represents the same theoretical model or different theoretical models, which are reflected at different scales out of the spatial structure.

2.3.3. Model Test Method

This study adopts the I value test method, which is a comprehensive method for testing the best fit of the semivariogram function.
I = [ Z ^ ( x i ) Z ( x i ) ] 2 ¯ × [ P × | 1 1 / { [ Z ^ ( x i ) Z ( x i ) ] 2 / σ ^ ( x i ) } 2 | + ( 1 P ) ]
P = { 0.1 0 [ Z ^ ( x i ) Z ( x i ) ] 2 ¯ < 100 0.2 [ Z ^ ( x i ) Z ( x i ) ] 2 ¯ 100
where P is the empirical parameter, and the smaller the value of I is, the better the fitting effect of the semivariance function. Z ^ ( x i ) and Z ( x i ) are the predicted and measured values at the x i position, respectively.
The K-S test method is to compare the cumulative frequency distribution of sample data with a specific theoretical distribution. If the difference between the two values is small, the sample belongs to a specific distribution [42]. The basic principle of the K-S test is as follows: Assume that H 0 represents that the sample obeys a specific distribution, H 1 represents that the sample does not obey a specific assumption, F 0 ( x ) represents the theoretical distribution function, F n ( x ) represents the cumulative frequency function of any set of random samples, and D is the difference between F 0 ( x ) and F n ( x ) . The maximum value is defined as D = max | F n ( x ) F 0 ( x ) | , when the value of D is small, the H 0 hypothesis is accepted, otherwise the H 1 hypothesis is accepted.

2.4. Data Processing and Analysis

SPSS 20.0 was used to analyze the maximum, minimum, and average values of SOM content at different scales and to conduct the K-S normal distribution test (SPSS, Chicago, USA) [3]. If p < 0.05, it was accepted as significant. The variability in SOM was divided into three levels: low variability (CV < 15%), medium variability (15% ≤ CV ≤ 35%), and high variability (CV > 35%) [52].
In this study, GS+ 9.0 was used to conduct the semivariogram structure analysis and anisotropy analysis on SOM at three sampling scales and to determine the optimal semivariogram function theoretical model. The spatial structure of the SOM at the three sampling scales was cumulatively fitted, and the semivariogram function model was tested for optimality using the I value method. The spatial interpolation of the SOM was carried out by using the scale fit model method.

3. Results

3.1. SOM Content at Different Scales

Outliers refer to the existence of large or small values in the research data, and they are mainly caused by the sampling process and test analysis process. The existence of outliers will cause changes in the semivariance function. Before the spatial data analysis of soil properties, it is necessary to analyze the outliers, identify them, and eliminate them. In this study, three times the mean plus (minus)the standard deviation was used to test the specific value, and if the value was not within this range, then the maximum or minimum value was used instead. Table 1 shows the spatial distribution characteristics of soil organic matter at L, M, and S scales. The normal distribution test results for the SOM data at the three sampling scales were 0.866, 0.916, and 0.969, respectively, reaching a significant level (K-S > 0.05), which was consistent with the normal distribution law. This result indicated that the combination of sampling points at the L, M, and S scales did not change the overall distribution characteristics of SOM, and the three scales could be combined into one study. The average, maximum, and minimum values of the SOM at the three scales were different to some extent. The average values of the SOM at the L, M, and S scales were 15.92 g/kg, 14.94 g/kg, and 13.62 g/kg, respectively. The median values of the SOM were 15.61 g/kg, 14.32 g/kg, and 13.38 g/kg, respectively. The mean values and median values of the SOM at each sampling scale were close to each other, and the mean values and median values showed a decreasing trend with decreasing sampling scale, indicating that the influence of the specific values decreased. As the sampling scale decreased, the absolute values of the kurtosis coefficient and skewness coefficient increased gradually, while the coefficient of the standard deviation and variation decreased gradually, indicating that the concentration degree of data at the M scale and S scale was higher than that at the L scale; in addition, the variation was smaller. The coefficients of variation at the M and S scales were 14.93% and 14.31%, respectively, and the coefficient of variation at the L scale was 28.07%, indicating that the SOM at all three scales exhibited moderate variation.

3.2. Spatial Structure Analysis of SOM at Different Scales

When studying soil characteristics, it is necessary to consider the variation in regionalized variables in different directions. If regionalized variables have different properties in different directions, then they are referred to as anisotropic; otherwise, they are referred to as isotropic. Anisotropy is relative, while anisotropy is absolute. Anisotropy reflects the difference in the semivariance function in different directions, and isotropy is a special form of anisotropy [53]. Some scholars have shown that at least 4–8 variogram maps should be calculated to determine whether soil properties are isotropic or anisotropic by comparing the magnitudes of the principal and secondary variograms. If the ratio of the principal variogram to the secondary variogram is 1 or close to 1, then it is isotropic, indicating that regionalized variables have the same or similar changes in different directions [54]. Anisotropy needs to be converted to isotropy according to the linear proportion relationship.
The semivariogram function of the SOM at different scales was analyzed through the ArcGIS geostatistical analysis module, the semivariogram cloud view was used, the search direction and angle were automatically changed, the change in the semivariogram function was observed, and GS+ was combined to analyze the regionalization variables in different directions. This function can be determined by the change direction diagram of the range (that is, the change diagram of the range change with the direction). The anisotropy ratio of the variables at different scales and directions was 1 or close to 1 (Table 2), so the SOM content was isotropic at the L, M, and S scales.
Under isotropic conditions, the structural properties of the SOM at different scales were fitted, and the theoretical semivariance function and test parameters are shown in Table 3. The spatial variation structure of the SOM at the L and M scales was the best fitting effect of the exponential model, while the spherical model was the best at the S scale. With the increase in sampling interval, there were some differences in range, nugget value, and nugget coefficient, and they all showed an increasing trend; the structural variance in SOM at the M scale was 0.251, and the structural variance of SOM at the S scale was 0.27, with a difference of 0.019. At the same time, the difference between the ranges of the two scales was also small, so the spatial structure of the SOM at the M and S scales can be expressed as that at the M scale. When sampling, this value can be combined with the work, labor, financial resources, etc. The sampling points at the M scale were used to study the spatial variation in the SOM at the S scale. At the L scale, the nugget coefficient and nugget value were significantly greater than those at the M and S scales, and the nugget coefficient reached 50.12%, exceeding 50%, indicating that regional factors such as topography and soil type were the main factors affecting the spatial variation in large-scale SOM. The nugget coefficients at the M and S scales were relatively small, indicating that at medium and small scales, human and natural factors such as land use and fertilization management were the main factors affecting the distribution of SOM. From the L scale to the M scale, each parameter changed substantially, indicating that with the decrease in the sampling scale, new influencing factors appeared, and some influencing factors covered at the L scale appeared at the M scale. The above research shows that increasing the sampling scale can reduce the workload, and the large scale overlapped with the small scale to some degree; however, the accuracy of the analysis of the SOM spatial structure was reduced. Therefore, it is more meaningful to use a nested model of different scales for research.

3.3. Multiscale Integration of SOM

In geostatistics, the theoretical model of the variation function adopted by the kriging interpolation method requires that the regionalized variables must be isotropic. When the research variables are anisotropic, they need to be converted to isotropic in advance. In this study, the spatial variation characteristics of the SOM at different scales were isotropic, so there was no need to convert from anisotropy.
According to the theory of multiscale fit, the structural variance is the sum of the structural variances of different scales, and the nugget value of the new model is the spatial variation that cannot be expressed at the smallest scale. In this study, three scales were selected based on the differences in the spatial structures of the different scales. The method of spatial structure accumulation was used to study the fitting model, and the expression of the fitting structure of the SOM semivariance function at the L, M, and S scales was obtained according to Formula (5):
r ( h 3 ) = { 0.132 h = 0 0.132 + 0.27 ( 3 2 h 3 621 1 2 h 3 3 621 3 ) + 0.251 ( 1 e h 1135 ) + 0.206 ( 1 e h 2460 ) 0 < h < 621 0.402 + 0.251 ( 1 e h 1135 ) + 0.206 ( 1 e h 2460 ) h > 621

3.4. Accuracy Verification

The semivariance function model at the three scales was fitted by the nested structural model, and the kriging interpolation method was used for the spatial estimation, namely, the multiscale nested model interpolation; in addition, the prediction accuracy of the multiscale nested model method and the ordinary kriging interpolation method at a single scale was compared. This study used the I value to test the theoretical semivariogram function model. This method is an index for testing the optimality of the theoretical semivariogram function formed by the combination of the cross-validation method and the estimated variance test method. A smaller I value indicates that the theoretical semivariogram model fits better. At the same time, P is one of the indexes for determining the optimality of the theoretical model. The smaller the value is, the better the theoretical semivariance function model. It can be seen from Table 4 that the I value of the ordinary kriging interpolation method is 2.369, the I value of the fitted model interpolation method is 0.561, and P is also smaller than that of the ordinary kriging method, which shows that the interpolation accuracy of the multiscale fitted model method is higher compared to the ordinary kriging method. This method can better reveal the spatial variation of SOM.

3.5. Spatial Distribution of SOM

After integrating the three scale semivariance function models, the L-scale general kriging interpolation method and the multiscale embedding model method were used to estimate the SOM content in the study area, the spatial distribution map of SOM was drawn, and the interpolation results of the two methods were compared. Figure 4a shows the general kriging spatial interpolation diagram of the SOM at the L scale, and Figure 4b shows the spatial interpolation diagram of the nested model. The spatial distribution characteristics of the SOM fitted by the scale-nesting model were generally consistent with the distribution characteristics at sampling scale L. The content of the SOM in the coal mining subsidence area was relatively low; the farther away from the coal mining subsidence area, the higher the content of SOM was, and the content of SOM tended to be stable at the boundary of the mining area. This result mainly occurred because the coal mining subsidence area is most affected by underground coal mining, and the surface limit subsidence results in surface cracks, subsidence, severe soil and water loss, and losses in soil nutrients to the surrounding area; thus, of the that in the mining areas, the SOM content the coal mining subsidence area was the lowest. The farther the distance from the mining subsidence area, the less underground mining influences SOM and the more stable the content of organic matter.
In terms of expressing the spatial variability in SOM at the M and S scales, the integrated model method is more detailed. At a small scale, there was little difference in the variation in topography, soil texture, and tillage management; thus, the diffusion of SOM contents in all directions was more uniform, and the contour lines were smooth, with a tendency to form clumps. At a large scale, the spatial distribution of the SOM contents showed a zonal characteristic overall due to the influence of soil hydrothermal fertilizer, coal mining subsidence, farming methods, and other factors. Through scale integration, the spatial distribution pattern of SOM was more refined. The fertilization capacity should have further increased in the central, western marginal, and northwestern regions where the SOM content was low. At the same time, a sustainable application of organic and inorganic fertilizers should be emphasized, and the proper use of tillage systems such as intercropping and rotation should be adopted to improve the soil quality. The content of soil organic matter was relatively high in the north, west, and southeast of the study area, so the soil should maintain its fertility retention ability.
In this study, three scales were nested to collect SOM samples, the sampling points were locally coded, and the overall spatial distribution was unbalanced. Therefore, the nested model and the ordinary kriging method were used to carry out spatial interpolation at the L scale in the sample area, and the ordinary kriging standard error prediction map was drawn. The kriging standard error prediction of the SOM at the L scale is shown in Figure 5a, and the kriging standard error prediction of the SOM using the nested model is shown in Figure 5b. The standard prediction error was mainly caused by the original error in the sample data and the uncertainty caused by the uneven distribution of the sample points in the spatial interpolation.
Comparing the estimation accuracy of the two methods can provide a reference and basis for the design of a sample point scheme for studying soil nutrient spatial variation. It can be seen from Figure 3 that the estimation accuracy of nested value model interpolation had a wide variation range and was highly sensitive to distance variation. At the S sampling scale, the estimation accuracy of the fitting model method was significantly higher than that of the ordinary kriging method. With the increase in the sampling scale, the accuracy gradually decreased. The interpolation accuracy of the ordinary kriging method increased, and when the L-scale sampling distance was reached, the interpolation accuracy value of the fitted model method was similar to that of the ordinary kriging method. Therefore, on the basis of the L-scale sample points, the multiscale fitting structure model obtained interpolation results with higher estimation accuracy.
From the standard error prediction graph, it can be seen that the farther away from the sampling point, the greater the interpolation error, and the smallest error around the sampling point. And at the boundary of the study area, the error is the largest. It shows that there is a marginal effect on the accuracy of spatial interpolation of soil organic matter, because the sampling points in the boundary area are relatively sparse, resulting in a decrease in the estimation accuracy at the boundary; while the sampling points in the non-boundary area are denser, the prediction error is smaller.
Table 5 shows the statistical results of the two methods of interpolation for SOM, and the resulting value was greater than the measured value. The maximum and minimum values for the SOM obtained by the nested model interpolation method were greater than the measured values, the coefficient of variation was smaller than the measured values, and the average value was equal to the measured values. Thus, the kriging interpolation method had a certain smoothing effect on the data, and in comparison to the ordinary kriging method, the fit model interpolation method resulted in a higher degree of agreement between the predicted value of SOM and the measured value, indicating that the interpolation effect of the fit model method was due to the grid method.

4. Discussion

In this paper, the SOM content was generally the lowest in the coal mining subsidence area, and the farther away from the coal mining subsidence area, the higher the SOM content was; in addition, the spatial variability in the SOM content was moderate. Soil texture, slope size, land use type, microbial content, underground coal mining, artificial fertilization, irrigation, and other factors all affected the spatial distribution of the SOM. In Panagea’s study, the results showed that under different management measures, the change in soil organic carbon was not obvious, and an increased soil water-holding capacity could be obtained by reducing soil disturbance and increasing fertilization of SOM [55]. Chiara Piccini et al. studied the spatial variability in SOM in the Abruzzo region of central Italy. The results showed that soil organic carbon storage and SOM content in hilly areas were relatively low, and soil management methods should be improved to ensure the sustainable development of agricultural land [56].

4.1. Effect of Sample Size on the Spatial Variability in SOM

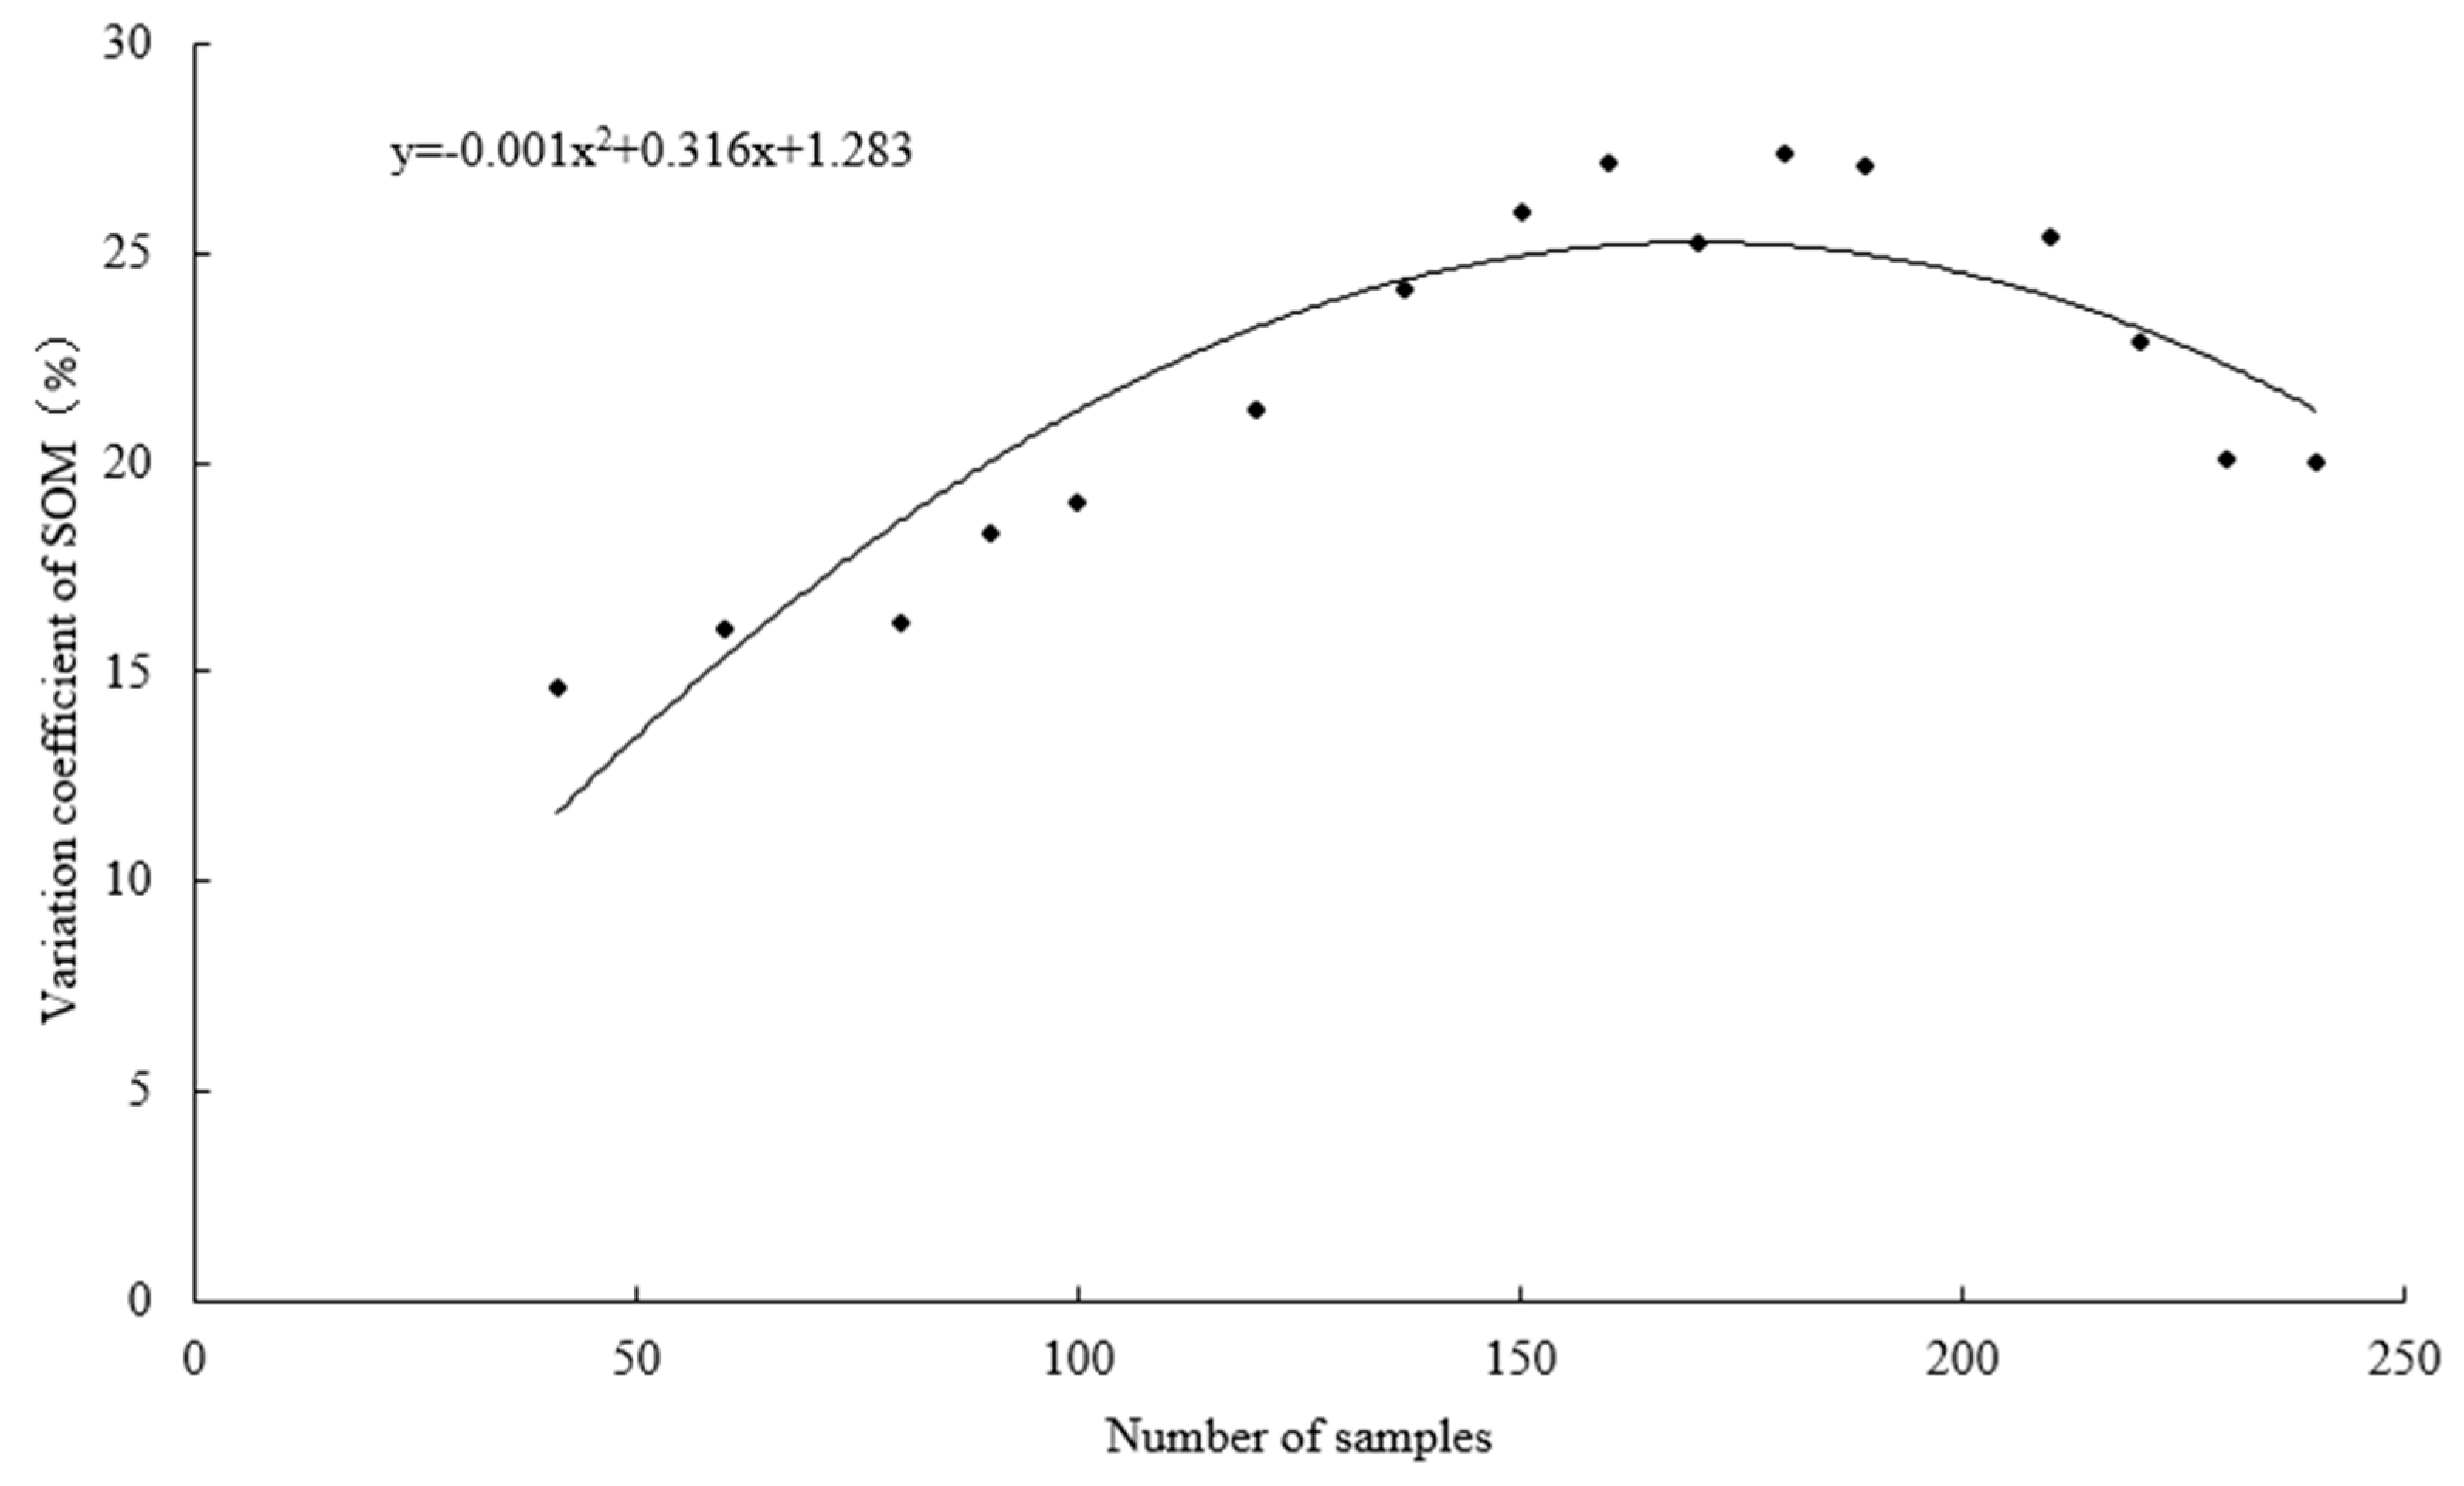
This study found that the number of sample sampling points had a specific impact on the spatial variability in SOM. Too many sampling points will result in wasted resources, but fewer sampling points will not be representative and cannot reflect the spatial distribution characteristics and variability in SOM. In this study, 72 soil samples were obtained at the L scale, 76 at the M scale, and 79 at the S scale, and a total of 227 soil samples were obtained. A correlation analysis was conducted on the number of SOM samples in the study area and the coefficient of spatial variation, as shown in Figure 6. Within a specific range of soil samples, with the increase in the number of soil samples, the spatial variation coefficient of the SOM content increased, and the spatial variation in the SOM content showed a positive correlation with the number of soil samples. The results show that the spatial variation in SOM can be better expressed by using the three scale sets as statistical units and sampling points between 150 and 180.

4.2. Effect of Soil Type on SOM

There were three main soil types in the study area, namely, brown soil, tidal soil, and paddy soil, as shown in Table 6. There were significant differences in the SOM content among the different soil types. Ninety-six samples were collected from the brown soil, and the average SOM content in this soil was 20.09 g/kg. Seventy-three soil samples were collected from the tidal soil, and the average content of SOM in this soil was 10.26 g/kg. There were 58 soil samples collected from the paddy soil, and the average content of SOM in this soil was 17.41 g/kg. The average SOM content of the different soil types occurred in the order of brown soil > paddy soil > tidal soil. The variation coefficient of the SOM content in the different soil types occurred in the order of tidal soil > brown soil > paddy soil, and the spatial variation coefficient of the SOM in the tidal soil was the largest.
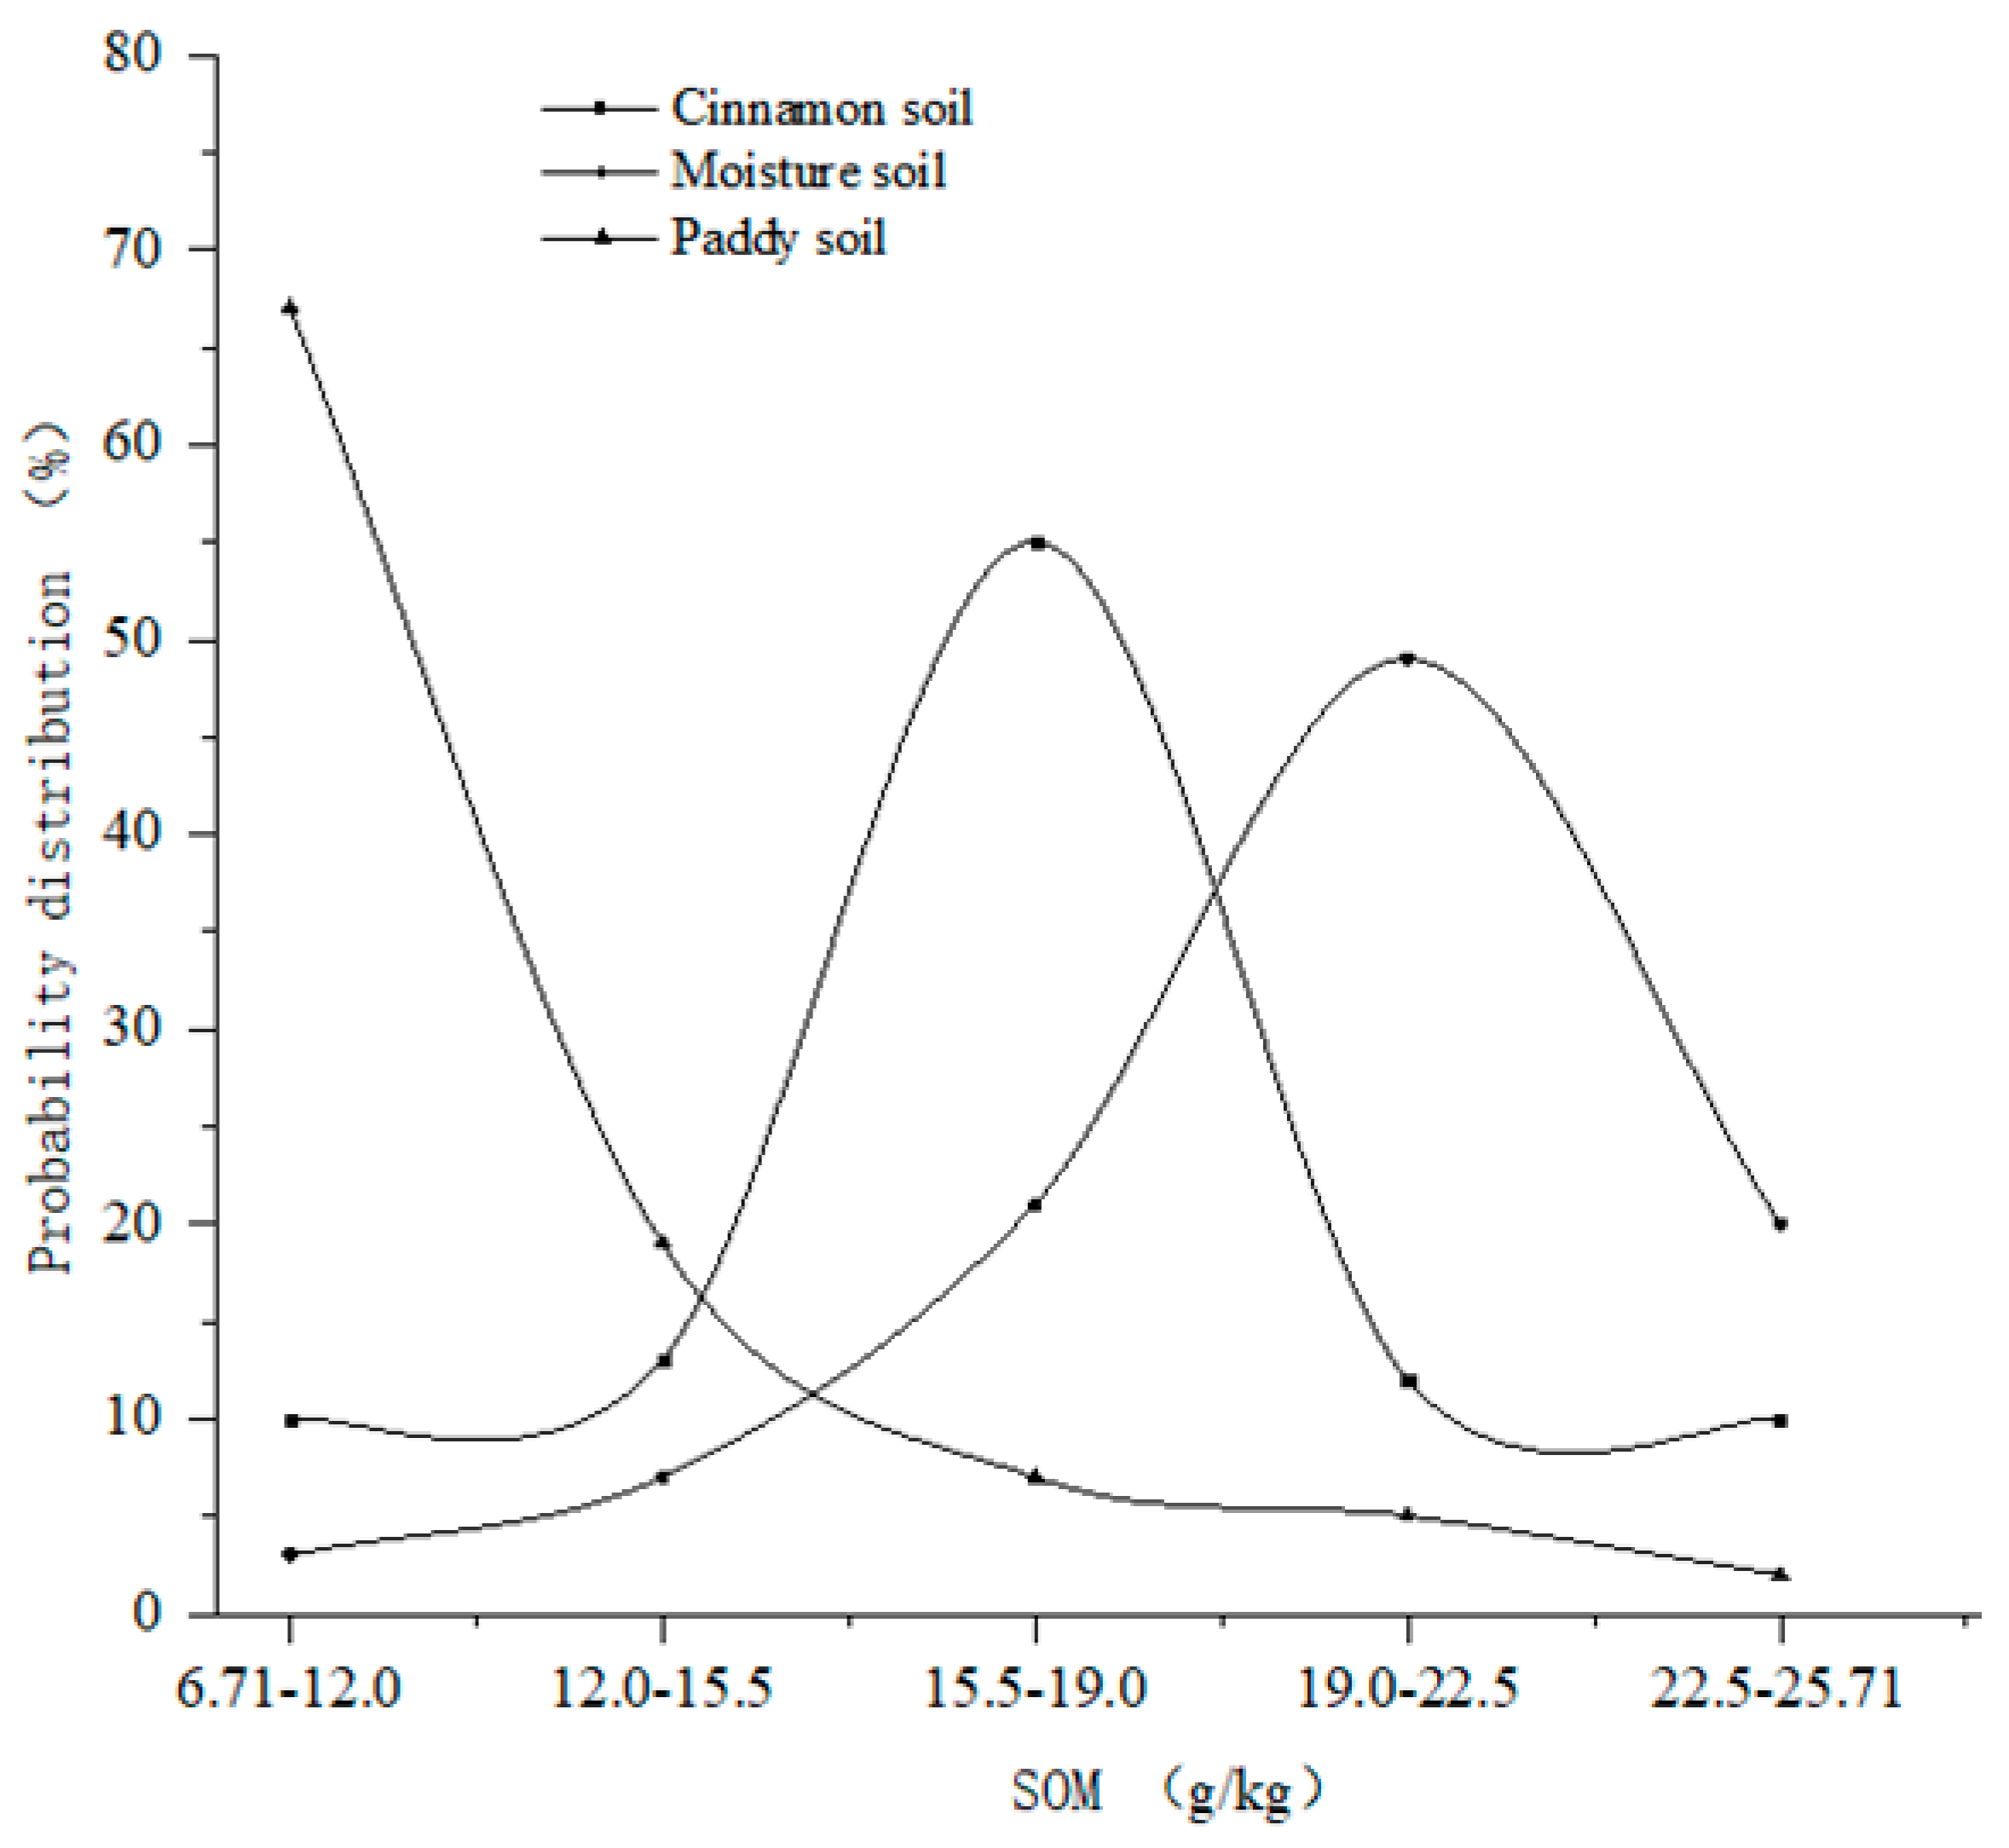
It can be seen from Figure 7 that the SOM content in the moisture soil was 16.0–19.5 g/kg, accounting for approximately 55% of the overall distribution. The SOM content in the cinnamon soil was 19.5–25.5 g/kg, accounting for approximately 47% of the total distribution, and the SOM content was greater than 23.0 g/kg and 13.0–16.0 g/kg, accounting for approximately 38% of the total distribution. The SOM content in the paddy soil was approximately 70% of the overall distribution.

4.3. Other Factors Affecting SOM

Related studies have found that natural and human factors account for more than 75% of the impacts on the spatial variation in SOM. The SOM content is often correlated with soil properties and is influenced by both physical and chemical processes. The results of this study are consistent with those of previous studies and provide a systematic analysis of the factors affecting the spatial distribution of SOM [57]. Coal mining can cause the surface to subside, resulting in a large number of fractures [42]. In this study, there were many different sized cracks in the study area, which affected soil respiration and then the spatial distribution of SOM. Figure 4 shows the spatial distribution characteristics of the SOM in the coal mining subsidence area. The farther away from the underground mining area, the higher the SOM content was; the SOM content was lower in the mining area and surrounding areas because the mining area was most affected by coal mining, which resulted in ground subsidence, cracks, water accumulation, salinization, etc., [58]. Cracks promote soil respiration, changing soil temperature, and moisture, leading to increased microbial decomposition capacity [59]. At the same time, underground coal mining leads to a decrease in soil water content, which also affects the content of SOM. In addition, underground coal mining leads to water and soil erosion, the loss of soil nutrients from high-lying areas to low-lying areas, severe soil erosion. Due to the low groundwater level in the Zhaogu mining area, coal mining has led to an increase in the surface water level, resulting in a large amount of accumulated water in the subsidence area [19], as shown in Figure 2b. Waterlogging in the subsidence area will increase soil viscosity, reduce soil respiration.
In addition, different land-use patterns and fertilization management also have had impacts on the content of SOM, as shown in Figure 2e. The SOM content of the cultivated land was relatively high, while the soil organic matter content of the sandy land and mining areas was relatively low. Farmers’ management methods implemented on different cultivated lands have also caused differences in soil organic matter content. Farmers use substantial energy managing irrigated land and high-quality farmland through efforts such as scientifically controlling the amount of organic fertilizer application, crop rotation, and returning straw to the field, to reduce the loss of SOM and other nutrients; investment in the management of dry land and subsidence areas involves less energy; and few people fertilize and manage abandoned cultivated land, so the soil fertility of abandoned cultivated land is low. The organic fertilizer applied by farmers in irrigated land is basically purchased in accordance with the recommendation of formula fertilization, and the fertilizer is suitable for the disease of the land. Therefore, the proportion of fertilizer applied in the study area tends to be reasonable. Overall, different management methods related to fertilization and fertilizer conservation have different effects on different cultivated lands.
Yang Qiyong et al. [60] used geostatistical methods to explore the spatial variation characteristics of farmland soil properties at county and township scales. The results showed that, except for total nitrogen, the spatial autocorrelation of soil properties decreased as the sampling scale decreased for other soil indicators, and the coefficient of variation increased. Qin Jingtao et al. [61] took the sandy loam area in northern Henan as the research area to study the spatial variation of farmland soil moisture content at different scales, and found that the larger the sampling scale, the lower the confidence level of the normal distribution of soil moisture content. The overall performance was that the standard deviation and coefficient of variation of soil moisture content gradually increased with the increase in sampling scale. The larger the sampling scale, the stronger the spatial variability of moisture content. However, it should be pointed out that most of the previous studies focused on the spatial distribution characteristics of soil properties at different scales, and there were fewer reports on using scale nesting model to study soil properties. Therefore, the multi-scale integration method was used in this study to study the spatial distribution characteristics of SOM in the coal–grain composite area. It can not only improve the accuracy of interpolation, but also save manpower, material, and financial resources. At the same time, the results can provide reference for farmers to apply fertilizer.

5. Conclusions

This study considered the SOM in the coal mining subsidence area of the Zhaogu No. 2 Mine as the research object, used three sampling scales (L, M, and S) to study the spatial scale variability in SOM, and analyzed the spatial variation structure of the SOM at the different sampling scales. The results showed that (1) SOM had spatial variability at different scales, and at all scales, the spatial variability was moderate. The spatial structure at the M and S scales was expressed at the M scale, and the distribution of soil sampling points at the M scale was considered to be approximate to the spatial variation in SOM at the S scale. (2) The spatial distributions of the SOM simulated by the single-scale ordinary kriging interpolation method and the fitted model interpolation method were generally consistent, but the fitted model interpolation method was more accurate in expressing the spatial variability in the medium- and small-scale organic matter. The I-value test results showed that the interpolation results of the multiscale fitting model method improved the reliability of the application. (3) Under different sampling scales, the size of the sample had a certain impact on the expression of the spatial variation in SOM; soil type could affect the spatial distribution of soil organic matter. However, this study only discusses the multi-scale nested model method based on the small-scale area of the mining area, and its application in the large regional scale needs to be further verified. In addition, the results of this study provide a theoretical basis for ecological protection and agricultural sustainable development in coal–grain complex areas.

Author Contributions

H.Z. analyzed the data and drafted the paper; W.L. created the tables and figures; Q.H. reviewed the related literature and modified the manuscript format; and X.H. contributed valuable opinions during manuscript writing. All authors have read and agreed to the published version of the manuscript.

Funding

This work was supported by the Joint Funds of the National Natural Science Foundation of China (U21A20109) and the Doctoral Fund of North China University of Water Resources and Electric Power (40933).

Institutional Review Board Statement

Not applicable.

Informed Consent Statement

Not applicable.

Data Availability Statement

Not applicable.

Acknowledgments

We thanks go to all those who contributed to this research, and to the reviewers who read the first draft of this paper.

Conflicts of Interest

The authors declare no conflict of interest.

References

  1. Liu, X.; Bai, Z.; Zhou, W.; Cao, Y.; Zhang, G. Changes in soil properties in the soil profile after mining and reclamation in an opencast coal mine on the Loess Plateau, China. Ecol. Eng. 2017, 98, 228–239. [Google Scholar] [CrossRef] [Green Version]
  2. Guo, J.; Zhang, Y.; Huang, H.; Yang, F. Deciphering soil bacterial community structure in subsidence area caused by underground coal mining in arid and semiarid area. Appl. Soil Ecol. 2021, 163, 103916. [Google Scholar] [CrossRef]
  3. Zhang, H.; Liu, W.; Zhang, H.; Fan, L.; Ma, S. Spatial distribution of soil organic matter in a coal mining subsidence area. Acta Agric. Scand. Sect. B—Soil Plant Sci. 2019, 70, 117–127. [Google Scholar] [CrossRef]
  4. Wang, Y.; Luo, C.; Zhang, W.; Meng, X.; Liu, Q.; Zhang, X.; Liu, H. Remote Sensing Prediction Model of Cultivated Land Soil Organic Matter Considering the Best Time Window. Sustainability 2022, 15, 469. [Google Scholar] [CrossRef]
  5. Ivanova, S.; Vesnina, A.; Fotina, N.; Prosekov, A. An Overview of Carbon Footprint of Coal Mining to Curtail Greenhouse Gas Emissions. Sustainability 2022, 14, 15135. [Google Scholar] [CrossRef]
  6. Ahirwal, J.; Maiti, S.K. Assessment of soil properties of different land uses generated due to surface coal mining activities in tropical Sal (Shorea robusta) forest, India. Catena 2016, 140, 155–163. [Google Scholar] [CrossRef]
  7. Ahirwal, J.; Maiti, S.K. Restoring coal mine degraded lands in India for achieving the United Nations-Sustainable Development Goals. Restor. Ecol. 2021, 30, e13606. [Google Scholar] [CrossRef]
  8. Sun, J.; Guo, E.; Yang, X.; Kong, Y.; Yang, L.; Liu, H.; Lin, X. Seasonal and spatial variations in soil biochemical properties in areas with different degrees of mining subsidence in Central China. SSRN. 2022, 508, 21. [Google Scholar] [CrossRef]
  9. De Valck, J.; Williams, G.; Kuik, S. Does coal mining benefit local communities in the long run? A sustainability perspective on regional Queensland, Australia. Resour. Policy 2021, 71, 102009. [Google Scholar] [CrossRef]
  10. Ahirwal, J.; Pandey, V.C. Restoration of mine degraded land for sustainable environmental development. Restor. Ecol. 2020, 29, e13268. [Google Scholar] [CrossRef]
  11. Li, S.; Wang, J.; Zhang, M.; Tang, Q. Characterizing and attributing the vegetation coverage changes in North Shanxi coal base of China from 1987 to 2020. Resour. Policy 2021, 74, 102331. [Google Scholar] [CrossRef]
  12. Ma, Q.; Wu, J.; He, C.; Fang, X. The speed, scale, and environmental and economic impacts of surface coal mining in the Mongolian Plateau. Resour. Conserv. Recycl. 2021, 173, 105730. [Google Scholar] [CrossRef]
  13. Jarašiūnas, G.; Kinderiene, I. Impact of agro-environmental systems on soil erosion processes and soil properties on hilly landscape in Western Lithuania. J. Environ. Eng. Landsc. Manag. 2015, 24, 60–69. [Google Scholar] [CrossRef]
  14. Wang, J.; Zhang, J.; Feng, Y. Characterizing the spatial variability of soil particle size distribution in an underground coal mining area: An approach combining multi-fractal theory and geostatistics. Catena 2019, 176, 94–103. [Google Scholar] [CrossRef]
  15. Nie, X.; Hu, Z.; Ruan, M.; Zhu, Q.; Sun, H. Remote-Sensing Evaluation and Temporal and Spatial Change Detection of Ecological Environment Quality in Coal-Mining Areas. Remote Sens. 2022, 14, 345. [Google Scholar] [CrossRef]
  16. Arefieva, O.; Nazarkina, A.V.; Gruschakova, N.V.; Skurikhina, J.E.; Kolycheva, V.B. Impact of mine waters on chemical composition of soil in the Partizansk Coal Basin, Russia. Int. Soil Water Conserv. Res. 2019, 7, 57–63. [Google Scholar] [CrossRef]
  17. Liao, Q.; Liu, X.; Xiao, M. Ecological Restoration and Carbon Sequestration Regulation of Mining Areas—A Case Study of Huangshi City. Int. J. Environ. Res. Public Health 2022, 19, 4175. [Google Scholar] [CrossRef]
  18. Omeka, M.E.; Igwe, O.; Unigwe, C.O. An integrated approach to the bioavailability, ecological, and health risk assessment of potentially toxic elements in soils within a barite mining area, SE Nigeria. Environ. Monit. Assess. 2022, 194, 1–30. [Google Scholar] [CrossRef]
  19. Ignacy, D. Comprehensive method of assessing the flood threat of artificially drained mine subsidence areas for identification and sustainable repair of mining damage to the aquatic environment. Water Resour. Ind. 2021, 26, 100153. [Google Scholar] [CrossRef]
  20. Zerizgh, T.; Guo, Q.; Tian, L.; Wei, R.; Zhao, C. An integrated approach to quantify ecological and human health risks of soil heavy metal contamination around coal mining area. Sci. Total Environ. 2022, 814, 152653. [Google Scholar] [CrossRef]
  21. Ma, K.; Zhang, Y.; Ruan, M.; Guo, J.; Chai, T. Land Subsidence in a Coal Mining Area Reduced Soil Fertility and Led to Soil Degradation in Arid and Semi-Arid Regions. Int. J. Environ. Res. Public Health 2019, 16, 3929. [Google Scholar] [CrossRef] [Green Version]
  22. Donnell, M.S.O.; Manier, D.J. Spatial Estimates of Soil Moisture for Understanding Ecological Potential and Risk: A Case Study for Arid and Semi-Arid Ecosystems. Land 2022, 11, 1856. [Google Scholar] [CrossRef]
  23. Long, L.; Liu, Y.; Chen, X.; Guo, J.; Li, X.; Guo, Y.; Zhang, X.; Lei, S. Analysis of Spatial Variability and Influencing Factors of Soil Nutrients in Western China: A Case Study of the Daliuta Mining Area. Sustainability 2022, 14, 2793. [Google Scholar] [CrossRef]
  24. Iskandar, I.; Suryaningtyas, D.T.; Baskoro, D.P.T.; Budi, S.W.; Gozali, I.; Saridi, S.; Masyhuri, M.; Dultz, S. The regulatory role of mine soil properties in the growth of revegetation plants in the post-mine landscape of East Kalimantan. Ecol. Indic. 2022, 139, 108877. [Google Scholar] [CrossRef]
  25. Liu, F.; Wang, X.; Chi, Q.; Tian, M. Spatial variations in soil organic carbon, nitrogen, phosphorus contents and controlling factors across the “Three Rivers” regions of southwest China. Sci. Total Environ. 2021, 794, 148795. [Google Scholar] [CrossRef]
  26. Kaminski, M.; Smolka, G. Clausal Tableaux for Hybrid PDL. Electron. Notes Theor. Comput. Sci. 2021, 278, 99–113. [Google Scholar] [CrossRef] [Green Version]
  27. Wang, Z.; Wang, G.; Zhang, G.; Wang, H.; Ren, T. Effects of land use types and environmental factors on spatial distribution of soil total nitrogen in a coalfield on the Loess Plateau, China. Soil Tillage Res. 2021, 211, 105027. [Google Scholar] [CrossRef]
  28. Pelegrino, M.H.P.; Silva, S.H.G.; de Faria, Á.J.G.; Mancini, M.; Teixeira, A.F.D.S.; Chakraborty, S.; Weindorf, D.C.; Guilherme, L.R.G.; Curi, N. Prediction of soil nutrient content via pXRF spectrometry and its spatial variation in a highly variable tropical area. Precis. Agric. 2021, 23, 18–34. [Google Scholar] [CrossRef]
  29. Xu, T.; Yi, S.; Zhou, Y.; Li, Q.; Liu, Y. Temporal and Spatial Changes and Driving Forces of Soil Properties in Subtropical Mountainous Areas from 2017 to 2020: A Case Study of Baokang County, Hubei Province, China. Land 2022, 11, 1735. [Google Scholar] [CrossRef]
  30. Voltr, V.; Menšík, L.; Hlisnikovský, L.; Hruška, M.; Pokorný, E.; Pospíšilová, L. The Soil Organic Matter in Connection with Soil Properties and Soil Inputs. Agronomy 2021, 11, 779. [Google Scholar] [CrossRef]
  31. Bennett, J.M.; Melland, A.R.; Eberhard, J.F.; Paton, C.; Clewett, J.F.; Newsome, T.; Baillie, C. Rehabilitating open-cut coal mine spoil for a pasture system in south east Queensland, Australia: Abiotic soil properties compared with unmined land through time. Geoderma Reg. 2021, 25, e00364. [Google Scholar] [CrossRef]
  32. Hu, W.; Shen, Q.; Zhai, X.; Du, S.; Zhang, X. Impact of environmental factors on the spatiotemporal variability of soil organic matter: A case study in a typical small Mollisol watershed of Northeast China. J. Soils Sediments 2021, 21, 736–747. [Google Scholar] [CrossRef]
  33. Crookston, B.S.; Yost, M.A.; Bowman, M.; Veum, K.; Cardon, G.; Norton, J. Soil health spatial-temporal variation influence soil security on Midwestern, U.S. farms. Soil Secur. 2021, 3, 100005. [Google Scholar] [CrossRef]
  34. Tang, S.; Du, C.; Nie, T. Inversion Estimation of Soil Organic Matter in Songnen Plain Based on Multispectral Analysis. Land 2022, 11, 608. [Google Scholar] [CrossRef]
  35. Angst, G.; Mueller, K.E.; Nierop, K.G.J.; Simpson, M.J. Plant- or microbial-derived? A review on the molecular composition of stabilized soil organic matter. Soil Biol. Biochem. 2021, 156, 108189. [Google Scholar] [CrossRef]
  36. Witzgall, K.; Vidal, A.; Schubert, D.I.; Höschen, C.; Schweizer, S.A.; Buegger, F.; Pouteau, V.; Chenu, C.; Mueller, C.W. Particulate organic matter as a functional soil component for persistent soil organic carbon. Nat. Commun. 2021, 12, 1–10. [Google Scholar] [CrossRef]
  37. Bradford, M.A.; Wood, S.A.; Addicott, E.T.; Fenichel, E.P.; Fields, N.; González-Rivero, J.; Jevon, F.V.; Maynard, D.S.; Oldfield, E.E.; Polussa, A.; et al. Quantifying microbial control of soil organic matter dynamics at macrosystem scales. Biogeochemistry 2021, 156, 19–40. [Google Scholar] [CrossRef]
  38. Chen, L.; Liu, L.; Qin, S.; Yang, G.; Fang, K.; Zhu, B.; Kuzyakov, Y.; Chen, P.; Xu, Y.; Yang, Y. Regulation of priming effect by soil organic matter stability over a broad geographic scale. Nat. Commun. 2019, 10, 1–10. [Google Scholar] [CrossRef] [Green Version]
  39. Weng, Z.H.; Lehmann, J.; Van Zwieten, L.; Joseph, S.; Archanjo, B.S.; Cowie, B.; Thomsen, L.; Tobin, M.J.; Vongsvivut, J.; Klein, A.; et al. Probing the nature of soil organic matter. Crit. Rev. Environ. Sci. Technol. 2021, 52, 4072–4093. [Google Scholar] [CrossRef]
  40. Sun, X.; Gao, L.; Ren, H.; Ye, Y.; Li, A.; Stafford-Smith, M.; Connor, J.D.; Wu, J.; Bryan, B.A. China’s progress towards sustainable land development and ecological civilization. Landsc. Ecol. 2018, 33, 1647–1653. [Google Scholar] [CrossRef]
  41. Zhang, Z.; Ding, J.; Zhu, C.; Wang, J.; Ma, G.; Ge, X.; Li, Z.; Han, L. Strategies for the efficient estimation of soil organic matter in salt-affected soils through Vis-NIR spectroscopy: Optimal band combination algorithm and spectral degradation. Geoderma 2020, 382, 114729. [Google Scholar] [CrossRef]
  42. Zhang, H.; Liu, W.; Zhang, Q.; Huang, X. Three-Dimensional Spatial Distribution and Influential Factors of Soil Total Nitrogen in a Coal Mining Subsidence Area. Sustainability 2022, 14, 7897. [Google Scholar] [CrossRef]
  43. Bouasria, A.; Namr, K.I.; Rahimi, A.; Ettachfini, E.M. Geospatial Assessment of Soil Organic Matter Variability at Sidi Bennour District in Doukkala Plain in Morocco. J. Ecol. Eng. 2021, 22, 120–130. [Google Scholar] [CrossRef]
  44. Bhunia, G.S.; Shit, P.K.; Maiti, R. Comparison of GIS-based interpolation methods for spatial distribution of soil organic carbon (SOC). J. Saudi Soc. Agric. Sci. 2018, 17, 114–126. [Google Scholar] [CrossRef] [Green Version]
  45. Usowicz, B.; Lipiec, J. Spatial variability of saturated hydraulic conductivity and its links with other soil properties at the regional scale. Sci. Rep. 2021, 11, 829. [Google Scholar] [CrossRef]
  46. Yang, M.; Gao, X.; Zhao, X.; Wu, P. Scale effect and spatially explicit drivers of interactions between ecosystem services—A case study from the Loess Plateau. Sci. Total. Environ. 2021, 785, 147389. [Google Scholar] [CrossRef]
  47. Yang, J.; Wang, J.; Xu, C.; Liao, X.; Tao, H. Modeling the spatial relationship between rice cadmium and soil properties at a regional scale considering confounding effects and spatial heterogeneity. Chemosphere 2021, 287, 132402. [Google Scholar] [CrossRef]
  48. Paterson, S.; Minasny, B.; McBratney, A. Spatial variability of Australian soil texture: A multiscale analysis. Geoderma 2018, 309, 60–74. [Google Scholar] [CrossRef]
  49. Jenerette, G.D.; Wu, J.; Grimm, N.B.; Hope, D. Points, patches, and regions: Scaling soil biogeochemical patterns in an urbanized arid ecosystem. Glob. Chang. Biol. 2006, 12, 1532–1544. [Google Scholar] [CrossRef]
  50. Suriyavirun, N.; Krichels, A.H.; Kent, A.D.; Yang, W.H. Microtopographic differences in soil properties and microbial community composition at the field scale. Soil Biol. Biochem. 2019, 131, 71–80. [Google Scholar] [CrossRef]
  51. Hu, K.; Wang, S.; Li, H.; Huang, F.; Li, B. Spatial scaling effects on variability of soil organic matter and total nitrogen in suburban Beijing. Geoderma 2014, 226–227, 54–63. [Google Scholar] [CrossRef]
  52. Aghasi, B.; Jalalian, A.; Khademi, H.; Toomanian, N. Sub-basinscale spatial variability of soil properties in Central Iran. Arab. J. Geosci. 2017, 10, 136. [Google Scholar] [CrossRef]
  53. Kraemer, F.B.; Sainz, D.; Morrás, H.; Carfagno, P.; Eiza, M.; Fernández, P.; Chagas, C. Soil structure and glyphosate fate under no-till management in the Pampa region. I. Soil structural anisotropy and hydro-physical behavior. Soil Tillage Res. 2022, 221, 105410. [Google Scholar] [CrossRef]
  54. Benavides-Bravo, F.G.; Soto-Villalobos, R.; Cantú-González, J.R.; Aguirre-López, M.A.; Benavides-Ríos, Á.G. A Quadratic–Exponential Model of Variogram Based on Knowing the Maximal Variability: Application to a Rainfall Time Series. Mathematics 2021, 9, 2466. [Google Scholar] [CrossRef]
  55. Panagea, I.S.; Berti, A.; Čermak, P.; Diels, J.; Else, A.; Kusá, H.; Piccoli, I.; Poesen, J.; Stoate, C.; Tits, M.; et al. Soil Water Retention as Affected by Management Induced Changes of Soil Organic Carbon: Analysis of Long-Term Experiments in Europe. Land 2021, 10, 1362. [Google Scholar] [CrossRef]
  56. Piccini, C.; Francaviglia, R.; Marchetti, A. Predicted Maps for Soil Organic Matter Evaluation: The Case of Abruzzo Region (Italy). Land 2020, 9, 349. [Google Scholar] [CrossRef]
  57. Du, Z.; Gao, B.; Ou, C.; Du, Z.; Yang, J.; Batsaikhan, B.; Dorjgotov, B.; Yun, W.; Zhu, D. A Quantitative Analysis of Factors Influencing Organic Matter Concentration in the Topsoil of Black Soil in Northeast China Based on Spatial Heterogeneous Patterns. ISPRS Int. J. Geo-Inf. 2021, 10, 348. [Google Scholar] [CrossRef]
  58. Shi, W.; Wang, J.; Li, X.; Xu, Q.; Jiang, X. Multi-fractal characteristics of reconstructed landform and its relationship with soil erosion at a large opencast coal-mine in the loess area of China. Geomorphology 2021, 390, 107859. [Google Scholar] [CrossRef]
  59. Qi, Q.; Zhang, D.; Zhang, M.; Tong, S.; Wang, W.; An, Y. Spatial distribution of soil organic carbon and total nitrogen in disturbed Carex tussock wetland. Ecol. Indic. 2020, 120, 106930. [Google Scholar] [CrossRef]
  60. Yang, Q.-Y.; Yang, J.-S.; Liu, G.-M. [Scale-dependency of spatial variability of soil available nutrients]. J. Appl. Ecol. 2011, 22, 431–436. [Google Scholar]
  61. Qin, J.; Liu, M.; Deng, Z.; Gu, S.; Gao, J. Spatial Variability of Soil Moisture at Different Scales in Sandy Loam in Northern Henan Province. J. Irrig. Drain. 2019, 38, 10–16. [Google Scholar]
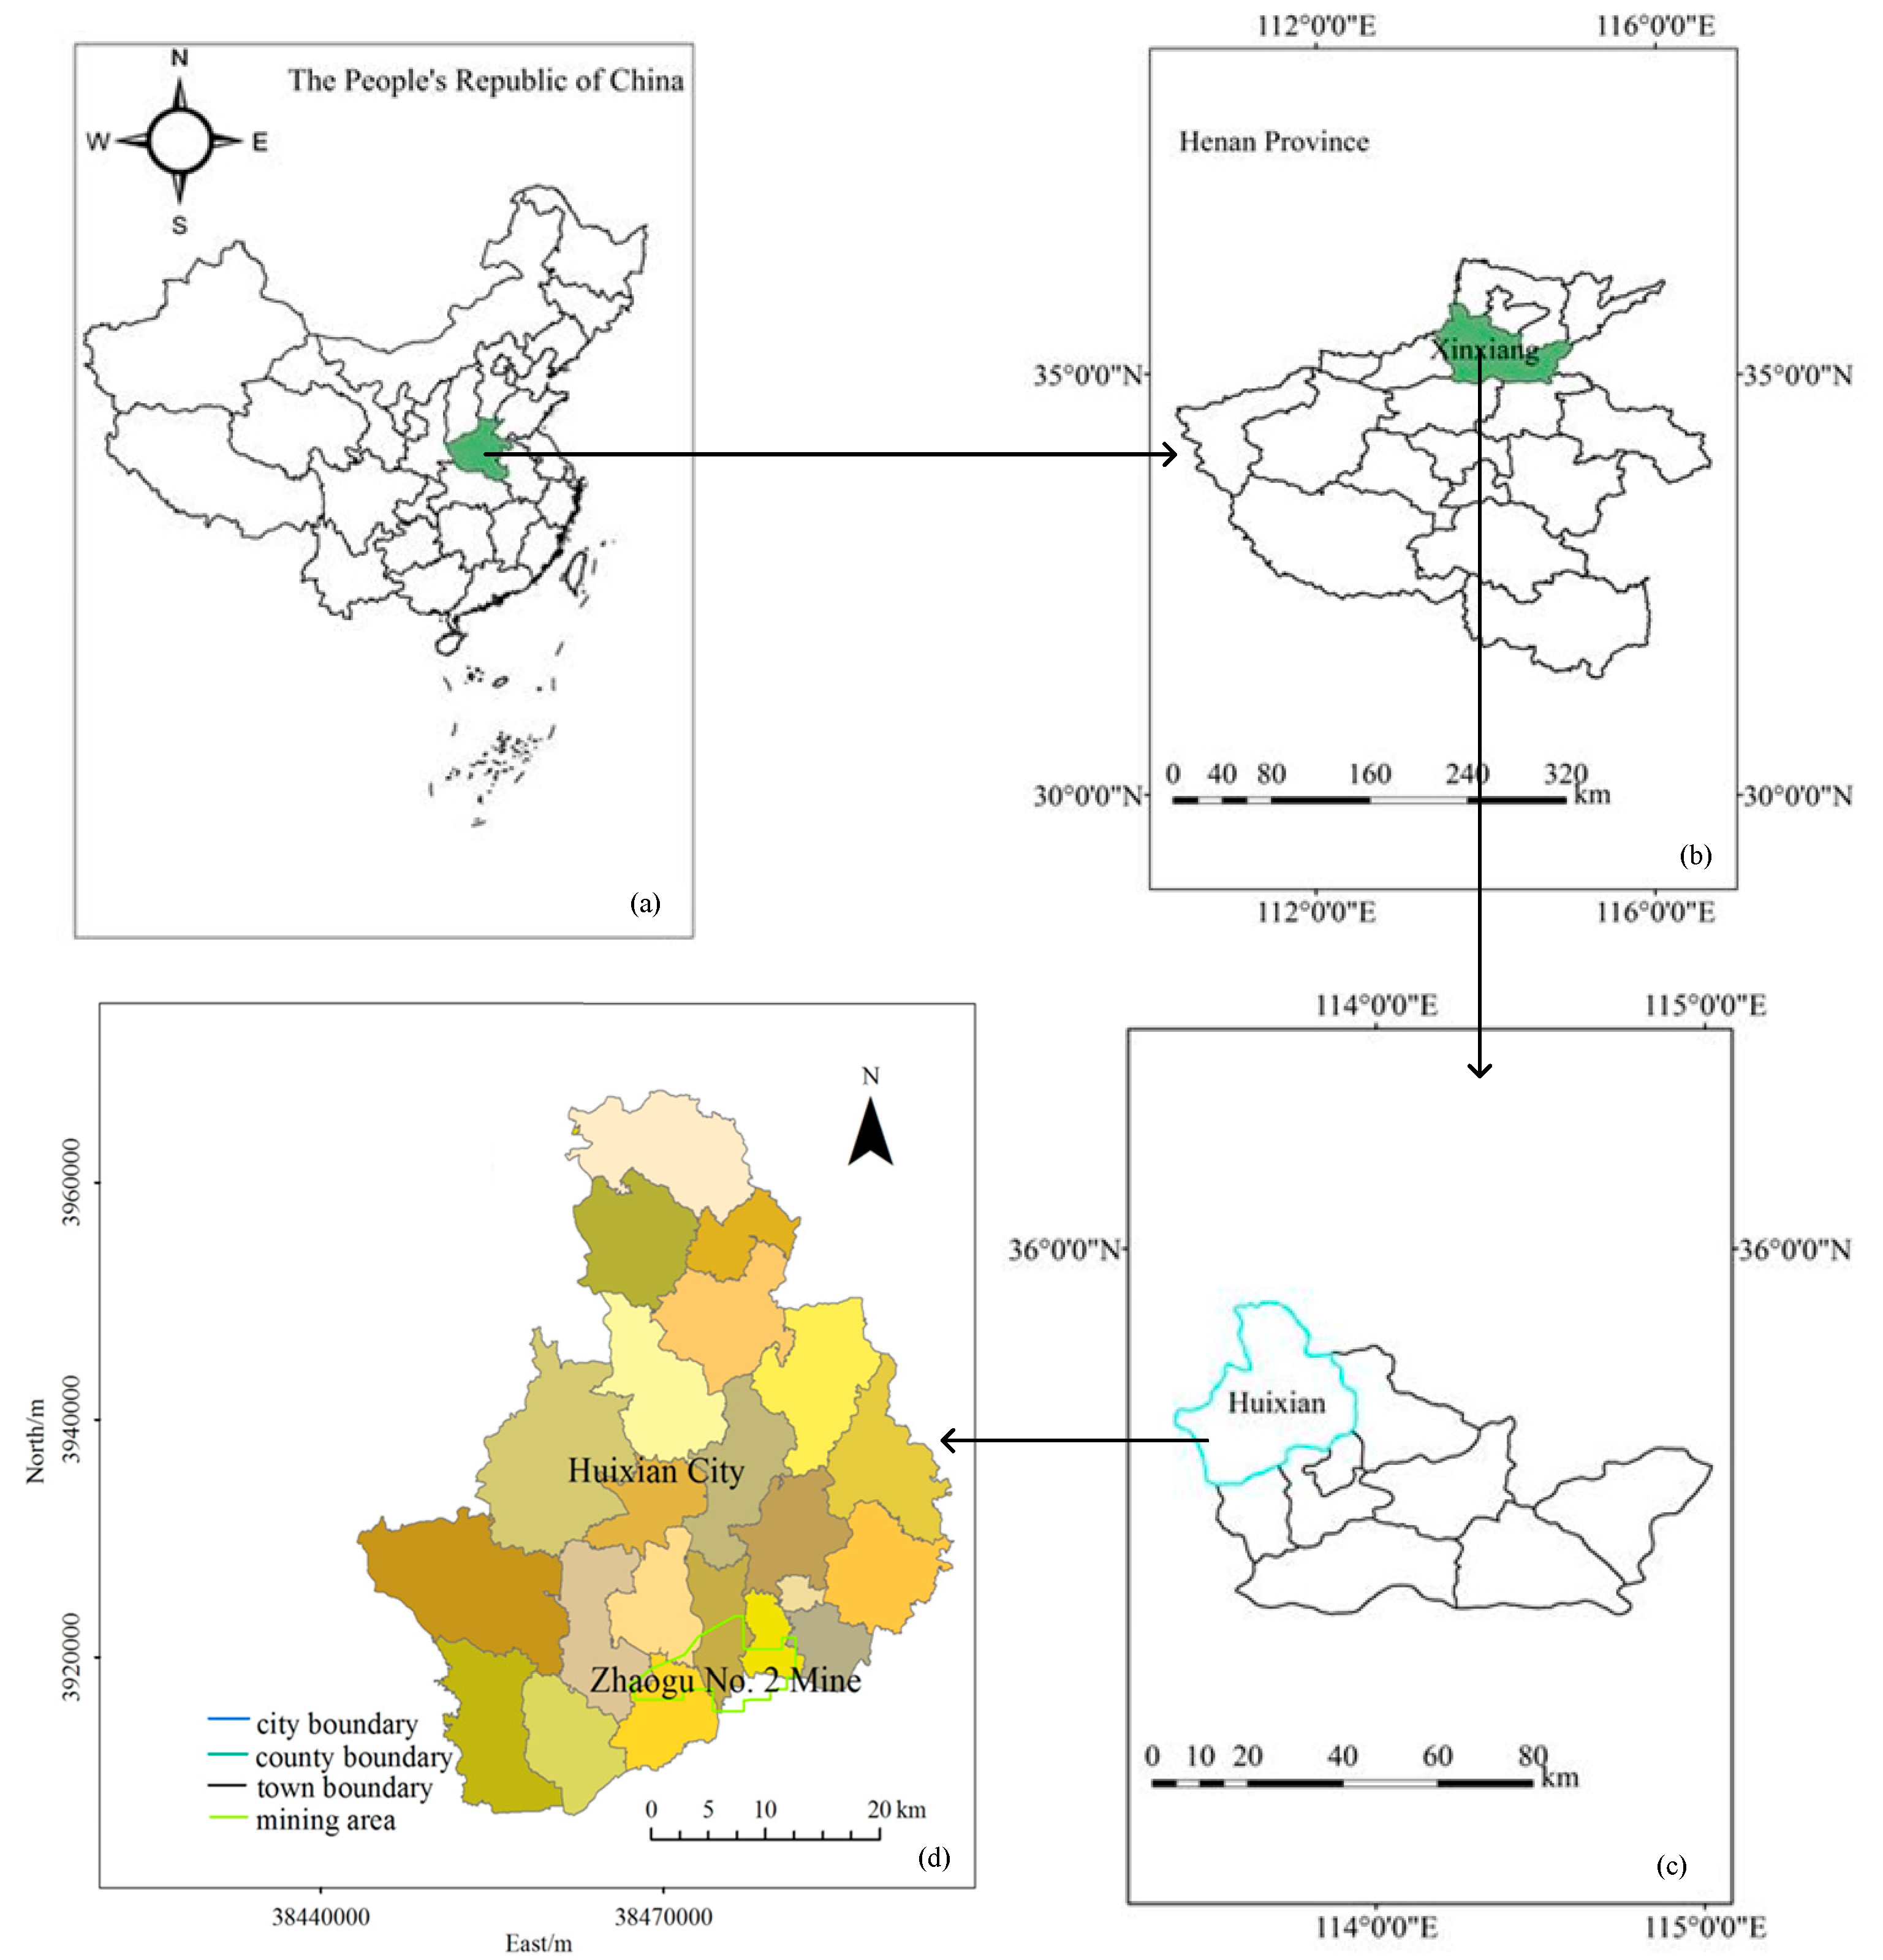
Figure 1. Study the location map. (a) Map of China; (b) Henan Province; (c) Xinxiang city; (d) Huixian city.
Sustainability 15 03780 g001
Figure 2. Current situation map of study area. (a) Remote sensing image of study area; (b) water accumulation in study area (c) crack in the settlement area; (d) abandoned farmland; and (e) land use map.
Sustainability 15 03780 g002
Figure 3. Field soil sampling. (a) Distribution of soil samples at different scales; (b) soil sample collection.
Sustainability 15 03780 g003
Figure 4. Spatial distribution of SOM at different scales. (a) The general kriging spatial interpolation diagram of the SOM at the L scale; (b) the spatial interpolation diagram of the nested model.
Sustainability 15 03780 g004
Figure 5. Standard error prediction chart of SOM by different methods. (a) The kriging standard error prediction of the SOM at the L-scale; (b) the kriging standard error prediction of the SOM using the nested model.
Sustainability 15 03780 g005
Figure 6. Relationship between the coefficient of variation of SOM.
Sustainability 15 03780 g006
Figure 7. Distribution probability of SOM content in different soil types.
Sustainability 15 03780 g007
Table 1. Statistical characteristics of soil organic matter.
ItemScales aSamplesMaxMinMeanSDMedianKurtosisSkewnessK-S (p)CV (%) b
SOM (g·kg−1)L7226.3510.2615.923.6615.610.3410.0430.86628.07
M7624.2610.9214.942.9314.320.613−0.2910.91614.93
S7923.6111.1313.622.0113.380.695−0.3060.96914.31
a. L, M, and S represent large, medium, and small scales, respectively. b. Coefficient of variation.
Table 2. Anisotropy ratio of SOM at different scales.
ScalesMain Variable Direction/°Main Range/mSecondary Range/mAnisotropy Ratio
L90246024601.000
135249624731.009
180246024601.000
225231424380.949
M44112611670.965
89125311971.047
134108311060.979
179132412891.027
S1426216211.000
1876566431.020
2326216211.000
2776616730.982
Table 3. Semivariance function models at different scales and with different fitting parameters.
ItemScalesModelDetermination CoefficientResidualRange (m)C0C0 + CC0/C0 + C%
SOMLExponential0.4310.16024600.2070.41350.12
MExponential0.4620.12611350.1060.35729.70
SSpherical0.3970.1826210.1320.40232.84
Table 4. Comparison of the accuracy of different interpolation methods for SOM.
ItemInterpolationI ValueP
SOMOrdinary Kriging2.3692.406
Fit Model0.5610.529
Table 5. Statistical analysis of the SOM interpolation results by different methods.
MethodsMaxMinMeanCV(%)
Measured value26.3510.2615.9228.07
Ordinary Kriging24.1912.3615.7624.03
Fit model26.9311.1315.9226.56
Table 6. Changes in SOM content in different soil types.
Type of SoilNumber (a)Mean (g/kg)Standard DeviationCV(%)
cinnamon soil7320.143.3215.61
moisture soil6810.162.9330.26
paddy soil5918.292.3511.44
Disclaimer/Publisher’s Note: The statements, opinions and data contained in all publications are solely those of the individual author(s) and contributor(s) and not of MDPI and/or the editor(s). MDPI and/or the editor(s) disclaim responsibility for any injury to people or property resulting from any ideas, methods, instructions or products referred to in the content.