
Evaluating the Renewal Degree for Expressway Regeneration Projects Based on a Model Integrating the Fuzzy Delphi Method, the Fuzzy AHP Method, and the TOPSIS Method


Abstract
1. Introduction
2. Literature Review
2.1. Evaluation Dimensions of Indicator Systems
2.2. Evaluation Objectives of Indicator Systems
2.3. Renewal Degree Evaluation Model
2.4. Evaluation Methods
3. Method for Urban Expressway Renewal Degree Evaluation
3.1. Framework
3.2. Categories and Sources of Primary Indicators
3.3. Selection of Performance Indicators Based on FDM
3.3.1. q-Rung Orthopair Fuzzy Sets
3.3.2. Fuzzy Delphi Method
3.3.3. Urban Expressway Renewal Degree Indicator System
3.4. Index Weighting Based on the FAHP Method
3.5. TOPSIS Method for the Order of Preference by Similarity to an Ideal Solution
4. Urban Expressway Renewal Degree Evaluation Application
4.1. Data Sources
4.2. Calculate the Expressway Renewal Degree Based on TOPSIS
5. Results and Discussion
5.1. Model Robustness Analysis
5.2. Suggestion for Decision-Making
6. Conclusions and Future Research
Author Contributions
Funding
Institutional Review Board Statement
Informed Consent Statement
Data Availability Statement
Conflicts of Interest
Appendix A

| Expressway | Ex1 | Ex2 | Ex3 | Ex4 | Ex5 | Ex6 | Ex7 | Ex8 |
|---|---|---|---|---|---|---|---|---|
| Area of affiliation | Hongkou District, Minhang District | Qingpu District, Minhang District | Yangpu District | Jiading District | Jiading District, Jinshan District | Pudong New District | Songjiang District, Jinshan District | Pudong New District |
| Status of facilities | -Built in 1997, opened to traffic in 2003, with eight lanes in both directions -From Tao Pu Road in Putuo District in the north to Xin Zhu Road in Minhang District in the south, eight lanes in both directions, for motor vehicles only, with a design speed of 80 km/h. The total length is approximately 18 km. | -Twenty years of service life, with no major repairs performed during the operational period -Four-lane roads in both directions (approximately 26.5 km), with a current one-way flow of 6000 pcu/h, causing heavy traffic congestion during peak periods -Pavement structural strength index (PSSI) “poor” rate of nearly 85%, making the road a class IV service level | -Opened in 1994, with a total length 47.7 km -High operating turnover, slow overall operating speed, and a full-day traffic turnover of 2.71 million pcu vehicles/km -Technical condition assessment category B -Noise-environmental problems, outdated landscaping, and broken crash walls, resulting in incongruity with the urban landscape | -Built in 2001, with a design speed of 100 km/h and six lanes in both directions -Maintenance work is on the rise -The structural deterioration of the bridge is accelerating -Traffic volume continues to grow -The road is at a class IV level of service | -North to the northern section of the Shanghai Bypass Expressway (G1503) and south to the Shenjiahu Expressway (S32), approximately 44 km long -One of the main north–south national highway routes | -Built in 1992, the road is 6.6 km long and has a planned red line width of 50 m -An important north–south corridor in Pudong New Area | -The total length of the road is approximately 22.3 km, starting from Jiamin Elevated Road in the north and ending at Shenjiahu Expressway (S32) in the south -The road grade is secondary road, with a calculated speed of 60 km/h -Traffic congestion, poor surrounding environment, and unreasonable industrial structure along the route | -Approximately 7.1 km from the approach bridge of the Lupu Bridge in the north to the Minhang District boundary in the south -Main north–south access road in the area |
| Renewal requirements | -Congestion needs to be eased on high traffic peak roads -The Hongqiao area and Minhang area are being upgraded to become the main city area with increasing traffic demand | -Poor state of service of facilities -Congested roads during peak periods -Improve the east–west trunk of the high-speed network to achieve rapid regional interchange -Industry transformation and upgrading along the route: Huawei Qingpu Base, City West Software Park, increasing demand for transportation functions -Low level of digitization | -Improve the safety of the facility itself -Improve the urban landscape and adapt to future urban development and build model roads for urban road renewal -The need for new infrastructure and intelligent development -Severe noise and environmental pollution and traffic congestion -Improve citizen satisfaction | -Congestion needs to be relieved and upgraded to level 3 service standards -Non-prestressed bridges need to be strengthened -Difficult to maintain on a daily basis and more safety issues at night -Need to connect with Jiangsu Province -Large residential communities are planned along the route in the northern part of Jiading Industrial Zone | -For accelerating the construction of Hongqiao International Open Hub and building a new urban area -Promote the reconstruction of the traffic bottleneck section | -Old road surface -Congestion needs to be eased on high traffic peak roads | -The only arterial transport link between the central city and the southwest of Shanghai -To connect Songjiang hub and Hongqiao hub -Need to divert traffic flow from G60 into the city | -Meeting the needs of regional population growth -Meeting the needs of rapid regional economic development |
Appendix B
| Indicators/Expresssway | ||||||||||||||||
|---|---|---|---|---|---|---|---|---|---|---|---|---|---|---|---|---|
| Ex1 | Ex2 | Ex3 | Ex4 | Ex5 | Ex6 | Ex7 | Ex8 | Ex1 | Ex2 | Ex3 | Ex4 | Ex5 | Ex6 | Ex7 | Ex8 | |
| Hardware facilities C1 | 0.005 | 0.005 | 0.005 | 0.000 | 0.001 | 0.005 | 0.005 | 0.008 | 0.003 | 0.003 | 0.003 | 0.008 | 0.007 | 0.003 | 0.002 | 0.000 |
| Facilities maintenance C2 | 0.004 | 0.001 | 0.006 | 0.005 | 0.004 | 0.000 | 0.000 | 0.006 | 0.002 | 0.005 | 0.000 | 0.001 | 0.002 | 0.006 | 0.006 | 0.000 |
| Driving safety C3 | 0.011 | 0.009 | 0.011 | 0.000 | 0.008 | 0.012 | 0.010 | 0.012 | 0.001 | 0.003 | 0.001 | 0.012 | 0.004 | 0.000 | 0.002 | 0.000 |
| Road saturation C4 | 0.003 | 0.001 | 0.003 | 0.005 | 0.000 | 0.006 | 0.003 | 0.004 | 0.003 | 0.005 | 0.002 | 0.000 | 0.006 | 0.000 | 0.003 | 0.002 |
| Traffic accessibility C5 | 0.001 | 0.000 | 0.000 | 0.001 | 0.003 | 0.001 | 0.000 | 0.003 | 0.002 | 0.003 | 0.003 | 0.003 | 0.000 | 0.002 | 0.003 | 0.000 |
| Level of intelligent control C6 | 0.004 | 0.002 | 0.005 | 0.002 | 0.002 | 0.003 | 0.000 | 0.005 | 0.001 | 0.003 | 0.000 | 0.003 | 0.002 | 0.002 | 0.005 | 0.000 |
| Public satisfaction C7 | 0.002 | 0.000 | 0.001 | 0.001 | 0.003 | 0.001 | 0.001 | 0.004 | 0.002 | 0.004 | 0.003 | 0.004 | 0.002 | 0.003 | 0.004 | 0.000 |
| Road Importance C8 | 0.001 | 0.001 | 0.002 | 0.004 | 0.000 | 0.005 | 0.003 | 0.005 | 0.004 | 0.004 | 0.003 | 0.002 | 0.005 | 0.000 | 0.002 | 0.000 |
| Storm resilience C9 | 0.004 | 0.003 | 0.003 | 0.001 | 0.003 | 0.000 | 0.001 | 0.004 | 0.000 | 0.000 | 0.001 | 0.003 | 0.001 | 0.004 | 0.002 | 0.000 |
| Earthquake resilience C10 | 0.000 | 0.002 | 0.000 | 0.002 | 0.000 | 0.002 | 0.002 | 0.002 | 0.002 | 0.000 | 0.002 | 0.000 | 0.002 | 0.000 | 0.000 | 0.000 |
| Landslide resilience C11 | 0.001 | 0.000 | 0.001 | 0.000 | 0.001 | 0.000 | 0.001 | 0.001 | 0.000 | 0.001 | 0.000 | 0.001 | 0.000 | 0.001 | 0.000 | 0.000 |
| Road surface ice resilience C12 | 0.001 | 0.002 | 0.001 | 0.002 | 0.001 | 0.002 | 0.000 | 0.001 | 0.001 | 0.000 | 0.001 | 0.000 | 0.001 | 0.000 | 0.002 | 0.001 |
| Fire resilience C13 | 0.003 | 0.003 | 0.003 | 0.000 | 0.003 | 0.000 | 0.002 | 0.003 | 0.000 | 0.000 | 0.000 | 0.003 | 0.000 | 0.003 | 0.002 | 0.000 |
| Efficiency of emergency response to major disasters C14 | 0.010 | 0.007 | 0.009 | 0.005 | 0.007 | 0.000 | 0.003 | 0.010 | 0.001 | 0.004 | 0.002 | 0.006 | 0.004 | 0.010 | 0.008 | 0.000 |
| Energy conservation management system C15 | 0.000 | 0.001 | 0.001 | 0.000 | 0.001 | 0.003 | 0.001 | 0.004 | 0.004 | 0.003 | 0.003 | 0.004 | 0.003 | 0.001 | 0.003 | 0.000 |
| Accessibility of information C16 | 0.005 | 0.000 | 0.009 | 0.009 | 0.005 | 0.005 | 0.005 | 0.009 | 0.005 | 0.009 | 0.000 | 0.000 | 0.005 | 0.005 | 0.005 | 0.000 |
| Policy direction C17 | 0.002 | 0.000 | 0.002 | 0.002 | 0.003 | 0.003 | 0.005 | 0.002 | 0.003 | 0.005 | 0.003 | 0.003 | 0.002 | 0.002 | 0.000 | 0.003 |
| Gross regional domestic product C18 | 0.003 | 0.003 | 0.004 | 0.003 | 0.003 | 0.000 | 0.001 | 0.003 | 0.001 | 0.002 | 0.000 | 0.001 | 0.001 | 0.004 | 0.003 | 0.001 |
| Regional infrastructure investment C19 | 0.005 | 0.005 | 0.000 | 0.005 | 0.005 | 0.002 | 0.001 | 0.002 | 0.001 | 0.000 | 0.005 | 0.000 | 0.000 | 0.004 | 0.005 | 0.004 |
| Cross-regional traffic flow C20 | 0.023 | 0.021 | 0.023 | 0.000 | 0.022 | 0.023 | 0.022 | 0.023 | 0.000 | 0.002 | 0.000 | 0.023 | 0.001 | 0.000 | 0.001 | 0.000 |
| Industrial layout requirements C21 | 0.000 | 0.000 | 0.013 | 0.000 | 0.013 | 0.013 | 0.013 | 0.013 | 0.013 | 0.013 | 0.000 | 0.013 | 0.000 | 0.000 | 0.000 | 0.000 |
| Characteristic development needs C22 | 0.000 | 0.000 | 0.000 | 0.010 | 0.010 | 0.010 | 0.000 | 0.010 | 0.010 | 0.010 | 0.010 | 0.000 | 0.000 | 0.000 | 0.010 | 0.000 |
| Population growth C23 | 0.007 | 0.004 | 0.010 | 0.000 | 0.002 | 0.004 | 0.003 | 0.004 | 0.003 | 0.006 | 0.000 | 0.010 | 0.008 | 0.006 | 0.007 | 0.006 |
| Demographic structure C24 | 0.000 | 0.000 | 0.001 | 0.000 | 0.000 | 0.000 | 0.000 | 0.000 | 0.000 | 0.001 | 0.000 | 0.001 | 0.000 | 0.000 | 0.000 | 0.000 |
| Employment position C25 | 0.007 | 0.007 | 0.007 | 0.006 | 0.007 | 0.000 | 0.007 | 0.000 | 0.000 | 0.000 | 0.000 | 0.000 | 0.000 | 0.007 | 0.000 | 0.007 |
| Environmental pollution assessment C26 | 0.000 | 0.000 | 0.000 | 0.000 | 0.000 | 0.000 | 0.000 | 0.000 | 0.000 | 0.000 | 0.000 | 0.000 | 0.000 | 0.000 | 0.000 | 0.000 |
| Carbon emission assessment C27 | 0.002 | 0.000 | 0.002 | 0.002 | 0.002 | 0.006 | 0.002 | 0.006 | 0.004 | 0.006 | 0.004 | 0.004 | 0.004 | 0.000 | 0.004 | 0.000 |
| Harmony with the urban environment C28 | 0.003 | 0.002 | 0.000 | 0.003 | 0.002 | 0.000 | 0.000 | 0.005 | 0.002 | 0.003 | 0.005 | 0.002 | 0.003 | 0.005 | 0.005 | 0.000 |
References
- Guang, Y.L.; Xiao, F.L.; Zhi, P.-C. Research on the Investment and Financing Mode of Urban Infrastructure Renewal Pro-jects. Constr. Econ. 2022, 57–62. [Google Scholar] [CrossRef]
- El-Kholy, A.M.; Akal, A.Y. Proposed Sustainability Composite Index of Highway Infrastructure Projects and Its Practical Implications. Arab J. Sci. Eng. 2020, 45, 3635–3655. [Google Scholar] [CrossRef]
- Hashemi, H.; Ghoddousi, P.; Nasirzadeh, F. Sustainability Indicator Selection by a Novel Triangular Intuitionistic Fuzzy Decision-Making Approach in Highway Construction Projects. Sustainability 2021, 13, 1477. [Google Scholar] [CrossRef]
- Shanghai Statistical Yearbook. 2021. Available online: https://tjj.sh.gov.cn/tjnj/nj21.htm?d1=2021tjnj/C1001.htm (accessed on 4 February 2023).
- Shanghai Municipal Road and Transport Administration. Available online: https://dlysj.sh.gov.cn/index.html (accessed on 4 February 2023).
- Hai, F.Z.; Sai, A.; Peng, F.W. On Problems of Urban Road Planning and Construction and Their Countermeasures Under background of Rapid Urban Development in China. J. Hebei Norm. Univ. Sci. Technol. 2017, 31, 69–74+58. [Google Scholar] [CrossRef]
- Clevenger, C.; Ozbek, M.; Simpson, S. Review of Sustainability Rating Systems Used for Infrastructure Projects. Proc. 49th ASC Annual Int. 2013, 4, 10–13. [Google Scholar]
- BREEAM Infrastructure | Achieving Sustainable Infrastructure—BRE Group. Available online: https://bregroup.com/products/ceequal/ (accessed on 13 November 2022).
- Use Envision—Institute for Sustainable Infrastructure. 2019. Available online: https://sustainableinfrastructure.org/envision/use-envision/ (accessed on 13 November 2022).
- Lee, J.C.; Edil, T.B.; Benson, C.H.; Tinjum, J.M. Evaluation of Variables Affecting Sustainable Highway Design with BE2ST-in-Highways System. Transp. Res. Rec. 2011, 2233, 178–186. [Google Scholar] [CrossRef]
- Muench, S.T.; Anderson, J.; Bevan, T. Greenroads: A Sustainability Rating System for Roadways. Int. J. Pavement Res. Technol. 2010, 3, 270–279. [Google Scholar] [CrossRef]
- Mattinzioli, T.; Sol-Sánchez, M.; Martínez, G.; Rubio-Gámez, M. A Critical Review of Roadway Sustainable Rating Systems. Sustain. Cities Soc. 2020, 63, 102447. [Google Scholar] [CrossRef]
- Yue, W.G.; Chun, F.S.; Chun, J.-D. Research on Sequencing Urban Roads Construction Based Improved TOPSIS. Road Traffic Saf. 2015, 15, 6–12. [Google Scholar] [CrossRef]
- Anderson, J.L.; Muench, S.T. Sustainability Trends Measured by the Greenroads Rating System. Transp. Res. Rec. 2013, 2357, 24–32. [Google Scholar] [CrossRef]
- Hoxha, E.; Vignisdottir, H.R.; Barbieri, D.M.; Wang, F.; Bohne, R.A.; Kristensen, T.; Passer, A. Life Cycle Assessment of Roads: Exploring Research Trends and Harmonization Challenges. Sci. Total Environ. 2021, 759, 143506. [Google Scholar] [CrossRef] [PubMed]
- Leuwayan, S.; Rukmana, D.; Jamil, M.H. The Planning of Median Road Park Arrangement to Support the City’s Green Space (RTHK) at Brawijaya Highway City of Merauke. IOP Conf. Ser. Earth Environ. Sci. 2020, 473, 012074. [Google Scholar] [CrossRef]
- Li, H.; Lin, Y.; Wang, Y.; Liu, J.; Liang, S.; Guo, S.; Qiang, T. Multi-Criteria Analysis of a People-Oriented Urban Pedestrian Road System Using an Integrated Fuzzy AHP and DEA Approach: A Case Study in Harbin, China. Symmetry 2021, 13, 2214. [Google Scholar] [CrossRef]
- Istrate, A.-L.; Chen, F. Liveable Streets in Shanghai: Definition, Characteristics and Design. Prog. Plan. 2021, 158, 100544. [Google Scholar] [CrossRef]
- Ibrahim, A.H.; Shaker, M.A. Sustainability Index for Highway Construction Projects. Alex. Eng. J. 2019, 58, 1399–1411. [Google Scholar] [CrossRef]
- Tran, N.H.; Yang, S.-H.; Huang, T. Comparative Analysis of Traffic-and-Transportation-Planning-Related Indicators in Sustainable Transportation Infrastructure Rating Systems. Int. J. Sustain. Transp. 2021, 15, 203–216. [Google Scholar] [CrossRef]
- Yan-gang, Y.; Jian-ping, X.; Ran, Z.; Chen, L. Research on Evaluation Index System of Green Highway in Reconstruction and Expansion Projects. E3S Web Conf. 2021, 233, 1136. [Google Scholar] [CrossRef]
- Chang, A.S.; Chang, H.J.; Tsai, C.Y.; Yang, S.H.; Muench, S.T. Strategy of Indicator Incorporation for Roadway Sustainability Certification. J. Clean. Prod. 2018, 203, 836–847. [Google Scholar] [CrossRef]
- Rostamnezhad, M.; Nasirzadeh, F.; Khanzadi, M.; Jarban, M.J.; Ghayoumian, M. Modeling Social Sustainability in Construction Projects by Integrating System Dynamics and Fuzzy-DEMATEL Method: A Case Study of Highway Project. Eng. Constr. Archit. Manag. 2020, 27, 1595–1618. [Google Scholar] [CrossRef]
- Zheng, H.W.; Shen, G.Q.; Song, Y.; Sun, B.; Hong, J. Neighborhood Sustainability in Urban Renewal: An Assessment Framework. Environ. Plan. B Urban Anal. City Sci. 2017, 44, 903–924. [Google Scholar] [CrossRef]
- Zhu, S.; Li, D.; Feng, H.; Gu, T.; Zhu, J. AHP-TOPSIS-Based Evaluation of the Relative Performance of Multiple Neighborhood Renewal Projects: A Case Study in Nanjing, China. Sustainability 2019, 11, 4545. [Google Scholar] [CrossRef]
- Riera Pérez, M.G.; Laprise, M.; Rey, E. Fostering Sustainable Urban Renewal at the Neighborhood Scale with a Spatial Decision Support System. Sustain. Cities Soc. 2018, 38, 440–451. [Google Scholar] [CrossRef]
- Zheng, W.; Shen, G.Q.; Wang, H.; Hong, J.; Li, Z. Decision Support for Sustainable Urban Renewal: A Multi-Scale Model. Land Use Policy 2017, 69, 361–371. [Google Scholar] [CrossRef]
- Nautiyal, A.; Sharma, S. Methods and Factors of Prioritizing Roads for Maintenance: A Review for Sustainable Flexible Pavement Maintenance Program. Innov. Infrastruct. Solut. 2022, 7, 190. [Google Scholar] [CrossRef]
- Azhar, N.A.; Radzi, N.A.M.; Wan Ahmad, W.S.H.M. Multi-Criteria Decision Making: A Systematic Review. EEENG 2021, 14, 779–801. [Google Scholar] [CrossRef]
- José, F.; Salvatore, G. Multiple Criteria Decision Analysis: State of the Art Surveys; Springer Science + Business Media, Inc.: Berlin, Germany, 2005; pp. 133–153. [Google Scholar]
- Wang, X.; Zhang, H.; Wang, J.; Li, J.; Li, L. Extended TODIM-PROMETHEE II Method with Hesitant Probabilistic Information for Solving Potential Risk Evaluation Problems of Water Resource Carrying Capacity. Expert Syst. 2021, 38, e12681. [Google Scholar] [CrossRef]
- Zadeh, L.A. Fuzzy Sets. Inf. Control. 1965, 8, 338–353. [Google Scholar] [CrossRef]
- Ishikawa, A.; Amagasa, M.; Shiga, T.; Tomizawa, G.; Tatsuta, R.; Mieno, H. The Max-Min Delphi Method and Fuzzy Delphi Method via Fuzzy Integration. Fuzzy Sets Syst. 1993, 55, 241–253. [Google Scholar] [CrossRef]
- Hsu, Y.-L.; Lee, C.-H.; Kreng, V.B. The Application of Fuzzy Delphi Method and Fuzzy AHP in Lubricant Regenerative Technology Selection. Expert Syst. Appl. 2010, 37, 419–425. [Google Scholar] [CrossRef]
- Saffie, N.A.M.; Shukor, N.M.; Rasmani, K.A. Fuzzy Delphi Method: Issues and Challenges. In Proceedings of the 2016 International Conference on Logistics, Informatics and Service Sciences (LISS), Sydney, Australia, 24–27 July 2016; IEEE: Sydney, Australia; pp. 1–7. [Google Scholar]
- Huang, J.; Koopialipoor, M.; Armaghani, D.J. A Combination of Fuzzy Delphi Method and Hybrid ANN-Based Systems to Forecast Ground Vibration Resulting from Blasting. Sci. Rep. 2020, 10, 19397. [Google Scholar] [CrossRef]
- Sumrit, D. A Hybrid Multi-Criteria Decision Making Model for Technological Innovation Capabilities Measurement in Automotive Parts Industry. IJMDM 2020, 19, 1. [Google Scholar] [CrossRef]
- Chan, S.-L.; Wey, W.-M.; Chang, P.-H. Establishing Disaster Resilience Indicators for Tan-Sui River Basin in Taiwan. Soc. Indic. Res. 2014, 115, 387–418. [Google Scholar] [CrossRef]
- Wang, X.; Wang, S.; Zhang, H.; Wang, J.; Li, L. The Recommendation Method for Hotel Selection Under Traveller Preference Characteristics: A Cloud-Based Multi-Criteria Group Decision Support Model. Group Decis. Negot. 2021, 30, 1433–1469. [Google Scholar] [CrossRef]
- Kutlu, A.C.; Ekmekçioğlu, M. Fuzzy Failure Modes and Effects Analysis by Using Fuzzy TOPSIS-Based Fuzzy AHP. Expert Syst. Appl. 2012, 39, 61–67. [Google Scholar] [CrossRef]
- Yager, R.R. Generalized Orthopair Fuzzy Sets. IEEE Trans. Fuzzy Syst. 2017, 25, 1222–1230. [Google Scholar] [CrossRef]
- Liu, P.; Wang, P. Some Q-Rung Orthopair Fuzzy Aggregation Operators and Their Applications to Multiple-Attribute Decision Making. Int. J. Intell. Syst. 2018, 33, 259–280. [Google Scholar] [CrossRef]
- Liu, P.; Liu, P.; Wang, P.; Zhu, B. An Extended Multiple Attribute Group Decision Making Method Based on Q-Rung Orthopair Fuzzy Numbers. IEEE Access 2019, 7, 162050–162061. [Google Scholar] [CrossRef]
- Gong, J.W.; Li, Q.; Yin, L.; Liu, H.-C. Undergraduate Teaching Audit and Evaluation Using an Extended MABAC Method under Q-Rung Orthopair Fuzzy Environment. Int. J. Intell. Syst. 2020, 35, 1912–1933. [Google Scholar] [CrossRef]
- Ruiz, A.; Guevara, J. Sustainable Decision-Making in Road Development: Analysis of Road Preservation Policies. Sustainability 2020, 12, 872. [Google Scholar] [CrossRef]
- Lin, S.H.; Huang, X.; Fu, G.; Chen, J.-T.; Zhao, X.; Li, J.-H.; Tzeng, G.-H. Evaluating the Sustainability of Urban Renewal Projects Based on a Model of Hybrid Multiple-Attribute Decision-Making. Land Use Policy 2021, 108, 105570. [Google Scholar] [CrossRef]
- Ostadtaghizadeh, A.; Ardalan, A.; Paton, D.; Jabbari, H.; Khankeh, H.R. Community Disaster Resilience: A Systematic Review on Assessment Models and Tools. PLoS Curr. 2015, 4, 116. [Google Scholar] [CrossRef]
- Hai, Y.-B.; Guang, Q.-P.; Wan, E.-L. Discussion on the Construction of regional smart expressway. Traffic Eng. 2018, 8, 179–181. [Google Scholar] [CrossRef]
- Shi, G.; Shan, J.; Ding, L.; Ye, P.; Li, Y.; Jiang, N. Urban Road Network Expansion and Its Driving Variables: A Case Study of Nanjing City. Int. J. Environ. Res. Public Health 2019, 16, 2318. [Google Scholar] [CrossRef] [PubMed]
- Ali, R.; Waqar, Z.; Ahmad, M.; Sharif, M. Assessing Urban Renewal Sites in Lahore. J. World Sci. 2022, 1, 1038–1047. [Google Scholar] [CrossRef]
- Ušpalytė-Vitkūnienė, R.; Šarkienė, E.; Žilionienė, D. Multi-Criteria Analysis of Indicators of the Public Transport Infrastructure. Promet TrafficTransportation 2020, 32, 119–126. [Google Scholar] [CrossRef]
- Li, D.; Wang, Y.; Liu, Y.; Sun, S.; Gao, Y. Estimating Life-Cycle CO2 Emissions of Urban Road Corridor Construction: A Case Study in Xi’an, China. J. Clean. Prod. 2020, 255, 120033. [Google Scholar] [CrossRef]
- Gupta, R.; Rathore, B.; Srivastava, A.; Biswas, B. Decision-Making Framework for Identifying Regions Vulnerable to Transmission of COVID-19 Pandemic. Comput. Ind. Eng. 2022, 169, 108207. [Google Scholar] [CrossRef]
- Hwang, C.-L.; Yoon, K. Multiple Attribute Decision Making. In Lecture Notes in Economics and Mathematical Systems; Springer: Berlin, Heidelberg, 1981; Volume 186, pp. 59–60. [Google Scholar]
- Lai, Y.-J.; Liu, T.-Y.; Hwang, C.-L. Topsis for modm. Eur. J. Oper. Res. 1994, 76, 486–500. [Google Scholar] [CrossRef]
- Zavadskas, E.; Turskis, Z.; Volvaciovas, R.; Kildiene, S. Multi-Criteria Assessment Model of Technologies. Stud. Inform. Control. 2013, 22, 249–258. [Google Scholar] [CrossRef]
- Sánchez-Garrido, A.J.; Navarro, I.J.; Yepes, V. Multi-Criteria Decision-Making Applied to the Sustainability of Building Structures Based on Modern Methods of Construction. J. Clean. Prod. 2022, 330, 129724. [Google Scholar] [CrossRef]
- Wang, Z.; Huang, J.; Wang, H.; Kang, J.; Cao, W. Analysis of Flood Evacuation Process in Vulnerable Community with Mutual Aid Mechanism: An Agent-Based Simulation Framework. Int. J. Environ Res. Public Health 2020, 17, 560. [Google Scholar] [CrossRef] [PubMed]
- Alkan, N.; Kahraman, C. Evaluation of Government Strategies against COVID-19 Pandemic Using q-Rung Orthopair Fuzzy TOPSIS Method. Appl. Soft Comput. 2021, 110, 107653. [Google Scholar] [CrossRef] [PubMed]
- Mousseau, V.; Figueira, J.; Naux, J.-P. Using Assignment Examples to Infer Weights for ELECTRE TRI Method: Some Experimental Results. Eur. J. Oper. Res. 2001, 130, 263–275. [Google Scholar] [CrossRef]


| Criteria | Indicators | References |
|---|---|---|
| 1. Facility | Hardware facilities | [28,45] |
| Facility maintenance | ||
| Driving safety | ||
| Classification of roads | ||
| Length of road | ||
| 2. Service functionality | Road saturation | [17,18,21,46] |
| Traffic accessibility | ||
| Level of intelligent control | ||
| Public satisfaction | ||
| Road importance | ||
| 3. Physical resilience | Flooding resilience | [47] |
| Fog resilience | ||
| Storm resilience | ||
| Earthquake resilience | ||
| Landslide resilience | ||
| Road surface icing resilience | ||
| Fire resilience | ||
| 4. Institutional resilience | Emergency response to major disasters | [45,48] |
| Energy conservation management system | ||
| Accessibility of information | ||
| 5. Economic demand | Policy direction | [12,49,50] |
| Gross domestic product | ||
| Regional infrastructure investment | ||
| 6. Transportation demand | Cross-regional traffic flow | [20,51] |
| Industrial layout requirements | ||
| Characteristic development needs | ||
| 7. Social demand | Population growth | [12] |
| Demographic structure | ||
| Employment position | ||
| 8. Environmental demand | Environmental pollution assessment | [15,20,21,52] |
| Carbon emission assessment | ||
| Harmony with the urban environment |
| Linguistic Terms | |
|---|---|
| Weakly Important (WI) | (0.30, 0.85) |
| Equally Important (EI) | (0.50, 0.50) |
| Moderately Important (MI) | (0.75, 0.40) |
| Important (I) | (0.80, 0.25) |
| Very Important (VI) | (0.95, 0.10) |
| Clusters | Indicators | Fuzzy Weights | Decision | |
|---|---|---|---|---|
| Facility renewal requirements (H1) | Hardware facilities (C1) | (0.825, 0.000) | 0.561 | Accepted |
| Facilities maintenance (C2) | (0.825, 0.000) | 0.561 | Accepted | |
| Driving safety (C3) | (0.789, 0.000) | 0.490 | Accepted | |
| Classification of roads | (0.077, 0.000) | 0.000 | Rejected | |
| Length of road | (0.075, 0.000) | 0.000 | Rejected | |
| Service functionality renewal requirements (H2) | Road saturation (C4) | (0.789, 0.000) | 0.490 | Accepted |
| Traffic accessibility (C5) | (0.819, 0.000) | 0.549 | Accepted | |
| Level of intelligent control (C6) | (0.819, 0.000) | 0.550 | Accepted | |
| Public satisfaction (C7) | (0.630, 0.000) | 0.251 | Accepted | |
| Road importance (C8) | (0.649, 0.000) | 0.273 | Accepted | |
| Physical resilience (H3) | Flooding resilience | (0.075, 0.000) | 0.000 | Rejected |
| Fog resilience | (0.182, 0.000) | 0.006 | Rejected | |
| Storm resilience (C9) | (0.649, 0.000) | 0.273 | Accepted | |
| Earthquake resilience (C10) | (0.817, 0.000) | 0.546 | Accepted | |
| Landslide resilience (C11) | (0.825, 0.000) | 0.561 | Accepted | |
| Road surface icing resilience (C12) | (0.825, 0.000) | 0.561 | Accepted | |
| Fire resilience (C13) | (0.825, 0.000) | 0.561 | Accepted | |
| Institutional resilience (H4) | Efficiency of emergency response to major disasters (C14) | (0.776, 0.000) | 0.467 | Accepted |
| Energy conservation management system (C15) | (0.803, 0.000) | 0.518 | Accepted | |
| Accessibility of information (C16) | (0.803, 0.000) | 0.518 | Accepted | |
| Economic development needs (H5) | Policy orientation (C17) | (0.814, 0.000) | 0.540 | Accepted |
| Gross domestic product(C18) | (0.803, 0.000) | 0.518 | Accepted | |
| Regional infrastructure investment (C19) | (0.813, 0.000) | 0.538 | Accepted | |
| Demand for transportation development (H6) | Cross-regional traffic flow (C20) | (0.825, 0.000) | 0.561 | Accepted |
| Industrial layout requirements (C21) | (0.721, 0.000) | 0.375 | Accepted | |
| Characteristic development needs (C22) | (0.825, 0.000) | 0.561 | Accepted | |
| Social development needs (H7) | Population growth (C23) | (0.825, 0.000) | 0.561 | Accepted |
| Demographic structure (C24) | (0.751, 0.000) | 0.424 | Accepted | |
| Employment position (C25) | (0.825, 0.000) | 0.561 | Accepted | |
| Environmental development needs (H8) | Environmental pollution assessment (C26) | (0.814, 0.000) | 0.540 | Accepted |
| Carbon emission assessment (C27) | (0.819, 0.000) | 0.549 | Accepted | |
| Harmony with the urban environment (C28) | (0.353, 0.000) | 0.044 | Accepted |
| Field | Criteria | Indicators | Description/Measurement Method | Quantitative Method |
|---|---|---|---|---|
| Facility renewal requirements | Expressway condition renewal requirements (H1) | Hardware facilities (C1) | Status of road engineering | Morphological quality index and quality index of the road |
| Facilities maintenance (C2) | Completion of the annual maintenance plan for roads, carried out by the operations department | Conservation performance evaluation report score | ||
| Driving safety (C3) | Number of traffic accidents per kilometer on the road (years) | Number of accidents (number/km-yr) | ||
| Service level (H2) | Road saturation (C4) | Ratio of actual road traffic to design traffic during peak hours | V/C = Actual traffic volume/design traffic volume | |
| Traffic accessibility (C5) | Road traffic index | Peak congestion hours/smooth passage times | ||
| Level of intelligent control (C6) | Refers to the information collection, processing and dissemination efficiency, emergency dispatching capability, and linked disposal capability of traffic accidents | Number of video surveillance cameras and sensors per kilometer (units/km) | ||
| Public satisfaction (C7) | Passing vehicle satisfaction and public hotline disposal | Questionnaire score | ||
| Road importance (C8) | Reflected by the importance of the area in which it is located, the traffic zoning in which it is located, and the functional zoning | Weighted calculation of the importance of nodes at both ends of the road |
| Field | Criteria | Indicators | Description/Measurement Method | Quantitative Method |
|---|---|---|---|---|
| Demand for resilience enhancement | Natural resilience (H3) | Storm resilience (C9) | Number of times and the extent to which traffic is affected by extreme weather or sudden natural disasters (e.g., heavy rainfall, earthquakes, rainy season landslides, and icy roads) on road sections (main lines and gateways) (per year) | Shutdown time per km per year (h/km) |
| Earthquake resilience (C10) | ||||
| Landslide resilience (C11) | ||||
| Road surface icing resilience (C12) | ||||
| Fire resilience (C13) | Refers to the extent of damage to expressways and ancillary facilities resulting from a fire | Fire-induced shutdown time (h/year) | ||
| Institutional resilience (H4) | Efficiency of emergency response to major disasters (C14) | The efficiency of emergency response and incident management after an incident has occurred | Average processing time for major incidents (h/year) | |
| Energy conservation management system (C15) | -Whether an organizational structure and related systems are set up for energy conservation and emission reduction -Whether a statistical monitoring system is in place -Whether an assessment system is in place -Whether public awareness and training campaigns are conducted | Grade rating (1–5) | ||
| Accessibility of information (C16) | Refers to timely feedback and disposition of public suggestions | Completion rate of comment and suggestion disposal (%) |
| Field | Criteria | Indicators | Transfer Function/Questionnaire | Quantitative Method |
|---|---|---|---|---|
| Adapting to future development needs | Economic development needs (H5) | Policy direction (C17) | Government documents and planning documents that are conducive to the development of the district | Number of relevant government public documents (pcs) |
| Gross domestic product (C18) | Gross regional product growth rate | Average regional GDP growth rate over the last 3 years (%) | ||
| Regional infrastructure investment (C19) | Area investment per square kilometer | Investment/square kilometer (million yuan/square kilometer) | ||
| Transport development needs (H6) | Cross-regional traffic flow (C20) | Transit traffic flows, that is, the proportion of traffic flows passing through a region that do not have an origin or destination in that region | Transit traffic/total traffic (%) | |
| Industrial layout requirements (C21) | The availability of industrial restructuring | Grade rating (0,1) | ||
| Characteristic development needs (C22) | The presence or absence of significant development blocks along the route or in the region -Newly assigned district functions -Characteristic development plans | Grading scale (1–5) | ||
| Social development needs (H7) | Population growth (C23) | Population growth in the last 3 years in the region | Three-year growth rate of regional population (%) | |
| Demographic structure (C24) | Percentage of population aged 15–59 years | Percentage of population aged 15–59 years (%) | ||
| Employment position (C25) | Employment growth rate in the last 3 years in your region | Three-year average growth rate of jobs (%) | ||
| Environmental development needs (H8) | Environmental pollution assessment (C26) | Air noise and water pollution | Environmental assessment score | |
| Carbon emission assessment (C27) | ETC coverage Energy-efficient lighting and other green, low-carbon technologies Non-stop overload pre-screening system Intelligent control of tunnel lighting and ventilation -Renewable energy utilization Energy consumption monitoring and management platform construction | Grade rating (1–5) | ||
| Harmony with the urban environment (C28) | Uniformity of appearance with the city’s historical and cultural landscape Uniformity of appearance with the modern development of the city | Grade rating (1–5) |
| Linguistic Terms | |
|---|---|
| Very Low (VL) | (0.15, 0.90) |
| Low (L) | (0.30, 0.85) |
| Medium Low (ML) | (0.45, 0.65) |
| Medium (M) | (0.50, 0.50) |
| Medium High (MH) | (0.75, 0.40) |
| High (H) | (0.80, 0.25) |
| Very High (VH) | (0.95, 0.10) |
| Criteria | Weights | Rank | Indicators | Weights | Rank | Aggregate Weights | Final Rank |
|---|---|---|---|---|---|---|---|
| H1 | 0.120 | 4 | C1 | 0.329 | 10 | 0.039 | 11 |
| C2 | 0.256 | 16 | 0.031 | 18 | |||
| C3 | 0.415 | 3 | 0.050 | 5 | |||
| H2 | 0.148 | 2 | C4 | 0.211 | 20 | 0.031 | 16 |
| C5 | 0.210 | 21 | 0.031 | 17 | |||
| C6 | 0.160 | 28 | 0.024 | 22 | |||
| C7 | 0.196 | 25 | 0.030 | 20 | |||
| C8 | 0.222 | 17 | 0.033 | 14 | |||
| H3 | 0.099 | 8 | C9 | 0.189 | 26 | 0.019 | 27 |
| C10 | 0.214 | 19 | 0.021 | 24 | |||
| C11 | 0.177 | 27 | 0.018 | 28 | |||
| C12 | 0.210 | 22 | 0.021 | 25 | |||
| C13 | 0.210 | 23 | 0.021 | 26 | |||
| H4 | 0.126 | 3 | C14 | 0.469 | 1 | 0.059 | 2 |
| C15 | 0.198 | 24 | 0.025 | 21 | |||
| C16 | 0.333 | 9 | 0.042 | 9 | |||
| H5 | 0.114 | 5 | C17 | 0.349 | 7 | 0.040 | 10 |
| C18 | 0.391 | 5 | 0.045 | 7 | |||
| C19 | 0.260 | 15 | 0.030 | 19 | |||
| H6 | 0.180 | 1 | C20 | 0.382 | 6 | 0.069 | 1 |
| C21 | 0.314 | 11 | 0.057 | 3 | |||
| C22 | 0.304 | 13 | 0.055 | 4 | |||
| H7 | 0.106 | 7 | C23 | 0.446 | 2 | 0.047 | 6 |
| C24 | 0.220 | 18 | 0.023 | 23 | |||
| C25 | 0.334 | 8 | 0.035 | 12 | |||
| H8 | 0.108 | 6 | C26 | 0.392 | 4 | 0.042 | 8 |
| C27 | 0.314 | 12 | 0.034 | 13 | |||
| C28 | 0.295 | 14 | 0.032 | 15 |
| Indicators | Original Data | Source Channels |
|---|---|---|
| C1, C2, C7 | Expressway operations and maintenance evaluation reports | Expressway-owned O&M company |
| C3, C4, C5, C9, C10, C11, C12, C13, C14, C20 | Traffic network monitoring data | Shanghai Tunnel Co. |
| C6 | Traffic network control center data | Shanghai Tunnel Co. |
| C8, C18, C19, C21, C22, C23, C24, C25 | Government planning reports, statistical yearbook data, and map data | Shanghai Municipal Government Development Planning Report, Shanghai Municipal Bureau of Statistics Yearbook, and Google Maps |
| C15, C26, C27 | Sectoral data | Shanghai Ecological Environment Bureau |
| C16 | Traffic hotline data | Shanghai Traffic Management Department |
| C17 | Government sector data | Official government website |
| C28 | Questionnaire statistics | Questionnaires |
| Expressway | Rank | |||
|---|---|---|---|---|
| Ex4 | 0.020 | 0.034 | 0.628 | 1 |
| Ex2 | 0.027 | 0.025 | 0.480 | 2 |
| Ex7 | 0.030 | 0.021 | 0.413 | 3 |
| Ex1 | 0.031 | 0.020 | 0.388 | 4 |
| Ex6 | 0.033 | 0.019 | 0.364 | 5 |
| Ex5 | 0.033 | 0.017 | 0.341 | 6 |
| Ex3 | 0.036 | 0.015 | 0.300 | 7 |
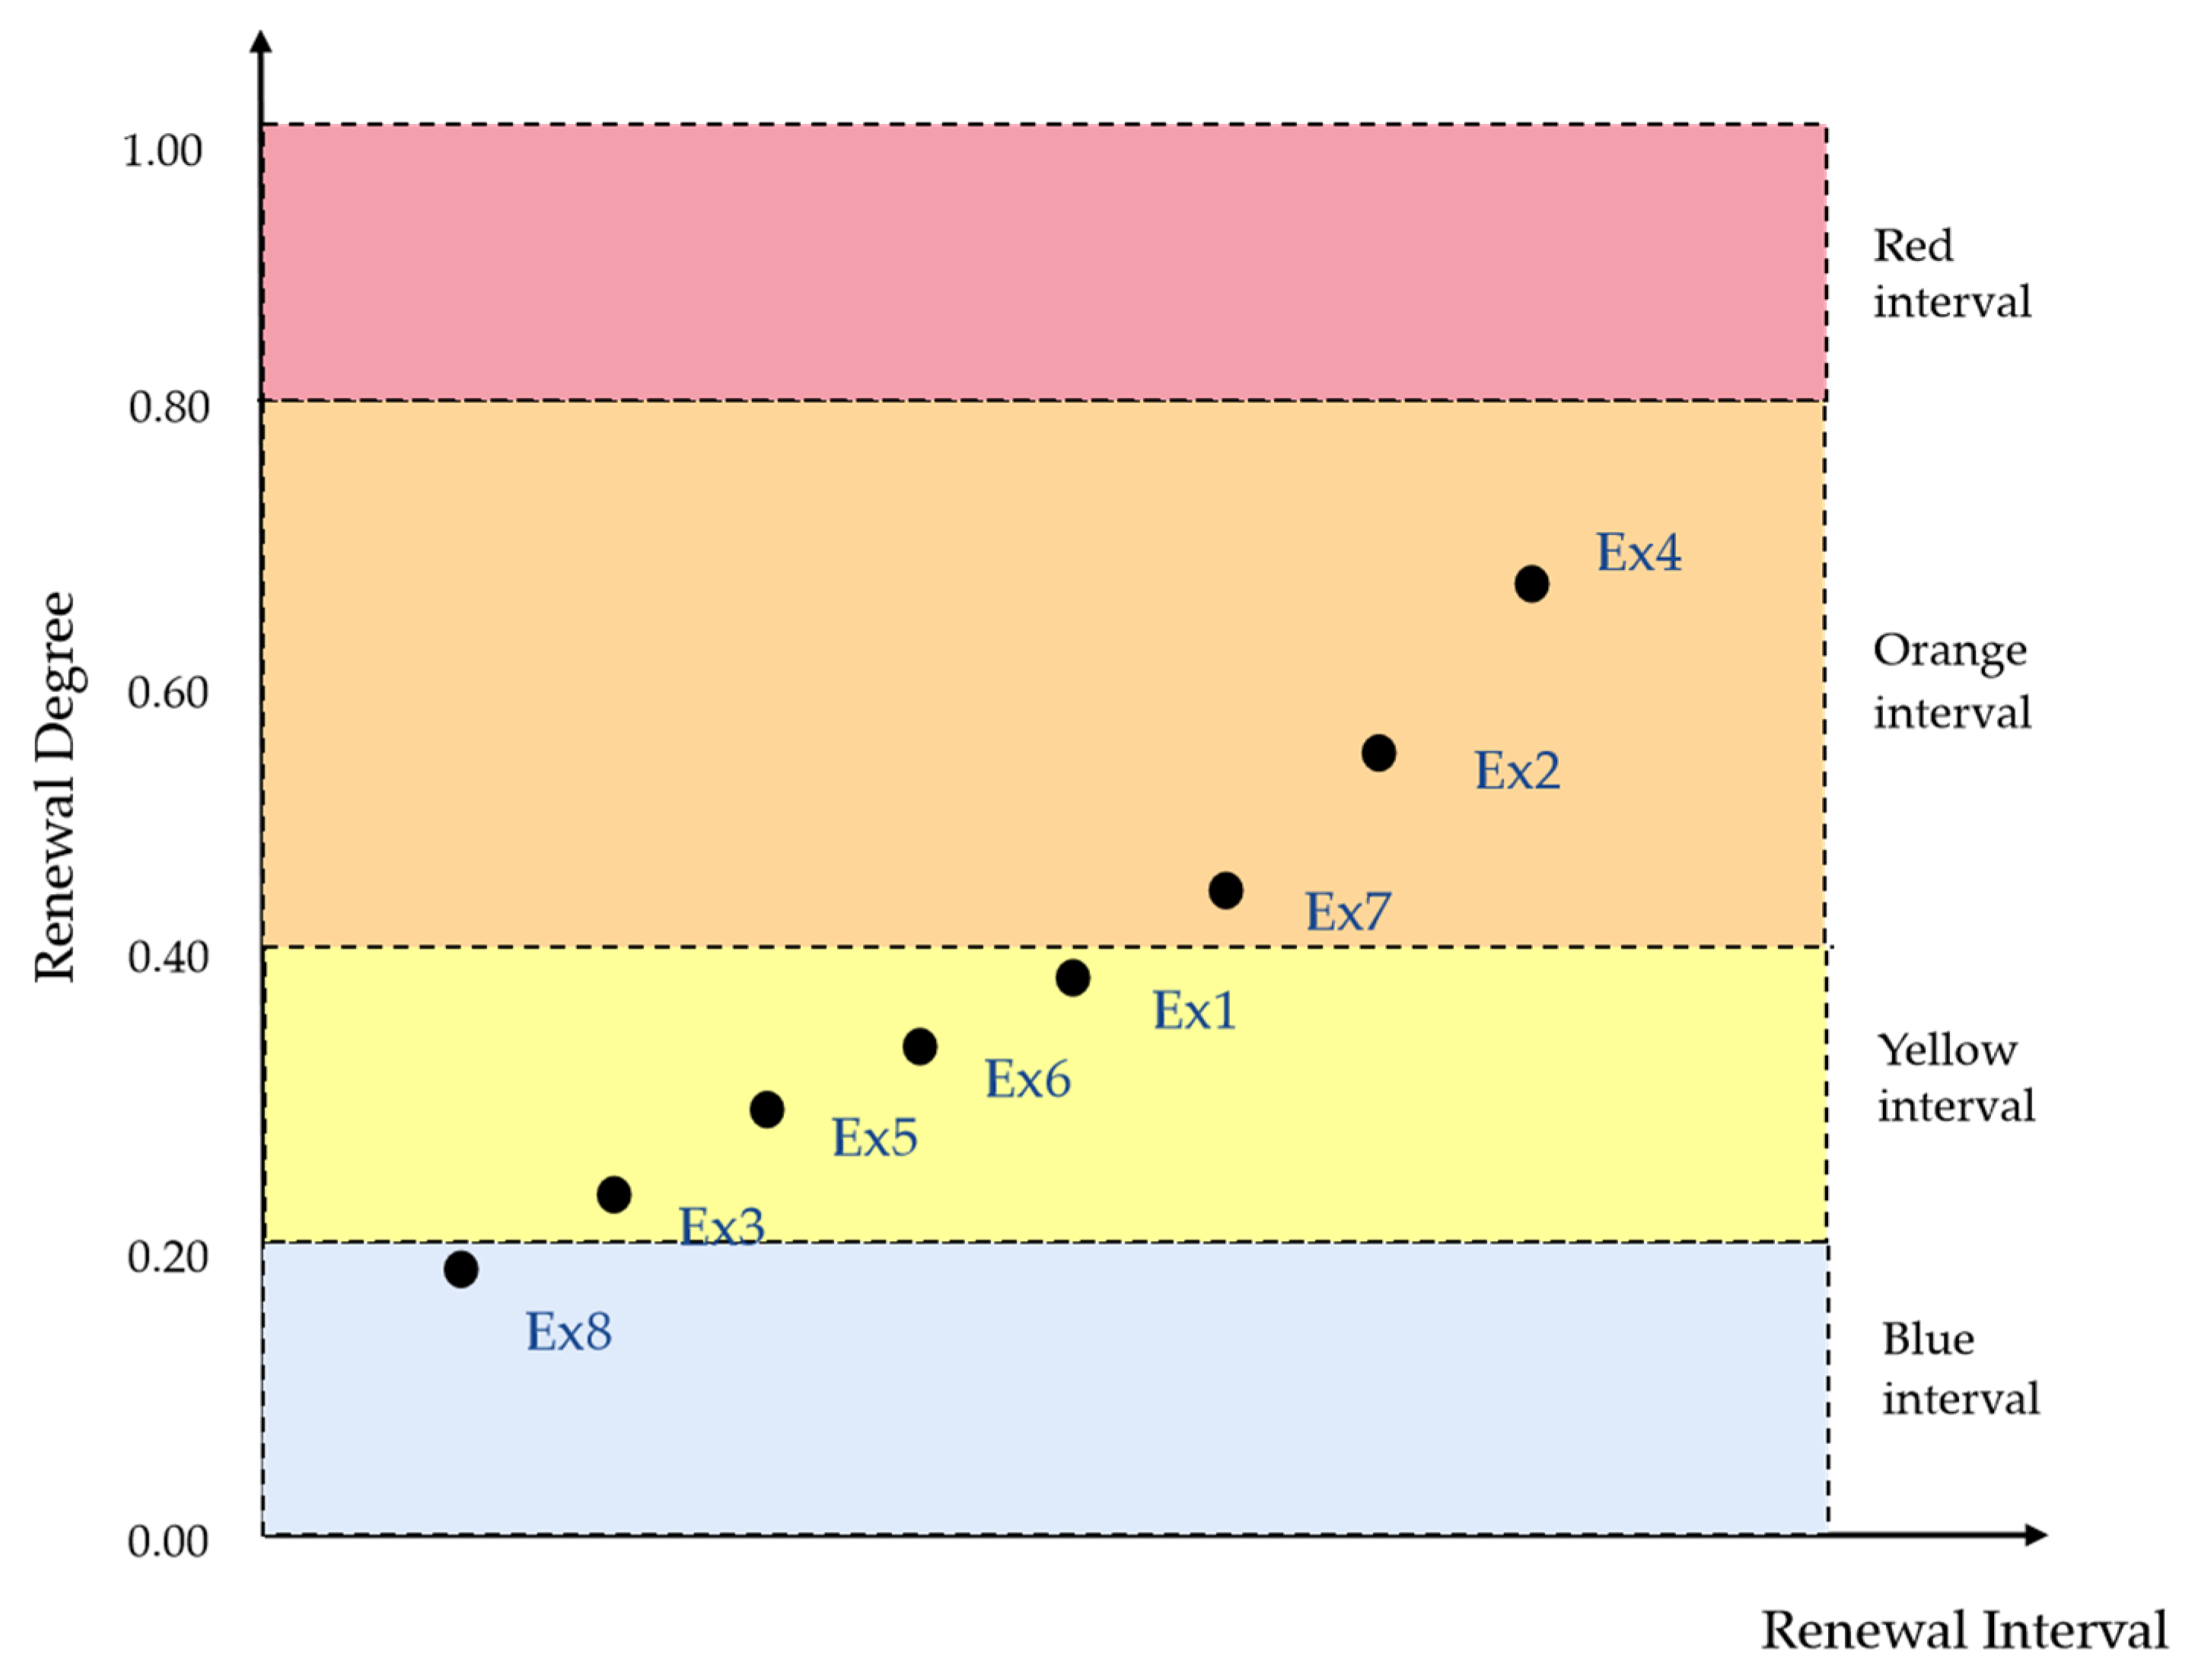
| Ex8 | 0.038 | 0.011 | 0.198 | 8 |
| UERD Interval | Interval Value | Suggestions for Renewal |
|---|---|---|
| Blue interval | [0.00, 0.20] | Repair and maintenance: further maintain the existing advantageous conditions and closely monitor changes in the indicators of renewal needs to enable them to continue healthy operation |
| Yellow interval | [0.20, 0.40] | Upgrading and improvement: take active measures to improve the performance of the project, focusing on indicators with a high demand for renewal, such as improving structural functions, maintaining ancillary facilities, enhancing the level of intelligence, improving the environment and landscape, and improving management |
| Orange interval | [0.40, 0.80] | Improvements and extensions: take active measures to improve the sustainability of the project and avoid deterioration, such as nodal modifications, section upgrades, lane extensions, construction of secondary roads, and application of new materials |
| Red interval | [0.80, 1.00] | Development and re-development: this refers to the overall pattern and design of the project to improve its unsustainable state, such as re-design and construction |
| q | ||||||||
|---|---|---|---|---|---|---|---|---|
| Ex1 | Ex2 | Ex3 | Ex4 | Ex5 | Ex6 | Ex7 | Ex8 | |
| 2 | 0.389 | 0.485 | 0.302 | 0.624 | 0.351 | 0.374 | 0.419 | 0.234 |
| 3 | 0.388 | 0.480 | 0.300 | 0.628 | 0.341 | 0.364 | 0.413 | 0.198 |
| 4 | 0.384 | 0.471 | 0.296 | 0.638 | 0.328 | 0.348 | 0.401 | 0.189 |
| 5 | 0.379 | 0.460 | 0.290 | 0.648 | 0.313 | 0.331 | 0.389 | 0.180 |
| 6 | 0.373 | 0.450 | 0.285 | 0.658 | 0.300 | 0.314 | 0.378 | 0.161 |
| 7 | 0.368 | 0.440 | 0.281 | 0.667 | 0.287 | 0.299 | 0.368 | 0.143 |
| 8 | 0.364 | 0.432 | 0.278 | 0.675 | 0.277 | 0.285 | 0.360 | 0.126 |
| 9 | 0.359 | 0.424 | 0.276 | 0.682 | 0.267 | 0.273 | 0.353 | 0.111 |
| 10 | 0.355 | 0.418 | 0.275 | 0.687 | 0.259 | 0.263 | 0.347 | 0.097 |
| 15 | 0.342 | 0.398 | 0.274 | 0.701 | 0.236 | 0.231 | 0.333 | 0.050 |
| 20 | 0.336 | 0.390 | 0.275 | 0.706 | 0.227 | 0.218 | 0.330 | 0.031 |
Disclaimer/Publisher’s Note: The statements, opinions and data contained in all publications are solely those of the individual author(s) and contributor(s) and not of MDPI and/or the editor(s). MDPI and/or the editor(s) disclaim responsibility for any injury to people or property resulting from any ideas, methods, instructions or products referred to in the content. |
© 2023 by the authors. Licensee MDPI, Basel, Switzerland. This article is an open access article distributed under the terms and conditions of the Creative Commons Attribution (CC BY) license (https://creativecommons.org/licenses/by/4.0/).
Share and Cite
Zhu, M.; Zhou, W.; Hu, M.; Du, J.; Yuan, T. Evaluating the Renewal Degree for Expressway Regeneration Projects Based on a Model Integrating the Fuzzy Delphi Method, the Fuzzy AHP Method, and the TOPSIS Method. Sustainability 2023, 15, 3769. https://doi.org/10.3390/su15043769
Zhu M, Zhou W, Hu M, Du J, Yuan T. Evaluating the Renewal Degree for Expressway Regeneration Projects Based on a Model Integrating the Fuzzy Delphi Method, the Fuzzy AHP Method, and the TOPSIS Method. Sustainability. 2023; 15(4):3769. https://doi.org/10.3390/su15043769
Chicago/Turabian StyleZhu, Min, Wenbo Zhou, Min Hu, Juan Du, and Tengfei Yuan. 2023. "Evaluating the Renewal Degree for Expressway Regeneration Projects Based on a Model Integrating the Fuzzy Delphi Method, the Fuzzy AHP Method, and the TOPSIS Method" Sustainability 15, no. 4: 3769. https://doi.org/10.3390/su15043769
APA StyleZhu, M., Zhou, W., Hu, M., Du, J., & Yuan, T. (2023). Evaluating the Renewal Degree for Expressway Regeneration Projects Based on a Model Integrating the Fuzzy Delphi Method, the Fuzzy AHP Method, and the TOPSIS Method. Sustainability, 15(4), 3769. https://doi.org/10.3390/su15043769