Article

The Electricity Market in Greece: Current Status, Identified Challenges, and Arranged Reforms

by
Jemma J. Makrygiorgou
*,
Christos-Spyridon Karavas
,
Christos Dikaiakos
and
Ioannis P. Moraitis
Department of Research Technology & Development, Independent Power Transmission Operator (IPTO) S.A., Dyrrachiou 89 & Kifisou Str. Gr, 10443 Athens, Greece
*
Author to whom correspondence should be addressed.
Sustainability 2023, 15(4), 3767; https://doi.org/10.3390/su15043767
Submission received: 20 January 2023 / Revised: 10 February 2023 / Accepted: 14 February 2023 / Published: 18 February 2023
(This article belongs to the Special Issue Towards Sustainable Energy Markets)

Abstract

:
The approach of an integrated electricity market is widespread across Europe, since such a market structure has numerous benefits for both the grid and consumers. The current structure and the related policy framework of the electricity markets adopted within the European countries is based on a benchmark model, the so-called Target Model, which describes a reference energy market framework. In this paper, a comprehensive overview of the legislative effort and the resulting Target Model is provided, aiming to set the basis for the description of the adopted electricity markets in Europe. In a second stage, the current status of the Greek electricity market that operates under the Target model scheme is given via the analysis of the involved submarkets, i.e., the forward market, the day-ahead market, the intraday market, and the balancing market. An intricate case study of the Target Model operation in the Greek electricity market within a day of operation is examined, which actually completes the former description. Within the case study, the Greek electricity market is further investigated for its efficiency and the impact on the obtained electricity prices from the first day of the Target Model implementation, which took place in November 2020, and, finally, today is analysed. The results show an overall successful implementation and satisfactory performance of the Target Model in Greece, with an important main result being the reduction of prices in the balancing market and the increase of the intraday market liquidity. However, several challenges are identified and described in detail, while at the same time measures for their confrontation are proposed in order to improve market operation and fully exploit the benefits of the Target Model.

1. Introduction

The term internal market defines a single market that assures the exchange of goods, services, capital, and person and in which citizens are free to live, work, and study [1]. An integrated pan-European energy market is the most cost effective way to ensure secure and affordable energy supplies to all European Union (EU) citizens. In that framework, energy is produced in one EU country and delivered for consumption in another, a fact that leads to an optimal and efficient price environment, while at the same time consumers are flexible to choose from a variety of energy suppliers. The EU is attempting to progressively unify the existing internal energy market via an organized effort, which started more than 20 years ago and is still in progress [2]. In 1996, particularly, the EU gradually enabled the competition in the energy market, aiming to create a single integrated internal European electricity market, able to achieve reduced overall grid costs, benefit security of supply, competitive prices, and enhanced services to consumers [3,4].
This integrated internal energy market in Europe has been established through several legislative packages. The fourth energy package, the so-called Clean Energy Package (CEP) builds further on the energy policy framework defined by the previous packages and paves the way for a gradual transition from fossil fuels to a carbon free economy [5]. The resulting policy framework is incorporated in one benchmark model, the so-called Target Model [5,6]. Within the Target Model, electricity can be treated as any other commodity with the price to be determined based on the EU countries supply and demand and all its participants including operators, suppliers, retailers, and consumers of all generation, transmission, and distribution levels to interact in an organized and productive manner [5,7]. The complete energy market structured under the Target Model framework offers power trading capabilities in different time scales and various levels [8]. During trading, each amount of energy is agreed to be delivered over a specified period in the future and at a predetermined price per unit. Based on their time-scale, operation markets range from real-time to long term. Within the Target Model, the operation of a sequence of markets, from long term to real-time, is defined, which enable the proper function of the wholesale electricity market, namely the forward market (FM), the day-ahead market (DAM), the intra-day market (IDM), and the balancing market (BM) [9].
Several studies have been carried out on the effectiveness of the implementation of the Target Model in EU counties. A detailed study of how bilateral contracts affect electricity markets and lead to increased profits for the overall economy is presented in Refs. [10,11]. In particular, the impact of replacing the explicit auction mechanism with a Target Model in the Italian electricity market is assessed in Ref. [12]. Using different scenarios, the study concluded that there are many benefits of using market coupling, such as the facilitating cross-border congestion management and maximizing the use of interconnection capacity between countries. In the same vein, other studies assess the implementation of Target Model in the British [13], Irish [14], Spanish [15], and Dutch electricity market [16]. In Ref. [17], the authors presented useful lessons from EU electricity market integration with increasing intermittent renewables in the UK electricity market. Regarding the Irish electricity market [18], the authors supported that regulatory authorities should promote competition in the FM. The studies related to the Spanish and Portuguese markets have limited interconnection capacity with other countries, and operate as independent markets [16]. As a result, this limited electricity interconnection capacity leads to higher energy prices. Finally, an overview of Dutch market is presented in Ref. [19], describing and analysing the clearing mechanism in the DAM, IDM, and BM.
The Greek electricity market currently operates under the Target model framework. In the literature, there are some attempts towards describing and analysing the wholesale electricity market [20,21,22,23] before the implementation of the Target Model in the Greek electricity market. In addition, an overview of the Greek market operation after the first three months under the EU Target Model implementation is presented in Ref. [24]. In Ref. [25], the Target Model in the Greek wholesale electricity market and its impact on electricity prices is examined, after the first nine months of its implementation. The present work aims at describing in detail the application of the Target model in the Greek electricity market. To the best of the authors’ knowledge, there is no similar study in the recent literature providing a holistic review of the Greek electricity market for the entire period after the EU Target Model implementation.
To be more specific, in the present study the complete sequence of the involved submarkets in the Greek electricity market are thoroughly analysed and discussed, while its performance is examined via an intricate case study. The different submarkets results operated within the Greek electricity market on a selected day involve the actual conducted trades, the resulting prices, and volumes of all different markets and are given in an attempt to examine the complete market operation. The results indicate an overall satisfactory performance. To be more specific, the DAM operates smoothly and has sufficient liquidity while the IDM includes trivial volumes and limited liquidity. Concerning the BM, one can observe a sufficient traded volume that is preferable to decrease due to the volatile price environment of the real-time transactions within the BM. Those and other challenges have been identified lately, especially after the most recent market reform [26], the increasing penetration of renewable energy sources (RES), and the necessity for the consumers involvement in the market procedure [23,27,28]. All those reasons hinder the smooth and reliable operation of the Target Model, while encumbering its improvement towards achieving full compliance with the European archetypes [23].
In that framework, a variety of measures has been considered, aiming to overcome the aforementioned challenges and enhance the successful operation of both the electricity market and the grid in Greece. The latter involves additional participation within the Greek market such as RES, demand side response (DSR), and storage, introduction of percentage limitations on the traded energy, and refurbishment of the bidding procedures [28,29,30,31]. In addition, one of the most important measures towards the efficient and reliable market operation includes the proposal of new platforms and the expansion of the existing ones within the market structure. In the present work, all the aforementioned and complementary measures are presented and thoroughly analysed for the complete sequence of the markets in Greece.
The main objectives of the present work involve (i) the provision of a detailed overview of the involved submarkets in the Greek electricity market, which include the FM, the DAM, the IDM, and the BM, (ii) an analysis of the complete sequence of the involved submarkets, (iii) provision and comparison of the different submarket results, and (iv) a comprehensive analysis of the identified challenges within the market operation and complementary measures for their confrontation.
The remainder of the paper is organized as follows. In Section 2, a brief description of the legislative effort towards establishing the general framework for an integrated electricity market is provided. In Section 3, the different markets involved in the proposed Target Model are analysed, while in Section 4, the current market status in Greece after the application of the Target Model is presented in detail. In Section 5, a case study of the Greek market operation is provided and examined. Based on that case study, in Section 6 several challenges of the Greek electricity market are identified and discussed, while several measures towards a more efficient and reliable system operation are proposed. Finally, in Section 7 some useful conclusions are drawn.

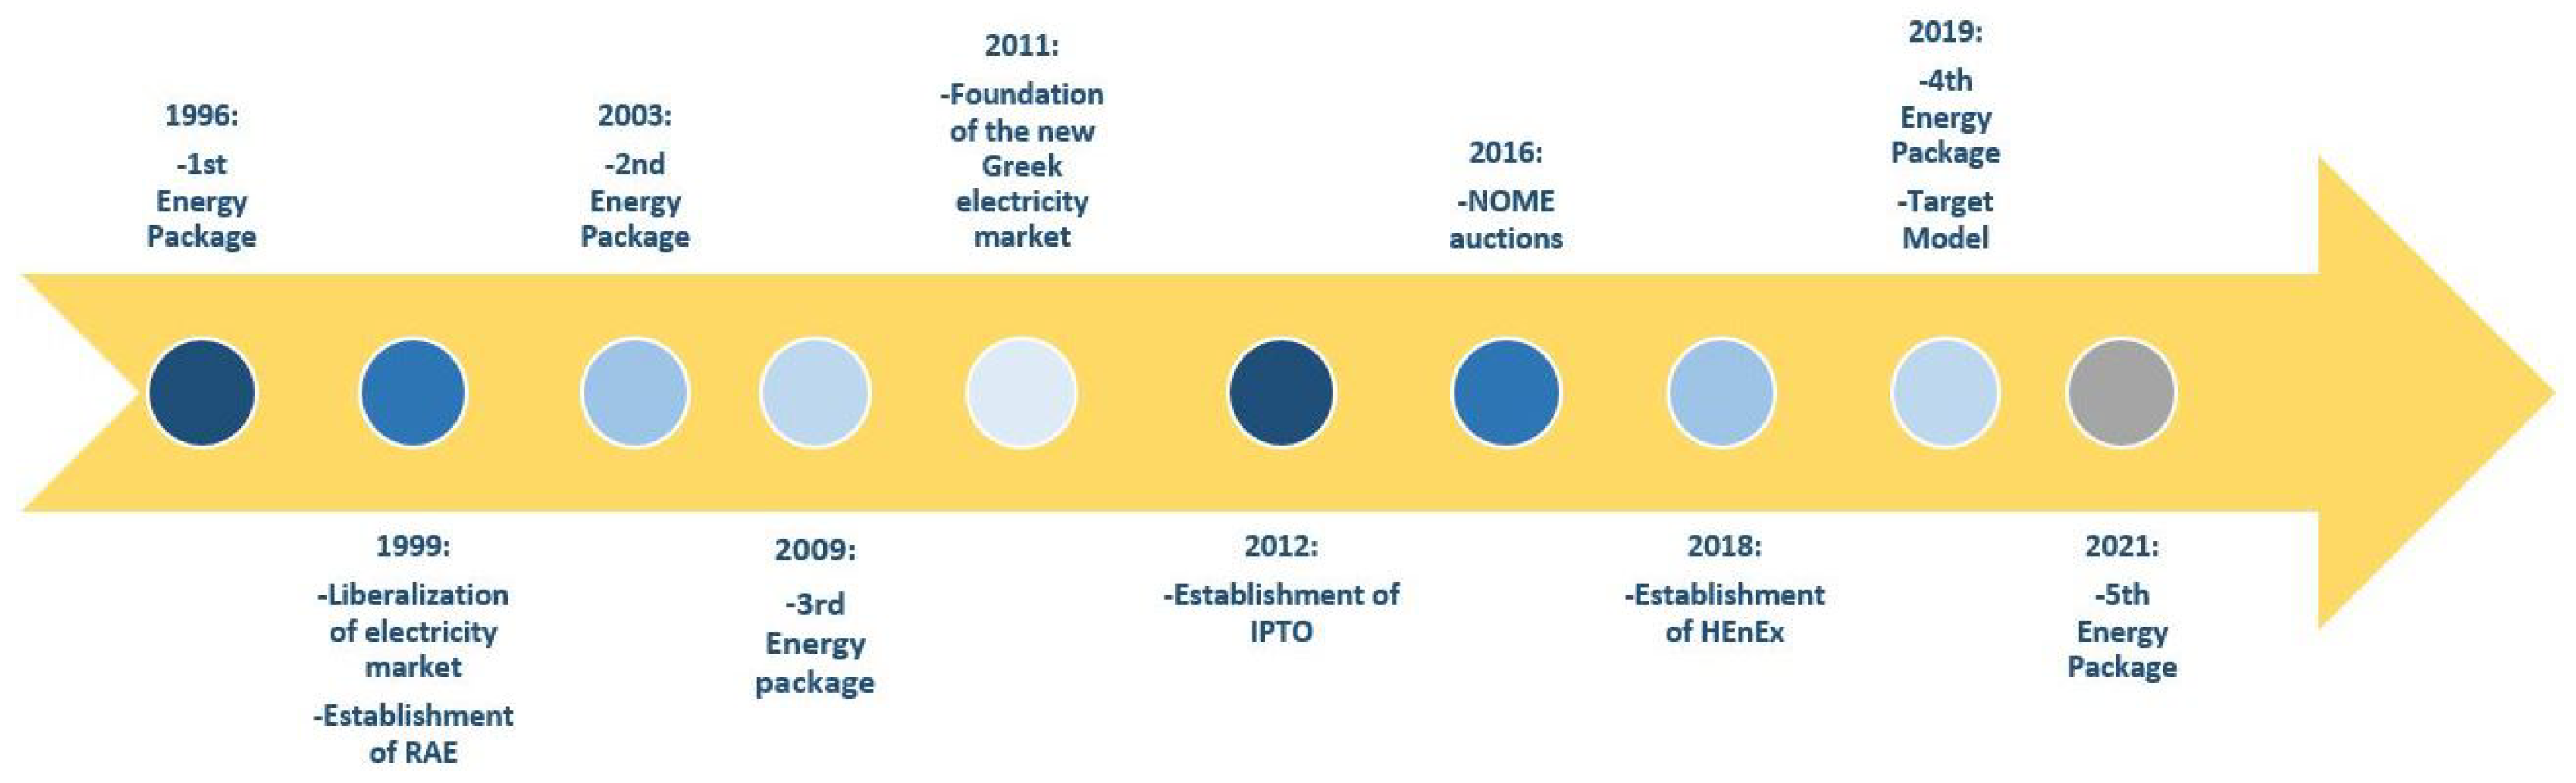
2. The Electricity Market Policy Framework

The integrated energy market approach in Europe has been established via an extensive legislative effort incorporated into four legislative packages. The first energy package consists of two Directives; the electricity Directive 96/92/EC [32] and the GAS Directive 98/30/EC [33], which laid down the provision for the liberalization of the internal market of electricity and GAS. The second energy package contains two Directives and one Regulation that extended the liberalization of the energy market. In particular, it involves electricity Directive 2003/55/EC [34] and Regulation (EC) 1228/2003 [35] about cross-border exchanges in electricity. The third energy package involves two Directives and three Regulations related to the electricity market. Specifically, Directive 2009/72/EC [36] contained common rules for the internal market in electricity, Regulation (EC) 714/2009 [37] contained conditions for access to the network for cross-border exchanges in electricity, and Regulation (EC) 713/2009 [38] provided the establishment of the Agency for the Cooperation of Energy Regulators (ACER). The package entered into force in September 2009 [9]. The Electricity Directive 2009/72/EC remained in force until the end of 2020, when the new electricity market rules were applied.
The fourth package, namely CEP, consists of four Directives and four Regulations [5]. The most important legislation concerning the electricity sector is the electricity Regulation (EU) 2019/943 [39], which sets the principles for the internal EU electricity market and focuses on the wholesale market and the network operation, and the electricity Directive (EU) 2019/944 [40], which sets the rules for the generation, transmission, distribution, supply, and storage of electricity while simultaneously empowering consumer participation in the energy market. The fifth energy package, namely “Fit for 55” package, was presented by European Commission in July 2021 and made a set of proposals and Directives in order to achieve even higher targets for greenhouse gas emissions reduction and increasing the share of RES in the EU energy mix by 2030, compared to the previous packages. Specifically, the targets of “Fit for 55” are a 55% reduction in greenhouse gas emissions and 40% increase of RES by 2030, relative to the 1990 level [41]. The Directives of “Fit for 55” package include (i) a revision of the Emissions Trading System by increasing the emission reduction obligation for the included sectors from 40% to 61% by 2030 and by including additional polluting sectors such as maritime, shipping, and future addition of travel and real estate by 2026 [42], (ii) amendment of the energy efficiency Directive, which concerns the achievement of EU objectives for overall improvements in energy efficiency and is achieved by removing the obstacles that have been identified. The new target for improvement in overall energy efficiency is 39% by 2030. (iii) A definition of Carbon Border Adjustment Mechanism that aims to protect the EU industry by asking energy producers from other regions with lower costs production, mainly due to weaker environmental standards, to pay for emissions as EU companies [43], and (iv) provision of incentives to investors for new projects in the field of renewable hydrogen energy [44].
All this legislative effort has been converted into network codes that set the principles for the efficient and reliable operation of the market. These network codes describe the market design for the European internal electricity market [45]. Corresponding legislation includes Directives 2009/72/EC, Directive (EU) 2019/944, and Regulation (EU) 2019/943, which contain common rules for the internal market in electricity, Regulation (EC) 714/2009, which contains conditions for access to the network for cross-border exchanges in electricity, i.e., the Electricity Balancing Guideline (EB GL), Regulation (EU) 2017/2195 [46], which lays out detailed rules for the integration of balancing energy markets in Europe, Regulation (EU) 2017/1485 [47], which sets harmonized rules for transmission system operators (TSOs), distribution system operators (DSOs) and significant grid users, i.e., the System Operation Guideline (SO GL), in order to provide a legal framework for the operation of the interconnected transmission system aiming to maintain system security, Regulation (EU) 2015/1222 [48], which establishes a guideline on capacity allocation and congestion management (CACM GL), and Regulation (EU) 2016/1719 [20], which establishes a guideline on forward capacity allocation (FCA GL) [49].
In Greece, all these attempts towards an integrated energy market are concentrated on the application of the Target Model [50,51]. The latter describes the operation of the electricity market, since 1 November 2020, and is based on Laws 4425/2016 and 4512/2018 of the Greek Ministry [9]. The reformation of the electricity market in Greece started several years ago and has been realized via various legislative steps; see Figure 1 [52]. In particular, Law 2773/1999 laid the foundations of the Greek electricity market liberalization and the regulation of some key points of the national energy policy [53,54]. It also introduced the Regulatory Authority of Energy (RAE) to monitor and control the electricity market. Law 3426/2005 introduced several additions into Law 2773/1999 that accelerated the electricity market liberalization process [55,56]. In 2011, the Greek government proposed a comprehensive new legislation in order to convert the third EU Directive into national law and reform the electricity sector. In particular, Law 4001/2011 introduced the transition from the Independent System Operator model to the Independent Power Transmission Operator (IPTO) model [55,56], and strengthened the energy regulator (RAE), by transforming it into a distinct legal entity aiming to grant its financial autonomy. The financial and operational independence of RAE has been further strengthened by Law 4425/2016. Laws 4336/2015, 4389/2016, and 4393/2016 provided the framework for undertaking NOME (Nouvelle Organization du Marché de l’Electricité) auctions to enhance market competition [53,54]. The most recent regulatory reform, related to the implementation of the electricity Target Model in Greece, is Law 1090/2018, published in the Official Government Gazette of the Hellenic Republic on 31/12/2018 [9,57]. In that framework, the current market model in Greece is set to apply all four markets deriving from the relevant legislation, namely the FM, DAM, IDM, and BM [9,53,54]. The operation and monitoring of the electricity market in Greece until 2018 (DAM and IDM) was operated by the Hellenic Electricity Market Operator (LAGIE). In 2018, the Hellenic Energy Exchange (HEnEx) was established in order to operate the energy market and to be responsible for the clearing and settlement of the transactions.

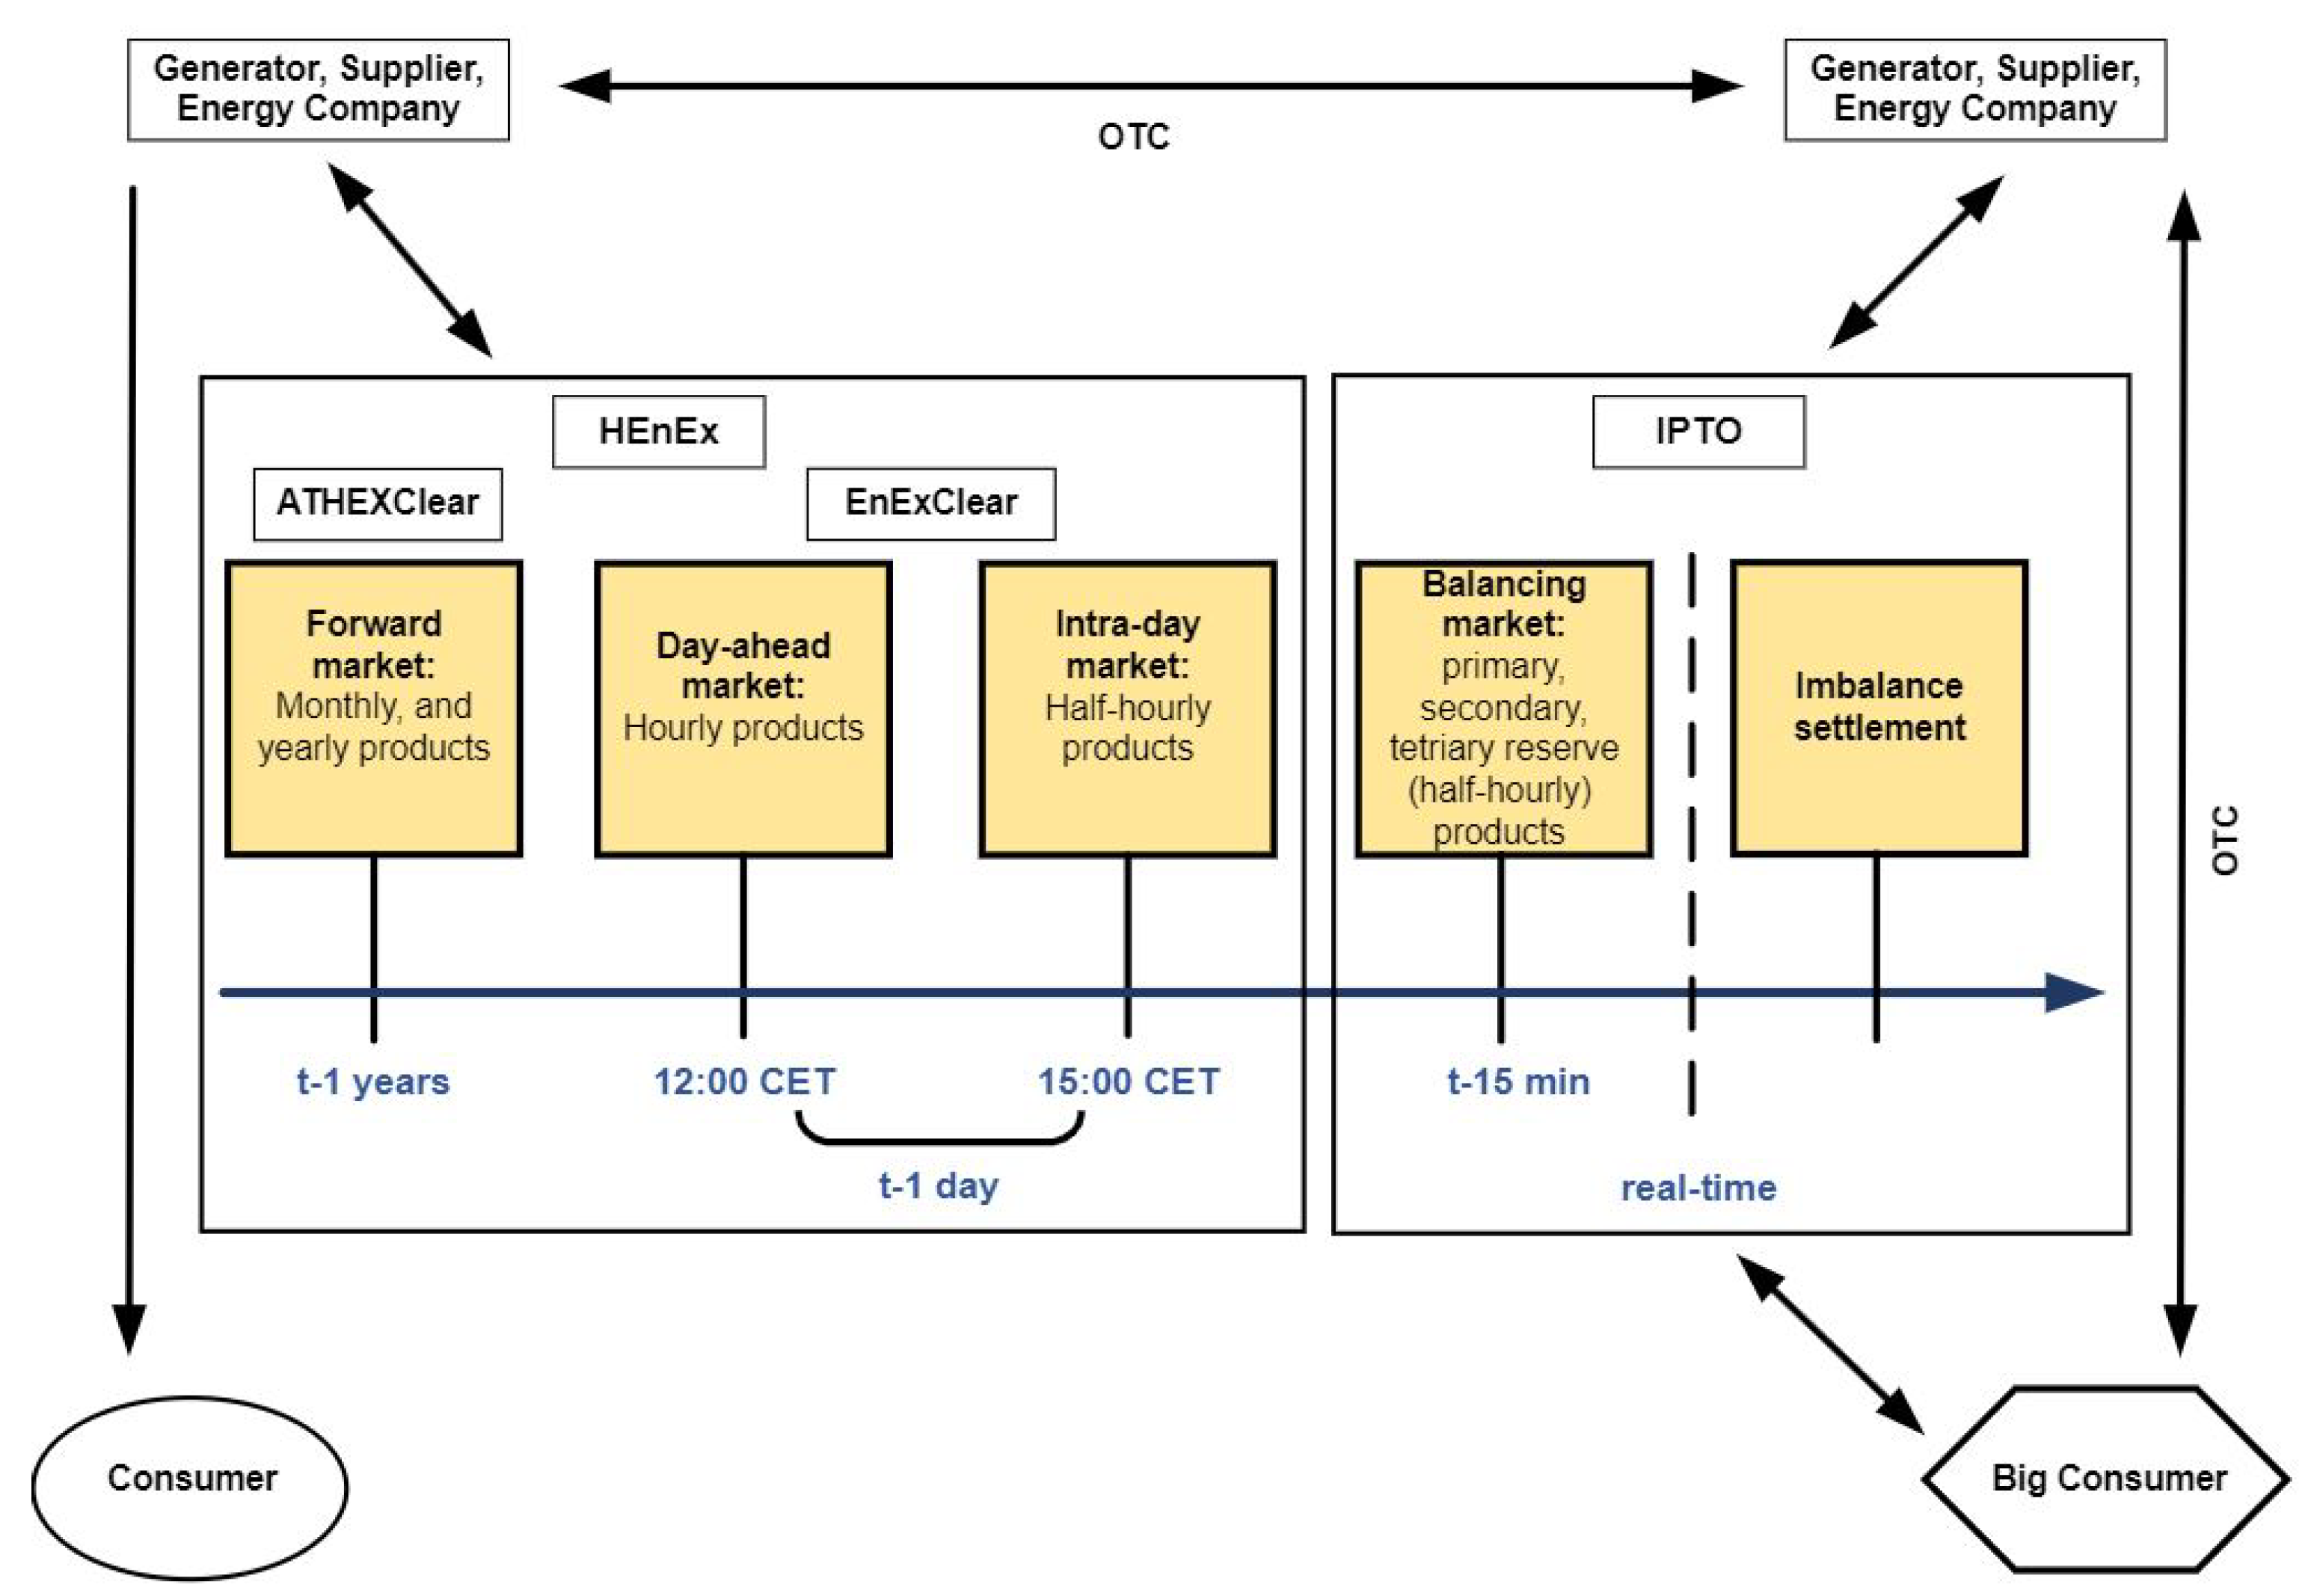
3. The Target Model Architecture

The actual structure of the Target Model in terms of its technical functioning is quite complex, however, its fundamental scheme is simple enough to describe. The Target Model, shown in Figure 2, is implemented through four electricity markets operating on energy exchange, namely the FM, the DAM, the IDM, and the BM, and a coordinated approach for capacity allocation [58,59]. The four different markets cooperate in order to achieve one dominant price across the EU countries, while electricity is generated, transported, delivered, and used in various levels and timeframes.

3.1. Forward Energy Market

FM operates for years up to the day before the delivery and participants agree on a price for electricity purchase in the future [60]. The FM is defined to minimize the exposure of its participants to price fluctuations by determining long-term contracts. The risk reducing mechanism within the FM that limits and protects participants from the IDM volatility is called hedging [60]. In the FM framework, there are forward contracts, future contracts, and options calls. Forward electricity contracts represent agreements for purchase and sale of fixed amounts of electricity at a given price and certain time period in the future. Forwards do not trade on a centralized exchange, instead trading over-the-counter (OTC), and are highly customizable, allowing for a customized date and price. Futures are standardized contracts for purchase or sell of electricity at a predetermined price at a specified time in the future with the obligation of physical delivery. Futures contracts are standardized for quality and quantity, and facilitate trading on a futures exchange, giving more flexibility to the involved parties. The buyer or seller of a future contract is taking on the obligation to buy or sell the specified amount of electricity when the futures contract expires. An option is a contract that gives the holder of the option the right to buy or sell a specified energy amount during a certain future time period and at a fixed price [61]. Therefore, an option provides more flexibility than a forward contract since the holder can decide whether or not the option is exercised depending on the availability of its generating units and the pool price behaviour. Nonetheless, whereas signing a forward contract entails no cost, there is a non-refundable cost to acquire an option [61]. Futures and options traded on a futures exchange allow the sellers or buyers of electricity the certainty on the price they will receive or pay for their products at the market. Exchanges are performed by the European Energy Exchange (EEX). Contracts trading on an exchange have standardized sizes, expiration dates, and for options strike prices [61]. Exchanges also provide pricing information, including price, bids, and offers, and clearing services ensuring that participants do not have to worry about the risk of a trade failure [61].
The resulting energy prices in the FM framework are determined in each bidding zone that in most cases overlaps the national borders and includes multiple countries. Trading occurs both within the limits of a bidding zone or between different zones. Cross-zonal trading is performed based on FCA GL and the allocation of the transmission capacity is defined explicitly [62]. In such an explicit cross-border allocation, transmission capacity is traded apart from electric energy. This implies that market players first buy the physical transmission rights (PTRs) to use the transmission capacity between two market zones (forward capacity market) before buying or selling electricity in another zone (forward energy market). The allocation of the short-term and long-term cross-border capacity for all TSOs within the EU is performed by the Joint Allocation Office (JAO) through explicit auctions. JAO has been designated a Single Allocation Platform and belongs to 25 TSOs from 22 countries of the EU. IPTO is a member of JAO and holds a 5% stake in the company’s share capital.

3.2. Day-Ahead Market

The DAM is a very important part of the Target model. Its name stems from the fact that electricity transactions are delivered on the next day of their auction. During closure of the DAM, in each market the scheduled generation is necessary to be equal to the forecasted demand adjusted to the net import or export. Participants of the DAM are mandatorily the producers, while all others are able to participate optionally. Each participant submits a balanced portfolio (nominations) to the system operator in order to provide information related to the planned generation or consumption for every unit in its position [3,62]. The accepted bid price is set at a marginal price, which is defined as the financial settlement of purchase and sell of energy [62]. In addition, bilateral OTC contracts and contracts with obligation of physical delivery are considered, which actually result from the FM and are allocated explicitly within the DAM. Coupling of the different EU countries DAMs is achieved via implicit allocation of the transmission capacity, which in fact implies that bids are accepted up to the point when congestion issues occur.
Currently, the EU’s main objective is to finalize the adoption of the single pan-European cross-zonal day-ahead electricity market, the so-called single day-ahead coupling (SDAC); see Figure 3. The latter effort stems from the initiative of Price Coupling of Regions (PCR), which is based on the CACM GL [63]. SDAC allocates scarce cross-border transmission capacity in the most efficient way by coupling the electricity markets from different regions through a common algorithm that takes into account cross-border transmission constraints. The algorithm applied is the Pan-European Hybrid Electricity Market Integration Algorithm (EUPHEMIA) and it is compliant with CACM GL requirements [64,65]. DAM coupling requires input data from all involved Nominated Electricity Market Operators (NEMOs) and TSOs. Essentially bids, offers, and network capacities and constraints are matched by EUPHEMIA and are validated. The outputs, such as matched trades, clearing prices, and scheduled exchanges are afterwards forwarded to NEMOs and TSOs. These procedures occur within precise and tight timelines, while ensuring optimal economic solutions, high performance, and robustness. In 2023, flow-based implicit allocation within the DAM will be implemented in the framework of the Core Flow-Based Market Coupling Project [64,66,67].

3.3. Intra-Day Market

The IDM involves the trading of electricity that occurs the same day of delivery. IDM participants have the opportunity to proceed with corrections in the day-ahead bids, close to the time of physical delivery when DAM deviations emerge in order to reduce their exposure to imbalance costs. The intraday nominations are integrated to the day-ahead nominations of the participants. The transactions in the IDM are related to upward and downward deviations and their financial settlement is based on market equilibrium prices that are common for both upward and downward changes [68,69]. The methodology that prices cross-zonal intra-day capacity is described based on the cross-border intra-day (XBID) trading and the single intra-day coupling (SIDC) solution.
The XBID trading solution is an initiative that establishes a common cross-border implicit continuous intra-day trading solution across Europe, as shown in Figure 4, aiming to allocate all the cross-border capacities. The purpose of the XBID is to increase the overall intra-day trading efficiency and to create welfare benefits [70]. The XBID consortium partners consist of the European NEMOs, such as EPEXSPOT, GME, NordPool, and OMIE, and several TSOs. The XBID solution supports both explicit allocation and implicit continuous trading on all bidding zone borders. It is in line with the EU Target Model for an integrated IDM. The connection of EU IDMs through XBID is an important mechanism for market participants to keep their positions balanced and to optimize the use of generation and the DSR products development.
The adoption of the XBID project across the EU resulted in the SIDC. The SIDC objective is to allow for continuous cross-border trading across Europe in order to create a single EU cross-zonal intra-day electricity market [71,72]. SIDC offers several benefits to market participants and power systems such as the reduction of the need for reserves and associated costs without affecting the system security since it allows an adequate amount of time for carrying out system operation processes. Within the SIDC solution, three pan-European auctions are performed. The latter are currently called complementary intra-day auctions (CRIDAs) and in the next years they will be outplaced by the term intra-day auctions. The IDM design also involves an implicit continuous trade-matching algorithm that couples the IDMs at European level with first-come first-serve capacity allocation, based on the CAMC GL. It is also possible for individual regions to implement complementary auctions in a unified framework that involves continuous trading [68,69].
The execution of CRIDAs for the pricing of cross-border capacity, EUPHEMIA is adopted. It is used to calculate energy allocation, net positions, and electricity prices across Europe, maximize the overall welfare, and increase the transparency of the computation of prices and power flows resulting in net positions. Orders entered by market participants in one country can be matched by orders similarly submitted by market participants in any other country, provided there is cross-zonal capacity available. The SIDC supports both explicit and implicit continuous trading and is in line with the EU Target Model for an integrated cross-zonal IDM [72]. SIDC has been expanded in several phases, also referred to as waves. The map in Figure 4 shows the geographic spread of the implemented SIDCs. The first go-live wave was in June 2018 and was included 15 countries. A second go-live with 7 further countries was achieved in November 2019, and a third go-live including Italy was in September 2021. Greece is expected to be coupled with the other SIDC members by the end of 2022 [72].

3.4. Balancing Market

The main purpose of the BM is to correct imbalances between input and output in the electricity system, close to real-time [73]. In particular, the TSOs of each country procure both the balancing capacity related to the systems reserve requirements and energy for the imbalance between production and demand in real-time. A BM can be divided into three basic submarkets; (i) the balancing capacity market that ensures the sufficient reserves, (ii) the balancing energy market that activates energy in real-time to ensure that the system is in balance while meeting demand for energy and reserves by taking into account all the technical constraints of the system, and (iii) the imbalance settlement process which allocates the BM revenues and costs to the participants [73,74]; see Figure 2. Within the balancing capacity market, balancing responsible parties (BRPs) state their planned energy generation and consumption to the system operator the day before the delivery. The contracts are done one year ahead up to one day ahead of delivery [62,69]. The contracted parties in the balancing capacity market then offer balancing energy in the balancing energy markets [49]. Within the balancing energy market, balance service providers (BSPs) submit balancing service bids to the system operator, which in its turn procures the prices in order to secure the system balance. The volume of activated energy depends on real-time imbalances [62,73]. During the imbalance settlement, energy imbalances that occur between the BRPs submitted energy and the activated energy is settled [73,74]. Particularly, the TSO is responsible for settling the imbalances by activating reserves and by setting tariffs to the contacted parties for imbalances in their portfolios.
The restoration reserves (RRs) used in BMs include (i) upward and downward frequency containment reserves (FCRs), (ii) upward and downward manual frequency restoration reserve (mFRR), (iii) upward and downward automatic frequency restoration reserve (aFRR), and (iv) upward and downward balancing energy. The FCRs, formerly called “primary reserves”, are used to stabilize the frequency within the time frame of seconds by means of automatic controlled and locally activated reserves [75]. Frequency restoration reserves (FRRs), formerly called “secondary reserves”, are used to restore the system balance, are active in the range of seconds up to 15 min, are controlled automatically, and are activated centrally [73,75]. Replacement reserves, formerly called “tertiary reserves”, are used to restore the system balance when FRRs are not able to do so (i.e., in case of major imbalances) and allow the FRR units to return to their pre-imbalance status, allowing them to be ready for the next short-term imbalance intervention. Replacement reserves are active in the range of minutes to hours, controlled manually, and activated locally [75].
A main characteristic when calculating an imbalance price is the imbalance settlement period, which defines the frequency of the determination and publication of imbalance price signals sent to BRPs [73,74]. Imbalance prices are based on the regulation prices or costs and consequently they reflect the real-time balancing costs. Those costs are allocated to the BRBs, aiming to balance their energy portfolio. BSBs receive the upward regulation price in case marginal price is used or the bid price in case of pay-as-bid pricing, in order to provide upward regulation. Similarly, BSPs that provide downward regulation pay the downward regulation price or the bid price. The EB GL regulation and the recast of electricity regulation provide clear provisions on the imbalance settlement and, among others, establishes a harmonized time unit of 15 min for which the BRPs’ imbalances have to be calculated [76].
A core element of the EB GL regulation is the implementation of platforms for the exchange of balancing energy. TSOs from all EU countries are required to implement four platforms, for RR, mFRR, aFRR, and imbalance netting (IN) purposes [77,78]. The projects that are in the lead of its design and implementation are the (i) Trans–European Replacement Reserves Exchange (TERRE) for the RR platform, (ii) Manually Activated Reserves Initiative (MARI) for the mFRR platform, (iii) Platform for the International Coordination of Automated Frequency Restoration and Stable System Operation (PICASSO) for the aFRR platform, and (iv) International Grid Control Cooperation (IGCC) for the IN platform [79,80,81,82].
In the framework of the BM, redispatching of the generation units also occurs. The term redispatching in the EU internal electricity market means a measure activated by one or several system operators by modifying the generation and/or load pattern to change physical flows in the transmission system and relieve a physical congestion. Redispatching is needed when the market outcome results in generation and consumption schedules that would lead to a potential violation of operational limits of a certain network element within a bidding zone. The CEP organizes redispatching in a market-based manner. Currently, in most EU countries, generation units are still legally obliged to participate in redispatch, and the regulated prices, or prior opportunity costs from the wholesale market, are paid to the owner of the redispatched resources [62].
Remuneration of activated internal or cross-zonal redispatching varies among the EU countries. A categorization of the different pricing mechanisms for redispatching existing in different countries result in price-related, cost-related, and cost-related plus an additional margin pricing. The most common method used is the pay-as-bid pricing followed by the regulated pricing, based on either a market price (e.g., day-ahead price) or a cost-based pricing (e.g., remuneration of the fuel cost and other costs related to the change in the plants operating schedule) [83].

4. The Electricity Market in Greece

In the present work, the outcome of the Target Model application in Greece is examined. In that framework, the complete sequence of the implemented markets within the current wholesale market in Greece, i.e., the FM, the DAM, the IDM, and the BM and their linkages with OTC bilateral agreements and the rest of market participants are described in detail [84,85,86]; see Figure 5. The latter description includes all relevant information about the existing market timeframes, the adopted pricing methods, the applied optimization algorithms, the resulting price limits, the mathematical representation of the remunerated products within the markets and other useful market specifications that are provided to complete the current market description [50].

4.1. Forward Market in Greece

The new energy FM in Greece has been launched in March 2020 and operates by the HEnEx, under the guidance of the Hellenic Capital Markets Commission, while the Athens Exchange Clearing House (ATHEXClear) performs transaction clearing, and provides the possibility of trading both financially and physically settled forward contracts [26,86]. Participation is provisional and involves producers, suppliers, traders, aggregators, and consumers. The Greek FM actually constitutes a Financial Instruments Directive (MiFID II) compatible market, accompanied by a European market infrastructure regulation (EMIR) compliant central counterparty, particularly ATHEXClear, that clears the OTC derivatives contracts. This market provides several benefits to its participants such as increased reliability, transparency, efficiency, and minimization of counterparty credit risk exposure [84,85,86]. In the new market structure imposed by the Target Model, transactions are designed to occur on the days set in the trading days calendar. Two months before the end of each year, HEnEx is obliged to issue the trading days calendar of the following year [87]. The buyer of a contract within the FM has the obligation to buy a certain quantity of electricity, and the seller has the obligation to sell a certain quantity of electricity at a certain price and a predefined date, either bilaterally via OTC contracts or through the FM process [84,85,86]. At the same time, FM participants are completely flexible to differentiate their position within that horizon.
Forward contracts are designed to be monthly or yearly standardized contracts [85]. The value of the forward contracts per load profile, including peakload and baseload, are calculated as the average value of the DAM during their delivery period. The baseload profile provides a constant energy delivery rate for all hours, Monday to Sunday, while the peakload profile provides a constant energy delivery rate from 08:00 to 20:00 CET, Monday to Friday [86]. Within the FM in Greece, HEnEx operates the OASIS trading system, a platform that provides high security and reliability on buying or selling energy and commodity products [86]. Trading is performed either via continuous trading, or via predefined trades, or via auction calls in the framework of the automatic volatility interruption mechanism. The name of each trading series within the Greek FM contains information about the country (i.e., “GR” stands for Greece), the type of commodity (i.e., “E” stands for electricity), the load profile (i.e., “B” stands for baseload, “P” stands for peakload), the delivery duration (i.e., “M” for monthly, “Q” for quarterly, “Y” for yearly), and finally the delivery period (month and year). The types of orders that could be submitted in the FM involve the limit orders, linked orders, and iceberg orders. An order may be submitted with the execution and time requirements, such as good for the day, good till cancelled, good till date, immediate or cancel, fill or kill, all or none, and stop. Besides the regular type orders, market making orders can be submitted [86]. Market makers fulfil their obligations by entering quotes in the system, whose main characteristic is that when submitted, they replace the corresponding previous active orders. A market maker is actually a liquidity provider that quotes both a buy and a sell price in a tradable commodity aiming to make a profit on the bid–ask spread. The function of a market maker is to help limit price volatility by setting a limited trading price range for the assets being traded. Those orders are supervised by HEnEx and are usually daily orders. The handling of these orders regarding rectifications or cancellations is performed in the same manner as simple orders [86].
In the FM, participants can also benefit by trading energy via the registration of bilateral OTC contracts with physical delivery obligations at the Energy Trading Spot Market System (ETSS) of HEnEx [87]. Only the participants of the DAM have the option of physical settlement of the amount of electrical energy that corresponds to the positions they hold in OTC contracts. Particularly, based on the available capacity of generating units and RES, and the long term PTRs of the participant per interconnection and per direction for each market time unit of the delivery day, the net delivery positions are calculated. The net delivery position for each participant is calculated as the sum of sales minus the sum of purchases of the participant within the FM, both in a continuous and bilateral way [87]. Afterwards, the participants in the physical delivery nominations allocate the energy quantities exchanged within the FM to their production resources (generating units, RES, etc.) or to imports and interconnections for the physical settlement of electricity. In a similar manner, the participant in the context of physical offtake nominations allocate the energy quantity of the FM to their load portfolios, pumping units, and exports [55].

4.2. Day-Ahead Market in Greece

The DAM in Greece is an hourly spot market, that balances demand and supply via regulating the electricity prices. Participants are able to submit the amount of energy they want to trade within the DAM on the day before the delivery, disregarding commitments through the FM or outside it. In the DAM the traded quantities result from bilateral OTC contracts and from the FM with the obligation of physical delivery. Participation in the DAM is mandatory for producers and provisional for all other participants. Producers are obliged to submit sell orders for the available capacity of the generating units they represent that has not been already allocated via physical delivery nomination [55]. In the framework of the DAM, implicit allocation of the transmission capacity between the different market zones also occurs [88].
The Greek DAM is integrated into the pan-European DAM since February 2015, when Greece joined the multi-regional coupling (MRC) area [84]. The latter aimed at coupling Greece with many countries, among them the neighbouring countries Italy and Bulgaria. The Greece–Italy market coupling extension was launched in December 2019 with the initiative of Italian Borders Working Table (IBWT) and implemented a day-ahead coupling mechanism with implicit capacity allocation on the borders via the high voltage DC (HVDC) interconnector. In a similar manner, the Bulgarian–Greek market coupling project was launched as a part of the IBWT regional project in May 2021. The European Commission extended those coupling mechanisms via the establishment of a SDAC [89]. In that framework, the market coupling of the Greek bidding zone directly with Italy and Bulgaria and indirectly with all the other EU countries occurs in the DAM via the adoption of EUPHEMIA [90,91]. As far as the non-European countries Southeast Electricity Network Coordination Center (SEleNe CC) was introduced by the TSOs of Greece, Bulgaria, Italy, and Romania. In July 2022, SEleNe CC transformed into a Regional Coordination Center (RCC) aiming to effectively address the technical challenges between all neighbouring countries outside the EU [90,91].
In the current market state, before the initialization of the DAM, some pre-market operations are performed. The latter involve the physical delivery of trades on energy financial instruments concluded either within the FM or bilaterally and are subject to physical delivery in the DAM [55]. Additionally, based on the results of the intra-day auctions for the allocation of the PTRs to non-coupled interconnections, HEnEx calculates the maximum energy quantities for which DAM orders can be submitted for imports and exports [55]. In the DAM, the delivery day consists of 24 market time units [84,85]. Gate opening is at 10:00 CET, two days before the delivery, and gate closure time is at 12:00 CET of the day before the delivery [59]; see Figure 6. The product traded is an hourly contract of electricity with physical delivery that specifies the quantity and price. The supported orders in the DAM are of several types, such as hourly hybrid orders composed of step and linear segments for each market time unit of the delivery day, block orders consisting of a fixed price limit, a minimum acceptance ratio, and an energy quantity for a number of market time units within the delivery day. There are also linked block orders that include individual block orders linked to each other via a parent child relationship, and exclusive group of block orders [55]. Block orders can only be submitted by producers with thermal plants. The hourly hybrid bids are the most common type of bids in power exchanges, and the essential information required on each bid includes information about the participant, type of bid (sell or buy), hour of the day, quantity, and price [84,85].
Market participants submit their bids throughout ETSS to HEnEx. After receiving the bids, a verification and validation process is performed [84,85]. Afterwards, a binary (generation and demand) auction algorithm is performed and a clearing price is determined for every hour. The resulting market clearing price (MCP) is calculated based on the financial settlement of the market. The objective of the DAM auction mechanism that is performed via EUPHEMIA is the maximization of the social welfare of the coupled European DAMs, namely the maximization of the sum of surpluses D A M _ S of sell and buy orders included in the shared orders plus the congestion rent D A M _ C R that corresponds to the difference between two neighbouring bidding zones connected through an interconnection. The procedure of the adopted auction algorithm can be described as given in Equations (1)–(3). The DAM problem constraints include the energy balance Equation (3) which states that the sum of accepted sell order quantities equals the sum of accepted buy order quantities, and any allocation constraints among the bidding zones in the coupling region [55,91].
m a x p , i ( D A M _ S ( p , i ) + D A M _ C R ( i 1 , i 2 ) )
m a x p , i ( | D A M _ M C P ( i ) P r ( p , i ) E ( o ) | + + | D A M _ M C P ( i 1 ) D A M _ M C P ( i 2 ) | | E i 1 , i 2 | )
E o s e l l = E o b u y
where D A M _ M C P ( i ) represents the MCP of the DAM of the bidding zone i, P r ( p , i ) is the price of the relative accepted sell or buy order, E o is the accepted energy quantity of the relative accepted sell or buy order, and E i 1 , i 2 stands for the exchanged energy quantity transferred from the bidding zone with the lower MCP i 1 to the bidding zone with the higher MCP i 2 . Finally, E o s e l l and E o b u y represent the quantities of the accepted sell and buy orders, respectively.
The DAM results include the MCP for each market time unit of the delivery day, the net delivery position of each bidding zone, and the acceptance status and ratio (in case of block orders) of the submitted orders. The DAM results are then interfaced with the IDM, via the exchange of the necessary information. The latter involve (i) the market schedules, i.e., the energy schedule resulting from the DAM by taking into account the accepted orders of the generating units, RES portfolios, load portfolios, pumping units, RES feed-in-tariff (FiT) portfolios, rooftop photovoltaics, and the virtual balancing entity of the small connected system of Crete, and (ii) the scheduled imports and exports. The quantities of the accepted sell and buy orders are reported as physical delivery nominations and physical off-take nominations [91]. Clearing is performed by EnExClear and occurs based on the DAM results. The clearing price for every market time unit is settled when the demand and supply curves aggregated and intersected. Demand is covered for 24 h, 7 days per week [68,69]. NEMOs apply harmonized limits on maximum and minimum clearing prices for the DAM that occur from EUPHEMIA. In particular, based on ACER Decision 04/2017, the harmonized maximum MCP for the DAM is set at +4000 EUR/MWh and the corresponding minimum MCP is set at −500 EUR/MWh [92]. The harmonized prices take also into account the maximum value of lost load (VoLL) [76].

4.3. Intra-Day Market in Greece

The IDM allows participants to correct their position as we move towards real-time, especially in cases of changes in the demand or interruption of a power plant, and submit more accurate short-term forecasts of RES. The Greek IDM enables its participants to submit sell and buy orders on the day of physical delivery, after the expiry of the DAM deadline, and by taking into consideration the energy quantities of the FM electricity products, the DAM results, and the BM limitations [9,85,93]. The design of the Greek IDM is adapted to implement the pan-European intra-day trading [9,85,93]. The implementation of the Greek IDM is performed by HEnEx and is separated in two phases [9,85]. In the first phase, auction sessions are implemented, while during the second phase, continuous trading occurs both internally and at the borders. Until 21 September 2021, the Greek IDM performed three local intra-day auctions (LIDAs). The Greek IDM market was not yet coupled with neighbouring markets in intra-day terms, the cross-border capacity was not recalculated after DAM, and thus it was not offered to market participants for trading. A solution has been provided with the coupling of the Greek IDM with the Italian IDM via the implementation of complementary regional intra-day auctions (CRIDAs) at first and the XBID solution afterwards.
In the context of CRIDAs, the admitted products for trading are contracts with the obligation of physical delivery. The time unit of the CRIDAs equals to one hour [26]. The type of orders in the framework of the three CRIDAs is mainly hourly hybrid orders. During the three CRIDAs, participants submit buy or sell orders. The first CRIDA (CRIDA 1) gate opening occurs at 13:00 CET until the gate closure time at 15:00 CET on the day before the delivery and is executed for all the IDM time units. The second CRIDA (CRIDA 2) is again executed for all the IDM time units, with the gate opening time set at 15:30 CET and the gate closure time at 22:00 CET on the day before the delivery. In a similar manner, the third CRIDA (CRIDA 3) gate opening time is at 22:30 CET on the day before the delivery and the gate closure time is at 10:00 CET on the delivery day, while it is executed only for the second half of the IDM time units; see Figure 6. During the execution of the CRIDAs and until the publication of the results, the order matching between the coupled borders included in CRIDAs is paused [55] and all orders in both CRIDAs are verified and validated. The results of the CRIDAs include (i) the acceptance status of each order, (ii) a single net position for each bidding zone and market time unit, and (iii) the CRIDA clearing price per bidding zone and per market time unit. The aforementioned results are forwarded to EnExClear [48,55].
Each CRIDA constitutes an optimization problem that aims at the maximization of the total social welfare of all markets included in the regional coupling, namely the maximization of the sum of the surpluses I D M _ S of all participants that submit sell and buy orders in the regional coupling plus the congestion rent I D M _ C R that corresponds to the difference between two neighbouring bidding zones connected through an interconnection or a cross-zonal corridor [55]. In an algorithmic form, the above-mentioned maximization problem can be described as provided in Equations (4) and (5). The problem constraints include the energy balance equation, Equation (3), and any allocation constraints among the bidding zones in the coupling region [55]. Therefore, the CRIDA problem constitutes a mixed-integer quadratic programming model, namely a model with continuous and binary variables, quadratic terms in the objective function, and linear constraints [55,94].
m a x p , i ( I D M _ S ( p , i ) + I D M _ C R ( i 1 , i 2 ) )
m a x p , i ( | I D M _ M C P ( i ) P r ( p , i ) E ( o ) | + | I D M _ M C P ( i 1 ) I D M _ M C P ( i 2 ) | | E i 1 , i 2 | )
where I D M _ M C P ( i ) represents the IDM MCP of the respective bidding zone i, P r ( p , i ) is the price of the relative accepted sell or buy order, E o is the accepted energy quantity of the relative accepted sell or buy order, and E i 1 , i 2 stands for the exchanged energy quantity transferred from the bidding zone with the lower MCP i 1 to the bidding zone with the higher MCP i 2 .
HEnEx also launched the continuous trading in the framework of XBID on 30 November 2022. During the continuous trading, participants submit buy and sell orders for all the IDM time units of the delivery day after the gate opening time at 15:00 CET until the gate closure time that occurs 60 min before each time unit. The latter are considered with 60 min granularity [55]. It is worth mentioning that 15 min products will be introduced within the Greek IDM during 2023. In addition, the supported types of orders include regular orders that represent buy or sell orders with a specific quantity and price, linked orders that represent group of orders, block orders, and iceberg orders that are regular orders that are only visible with part of the total quantity in the market while their full quantity is exposed to the market for matching. The continuous trading solution immediately returns the information on the matched orders, such as quantity and trading price [55]. In the IDM matching algorithm, the available order execution restrictions involve none, fill or kill, immediate or cancel and all or nothing, while the available order validity restrictions are good for session and good till date [93].
The IDM in Greece includes the Coordinated Auction Office in South East Europe (SEE CAO) that was founded in 2014 by TSOs from the region of South East Europe (HOPS, NOSBiH, CGES, OST, KOSTT, IPTO, TEIAS, and additionally, MEPSO). The SEE CAO main objective is to perform the explicit allocation of cross-border transmission capacity in both directions between Control Areas of Participating TSOs, through NTC-based Auction Processes in accordance with the requirements of Regulation (EC) 714/2009 for accessing to the network for cross border exchanges in electricity. Within such an approach, SEE CAO performs an allocation of long-term and daily PTRs on 10 bidding zone borders by applying harmonised allocation rules, in line with EU Regulation 2016/1719 (FCA GL) and complying with EU Regulations 543/2013 (EMFIP) and 1227/2011 (REMIT). SEE CAO has commenced with yearly auctions for 2015 and up to this date is performing capacity allocation by conduction of coordinated explicit auctions using NTC-based method, on the entire flow from Croatia to Turkey.
Before clearing, the information obtained within the IDM is transferred to the BM. The latter includes (i) the scheduled imports and exports on each interconnection to IPTO in order to calculate any cross-zonal capacity that can be utilized for cross-border balancing processes, (ii) the final market schedules of each one of the entities, such as generating units, RES portfolios, load portfolios, pumping units, RES FiT portfolios, as well as rooftop photovoltaics, and (iii) the virtual balancing entity of the small connected system of Crete, and (iv) the quantities of the accepted sell and buy orders as physical delivery nominations and physical off-take nominations [55,84,93]. The clearing of the IDM is performed by the EnExClear via the calculation of the credits and debits for each participant. For the CRIDAs, the necessary information involves the MCP per bidding zone, and the accepted energy quantity of the sell and buy orders of each participant in each market. For the continuous intra-day trading, the essential information for clearing is considered to include the price, and the quantity of the trade. In the initial phase before the implementation of continuous trading, the harmonized maximum and minimum clearing prices were adopted to converge to the ones of the DAM and therefore were selected as +3000 EUR/MWh and −500 EUR/MWh, respectively. On 22 September 2021, three CRIDAs were performed successfully on the Greece–Italy interconnection, thus fulfilling a new milestone after the DAM coupling. The complete coupling of the Greek IDM was achieved with the country’s entry into the XBID trading with Italy and Bulgaria on the 30th of November 2022. According to RAE Decision 440/2019, in the CRIDAs and the XBID phase, the technical price limits are aligned with the ones to be adopted in the SIDC and therefore are set at +9.999 EUR/MWh and −9.999 EUR/MWh, respectively [92].

4.4. Balancing Market in Greece

The last part of the integrated electricity market in Greece is the BM, which is critical for the safety of the system as it has not only economic but mainly physical effects. The BM in Greece operates through the year for each calendar day, and is based on a unit based, centralized dispatching model [94,95]. In the context of the BM, BSPs submit bids to the market per unit, per load zone, and per interconnection border, while IPTO executes an optimization algorithm in order to issue corresponding orders to each production unit selected for the provision of each service [94,95,96]. The BM in Greece is implemented through three different stages, namely the balancing capacity market, the balancing energy market, and the imbalances settlement market [64,65]. Currently, the BM in Greece has a small market share but will increase as the penetration of RES increases [26].
The balancing capacity market is defined as the market in which capacity is offered to cover the reserve requirements of the system. Balancing capacity offers represent the intention of the BSPs to provide reserves for the balancing capacity products [79]. The BSPs that are able to provide capacity include dispatchable generating units. In the framework of the balancing capacity market, IPTO determines via an optimization mechanism, the so-called Integrated Scheduling Programming (ISP), the amount of required reserves for each balancing capacity product that is deemed necessary for each dispatch period. Participants submit bids for these products, provided they have the technical capacity to provide them [79,80]. The ISP algorithm takes as input the generation schedule of the DAM as modified by the IDM, and considers in detail the technical plant operation constraints, the reserve requirements, the network constraints, the load, and RES forecasts. The algorithm output is a commitment schedule that meets the calculated imbalances and the reserve requirements, and allocates the balancing capacity to the BSPs [26,96]. The aforementioned procedure ensures that the system has sufficient capacity to provide balancing services in accordance with the IPTO’s forecasted values.
Participation in the balancing capacity market takes place prior to real-time. The dispatch day starts at 00:00 CET of the delivery day and ends at 00:00 CET of the next day. The duration of the dispatch period is set at 30-min periods [94,95]. The ISP is carried out three times on a schedule, i.e., once immediately after the execution of CRIDA1 on 15:45 CET on the day before the delivery, covering all dispatch periods of the delivery date (ISP1), one on 23:00 CET of the day before the delivery, covering all dispatch periods of the delivery day (ISP2), and one on 11:00 CET, covering the second half of the dispatch periods of the delivery day (ISP3) [96]; see Figure 6. The results of the ISP clearings are not binding for its first execution (ISP1), but are binding for the first 24 dispatch periods of the delivery day for its second execution (ISP2) and for the last 24 dispatch periods of the delivery day for its third execution (ISP3). IPTO may also execute the ISP on demand when there are significant changes during the operation of the system (ad-hoc ISP), such as changes in the forecasted load of RES units, resources availability, etc. The results of the ad-hoc ISP are binding for the dispatch periods to which they refer. Before the clearing of the first ISP, participants submit bids both for balancing capacity and for balancing energy [95,96]. The balancing capacity quantities allocated to each participant are committed and compensated in the framework of the balancing capacity market, regardless whether in real-time the BSPs provide balancing energy or not [96]. Participants are compensated for the balancing capacity quantity they offer from the market clearing on a pay-as-bid basis every 30 min and are required to commit the respective capacity in order to maintain a safe margin for system balancing in real-time.
The market design has prescribed the three key balancing capacity products, (i) upward and downward FCR, (ii) upward and downward mFRR, and (iii) upward and downward aFRR [95]. The upward and downward balancing capacity R R Q ( t ) u p and R R Q ( t ) d n , in MWh, supplied for the different R R = { F C R , m F R R , a F R R } products by a BSP, for an imbalance settlement period t are calculated by Equations (6) and (7).
R R Q ( t ) u p = a s R R C ( a s , t ) u p T ( t ) R R , u p
R R Q ( t ) d n = a s R R C ( a s , t ) d n T ( t ) R R , d n
where R R Q ( a s , t ) u p stands for the segment a s in MW of the upward balancing capacity offer for the different RRs validated for a BSP, for a dispatch period which includes an imbalance settlement period t, on the basis of the last ISP execution, whose solution timeframe shall include that specific imbalance settlement period t, and T ( t ) R R , u p stands for the percentage of a time period within an imbalance settlement period t when the BSP was available for the provision of upward R R s in real time, R R Q ( a s , t ) d n stands for the segment a s in MW of the downward balancing capacity offer for the different R R s validated for a BSP, for a dispatch period which includes an imbalance settlement period t, on the basis of the last ISP execution, whose solution timeframe shall include that specific imbalance settlement period t, and T ( t ) R R , d n stands for the percentage of a time period within an imbalance settlement period t when the BSP was available for the provision of downward RRs in real time.
The volumes of FCR, aFRR, and mFRR reserves are awarded to the market participants through the ISP, based on the requirements published by IPTO on a 30-min granularity [26]. The maximum limit for these prices was +3.000 EUR/MWh, while after the launch of CRIDAs, the prices changed and their maximum and minimum limits are set at +9.999 EUR/MWh and −9.999 EUR/MWh, respectively [92]. The total remuneration of all BSPs for the balancing capacity supplied for upward and downward FCR, aFRR, and mFRR during an imbalance settlement period t, is calculated as given in Equation (8).
B A L C A P ( t ) = R R B S P s R R C ( t ) u p + R R B S P s R R C ( t ) d n
where
R R C ( t ) u p = 1 4 R R a s ( R R Q ( a s , t ) u p O P ( t ) R R , u p ) T ( t ) R R , u p
R R C ( t ) d n = 1 4 R R a s ( R R Q ( a s , t ) d n O P ( t ) R R , d n ) T ( t ) R R , d n
and
R R Q ( a s , t ) u p = 1 4 R R a s R R Q ( a s , t ) u p T ( t ) R R , u p
R R Q ( a s , t ) d n = 1 4 R R a s R R Q ( a s , t ) d n T ( t ) R R , d n
In the equations above, R R C ( t ) u p represents the remuneration in EUR of the balancing capacity supplied by a BSP for upwards R R s , namely F C R ( t ) u p , m F R R ( t ) u p , and a F R R ( t ) u p in an imbalance settlement period t, and O P ( t ) R R , u p is the price in EUR/MWh of a segment a s of the upward balancing capacity offer for the different R R products of a BSP that has been validated on the basis of the last execution of the ISP, whose solution timeframe shall include that specific imbalance settlement period t. In a similar manner, R R C ( t ) d n represents the remuneration in EUR of the balancing capacity supplied by a BSP for downward R R s , namely F C R ( t ) d n , m F R R ( t ) d n , and a F R R ( t ) d n in an imbalance settlement period t, and O P ( t ) R R , d n is the price in EUR/MWh of a segment a s of the downward balancing capacity offer for the different R R products of a BSP that has been validated on the basis of the last execution of the ISP, whose solution timeframe shall include that specific imbalance settlement period t.
The balancing energy market is defined as a market where participants offer energy, which is used to maintain the system frequency within a predetermined range, and observe the electricity exchange with the neighbouring countries [95]. In the context of the balancing energy market, BSPs are required to submit bids to the market for the necessary balancing energy products [96]. The balancing energy market, after considering the market schedules and the state of IPTO in real-time, balances energy supply and demand via the activation of a proper amount of energy by the respective BSPs [95]; see Figure 6. The involved products are mFRR and aFRR, based on an automatic load-frequency control mechanism, which aims at compensating the frequency control error to zero and protect the state operation of the system [95]. Close to real time, IPTO based on the conducted forecasts activates the necessary quantities of upward or downward mFRR that correspond to the orders with the lowest priced bids. In real time, the dispatchable units that can provide aFRR, receive automatic orders for activation that result from the Automatic General Control (AGC) function [26]. The activation of balancing energy products by taking into account the safe system operation, implies changes in electricity generation, a procedure called redispatching. Generators that provide redispatch receive remuneration at the market marginal price for the activated balancing energy needed to meet mFRR requirements, while the activated aFRR products are remunerated on a pay-as-bid basis [26]. The marginal price is defined as the higher or lower accepted bid in the mFRR for the upward or downward mFRR balancing energy, respectively. In case of the aFRR activation, remuneration is provided every 15 min and the BSPs receive at least the price of the mFRR balancing energy or the price of the offer of the last accepted bid step if higher. Particularly, IPTO converts the 30-min energy bids of the ISP into 15-min bids, while participants may submit only improved bids in relation to the bids submitted at the first ISP, i.e., bids with a lower price in the case of production unit or bids with a higher price in the case of load [96]. The last available 15-min energy bids received participate in the real-time balancing energy market, which is obtained via the Real-time Balancing Market (RTBM) algorithm [26].
The debits or credits A B E C ( a s , t ) m F R R , u p and A B E ( t ) m F R R , d n for the activated upward and downward balancing energy for mFRR for each BSP and an imbalance settlement period t are given in Equations (9) and (10).
A B E C ( a s , t ) m F R R , u p = A B E ( t ) m F R R , u p B E P ( i , t ) m F R R , u p
A B E C ( a s , t ) m F R R , d n = A B E ( t ) m F R R , d n B E P ( i , t ) m F R R , d n
where A B E ( t ) m F R R , u p and A B E ( t ) m F R R , d n represent the activated upward and downward balancing energy for mFRR, and B E P ( i , t ) m F R R , u p and B E P ( i , t ) m F R R , d n is the price for the upward and downward balancing energy for mFRR, respectively, for the bidding zone i where the BSP belongs.
Similarly, the debits or credits A B E C ( a s , t ) a F R R , u p for the activated upward and downward balancing energy for aFRR for each BSP and an imbalance settlement period t are calculated by Equations (11) and (12).
A B E C ( a s , t ) a F R R , u p = [ A B E ( t ) m a x ( B E P ( i , t ) , O P B E ( t ) ) ] a F R R , u p
A B E C ( a s , t ) a F R R , d n = [ A B E ( t ) m i n ( B E P ( i , t ) , O P B E ( t ) ) ] a F R R , d n
where A B E ( t ) a F R R , u p and A B E ( t ) a F R R , d n represent the activated upward and downward balancing energy for aFRR, B E P ( i , t ) a F R R , u p and B E P ( i , t ) a F R R , d n are the prices for the upward and downward balancing energy for aFRR, and O P B E ( t ) a F R R , u p and O P B E ( t ) a F R R , d n stand for the price of the upward and downward balancing energy offer for aFRR, respectively, for an imbalance settlement period t, and the bidding zone i where the BSP belongs.
Concerning the remuneration of the aforementioned products, from the launch of the BM on 1 November 2020 and until the continuous trading of SIDC, the maximum and minimum price limits for balancing energy were defined as +4.240 EUR/MWh and −4.240 EUR/MWh, respectively, and the maximum and minimum price limits for balancing capacity were defined as +3.000 EUR/MWh and 0 EUR/MWh, respectively [92]. From the implementation of Continuous Intra-Day Trading (XBID) onwards the maximum and minimum price limits for balancing capacity are +9.999 EUR/MWh and 0 EUR/MWh, respectively [76]. From the implementation of CRIDAs and until inclusion of the IPTO in one of the European platforms, MARI or PICASSO the maximum and minimum price limits for balancing energy was changed to +9.999 EUR/MWh and −9.999 EUR/MWh, respectively [92].
Currently IPTO moves towards reforming the existing BM via its participation in the two European balancing platforms, namely MARI and PICASSO [80,81]. Both platforms aim to enhance the local mFRR and aFRR balancing characteristics to be compliant with the standard products defined at ACER Decision 01/2020. Those platforms are expected to go-live in Greece in 2022. Especially for the aFRR, the full activation time has to be amended from 7.5 min to 5 min from December 2024, while the minimum bid size for balancing is 1 MW, equal to the French TSO’s minimum bid size [32]. Finally, the inclusion of IPTO in one of the European platforms (MARI or PICASSO) and up to a maximum of 48 months from the deadline for the implementation of the European MARI and PICASSO platforms, as defined in Articles 20 and 21 of the EBGL, will change the maximum and minimum price limits to +15.000 EUR/MWh and −15.000 EUR/MWh, respectively [92]. Forty-eight months after the deadline for the implementation of the European MARI and PICASSO platforms the maximum and minimum price limits for the balancing energy will change to +99.999 EUR/MWh and −99.999 EUR/MWh, respectively [92].
The last part of the Greek BM includes, the imbalances settlement market, which takes place post real-time and aims at the compensation or charge of the energy arising from any imbalances of the participants in the BM from the last schedule of the market and/or the dispatch orders, represents the transparent calculation of any imbalanced quantities and their remuneration [96]. Bids accepted for non-balancing energy purposes, such as redispatching, voltage control, etc., are excluded from the imbalance price calculation. The imbalance settlement period is a period for which the imbalances of the BSPs, the balancing energy market, and the balancing capacity market are set. The imbalance settlement period has already been set to 15 min since 1 November 2020, while the imbalance price calculation is already in compliance with the ACER Decision 18/2020 [26].
The imbalance price, I P ( t ) , for an imbalance settlement period t is obtained as the weighted average price of the activated balancing energy in the predominant direction (upward or downward) for mFRR and aFRR for that imbalance settlement period t. The abovementioned weighted average price is given in Equation (13) [95]. The predominant direction is upward when the activated upward balancing energy for mFRR and aFRR for a specific imbalance settlement period t is greater than the activated downward balancing energy for mFRR and aFRR. Similarly, the downward predominant direction is defined.
I P ( t ) = B S P s A B E C ( t ) m F R R , p r e d _ d i r + B S P s A B E C ( t ) a F R R , p r e d _ d i r B S P s A B E ( t ) m F R R , p r e d _ d i r + B S P s A B E ( t ) a F R R , p r e d _ d i r
where A B E C ( t ) m F R R , p r e d _ d i r and A B E C ( t ) a F R R , p r e d _ d i r represents the debit or credit for the activated balancing energy for mFRR and aFRR, respectively, in the predominant direction, while A B E ( t ) m F R R , p r e d _ d i r and A B E ( t ) a F R R , p r e d _ d i r represents the debit or credit for the activated balancing energy for mFRR and aFRR, respectively, in the predominant direction, for a BSP and an imbalance settlement period t.
The imbalance amount I M B C ( t ) for an imbalance settlement period t and a BSP is defined as shown in Equation (14).
I M B C ( t ) = F I M B ( t ) I P ( t )
where F I M B ( t ) is the final imbalance quantity for a BSP and an imbalance settlement period t. It worth noting, that, in case of a negative imbalance, the corresponding BSP is required to pay that amount.

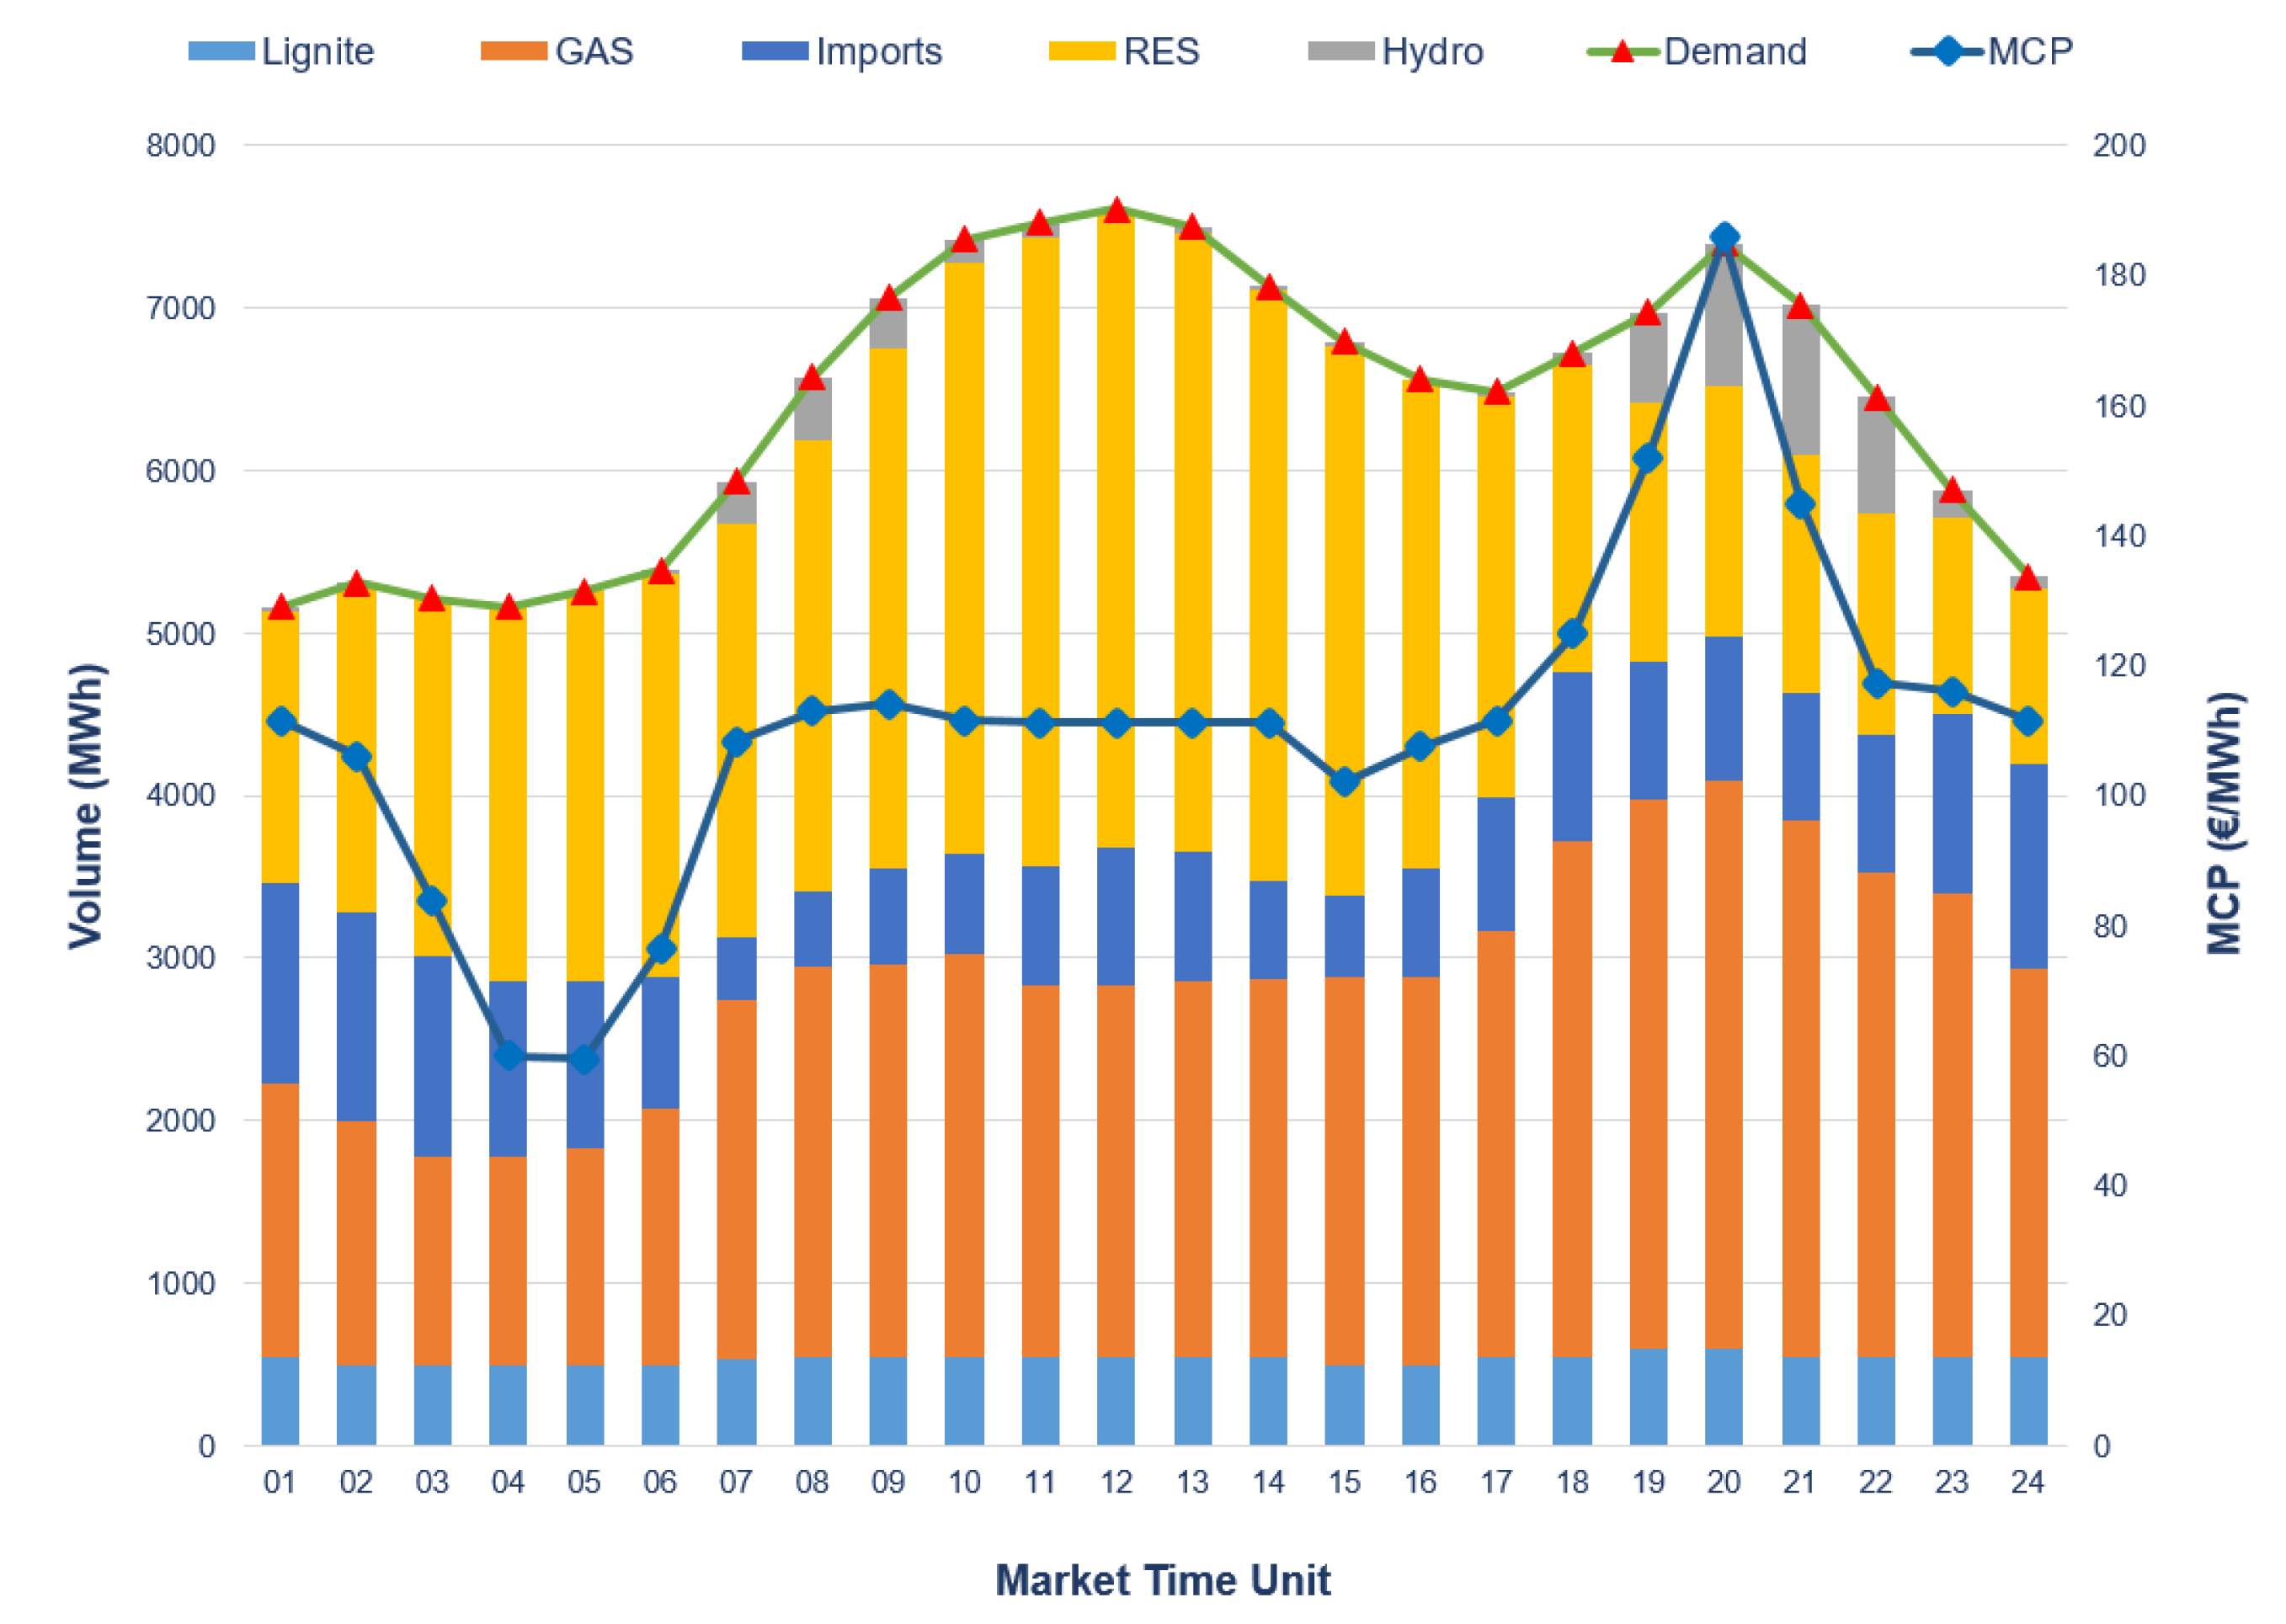
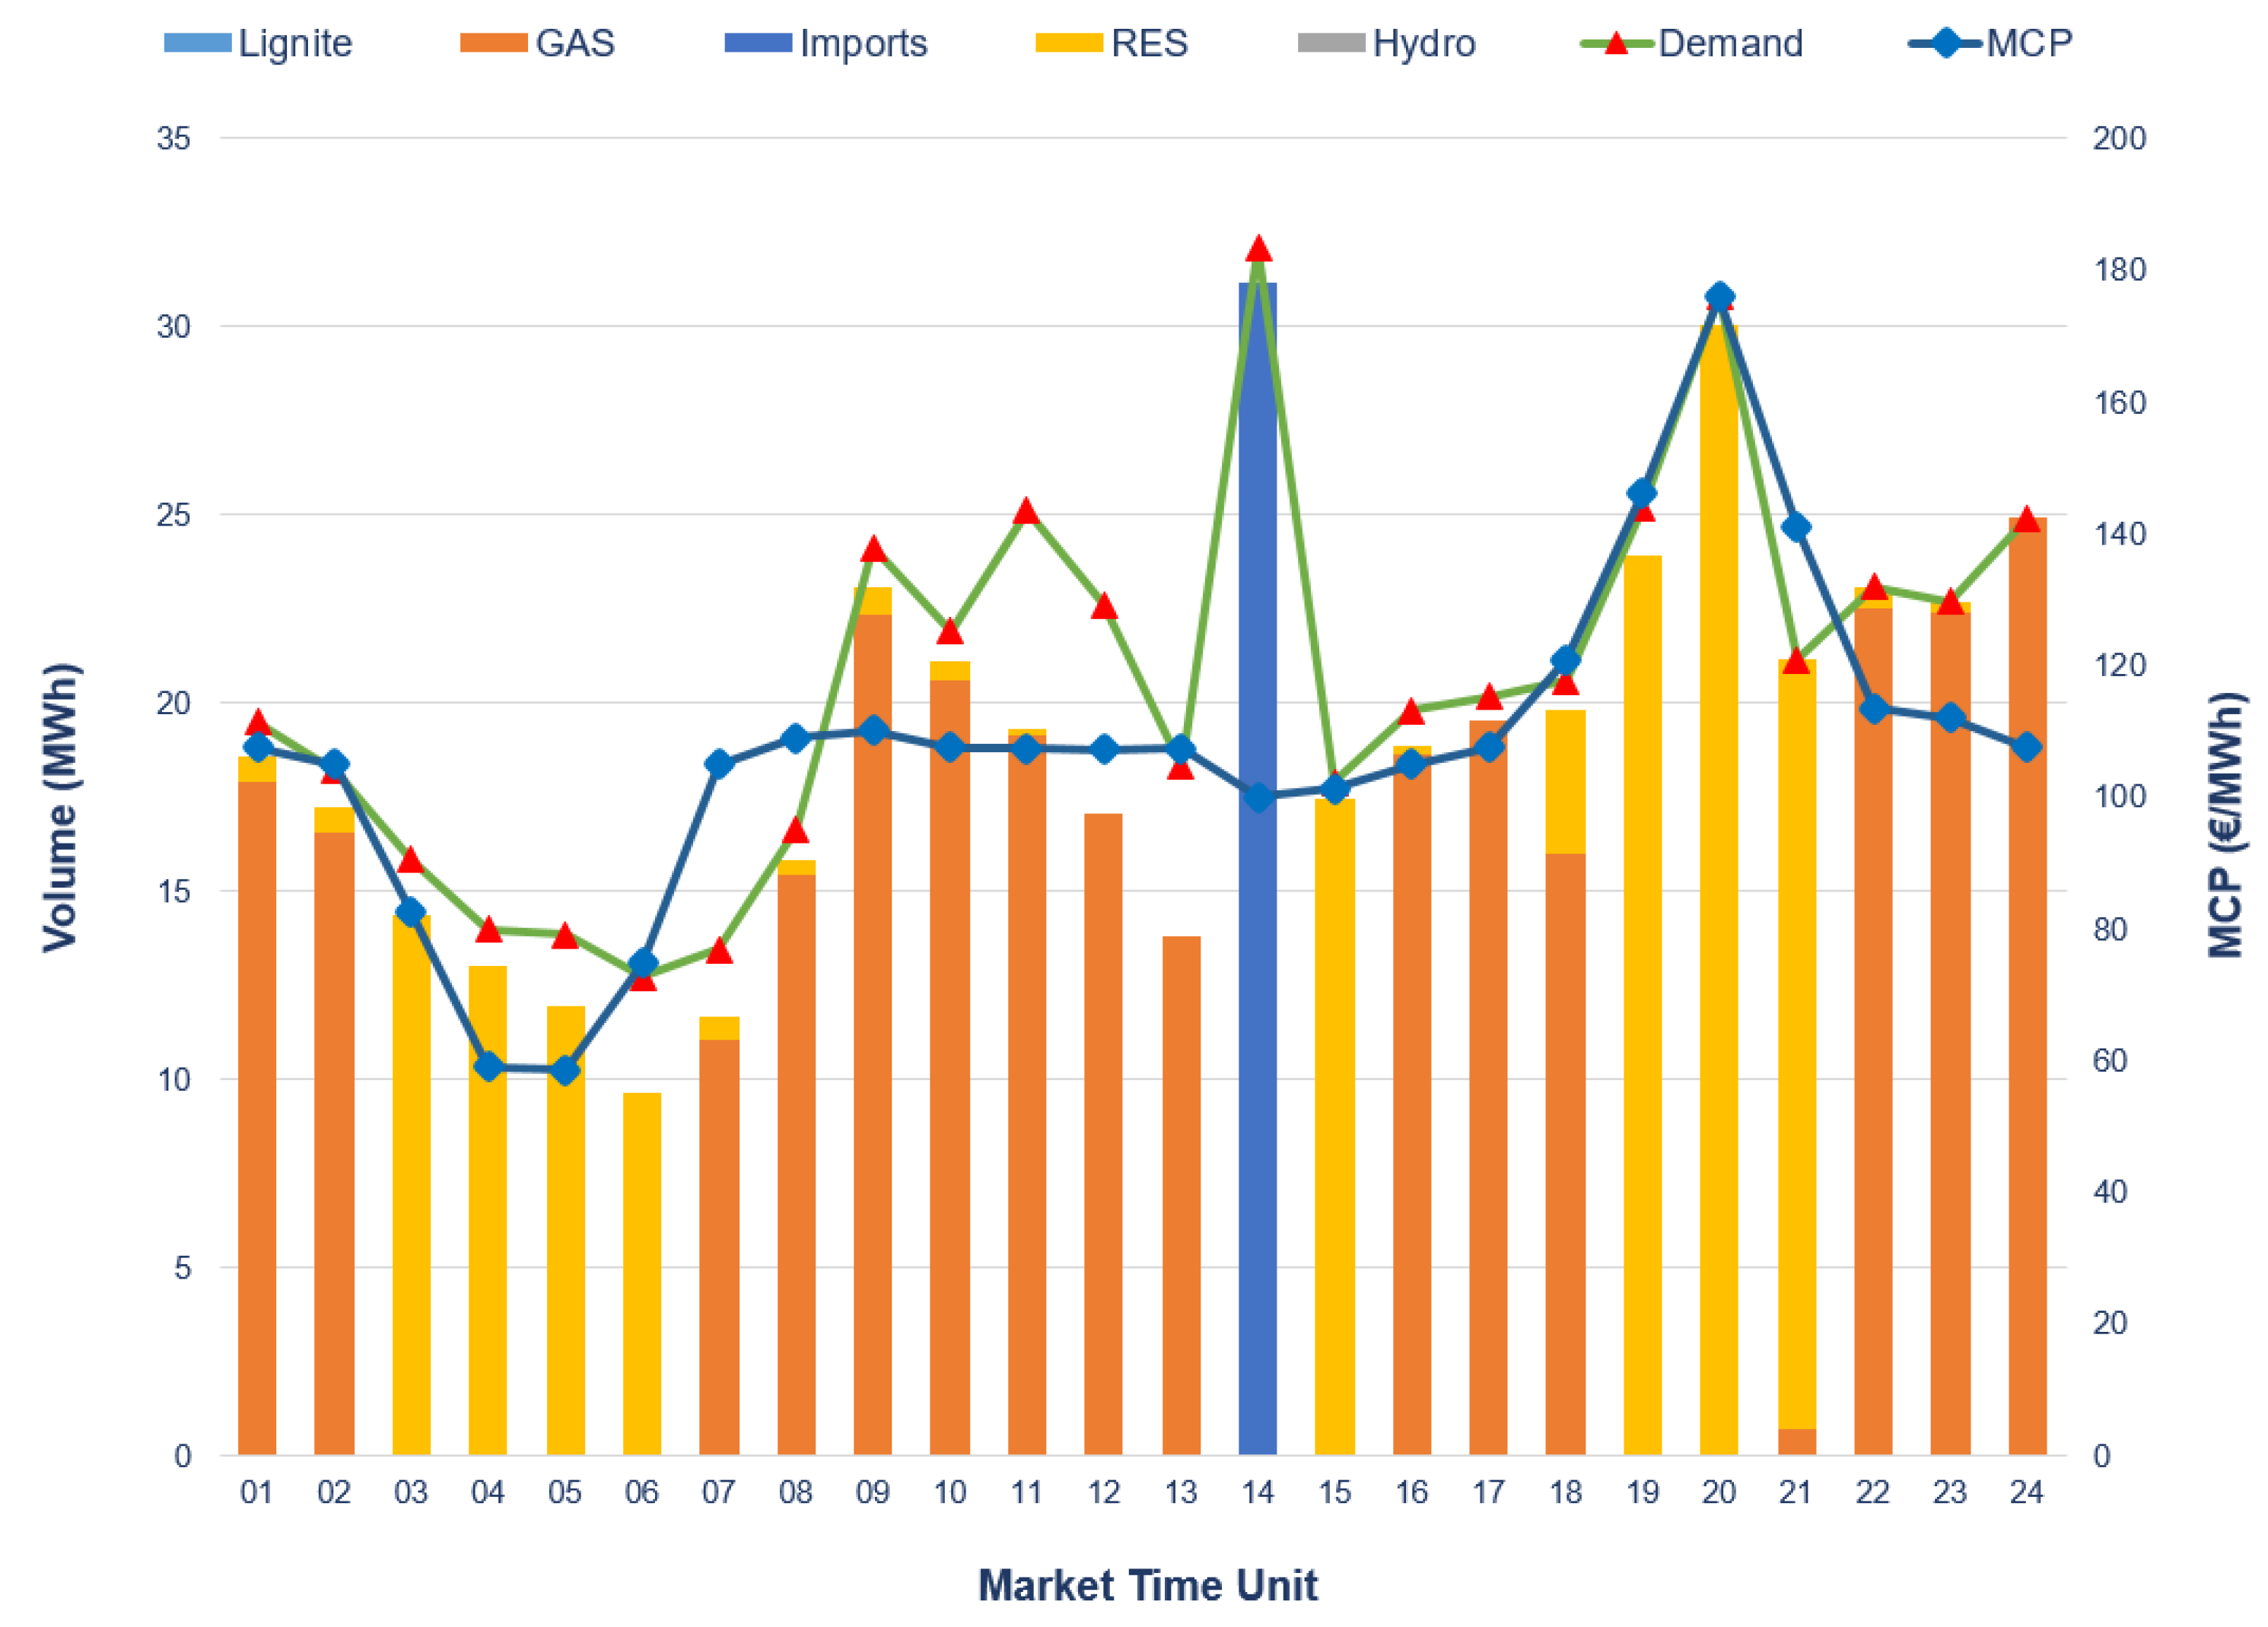
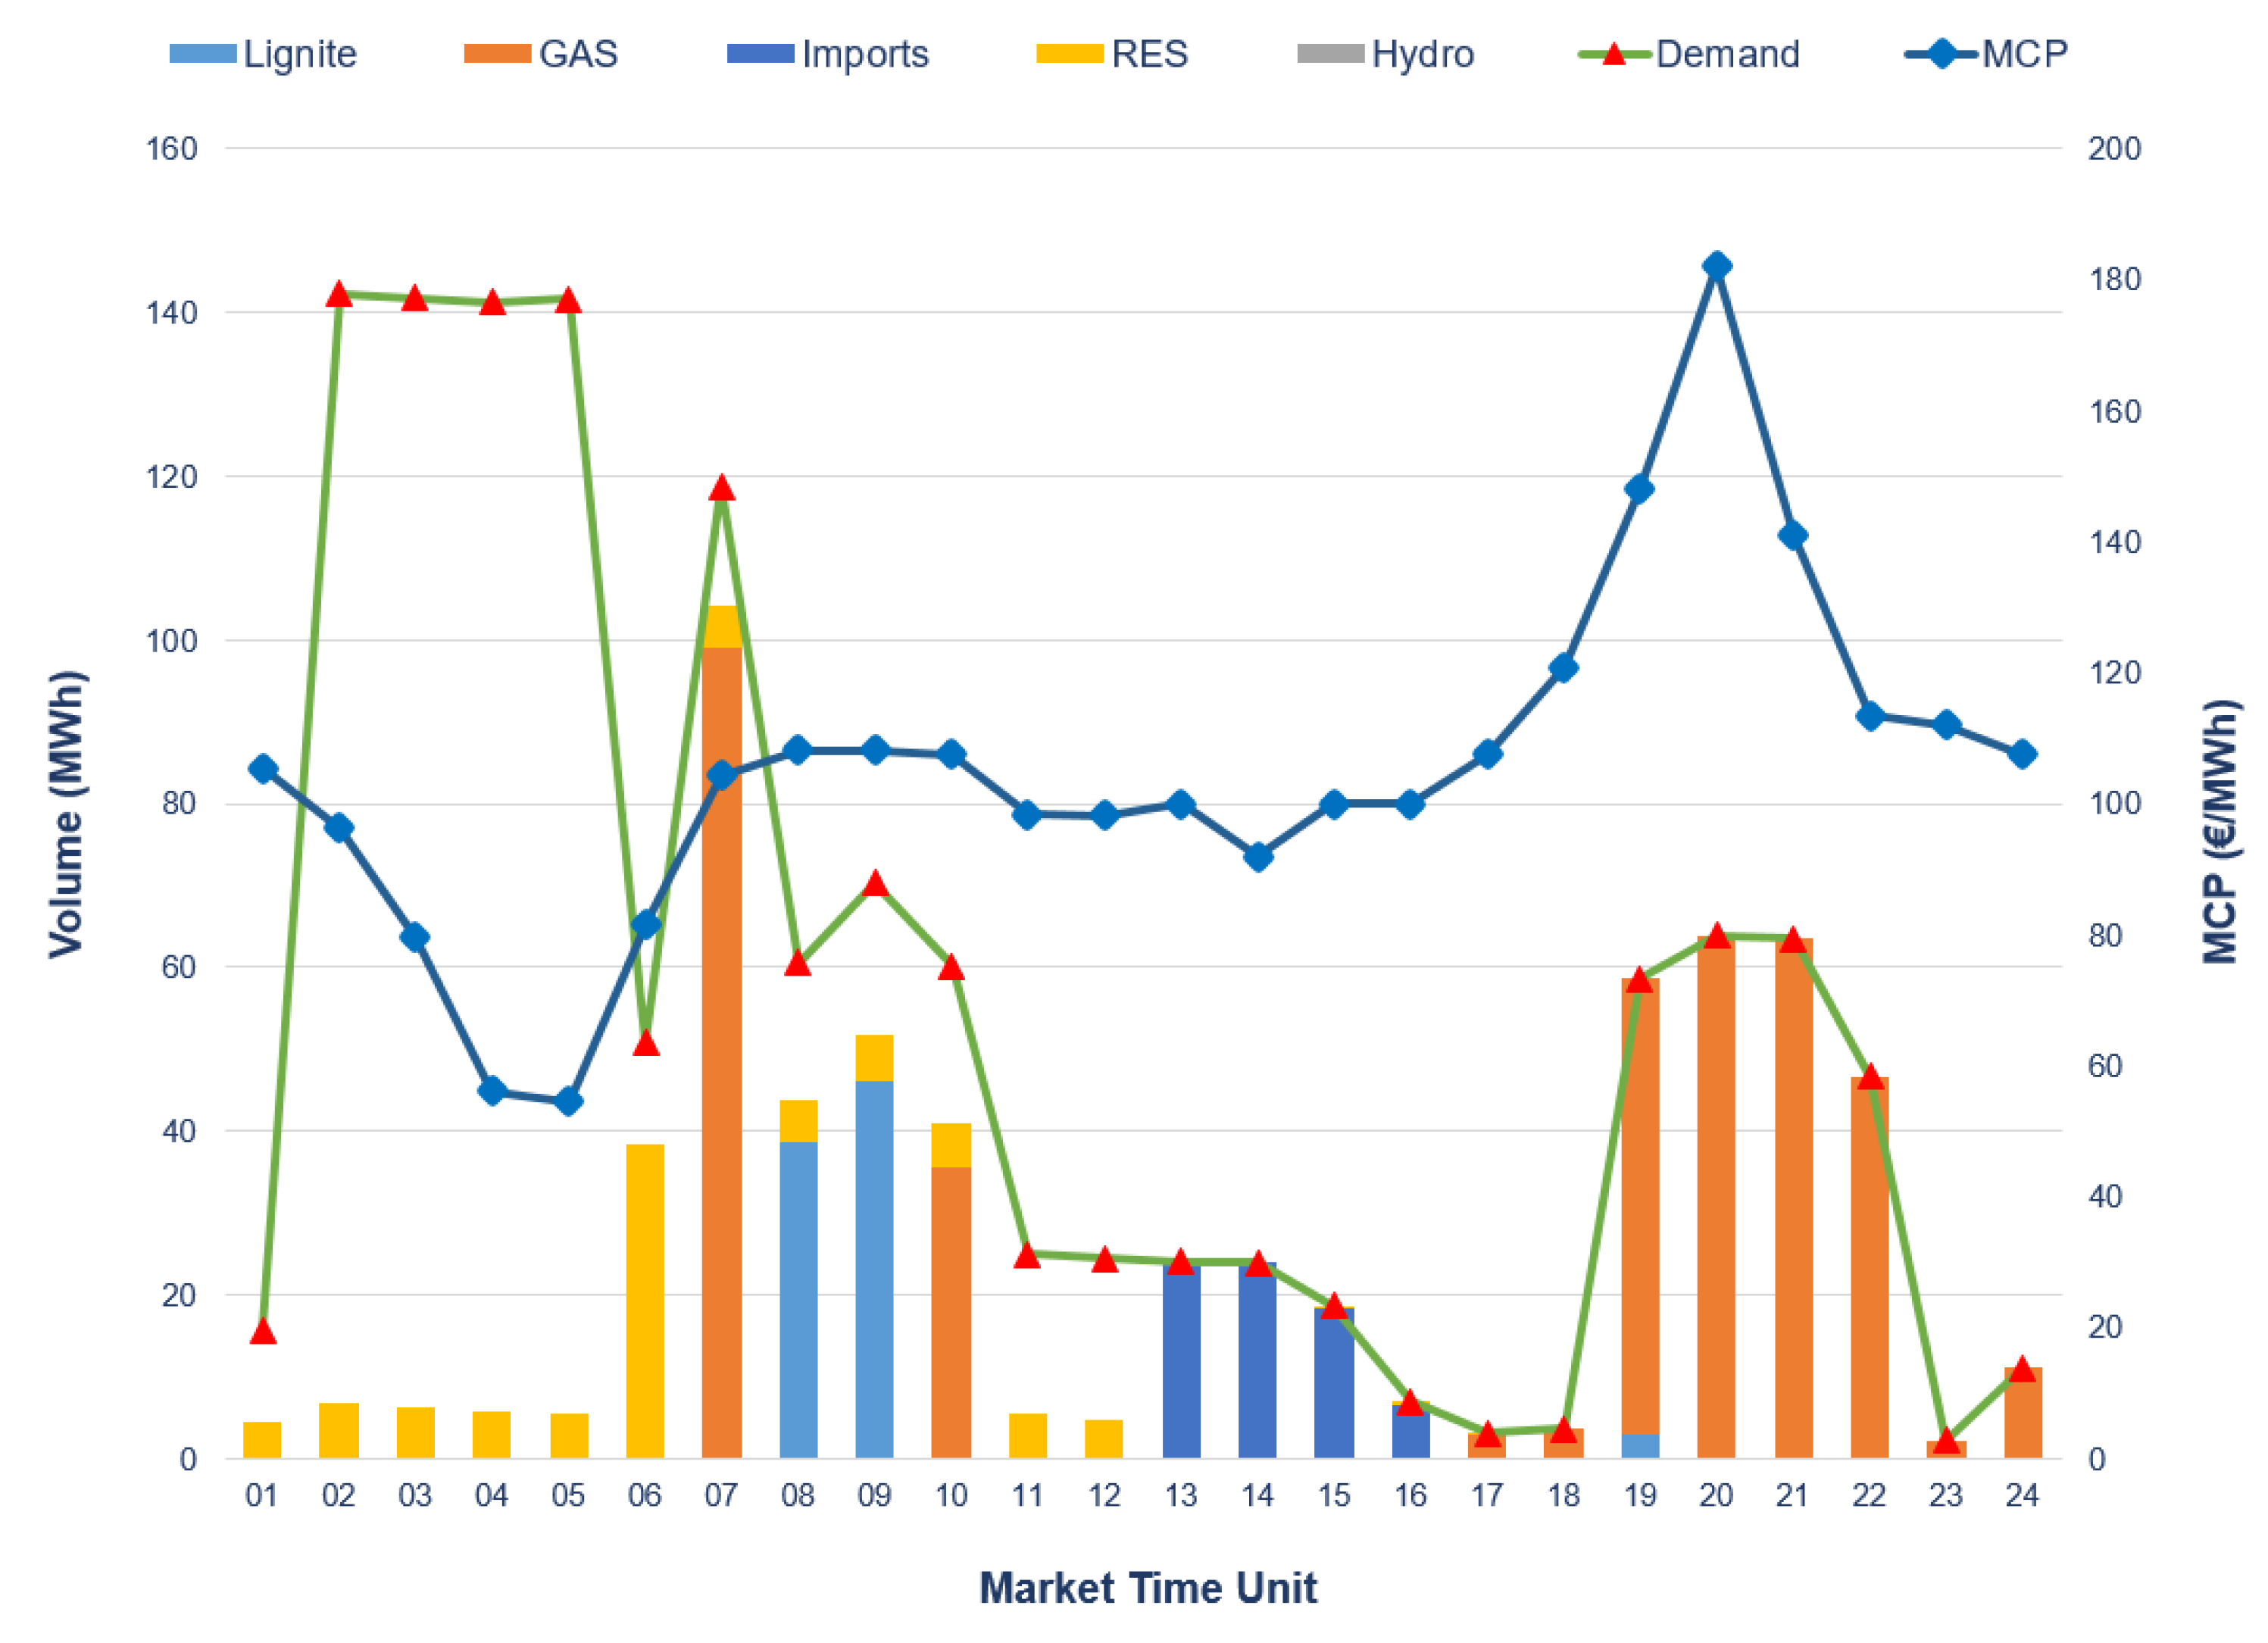
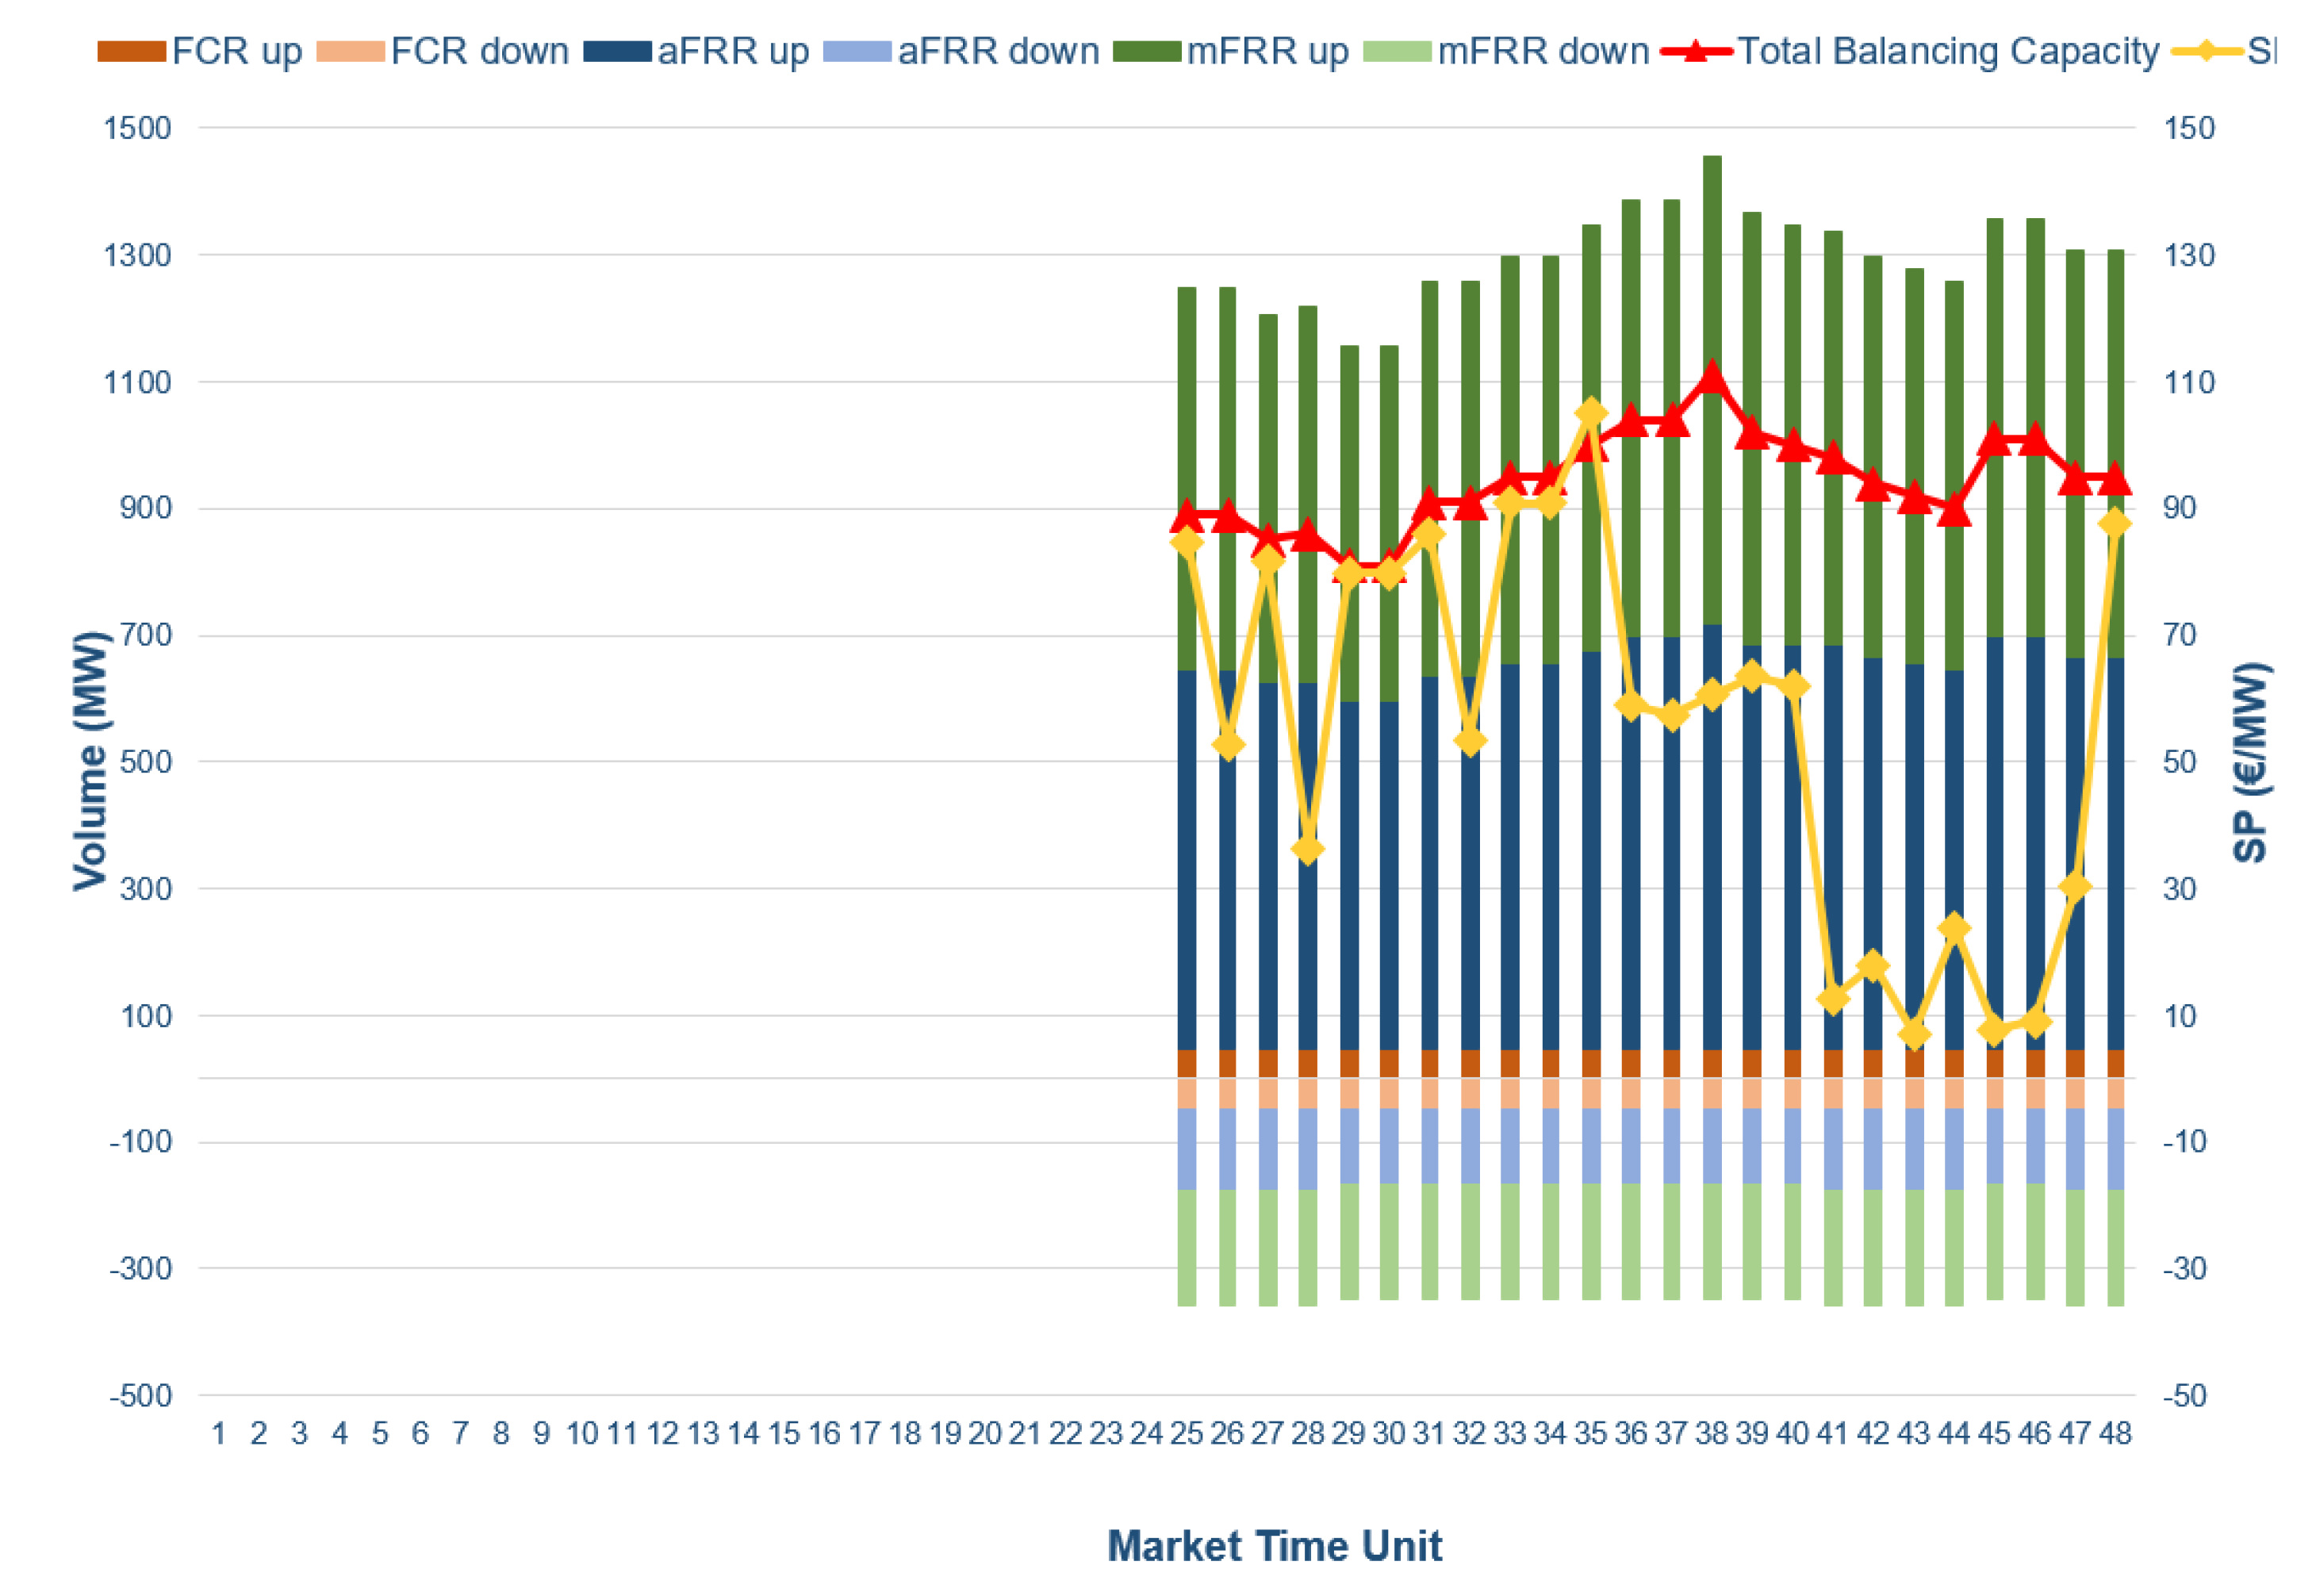
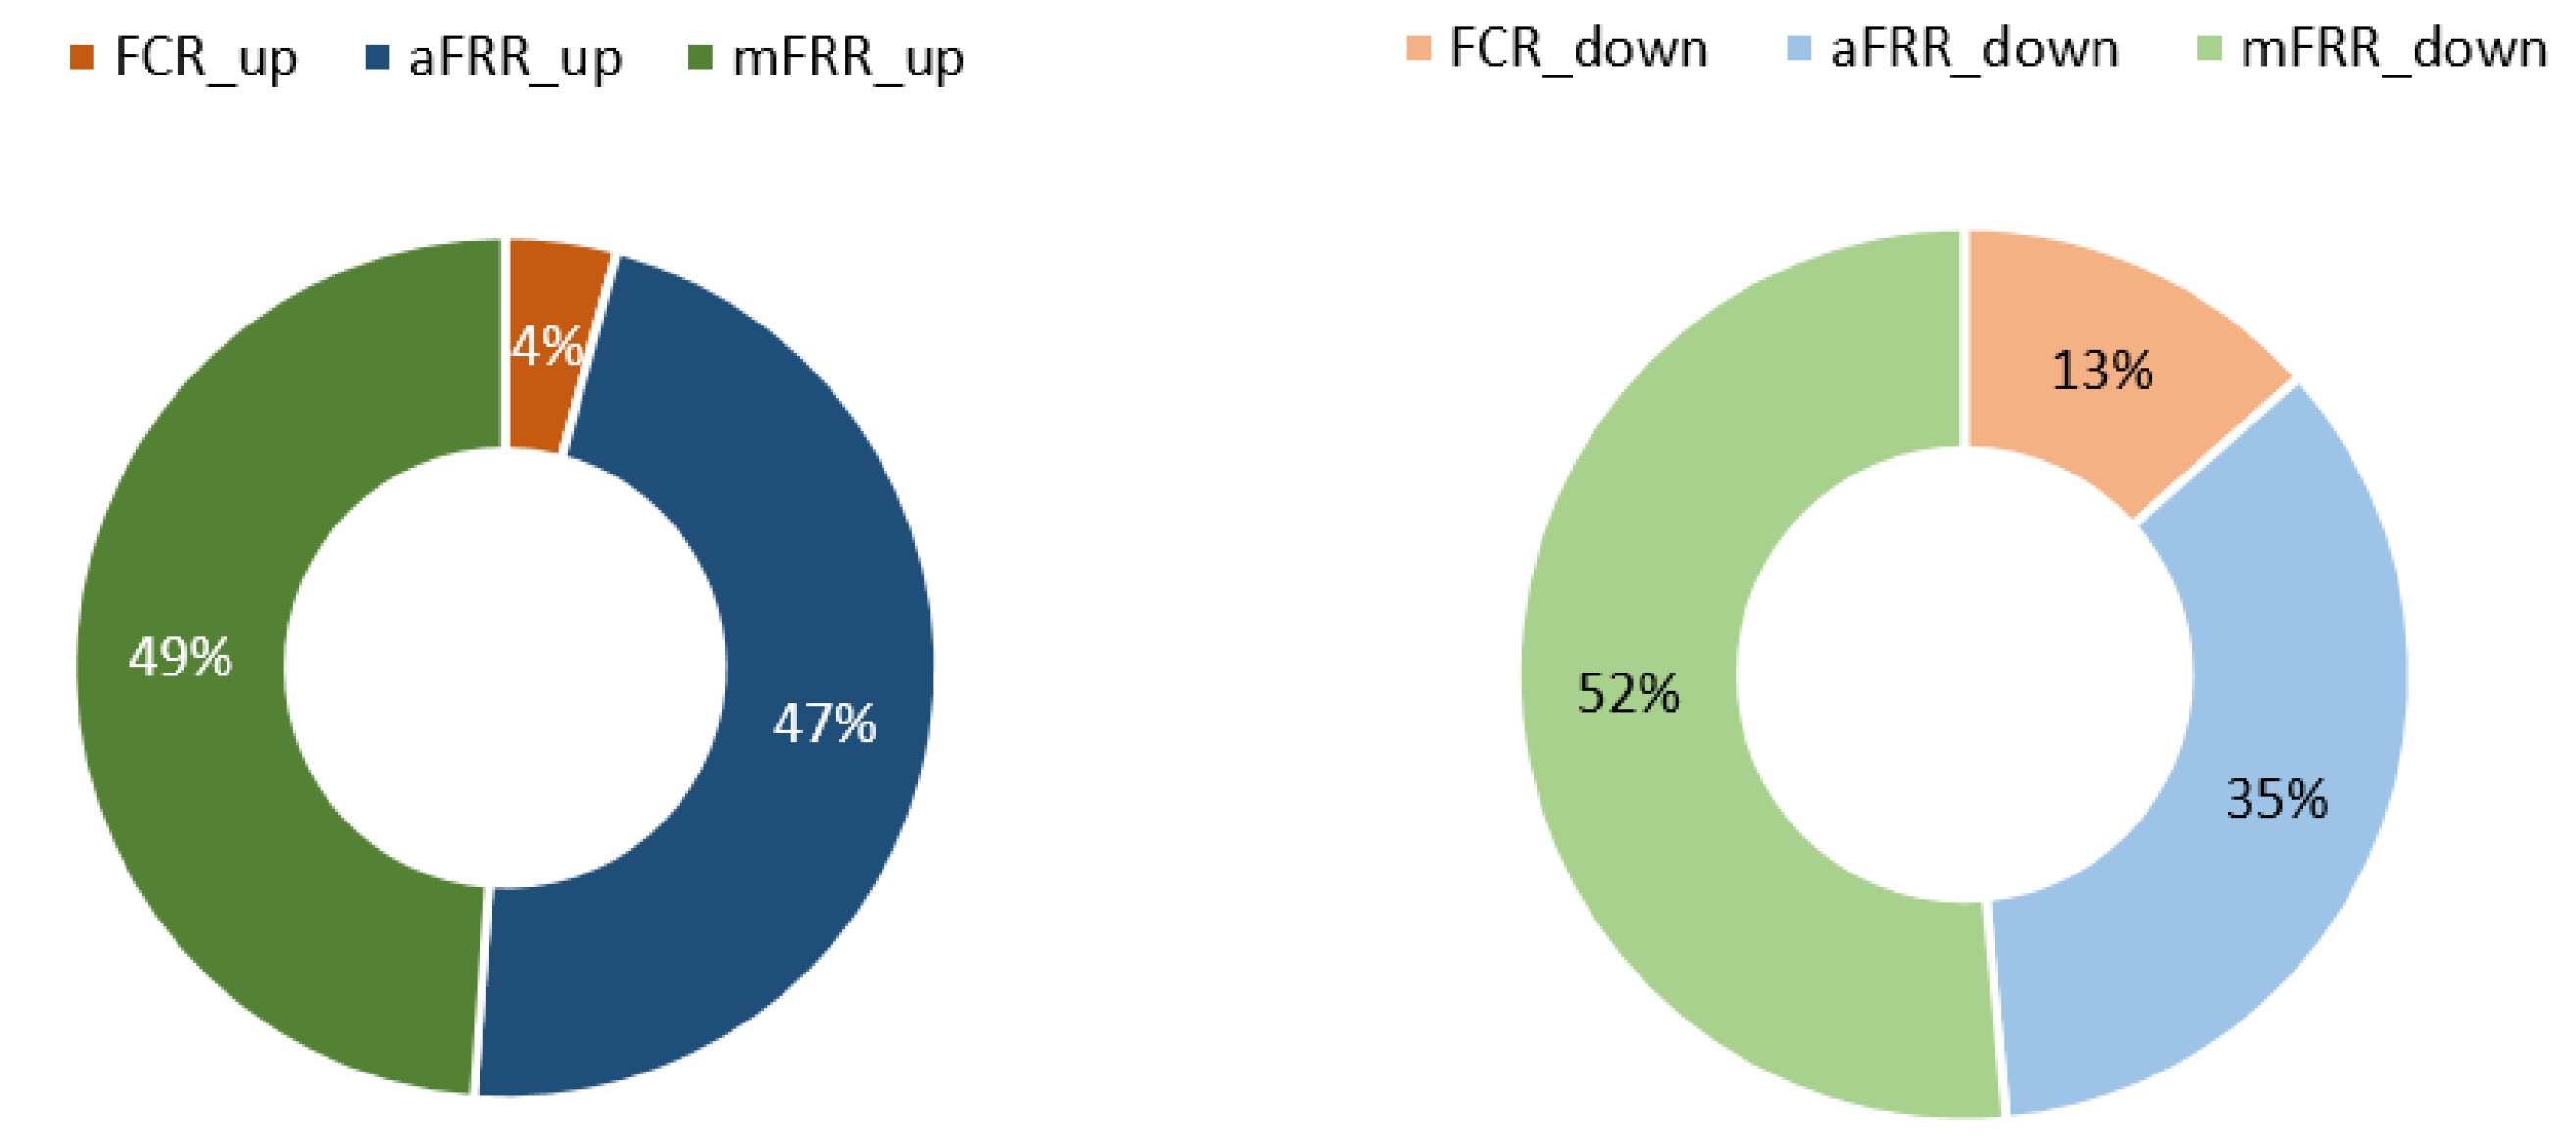
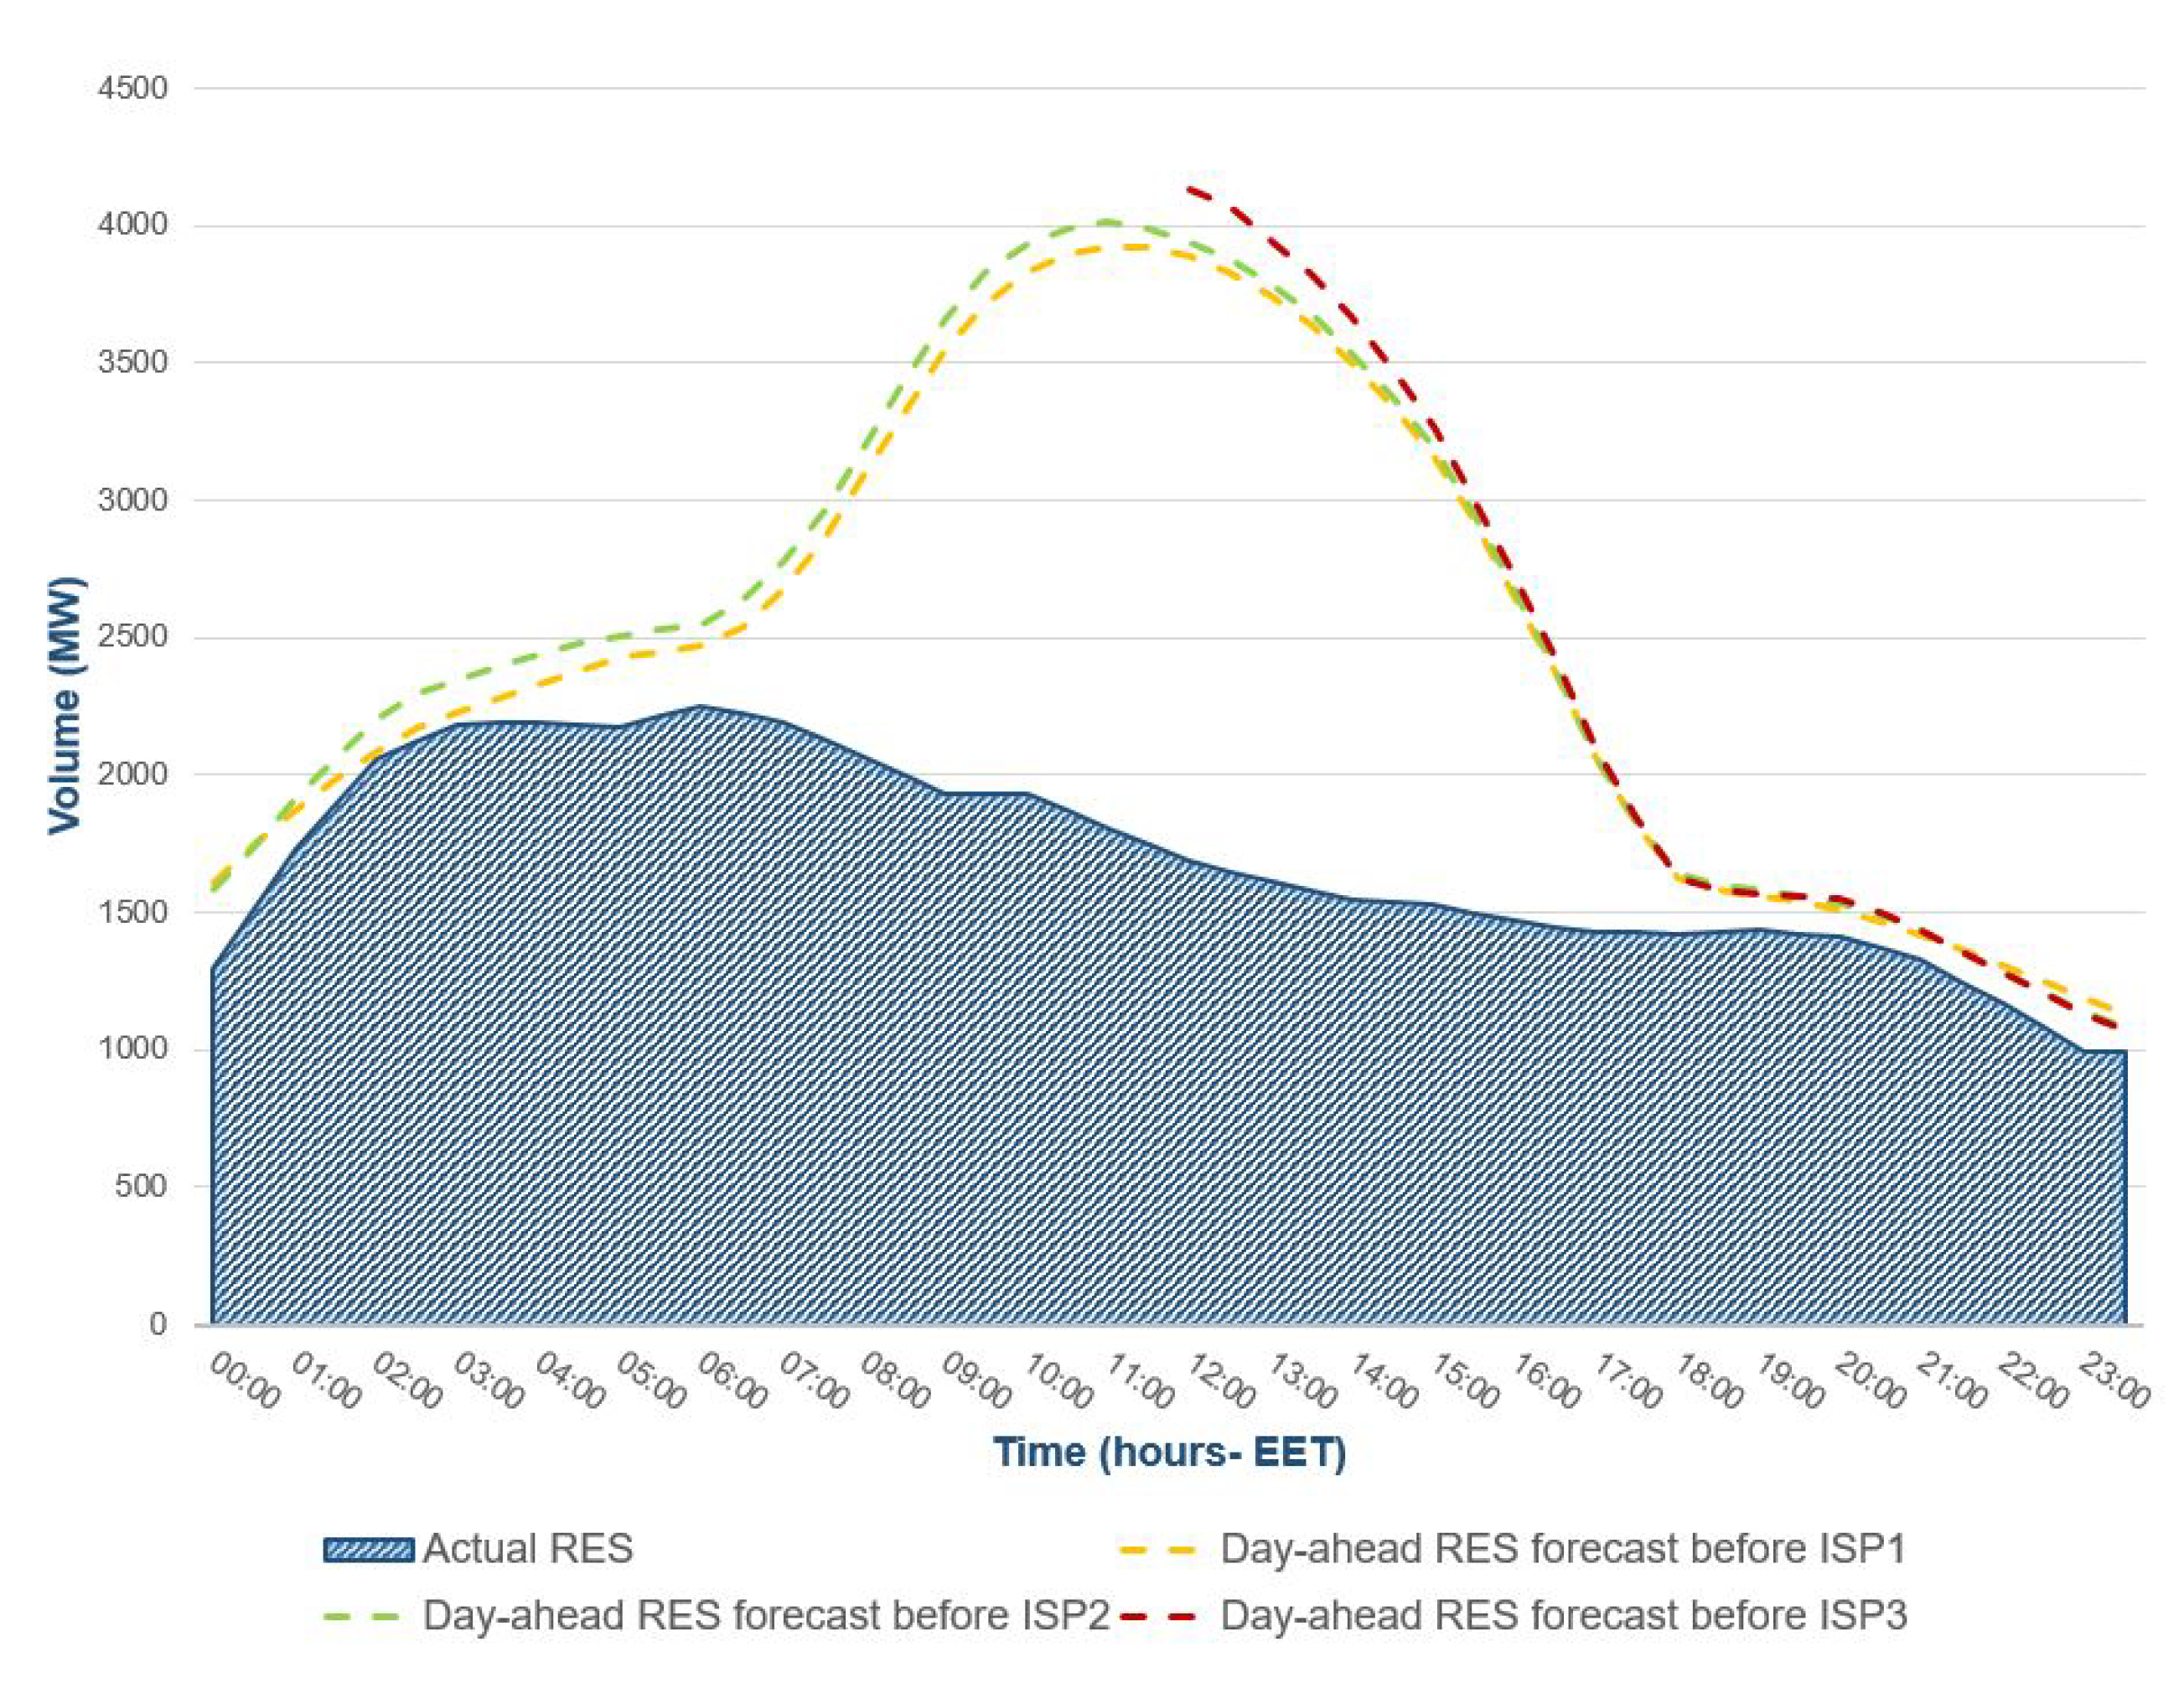
5. A Case Study of the Current Market Structure in Greece

Based on the detailed description of the Greek electricity market and taking into account the numerous data that have been collected from the databases of the Greek Transmition Operator, namely IPTO, the Greek NEMO, HEnEx, and the ENTSO-E Transparency Platform [97,98], the function of all the different markets has been examined and discussed within a day of operation, actually on 23rd of September 2021. The selected day is actually the day after the first performed CRIDAs within the Greek market. On the under investigation day, the results of the different markets are provided, discussed, and compared. Those results actually enhance the extensive description of the different markets within the Target model and help the reader to thoroughly understand their operation. In a second stage, the results after the XBID integration on 30th of September 2021 are examined for the first two months of its operation. The results can be used as an indicator of the new IDM structure performance. Finally, the actual conducted trades, the resulting prices, and volumes of all the different markets from the first day of the Target model adoption until today are given and compared in an attempt to examine the complete market operation in Greece and identify any challenges that arise.
Concerning the FM, Table 1 contains all the active trades and summary data of transactions carried out on 23 September 2021, such as the total orders, the maximum, minimum and average prices, and the total quotes submitted by market makers for each trading series. As it is easily observed, from the 25 register members and the 1 market maker, there have been 75 submitted orders (41 sell and 34 buy orders) and 20 quotes. From the 75 orders, only 5 of them, within the “GREBQ421” trading series, were traded and correspond to a total quantity of 20 MW and an average price of 159.15 EUR/MW, a fact that indicates the lack of liquidity that the Greek FM faces due to the insignificant contracts between its entities. The open price of the specific trading series was 159 EUR/MW, while its settlement price was calculated as 158.76 EUR/MW [97].
Regarding the Greek DAM, the production mix comprises the generation by lignite, GAS, hydro, RES, which are mainly solar and wind power plants represented by RES aggregators, and imports through cross-border electricity trading (CBT). The demand mix comprises the domestic load, which is distinguished into low voltage (LV) load, medium voltage (MV) load, and high voltage (HV) load, the pumping needs of the hydro plants, the exports through CBT, and the system losses. Figure 7 and Figure 8 depict the total production involving all the different sources and the total demand of the DAM on 23 September 2021. The production mix, Figure 7, is comprised of 8% lignite (12.77 GWh), 37% GAS (56.41 GWh), 3% hydro (4.82 GWh), 39% RES (59.43 GWh), and 13% imports (20.46 GWh). As far as the demand mix, see Figure 8, it includes 14% HV load (21.28 GWh), 22% MV load (34.31 GWh), 49% LV load (74.74 GWh), 12% exports (18.89 GWh), 1% pump (1 GWh), and 2% system losses (3.68 GWh). As it is easily seen, the main production is obtained from GAS and RES units, while the principal demand component results from the LV load. The total volume exchanged in the framework of the DAM on the selected day is up to 153.7 GWh, a fact that indicates the sufficient liquidity within the DAM [97]. The MPC occurs based on Equations (1)–(3) when demand and supply curves intersect and the calculated prices for each DAM time unit are given in Figure 7 and Figure 8 with an average value of 110.99 EUR/MWh lower that the one of the FM [97].
Regarding CBT on 23 September 2021, Greece has power exchanges with Albania, North Macedonia, Bulgaria, Turkey, and Italy [99]. The net transfer capacity, i.e., the maximum exchange between two areas, on the selected day in each interconnection, are given as: (i) for the Albanian border equals 300 MW for both imports and exports, for the North Macedonian border equals 400 MW (both imports and exports), (ii) for Bulgarian border equals 618 MW from 00:00 CET to 13:00 CET, 600 MW from 13:00 to 15:00 and 618 MW from 15:00 CET to 00:00 CET for imports and 515 MW from 00:00 CET to 09:00 CET, 500 MW from 09:00 CET to 16:00 CET and 515 MW from 16:00 CET to 00:00 CET for exports, (iii) for the Turkish border equals 100 MW for imports and 216 MW for exports, and (iv) for the Italian border equal to 500 MW for both imports and exports. In the framework of the Greek DAM, the scheduled imported and exported volumes of energy per border are presented in Figure 9. It can be observed that the majority of the scheduled imported quantities are from Bulgaria (48%), while the majority of the scheduled exported quantities correspond to Italy (64%). The total scheduled imported volume of energy is 20.46 GWh and the total scheduled exported volume of energy is 18.89 GWh for the selected day, respectively [97].
In the Greek IDM, trading occurs via hybrid, block, and market coupling orders and the obtained results of the three performed CRIDAs are provided in Figure 10, Figure 11 and Figure 12. Particularly, Figure 10, related to the first CRIDA results, shows the total production involving all the different sources and the total demand for each time unit of the IDM. The aforementioned mix as far as the sell orders is comprised of 56% GAS (278.57 MWh), 30% RES (149.55 MWh), 6% imports (31.2 MWh), and 7% LV production (35.25 MWh). As far as the volume mix of the buy orders goes, it includes 2% HV load (9 MWh), 82% LV load (407.81 MWh), and 16% RES demand (77.78 MWh). Again, GAS units are the main production units, while LV load are close to the total demand in the IDM. As it is easily observed, the energy volumes within the IDM are minor compared to the ones of the DAM, a fact that highlights its low liquidity. The calculated MCP values, Equations (3)–(5), for the first CRIDA, are given in Figure 10 with an average value of 107.17 EUR/MWh, which is close to the one of the DAM [97].
The results of the second performed CRIDA on 23 September 2021 are provided in Figure 11. In this case, the volume mix of sell orders contains 7% lignite (87.89 MWh), 29% GAS (384.26 MWh), 8% RES (99.88 MWh), 6% imports (72.9 MWh), 7% MV production (95.41 MWh), 6% LV production (79.33 MWh), and 38% pumping (500 MWh). The volume mix of the buy orders includes 58% GAS (768 MWh), 22% hydro (290 MWh), 18% RES (236.84 MWh), and 2% LV load (24.6 MWh). In the second CRIDA, the production mix is again dominated by GAS units, while in the demand mix pumping units are the main components. The resulting MCP values for the second CRIDA are given in Figure 11 with an average value of 105.11 EUR/MWh [97]. For the third CRIDA, the results for the second half of the market time units are depicted in Figure 12. The volume mix of the sell orders is comprised of 32% GAS (110.43 MWh), 9% RES (32.55 MWh), 2% MV production (6 MWh), and 57% LV production (201.51 MWh). The corresponding volume mix of buy orders includes 38% RES (134.3 MWh), 25% MV load (88.17 MWh), 7% LV load (21.92 MWh), and 30% exports (104.1 MWh). In the third CRIDA, GAS and LV load are the dominant components for production and consumption, respectively. The calculated MCP for the third CRIDA is given in Figure 12 with an average value of 118.26 EUR/MWh [97]. The total volume within the three CRIDAs are 494.57 MWh, 1319.78 MWh, and 350.49 MWh, respectively [97]. It is worth mentioning that besides the complete low liquidity within the IDM, the CBT also takes the trivial volume of 79.33 MWh, a fact that highlights the importance of adopting a continuous trading both for internal and at the borders trading.
Concerning the BM in Greece, the main results are obtained from the three conducted ISPs. Therefore, for the examined day, all the ISP results are gathered and provided in Figure 13, Figure 14 and Figure 15. In the first ISP that is performed based on the DAM, the results are given in Figure 13 and includes the volume mix of the activated reserves in both directions (upward and downward) for balancing, i.e., aFRR, mFRR, and FCR, with a total value of 35.98 GW [98]. The aforementioned mix includes 4% FCR products (1.13 GW), 46% aFRR products (12.19 GW), and 50% mFRR products (13.32 GW) for the upward direction, and 13% FCR products (1.13 GW), 34% aFRR products (2.94 GW), and 53% mFRR products (4.58 GW) for the downward direction. The results of the second ISP, see Figure 14, involve 4% FCR products (1.13 GW), 47% aFRR product (12.68 GW), and 49% mFRR products (13.18 GW) towards the upward direction, and 13% FCR products (1.13 GW), 35% aFRR products (2.94 GW), and 52% mFRR products (4.32 GW) in the downward direction. The total balancing capacity in the framework of the second ISP was 37.2 GW [98]. In a similar manner, the obtained volume mix of the third ISP, Figure 15, is 22.7 GW and is comprised of 35% FCR products (0.56 GW), 47.5% aFRR products (7.38 GW), and 49.5% mFRR products (7.63 GW) for the upward direction, and 13.5% FCR products (0.56 GW), 35% aFRR products (1.49 GW), and 51.5% mFRR products (2.16 GW) in the downward direction. Figure 13, Figure 14 and Figure 15 also depict the total balancing capacity and the resulting settlement prices (SPs) of the conducted ISPs. The results show that within the volatile real-time environment of the BM a large volume is traded that it is preferable to decrease in the future towards achieving a more stable market outcome. Additionally, it is easily observed that the activated reserves consist of mainly aFRR and mFRR products in all ISPs, while the three calculated SPs of the conducted ISPs have minor deviations. The average values of the resulting SPs are calculated as 38.86 EURMW, 41.82 EUR/MW, and 55.85 EUR/MW, respectively [98]. The average percentage value of the activated reserve products within the BM are given in Figure 16 which again verifies the dominance of mFRR and aFRR products in the balancing capacity market.
After the balancing capacity market, the balancing energy market is performed, which is used to maintain the system frequency within a predetermined range. The results of the balancing energy market are given in Figure 17. The results involve the activated balancing energy products, i.e., aFRR, mFRR, the total activated balancing energy, and the imbalance price (IP). The balancing energy market products are 15-min products in contrary to the other markets, which involve 30-min products. The total activated balancing energy is 5.12 GWh towards upward direction and 9.19 GWh towards downward direction. The volume mix of the activated balancing energy market is comprised of 52.4% aFRR products (1.25 GWh upwards and 1.59 GWh downwards), and 47.6% mFRR products (1.24 GWh upwards and 2.94 GWh downwards). Additionally, it is noticed that the dominant direction of the activated balancing energy products, see Figure 17, changes within the performed balancing energy market, a fact that affects the resulting IP. The latter is obtained based on Equations (6)–(14), with an average value of 81.88 EUR/MWh [98].
To further investigate the provided results, based on IPTO data [98], the actual system load and its forecasts are as shown in Figure 18, while the RES production and its forecasts are given in Figure 19. The observed deviation between the forecasted and the actual values of both the system load and RES production vastly affect the operation of the conducted sequence of markets, the unit commitment procedure, the reserve management, the conducted economic dispatch, and the maintenance schedules. Therefore, the observed deviation between the market results with the real-time time data can be justified in a great extent from the unsatisfying load and RES productions forecasts.
In addition, for the investigation day, the actual import and export volumes from or to the neighbouring countries are provided in Figure 20. The latter depicts that there are considerable deviations compared to the scheduled CBT within the DAM, while at the same time it is ensured that the countries which Greece mainly imports electricity from are Turkey and Bulgaria, and exports towards Italy and Albania.
Finally, Figure 21 provides the actual production and consumption mix on 23 September 2021. The latter reinforces the observation that the main production is obtained from GAS and RES units, while the main demand occurs from LV loads. The price fluctuation of GAS units that have a considerable share of the total production vastly affects the resulting prices within the energy market sequence. Therefore, it is of great importance to decrease the Greek market dependence on GAS imports.
In order to showcase the changes in the IDM after the launch of the XBID adoption, both the continuous intraday trading and the existing CRIDAs are examined. In Figure 22, the results of the IDM with an hourly resolution for the first two months of the XBID adoption are given. The latter involve the total traded energy volume via both the XBID solution and the CRIDAs and the resulting prices of each approach. As it is easily observed, the volume traded within the XBID market is many times over that of CRIDAs, a fact that indicates the increase of the complete IDM liquidity. The increase in the IDM liquidity leads to a lower price environment, which affects the market participation in a positive way.
Finally, the complete market performance from the first day of the Target Model implementation until today is examined. In Figure 23, the average volumes of the complete sequence of markets after the adoption of the Target Model are provided. It is worth noting that the traded volumes before the XBID integration within the DAM was 95.5% of the total traded energy, while the involved volumes into the IDM and BM were 0.5% and 4%, respectively. The latter verify the high liquidity and satisfactory operation of the DAM, and the extreme lack of liquidity within the Greek IDM since the traded energy within that market is almost zero. After the adoption of the XBID solution, the traded volume percentages within the different markets change; i.e., the percentage of traded volumes within the DAM to the total traded volumes decreased to 92.2%, while the relative percentages to the IDM and the BM changed to 7.2% and 0.6%, respectively. As it is easily observed, the IDM liquidity has been vastly increased after the XBID adoption. In addition, it is also observed that the BM had a sufficient volume percentage, which decreased to a close to zero value after the XBID adoption (traded volume moved from BM to IDM), a satisfactory operation indicator considering that within the real-time environment of the BM energy trading is avoided. The latter is expected since with the continuous trading, RES immediately fully assume balancing responsibility for the full amount of deviations they may cause and choose to transact within the IDM.
As far as the average prices of the DAM and the IDM, see Figure 24, it is observed that they take close values with insignificant deviations for each month, a fact that again ensures the satisfactory remuneration of the under investigation markets. Additionally, the resulting IP values take in some cases higher average values than the ones of the DAM and IDM, a fact that indicates the high pricing environment of the BM. The latter is justified since the BM handles energy volumes in real-time when unpredictable changes can occur and jeopardize the stable operation of the grid. Finally, it is worth mentioning that prices of all consequent markets vastly increase the last months of the Target Model operation, a fact that occurs mainly due to the energy crises that Europe is currently facing.

6. The Identified Challenges in the Greek Electricity Market and the Proposed Reforms

The previously described and analysed market structure is currently in place on the electricity sector in Greece and operates in a quite successful manner under the supervision of HEnEx, IPTO, and all the relevant NEMOs. However, several challenges arose after the application of the Target Model, the SDAC, and the SIDC solution accompanied by the increasing penetration of RES, and the necessity for the consumers involvement in the market procedure [27]. All those reasons hinder the smooth and reliable operation of the market, while simultaneously encumbering its improvement towards achieving full compliance with the EU archetypes. In that framework, a variety of measures was considered aiming to overcome the aforementioned challenges and enhance the successful operation of both the electricity market and the grid in Greece [27]. To specify the identified challenges in the Greek electricity market, one has to delve into its different subparts, i.e., the FM, DAM, IDM, and BM.
Concerning the capacity FM in Greece, it has no liquidity after its launch on March 2020 since there are no significant contracts between different entities [52]. The DAM started operating under the current structure on 1 November 2020. Since then, sufficient liquidity has been observed within this market, coupling operated smoothly, and the market prices have been cost-reflective [23,26]. However, it has been noticed that the submitted bids for each unit within the DAM receive simple, piece-wise constant, ascending price values, limited by the marginal costs of the under consideration units. Furthermore, the IDM, in the first period of its operation, has limited liquidity [23,26,100]. The latter has been resolved to a great extent with the coupling of the Greek IDM with the Italian one through CRIDAs implementation, the continuous intra-day trading with the countries within the SIDC solution, and the inclusion of RES as full responsible balancing parties. However, the coupling of IDM of Greece with its non-EU neighbouring countries, and the incomplete regulatory framework for RES and consumers participation in the market are still reasons that encumber the improvement of the IDM liquidity. Concerning the non-EU countries, IPTO has started relevant discussions with the neighbouring non-EU TSOs and SEE CAO. The current plan foresees the intra-day PTR auctions for the non-EU bidding zone borders to be launched during 2023 [55]. Finally, considering the BM operation it has been observed that the resulting prices from the new market structure are significantly higher than the one calculated from the previously adopted market scheme [23]. It is worth noting that the total amount of balancing energy remuneration is several times higher than the total amount of balancing capacity remuneration, as shown in Figure 13, Figure 14, Figure 15, Figure 16 and Figure 17, due to the high magnitude of deviations between the real-time generation schedule and the one derived from the DAM. There has also been a network limitation in Peloponnese due to a delay of completion of the high voltage grid line, which sometimes made the real-time operation of units located in Peloponnese impossible at the capacity considered within the DAM [26]. Another cause of deviations relates to over-voltage issues occurring in the Northern system of Greece at low load times, which implies must-run instructions for a few lignite plants to maintain voltages within a reliable range. After observing excessive remuneration of balancing energy in the first months of the Target Model operation, RAE established Decision 54/2021 and applied a cap on bids for downward changes in the balancing energy market [101].
In order to further assist the operation of all the aforementioned markets, several measures have been considered, besides the aforementioned cap. In the category of structural measures, the introduction of additional participation in the market, such as RES, DSR, and storage, is expected to improve its current operation [102,103,104]. In particular, the DSR participation, i.e., the involvement of consumers in the grid mechanisms, can assist with the balanced and safe operation of the grid, while at the same time it could result in more flexible and elastic prices of the demand bids [28,29,105]. Currently, DSR participation is considered in the rules of the DAM [55]. However, it is at present encumbered, mainly due to the lack of appropriate capacity calculation rules and mechanisms for the interconnection of Greece with the non-EU neighbouring countries. As far as the BM, IPTO enhanced the existing regulating framework towards involving DSR participation via mFRR products. Besides the planned reform of the grid, the Greek DSO, namely HEDNO, plans to install 7.5 million smart power meters to replace conventional meters around the country, which are able to provide real-time data at the side of the consumer [106,107]. Those real-time data will enable consumers that actually are the load representatives to move towards submitting dynamic bids and abandon the existing constant tariffs. The resulting dynamic pricing could be further supported by the DSR participation from individual consumers that are willing to invest on the smart meters and the retail market competition.
Concerning the efficient RES participation in the BM, the relative regulatory framework is expected to be completed during 2023. Currently, feed-in-tariff (FiT) RES do not have balancing responsibility. Imbalances for the FiT RES are credited/debited to DAPEEP which is the RES operator in Greece. Feed-in-premium (FiP) RES currently have full balancing responsibility after the XBID adoption. Until then, FiP RES are credited/debited for their imbalance quantity with DAM price. RES supported by FiT contracts that have terminated are subject to balancing responsibility and balancing prices. The same applies to DAPEEP as an aggregator of RES units supported by FiT [108,109]. Market-based RES, which are RES without any subsidy, already have balancing responsibility [27]. Storage participation is at present limited only in hydro storage units that can provide only mFRR services due to their inflexible on–off operation. IPTO plans to reform the current regulatory framework in order to involve battery storage systems that can provide not only mFRR but also aFRR, FCR, and voltage control services [26]. The adaptation of additional constraints in the ISP algorithm is also under consideration to accommodate the participation of storage, including hydro pumps and batteries. In the Greek IDM, the related storage participation regulatory framework is currently under preparation by the Greek Ministry and is expected to be finalized by 2023 [26]. At present, a transitory procedure is applied by the licensing of storage participation.
Another measure that is considered within the latest market reform plan [26] in order to preserve and increase the liquidity of the market sequence is the adoption of percentage limitations on the traded energy in the market framework. Within the FM, a threshold of 40% was applied until the end of 2021 on bilateral OTC contracts with physical delivery, the so-called nominations, the latter aiming to represent at least the specified amount of the suppliers portfolio. The aforementioned measure applies only on nominations and not on all the FM products and aims at impeding large-scale suppliers to bypass the existing market mechanisms. This percentage applies to all participants, except for the Public Power Corporation S.A., which has the major market share and will continue with a threshold of 20% until 31 December 2022 [87]. Percentage limitations are also considered in the DAM and the IDM as well. Specifically, for each supplier with a retail market share exceeding a X% threshold, the percentage of energy quantities purchased under accepted DAM buy orders may not exceed an A% threshold. The X% and A% values are set annually by a RAE Decision. Following a proposal of HEnEx and for 2022, these values have been set to 4% and 40%, respectively [55].
Other market-oriented measures of the market reform plan [26] are related to the bidding procedure. The replacement of the existing unit-based bidding with a portfolio-based one can be considered in all IDM, DAM, and BM. Such an improvement could allow market participants to configure their portfolios and serve bilateral contracts by taking into account the necessity for reserve provision and the resulting balancing costs. Additionally, in the Greek DAM, several bid forms are allowed, including hybrid orders, block orders, linked block orders and exclusive group of block orders. Complex orders are not yet considered in the DAM and only trivial bids that reflect the marginal costs are applied, mainly due to the risk of increasing the complexity of EUPHEMIA algorithm. The introduction of complex bids in the DAM could enable participants to pre-empt the imbalances that result from the deviations between the DAM and the central scheduling ISP algorithm and minimize their exposure to imbalancing costs.
Furthermore, the proposal of new platforms and the extension of the existing ones could facilitate the efficient and reliable operation of the complete market. A first improvement of the existing trading platform could provide support auctions, information, and trade-board services with access to several exchanges [26,110]. Some software extension and proposal of new products dedicated to hedging risks could also upgrade the existing FM platform. In addition, the implementation of a separate specialized FM platform is expected until the end of 2023. The latter will involve nominations enriched with Renewable Energy Systems—Power Purchase Agreements (RES-PPAs) and other complex portfolios. To expand the nominations of portfolios in the DAM, a nomination platform would be established, able to allow nominating awarded balancing capacity intended to be available within the ISP, and which will further facilitate supporting portfolio bidding in the auctions and secondary capacity trading. However, such a reform in the BM is not yet mature [26].
Complementary measures involve the procurement of reserve capacity in the DAM, flagging of redispatching, and introduction of a storage pricing function in the BM framework [30,107]. Flagging of redispatching is a mechanism used to distinguish energy and non-energy products, aiming to minimize the impact of the non-energy products remuneration within the BM and consequently eliminate their effects on the market prices of balancing energy [107]. The application of such a mechanism necessitates complex manipulations both for its implementation and its integration in the software and algorithms performed within the BM. In that framework, the application of a shortage pricing function on the balancing energy quantity could recover an amount of the balancing services costs. The fundamental idea of using such a shortage function is to limit the prices up to a predefined value, namely the VoLL, in times of scarcity [26,31]. The proposed shortage pricing function can be calculated via the co-optimization of both balancing energy and reserves that ensure the alignment of the energy balancing price and imbalance settlement price. Currently, in Greece, the implementation and application of such a shortage function is under examination [26]. However, reforms towards the new electricity market requires a new study for its implementation. Finally, concerning the procurement of the reserve capacity in the DAM it is considered to be implemented via separate auctions. Those auctions will facilitate the market participants to pre-empt the balancing capacity quantities that will be used in real-time within the balancing capacity market and consequently will lead to convergence of the results concluded by the DAM and the ISP algorithm [85]. In such way, both the overall costs and redispatching are expected to be minimized.

7. Conclusions

In the present study, the benchmark model for the EU electricity markets, the so-called Target Model, is thoroughly discussed and analysed. Such an analysis set the basis for providing the current market status in Greece in accordance to the Target Model via the implementation of the four consecutive markets, namely the FM, the DAM, the IDM, and the BM. The operation of the new structured market has been examined via an intricate case study that shows an overview of the Greek market and its dynamics within a day of operation. The day chosen is the next day on which the performance of CRIDAs took place in the Greek market. In addition, real market data as obtained from the entire period after the implementation of the EU target model in the Greek electricity market are also presented. Based on the functioning of the integrated European market in other EU countries, this is a sufficient period to gather proper results of the Target Model operation in Greece. The analysis of the present study is based on those real market data, as published from IPTO, HEnEX, and the ENTSO-E Transparency Platform and covers the complete sequence of markets that operate in Greece. The obtained results show that the current market structure is compliant to the adopted Target Model and operates in a quite satisfactory manner.
Nevertheless, several challenges have arisen such as liquidity issues, discrepancies between the DAM volumes and the real-time generation schedules, considerable need for redispatching due to the network constraints, etc., which are presented and analysed in detail. In particular, the historical data of the DAM prices, in the first six months under study, were lower compared to the recent previous years in the corresponding months. This is an expected benefit as the consumer is coupled with the cheapest generation in Europe, and consumers benefit from lower balancing costs accordingly. Despite the fact that the DAM, IDM, and IP prices have started to rise in the last months mainly due to the energy crisis in Europe and the limited electricity interconnection capacity of the country, the market is seen to mature rapidly and become capable of handling its own dynamics. This results from the fact that overall capacity reserve requirements are reduced, and the simultaneous activation of balancing energy is better managed, resulting in lower prices offered by market participants in the BM market. However, RES and consumer load might affect the cost of the BM and wholesale prices, mainly due to the deviation between the forecasted and the actual values of both the system load and RES production.
In addition, the limited IDM liquidity negatively affects the resulting prices. To that end, several measures aiming to overcome the majority of the emerging challenges are proposed and thoroughly discussed, such as reduction of the dependence of electricity bills on short-term fossil fuel prices and strengthening the development of renewable energy projects, improving the operation of the market to secure supply and fully exploit alternative energy sources, strengthening consumer protection, and improving market transparency and supervision.
Finally, the Target Model market implementation in Greece and the coupling of Greek IDM with the Bulgarian market, followed by the coupling with the Italian market combined with the implementation of MARI and PICASSO platforms and the coupling with the non-EU countries, is expected to provide even more significant benefits that will gradually emerge, such as an increase in consequent market liquidity, greater price convergence of the Greek market with neighbouring countries, the establishment of a more transparent framework for market costs, a more qualitative operation of the electricity system through a more efficient use of interconnections, increased access to cheaper energy sources and increased possibility to trade electricity from RES. All these benefits will further strengthen the Sustainable Development Goals (SDGs), especially by positively affecting SDG 7 (affordable and clean energy), SDG 8 (decent work and economic growth), SDG 9 (industry, innovation and infrastructure), SDG 12 (responsible production and consumption), and SDG 13 (climate action) through electricity prices that will decrease mainly due to the increase in demand for electricity from renewable sources.

Author Contributions

Conceptualization, J.J.M., C.-S.K., C.D. and I.P.M.; methodology, J.J.M. and C.-S.K.; formal analysis, investigation, J.J.M. and C.-S.K.; writing—original draft preparation, J.J.M.; writing—review and editing, J.J.M., C.-S.K., C.D. and I.P.M.; supervision, C.D. and I.P.M. All authors have read and agreed to the published version of the manuscript.

Funding

This research is supported by the EU H2020 project OneNet (Grant Agreement No. 957739; https://onenet-project.eu/, accessed on 7 February 2023).

Institutional Review Board Statement

Not applicable.

Informed Consent Statement

Not applicable.

Data Availability Statement

Not applicable.

Conflicts of Interest

The authors declare no conflict of interest. The funders had no role in the design of the study; in the collection, analyses, or interpretation of data; in the writing of the manuscript; or in the decision to publish the results.

Abbreviations

The following abbreviations are used in this manuscript:
EUEuropean Union
CEPclean energy package
FMforward market
DAMthe day-ahead market
IDMintra-day market
BMbalancing market
RESrenewable energy sources
DSRdemand side response
ACER            agency for the Cooperation of Energy Regulators
EB GLelectricity balancing guideline
TSOstransmission system operators
DSOsdistribution system operators
SO GLsystem operation guideline
CACM GLcapacity allocation and congestion management guideline
FCA GLforward capacity allocation guideline
IPTOIndependent Power Transmission Operator
RAERegulatory Authority of Energy
HEnExHellenic Energy Exchange
OTCover-the-counter
EEXEuropean Energy Exchange
PTRsphysical transmission rights
JAOJoint Allocation Office
SDACsingle day-ahead coupling
PCRPrice Coupling of Regions
EUPHEMIAPan-European Hybrid Electricity Market Integration Algorithm
NEMOsNominated Electricity Market Operators
XBIDcross-border intra-day
SIDCsingle intra-day coupling
CRIDAscomplementary intra-day auctions
BRPsbalancing responsible parties
BSPsbalance service providers
RRsrestoration reserves
FCRsfrequency containment reserves
mFRRmanual frequency restoration reserve
aFRRautomatic frequency restoration reserve
FRRsfrequency restoration reserves
INimbalance netting
TERRETrans—European Replacement Reserves Exchange
MARIManually Activated Reserves Initiative
PICASSOPlatform for the International Coordination of Automated Frequency
Restoration and Stable System Operation
IGCCInternational Grid Control Cooperation
ATHEXClearAthens Exchange Clearing House
MiFID IIFinancial Instruments Directive
EMIREuropean market infrastructure regulation
ETSSEnergy Trading Spot Market System
MRCmulti-regional coupling
IBWTItalian Borders Working Table
HVDChigh voltage DC
SEleNe CCSoutheast Electricity Network Coordination Center
RCCRegional Coordination Center
MCPmarket clearing price
FiTfeed-in-tariff
VoLLvalue of lost load
SEE CAOSouth East Europe
ISPIntegrated Scheduling Programming
AGCAutomatic General Control
RTBMReal-time Balancing Market
CBTcross-border electricity trading
LVlow voltage
MVmedium voltage
HVhigh voltage
SPsettlement price
IPimbalance price
FiPfeed-in-premium
RES-PPAsRenewable Energy Systems—Power Purchase Agreements

References

  1. European Palriament. The Internal Market: General Principles, Fact Sheet. 2021. Available online: https://www.europarl.europa.eu/factsheets/en/sheet/33/the-internal-market-general-principles (accessed on 7 February 2023).
  2. Next Kraftwerke. The European Energy Market—Liberalization & Unbundling. 2021. Available online: https://www.nextkraftwerke.be/en/knowledge-hub/liberalized-european-energy-market/ (accessed on 7 February 2023).
  3. EPEX SPOT. Basics of the Power Market. 2021. Available online: https://www.epexspot.com/en/basicspowermarket#electricity-a-unique-commodity (accessed on 7 February 2023).
  4. Florence School of Regulation. The Clean Energy for All Europeans Package. 2020. Available online: https://fsr.eui.eu/the-clean-energy-for-all-europeans-package/ (accessed on 7 February 2023).
  5. European Wind Energy Association. Creating the Internal Energy Market in Europe. 2012. Available online: http://www.ewea.org/uploads/tx_err/Internal_energy_market.pdf__cf_chl_f_tkv3WZT_WBpg2e8heaibT_AdtOkcj5XUlSWnuguuaj618-1642499273-0-gaNycGzNA1E (accessed on 7 February 2023).
  6. Kambouris, Y.; The Balancing Market. Proceedings of RAE Conference on Target Model, Athens. 2018. Available online: http://oldsite.rae.gr/site/file/system/docs/various/anartiseis/2207_1;jsessionid=0ac113f330d974196418896d4310bdedd1f4afc92bd9.e34Lah0LbNqMe38NaxqLch0Lci1ynknvrkLOlQzNp65In0 (accessed on 7 February 2023).
  7. Belyaev, L.S. Electricity Market Reforms: Economics and Policy Challenges; Springer: Berlin/Heidelberg, Germany, 2011. [Google Scholar]
  8. European Parliamentary Research Service. Understanding Electricity Markets in the EU. 2016. Available online: http://www.easyres-project.eu/wp-content/uploads/2019/02/understanding-elecricity-markets-in-the-eu.pdf (accessed on 7 February 2023).
  9. Metaxas, A.; Mathioulakis, M.; Lykidi, M. Implementation of the Target Model: Regulatory Reforms and obstacles for the Regional Market Coupling. Eur. Energy J. (EEJ) 2019, 8, 24–39. [Google Scholar] [CrossRef]
  10. Dagoumas, A. Impact of Bilateral Contracts on Wholesale Electricity Markets: In a Case Where a Market Participant Has Dominant Position. Appl. Sci. 2019, 9, 382. [Google Scholar] [CrossRef] [Green Version]
  11. Ahlqvist, V.; Holmberg, P.; Tangerås, T. A survey comparing centralized and decentralized electricity markets Author links open overlay panel. Energy Strategy Rev. 2022, 40, 100812. [Google Scholar] [CrossRef]
  12. Pellini, E. Measuring the impact of market coupling on the Italian electricity market. Energy Policy 2012, 48, 322–333. [Google Scholar] [CrossRef]
  13. Do, H.X.; Nepal, R.; Jamasb, T. Electricity market integration, decarbonisation and security of supply: Dynamic volatility connectedness in the Irish and Great Britain markets. Energy Econ. 2022, 92, 104947. [Google Scholar] [CrossRef]
  14. Gaffney, F.; Deane, J.P.; Gallachóir, B.P.Ó. Reconciling high renewable electricity ambitions with market economics and system operation: Lessons from Ireland’s power system. Energy Strategy Rev. 2019, 26, 100381. [Google Scholar] [CrossRef]
  15. González, J.S.; Alonso, C.Á. Industrial electricity prices in Spain: A discussion in the context of the European internal energy market. Energy Policy 2021, 148, 111930. [Google Scholar] [CrossRef]
  16. Tanrisever, F.; Derinkuyu, K.; Jongen, G. Organization and functioning of liberalized electricity markets: An overview of the Dutch market. Renew. Sustain. Energy Rev. 2015, 51, 1363–1374. [Google Scholar] [CrossRef]
  17. Newbery, D. Tales of two islands—Lessons for EU energy policy from electricity market reforms in Britain and Ireland. Energy Policy 2017, 105, 597–607. [Google Scholar] [CrossRef]
  18. Di Cosmo, V.; Lynch, M. Competition and the single electricity market: Which lessons for Ireland? Util. Policy 2016, 41, 40–47. [Google Scholar] [CrossRef] [Green Version]
  19. Heijden, T.V.; Lago, J.; Palensky, P.; Abraham, E. Electricity price forecasting in European Day Ahead Markets: A greedy consideration of market integration. IEEE Access 2021, 9, 119954–119966. [Google Scholar] [CrossRef]
  20. Andrianesis, P.; Biskas, P.; Liberopoulos, G. An overview of Greece’s wholesale electricity market with emphasis on ancillary services. Electr. Power Syst. Res. 2011, 81, 1631–1642. [Google Scholar] [CrossRef]
  21. Papaioannou, G.P.; Dikaiakos, C.; Evangelidis, G.; Papaioannou, P.G.; Georgiadis, D.S. Co-movement analysis of Italian and Greek electricity market wholesale prices by using a wavelet approach. Energies 2015, 8, 11770–11799. [Google Scholar] [CrossRef] [Green Version]
  22. Andrianesis, P.E.; Liberopoulos, G.; Papalexopoulos, A.D. Greek wholesale electricity market: Forthcoming market changes and bid/cost recovery. In Proceedings of the 8th Mediterranean Conference on Power Generation Transmission, Distribution and Energy Conversion (MEDPOWER 2012), Cagliari, Italy, 1–3 October 2012; pp. 1–6. [Google Scholar]
  23. Danias, N.; Swales, J.K.; McGregor, P. The Greek electricity market reforms: Political and regulatory considerations. Energy Policy 2013, 62, 1040–1047. [Google Scholar] [CrossRef] [Green Version]
  24. Venizelos, E.C. EU Target Model Implementation Towards Sustainability-The Case Study of Greek Power Market. Ph.D. Dissertation, University of Piraeus, Piraeus, Greece, 2021. [Google Scholar]
  25. Ioannidis, F.; Kosmidou, K.; Andriosopoulos, K.; Everkiadi, A. Assessment of the Target Model Implementation in the Wholesale Electricity Market of Greece. Energies 2021, 14, 6397. [Google Scholar] [CrossRef]
  26. RAE. Market Reform Plan for Greece—Ver. 8. 2021. Available online: https://ec.europa.eu/energy/sites/default/files/greece_market_reform_plan.pdf (accessed on 7 February 2023).
  27. Manolopoulos, D.; Kitsopoulos, K.; Kaldellis, J.K.; Bitzenis, A. The evolution of renewable energy sources in the electricity sector of Greece. Int. J. Hydrogen Energy 2016, 41, 12659–12671. [Google Scholar] [CrossRef]
  28. Ibn Saif, A.U.N.; Khadem, S.K. Consumer-centric Electricity Market: Review of key European projects. In Proceedings of the 17th International Conference on the European Energy Market (EEM), Stockholm, Sweden, 16–18 September 2020; pp. 1–6. [Google Scholar]
  29. Forouli, A.; Bakirtzis, E.A.; Papazoglou, G.; Oureilidis, K.; Gkountis, V.; Candido, L.; Ferrer, E.D.; Biskas, P. Assessment of Demand Side Flexibility in European Electricity Markets: A Country Level Review. Energies 2021, 14, 2324. [Google Scholar] [CrossRef]
  30. Single Electricity Market (SEM) Committee. Consultation on Dispatch, Redispatch and Compensation Pursuant to Regulation (EU) 2019/943. 2021. Available online: https://www.semcommittee.com/sites/semc/files/media-files/SEM-21-026%20Consultation%20on%20Dispatch%2C%20Redispatch%20and%20Compensation%20Pursuant%20to%20Regulation%20EU%202019943.pdf (accessed on 7 February 2023).
  31. ACER. Market Monitoring Report 2020—Electricity Wholesale Market Volume. 2022. Available online: https://extranet.acer.europa.eu/Official_documents/Acts_of_the_Agency/Publication/ACER%20Market%20Monitoring%20Report%202020%20%E2%80%93%20Electricity%20Wholesale%20Market%20Volume.pdf (accessed on 7 February 2023).
  32. European Union. Directive 96/92/EC of the European Parliament and of the Council Concerning Common Rules for the Internal Market in Electricity; OJ L 027, 30.01.1997; European Union: Brussels, Belgium, 1997; pp. 20–29. [Google Scholar]
  33. European Union. Directive 98/30/EC of the European Parliament and of the Council Concerning Common Rules for the Internal Market in Natural Gas; OJ L 204, 21.07.1998; European Union: Brussels, Belgium, 1998; pp. 1–12. [Google Scholar]
  34. European Union. Directive 2003/55/EC of the European Parliament and of the Council Concerning Common Rules for the Internal Market in Natural Gas and Repealing Directive 98/30/EC; OJ L 176, 15.07.2003; European Union: Brussels, Belgium, 2003; pp. 57–78. [Google Scholar]
  35. European Union. Regulation (EC) No 1228/2003 of the European Parliament and of the Council on Conditions for Access to the Network for Cross-Border Exchanges in Electricity; OJ L 176, 15.7.2003; European Union: Brussels, Belgium, 2003; pp. 1–10. [Google Scholar]
  36. European Union. Directive 2009/72/EC of the European Parliament and of the Council Concerning Common Rules for the Internal Market in Electricity and Repealing Directive 2003/54/EC; OJ L 211, 14.8.2009; European Union: Brussels, Belgium, 2009; pp. 55–93. [Google Scholar]
  37. European Union. Regulation (EC) No 714/2009 of the European Parliament and of the Council on Conditions for Access to the Network for Cross-Border Exchanges in Electricity and Repealing Regulation (EC) No 1228/2003; OJ L 211, 14.8.2009; European Union: Brussels, Belgium, 2003; pp. 15–35. [Google Scholar]
  38. European Union. Regulation (EC) No 713/2009 of the European Parliament and of the Council Establishing an Agency for the Cooperation of Energy Regulators; OJ L 211, 14.8.2009; European Union: Brussels, Belgium, 2009; pp. 1–14. [Google Scholar]
  39. European Union. Regulation (EU) 2019/943 of the European Parliament and of the Council on the Internal Market for Electricity; OJ L 158, 14.6.2019; European Union: Brussels, Belgium, 2019; pp. 54–124. [Google Scholar]
  40. European Union. Directive (EU) 2019/944 of the European Parliament and of the Council on Common Rules for the Internal Market for Electricity and Amending Directive 2012/27/EU; OJ L 158, 14.6.2019; European Union: Brussels, Belgium, 2019; pp. 125–199. [Google Scholar]
  41. European Commission. Amendment to the Renewable Energy Directive to Implement the Ambition of the New 2030 Climate Target. 2021. Available online: https://commission.europa.eu/document/2caaf8e2-df20-4bdb-bde0-384599b1e82e_en (accessed on 7 February 2023).
  42. Wildgrube, T. Fit for 55? An Assessment of the Effectiveness of the EU COM’s Reform Proposal for the EU ETS. No. 22/04; EWI Working Paper; Institute of Energy Economics at the University of Cologne (EWI): Cologne, Germany, 2022. [Google Scholar]
  43. Marcu, A.; Maratou, A.; Mehling, M.; Cosbey, A. The EU Carbon Border Adjustment Mechanism (CBAM). In Preliminary Analysis of the European Commission Proposal for a Regulation Establishing a Carbon Border Adjustment Mechanism; CBAM: Amsterdam, The Netherlands, 2021; p. 564. [Google Scholar]
  44. Florence School of Regulation. Fit for 55: EU Rolls Out Largest Ever Legislative Package in Pursuit of Climate Goals. 2021. Available online: https://fsr.eui.eu/fit-for-55-eu-rolls-out-largest-ever-legislative-package-in-pursuit-of-climate-goals/ (accessed on 7 February 2023).
  45. ENTSO-E. Network Codes. 2016. Available online: http://annualreport2016.entsoe.eu/network-codes/ (accessed on 7 February 2023).
  46. European Union. Commission Regulation (EU) 2017/2195 Establishing a Guideline on Electricity Balancing; OJ L 312, 28.11.2017; European Union: Brussels, Belgium, 2017; pp. 6–53. [Google Scholar]
  47. European Union. Commission Regulation (EU) 2017/1485 Establishing a Guideline on Electricity Transmission System Operation; OJ L 220, 25.8.2017; European Union: Brussels, Belgium, 2017; pp. 1–120. [Google Scholar]
  48. European Union. Commission Regulation (EU) 2015/1222 Establishing a Guideline on Capacity Allocation and Congestion Management; OJ L 197, 25.7.2015; European Union: Brussels, Belgium, 2015; pp. 24–72. [Google Scholar]
  49. European Union. Commission Regulation (EU) 2016/1719 Establishing a Guideline on Forward Capacity Allocation; OJ L 259, 27.9.2016; European Union: Brussels, Belgium, 2016; pp. 42–68. [Google Scholar]
  50. Biskas, P.N.; Marneris, I.G.; Chatzigiannis, D.I.; Roumkos, C.G.; Bakirtzis, A.G.; Papalexopoulos, A. High-level design for the compliance of the Greek wholesale electricity market with the Target Model provisions in Europe. Electr. Power Syst. Res. 2016, 152, 323–341. [Google Scholar] [CrossRef]
  51. Fafaliou, I.; Polemi, M.L. Trends in the European electricity markets: The case of Greece. Int. J. Econ. Bus. Res. 2010, 2, 369. [Google Scholar] [CrossRef] [Green Version]
  52. Beus, M.; Pavić, I.; Štritof, I.; Capuder, T.; Pandžić, H. Electricity Market Design in Croatia within the European Electricity Market-Recommendations for Further Development. Energies 2018, 11, 346. [Google Scholar] [CrossRef] [Green Version]
  53. Hellenic Association for Energy Economics. Greek Energy Market Report. 2020. Available online: https://www.haee.gr/FileServer?file=ca430e84-31ec-4fa8-8153-ac3f6eb16b70 (accessed on 7 February 2023).
  54. Hellenic Association for Energy Economics. Greek Energy Market Report. 2019. Available online: https://www.haee.gr/media/4858/haees-greek-energy-market-report-2019-upload-version.pdf (accessed on 7 February 2023).
  55. HEnEx. Spot Trading Rulebook: Day-Ahead & Intra-Day Markets Trading Rulebook—Ver. 1.4. 2021. Available online: https://www.enexgroup.gr/documents/20126/144557/Spot_Trading_Rulebook_v1.4_en.pdf (accessed on 7 February 2023).
  56. Biskas, P.N.; Chatzigiannis, D.I.; Bakirtzis, A.G. European electricity market integration with mixed market designs—Part I: Formulation. IEEE Trans. Power Syst. 2014, 29, 458–465. [Google Scholar] [CrossRef]
  57. KU Leuven Energy Institute. EI Fact Sheet: The Current Electricity Market Design in Europe. 2015. Available online: https://set.kuleuven.be/ei/images/EI_factsheet8_eng.pdf/ (accessed on 7 February 2023).
  58. Ashworth, P.; Baldwin, K.G.H.; Brear, M.; Chappel, T.; Garbutt, M.; Hernandez, C.A.; Jotzo, F.; MacGill, I.; Nelson, T. Overview of papers for the Special Issue of The Electricity Journal: The Future Electricity Market Summit. Electr. J. 2020, 33, 9. [Google Scholar] [CrossRef]
  59. Swin, G.P.; Natraj, A.; O’Mahoney, A. The European Target Model and the impact of implicit auctions on interconnection capacity prices. In Proceedings of the 13th International Conference on the European Energy Market (EEM), Porto, Portugal, 6–9 June 2016; pp. 1–6. [Google Scholar]
  60. ACER. European Electricity Forward Markets and Hedging Products—State of Play and Elements for Monitoring. 2015. Available online: https://www.acer.europa.eu/en/Electricity/Market%20monitoring/Documents_Public/ECA%20Report%20on%20European%20Electricity%20Forward%20Markets.pdf| (accessed on 7 February 2023).
  61. Ausubel, L.M.; Cramton, P. Using forward markets to improve electricity market design. Util. Policy 2010, 18, 195–200. [Google Scholar] [CrossRef] [Green Version]
  62. Florence School of Regulation. Electricity Markets in the EU. 2020. Available online: https://fsr.eui.eu/electricity-markets-in-the-eu/ (accessed on 7 February 2023).
  63. ENTSO-E. Single Day-Ahead Coupling (SDAC). 2021. Available online: https://www.entsoe.eu/network_codes/cacm/implementation/sdac/ (accessed on 7 February 2023).
  64. Koltsaklis, N.E.; Dagoumas, A.S. Incorporating unit commitment aspects to the European electricity markets algorithm: An optimization model for the joint clearing of energy and reserve markets. Appl. Energy 2018, 231, 235–258. [Google Scholar] [CrossRef]
  65. Koltsaklis, N.E.; Zenginis, I.; Dagoumas, A.S. Assessing new block order options of the EUPHEMIA algorithm: An optimization model for the economic dispatch problem in power exchanges. Energy Rep. 2020, 6, 3119–3140. [Google Scholar] [CrossRef]
  66. Zad, B.B.; Toubeau, J.F.; Vatandoust, B.; Bruninx, K.; De Grève, Z.; Vallée, F. Enhanced integration of flow-based market coupling in short-term adequacy assessment. Electr. Power Syst. Res. 2021, 201, 107507. [Google Scholar] [CrossRef]
  67. Vajdić, M.; Kelava, M. Development and Impact of Flow-Based Methodology in Core Region. J. Energy Energ. 2020, 69, 4. [Google Scholar] [CrossRef]
  68. European Commission, Directorate-General for Energy. The Future Electricity Intraday Market Design. Publications Office. 2019. Available online: https://data.europa.eu/doi/10.2833/004191 (accessed on 7 February 2023).
  69. 2020. Available online: https://data.efet.org//Files/Documents/Electricity%20Market/Spot%20and%20short-term%20markets/EFET_ID_MarketDesign_06052020.pdf (accessed on 7 February 2023).
  70. ENTSO-E. European Cross-Border Intraday (XBID) Solution Trades Exceed 2.5 Million Since Go-Live. 2018. Available online: https://www.entsoe.eu/news/2018/09/06/european-cross-border-intraday-xbid-solution-trades-exceed-2-5-million-since-go-live/ (accessed on 7 February 2023).
  71. NEMO Commitee. Single Intraday Coupling (SIDC). 2021. Available online: https://www.nemo-committee.eu/sidc (accessed on 7 February 2023).
  72. ENTSO-E. Single Intraday Coupling (SIDC). 2021. Available online: https://www.entsoe.eu/network_codes/cacm/implementation/sidc/ (accessed on 7 February 2023).
  73. ENTSO-E. Electricity Balancing in Europe—ENTSO-E Releases an Overview of the European Electricity Balancing Market and Guideline. 2018. Available online: https://www.entsoe.eu/news/2018/12/12/electricity-balancing-in-europe-entso-e-releases-an-overview-of-the-european-electricity-balancing-market-and-guideline/ (accessed on 7 February 2023).
  74. ENTSO-E. Balancing Report. 2020. Available online: https://eepublicdownloads.azureedge.net/clean-documents/Publications/Market%20Committee%20publications/ENTSO-E_Balancing_Report_2020.pdf (accessed on 7 February 2023).
  75. ACER. Decision No 11/2020 on the Methodology for a List of Standard Products for Balancing Capacity for Frequency Restoration Reserves and Replacement Reserves. 2020. Available online: https://documents.acer.europa.eu/Official_documents/Acts_of_the_Agency/Individual%20decisions/ACER%20Decision%2011-2020%20on%20standard%20products%20for%20balancing%20capacity.pdf (accessed on 7 February 2023).
  76. Single Electricity Market Committee. System Services-Future Arrangement Scoping Paper, SEM-20-044. 2020. Available online: https://www.semcommittee.com/sites/semc/files/media-files/SEM-20-044%20System%20services%20future%20arrangements%20scoping%20paper.pdf (accessed on 7 February 2023).
  77. ENTSO-E. All TSOs’ Proposal for the Implementation Framework for a European Platform for the Exchange of Balancing Energy from Frequency Restoration Reserves with Automatic Activation in Accordance with Article 21 of Commission Regulation (EU) 2017/2195 Establishing a Guideline on Electricity Balancing. 2018. Available online: https://eepublicdownloads.entsoe.eu/clean-documents/nc-tasks/EBGL/EBGL_A21_181218_ALL%20TSOs%20proposal_aFRRIF_explanatory_document_for%20submission.pdf?Web=0 (accessed on 7 February 2023).
  78. ENTSO-E. Explanatory Document of Proposals for Amendement of the Implementation Frameworks for the European Balancing Platforms in Accordance with Articles 20(1), 21(1) and 22(1) of Commission Regulation (EU) 2017/2195 Establishing a Guideline on Electricity Balancing. 2021. Available online: https://consultations.entsoe.eu/markets/mfrr_afrr_in_if_amendment/supporting_documents/PfA_IFs_Explanatory%20document.pdf (accessed on 7 February 2023).
  79. ENTSO-E. Automatic Frequency Restoration Reserve Process Implementation Guide. 2019. Available online: https://eepublicdownloads.entsoe.eu/clean-documents/EDI/Library/ERRP/Automatic_Frequency_Restoration_Reserve_Process_IG_v1.0.pdf (accessed on 7 February 2023).
  80. ENTSO-E. PICASSO Platform. 2021. Available online: https://www.entsoe.eu/network_codes/eb/picasso/ (accessed on 7 February 2023).
  81. ENTSO-E. MARI Platform. 2021. Available online: https://www.entsoe.eu/network_codes/eb/mari/ (accessed on 7 February 2023).
  82. ENTSO-E. TERRE Platform. 2021. Available online: https://www.entsoe.eu/network_codes/eb/terre/ (accessed on 7 February 2023).
  83. Florence School of Regulation. The EU Electricity Network Codes. 2017. Available online: https://www.scribd.com/document/364124461/FSR-NC-Course-Text (accessed on 7 February 2023).
  84. HEnEx. Towards the Integration of Greek and EU Energy Markets—Policy Briefs. 2019. Available online: https://www.haee.gr/media/4859/policy-brief-henex_-final-244201.pdf (accessed on 7 February 2023).
  85. IPTO. The European Target Model. 2017. Available online: https://www.admie.gr/en/market/general/description (accessed on 7 February 2023).
  86. EnEx. Derivatives Markets Trading. 2021. Available online: https://www.enexgroup.gr/derivatives_trading (accessed on 7 February 2023).
  87. Ioannidis, F.; Kosmidou, K.; Makridou, G.; Andriosopoulos, K. Market design of an energy exchange: The case of Greece. Energy Policy 2019, 133, 110887. [Google Scholar] [CrossRef]
  88. EnEx. Electricity Derivatives, Day-Ahead and Intra-Day Markets Operation under Target Model. 2019. Available online: https://energypress.gr/sites/default/files/media/002_-_papadionysiou_exe_-_final.pdf (accessed on 7 February 2023).
  89. EPEX SPOT. Extension of Single Day-Ahead Coupling (SDAC) to Greece—Go-Live Planned for 15 December 2020. 2020. Available online: https://www.epexspot.com/en/news/extension-single-day-ahead-coupling-sdac-greece-go-live-planned-15-december-2020 (accessed on 7 February 2023).
  90. Koltsaklis, N.; Dagoumas, A. Policy Implications of Power Exchanges on Operational Scheduling: Evaluating EUPHEMIA’s Market Products in Case of Greece. Energies 2018, 11, 2715. [Google Scholar] [CrossRef] [Green Version]
  91. NEMO Commitee. EUPHEMIA Public Description: Single Price Coupling Algorithm. 2020. Available online: https://www.nordpoolgroup.com/globalassets/download-center/single-day-ahead-coupling/euphemia-public-description.pdf (accessed on 7 February 2023).
  92. IPTO. Technical Limits for Bidding Prices and Clearing Prices in the Balancing Market—Ver. 1.0. 2020. Available online: https://www.admie.gr/sites/default/files/users/dda/KAE/TECHNICAL%20LIMITS_EN.pdf (accessed on 7 February 2023).
  93. ECCO International. Detailed Level Market Design of the Hellenic Forward, Day-Ahead and Intraday Markets and Respective Market Codes and High-Level IT. 2017. Intra-Day Market Code: JRC/PTT/2017/C.3/0017/OC, Vol. 4.. Available online: https://www.dapeep.gr/wpcontent/uploads/diavouleuseis/2017/2017.12.18INTRADAYMARKETCODEENGLISH.pdf (accessed on 7 February 2023).
  94. Vespucci, M.T.; Innorta, M.; Cervigni, G. A Mixed Integer Linear Programming model of a zonal electricity market with a dominant producer. Energy Econ. 2013, 35, 35–41. [Google Scholar] [CrossRef]
  95. IPTO. Balancing Market Rulebook—Ver. 3.0. 2020. Available online: https://www.admie.gr/sites/default/files/users/dda/KAE/Balancing%20Market%20Rulebook_v3.pdf (accessed on 7 February 2023).
  96. IPTO. System Balancing. 2021. Available online: https://www.admie.gr/en/market/general/capacity-calculation (accessed on 7 February 2023).
  97. HEnEx. Markets Archive. 2022. Available online: https://www.enexgroup.gr/web/guest/markets-archive (accessed on 7 February 2023).
  98. IPTO. Market Statistics—Data. 2022. Available online: https://www.admie.gr/en/market/market-statistics/detail-data (accessed on 7 February 2023).
  99. Makrygiorgou, D.I.; Andriopoulos, N.; Georgantas, I.; Dikaiakos, C.; Papaioannou, G.P. Cross-Border Electricity Trading in Southeast Europe Towards an Internal European Market. Energies 2020, 13, 6653. [Google Scholar] [CrossRef]
  100. Knaut, A.; Paschmann, M. Price volatility in commodity markets with restricted participation. Energy Econ. 2019, 81, 37–51. [Google Scholar] [CrossRef] [Green Version]
  101. RAE. RAE DECISION NO. 54/2021—Amendment of the Balancing Market Regulation: Adoption of Measures Aimed at the Smooth Operation of the Balancing Market and the Promotion of Effective Competition in It. 2021. Available online: https://www.rae.gr/apofaseis/8083/ (accessed on 7 February 2023).
  102. Agostini, M.; Bertolini, M.; Coppo, M.; Fontini, F. The participation of small-scale variable distributed renewable energy sources to the balancing services market. Energy Econ. 2021, 97, 105208. [Google Scholar] [CrossRef]
  103. Guo, B.; Weeks, M. Dynamic tariffs, demand response, and regulation in retail electricity markets. Energy Econ. 2022, 106, 105774. [Google Scholar] [CrossRef]
  104. Neetzow, P.; Pechan, A.; Eisenack, K. Electricity storage and transmission: Complements or substitutes? Energy Econ. 2018, 76, 367–377. [Google Scholar] [CrossRef] [Green Version]
  105. Polemis, M.L.; Dagoumas, A.S. The electricity consumption and economic growth nexus: Evidence from Greece. Energy Policy 2013, 62, 798–808. [Google Scholar] [CrossRef]
  106. EnergyPress. HEDNO preparing to Announce Latest Smart Meters Tender. 2020. Available online: https://energypress.eu/hedno-to-announce-new-smart-meters-tender-backed-by-recovery-fund/ (accessed on 7 February 2023).
  107. HEDNO. Metering Systems Modernization. 2021. Available online: https://deddie.gr/en/stratigiki-eksugxronismos/eksugxronismos/eksugxronismos-metritikwn-sustimatwn/ (accessed on 7 February 2023).
  108. Nicolli, F.; Vona, F. Energy market liberalization and renewable energy policies in OECD countries. Energy Policy 2019, 128, 853–867. [Google Scholar] [CrossRef] [Green Version]
  109. Andriopoulos, N.; Bachoumis, A.; Alefragis, P.; Birbas, A. Optimization of a Local Energy Market Operation in a Transactive Energy Environment. In Proceedings of the 17th International Conference on the European Energy Market (EEM), Stockholm, Sweden, 16–18 September 2020; pp. 1–6. [Google Scholar]
  110. Duch-Brown, N.; Rossetti, F. Digital platforms across the European regional energy markets. Energy Policy 2020, 144, 111612. [Google Scholar] [CrossRef]
Figure 1. The Greek electricity market liberalization process.
Sustainability 15 03767 g001
Figure 2. Target model general architecture.
Sustainability 15 03767 g002
Figure 3. Members of the single day-ahead coupling (SDAC) [63].
Sustainability 15 03767 g003
Figure 4. Members of the cross-border intraday (XBID) trading solution and the single intra-day coupling (SIDC) [70,71,72].
Sustainability 15 03767 g004
Figure 5. Interconnections through the sequence of markets in Greece [87].
Sustainability 15 03767 g005
Figure 6. Timeframes of the applied auctions through the sequence of markets in Greece.
Sustainability 15 03767 g006
Figure 7. Greek DAM results per market time unit on 23 September 2021 [97].
Sustainability 15 03767 g007
Figure 8. Greek DAM results per market time unit on 23 September 2021 [97].
Sustainability 15 03767 g008
Figure 9. The scheduled volumes for imports and exports within the Greek DAM on 23 September 2021 [97].
Sustainability 15 03767 g009
Figure 10. The first CRIDA results within the Greek IDM on 23 September 2021 [97].
Sustainability 15 03767 g010
Figure 11. The second CRIDA results within the Greek IDM on 23 September 2021 [97].
Sustainability 15 03767 g011
Figure 12. The third CRIDA results within the Greek IDM on 23 September 2021 [97].
Sustainability 15 03767 g012
Figure 13. The first ISP results within the Greek balancing capacity market on 23 September 2021 [98].
Sustainability 15 03767 g013
Figure 14. The second ISP results within the Greek balancing capacity market on 23 September 2021 [98].
Sustainability 15 03767 g014
Figure 15. The third ISP results within the Greek balancing capacity market on 23 September 2021 [98].
Sustainability 15 03767 g015
Figure 16. The average values of the activated reserves within the Greek balancing capacity market on 23 September 2021 [98].
Sustainability 15 03767 g016
Figure 17. Balancing energy market results on 23 September 2021 [98].
Sustainability 15 03767 g017
Figure 18. The actual system load on 23 September 2021 [98].
Sustainability 15 03767 g018
Figure 19. The actual volumes of RES production on 23 September 2021 [98].
Sustainability 15 03767 g019
Figure 20. The actual volumes of the conducted imports and exports on 23 September 2021 [98].
Sustainability 15 03767 g020
Figure 21. The actual production and consumption mix on 23 September 2021 [98].
Sustainability 15 03767 g021
Figure 22. The volumes traded and the resulting prices within the IDM via the CRIDAs and the XBID solution (December 2022–January 2023) [97,98].
Sustainability 15 03767 g022
Figure 23. The average volumes traded within the DAM, the IDM, and the BM (November 2020–November 2021) [97,98].
Sustainability 15 03767 g023
Figure 24. The average prices of the DAM, the IDM, and the BM (November 2020–November 2021) [97,98].
Sustainability 15 03767 g024
Table 1. Greek forward market results on 23 September 2021 [97].
InstrumentTotal OrdersMax PriceMin PriceAVG PriceTotal Quotes
GREBM10212157154155.51
GREBM11212171.5167.5169.51
GREBQ42149160150.4158.37
GREBY222115110112.51
GREPM10212164.75160.25162.51
GREPQ42116172.13166.65169.278
GREPY222122.75116.25119.51
Disclaimer/Publisher’s Note: The statements, opinions and data contained in all publications are solely those of the individual author(s) and contributor(s) and not of MDPI and/or the editor(s). MDPI and/or the editor(s) disclaim responsibility for any injury to people or property resulting from any ideas, methods, instructions or products referred to in the content.

