1. Introduction
Climate change, pollution, and nature loss are some of the most severe environmental threats to humanity today. The effects of these issues are being seen all over the world in the form of natural disasters, air pollution in cities, desertification, the global retreat of glaciers, and rising sea levels.
Therefore, the evident climate alterations need political actions to prevent climate change-related impacts. Moreover, it is necessary to reverse course, adopting policies that aim to drastically reduce pollution, CO2 emissions, and energy consumption.
The European Union (EU) has been at the forefront of international efforts to fight climate change. The EU and its Member States ratified the 2015 Paris Agreement, according to which nations must maintain global warming at well below 2 °C and preferably limit it to 1.5 °C above pre-industrial levels. Moreover, the EU has set other ambitious targets, aiming to reduce its total emissions by 40% compared to 1990 by 2030. However, according to the latest reports from the United Nations Environment Programme [
1] and the Intergovernmental Panel on Climate Change (IPCC) [
2], unless there are immediate, rapid, and large-scale reductions in greenhouse gas emissions, the goal of limiting global warming to around 1.5 °C or even 2 °C will be out of reach.
In fact, despite repeated appeals from scientists and activists, states have taken little action to mitigate climate change impacts. The ideological polarization around climate change [
3], the lack of funds to undertake a sustainability transition, and the low perception of climate change risk [
4] are the main reasons for the inaction of authorities, policymakers, manufacturing companies, and even citizens.
However, urban areas are emerging as the “first responders” in adapting to and mitigating climate change, leading the way in climate change action [
5].
In fact, cities are particularly vulnerable to climate change effects; some climate change consequences, such as heatwaves and floods, can be amplified in cities.
At the same time, urban areas are responsible for 75% of global carbon emissions. This percentage will grow as urbanization trends continue. The United Nations estimated that, by 2050, 68% of the world’s population will live in urban areas [
6].
Therefore, actions in cities—i.e., the key contributors to climate change—are of fundamental importance for changing the course of future events. Cities could thus not only be the cause of but also part of the solution to climate change. Indeed, cities are centers of technology and innovation and have the tools and resources to tackle climate change challenges [
7].
A winning approach in the fight against climate change is thinking globally and acting locally, respecting large-geographical-scale planning but leaving the responsibility for the actions to local communities [
8].
Therefore, cities need to develop urban resilience to climate change, and local authorities must put in place actions that can aid efforts towards climate change mitigation and adaptation.
Reducing climate change inaction is thus a challenge that cities all over the world must take up. A political push for European cities to take up this challenge has been implemented by the EU through many political and legislative actions and regulatory and economic measures for several activity sectors.
Among these initiatives, the European Commission has promoted the Covenant of Mayors since 2008. In December 2022, this initiative gathered 10,962 local authorities (
https://www.covenantofmayors.eu (accessed on 11 December 2022)). One of the key success factors is the direct participation of local authorities. Covenant signatories voluntarily commit to reducing greenhouse gas emissions by 40% by 2030 through actions detailed in a Sustainable Energy and Climate Action Plan (SECAP), which must be adopted by the municipality within two years of signing.
Policies and actions that local authorities want to implement to reduce emissions must be described and programmed by this plan. The target sectors are buildings, local electricity production and heating/cooling generation, public procurement, land use planning, information and communication technologies, and waste.
However, local authorities who want to join the Covenant of Mayors face a difficult task during the drafting of a SECAP; namely, comparing actions related to different activity sectors or, in any case, actions that may be very different from each other even if they are part of the same activity sector. Therefore, our research questions were:
(1) How can the possible actions to be implemented in order to achieve the objectives set by the Covenant of Mayors be selected?
(2) Which methods can support policymakers in decision-making processes during the development of SECAPs?
This study employed an analytic hierarchy process (AHP)-based methodology, which has already been described in [
9], to analyze a case study with the aim of demonstrating its validity in supporting local authorities in identifying the transport-related actions to be implemented in Action Plans. Local authorities deal with limited economic resources; the methodology allows policymakers to establish which priority actions must be funded to achieve the goals of reducing emissions and increasing energy efficiency. Moreover, the second aim of the study was to highlight the role that geographic information systems (GISs) can play during the development of a SECAP, describing several GIS-based methodologies that can support local authorities’ decision making.
The transport sector was considered in this study, providing a valid tool to help local authorities choose better and more cost-effective actions to reduce emissions and energy consumption from among the most significant mobility policies or infrastructure measures that can be adopted by municipalities. In fact, transport is among the greatest contributors to global carbon emissions in the EU-28.
The remainder of the paper is organized as follows.
Section 2 gives a brief overview of the multi-criteria decision-making methods adopted in the development of SECAPs. The hybrid AHP method is outlined in
Section 3; this section begins by examining the transport-related actions that can be implemented to reduce emissions and energy consumption. The value of GISs as decision support tools when developing SECAPs is illustrated in
Section 4. To better understand how the AHP-based method can support decisions, a case study is presented in
Section 5, and the results are discussed in
Section 6. Conclusions and opportunities for future research are presented in
Section 7.
2. Literature Review
Developing a SECAP is a decision-making problem [
10]. Local authorities have to identify the best set of actions for reaching their long-term CO
2 reduction targets. This decision-making process involves some uncertainty and multiple stakeholders, encompassing individual perspectives and contexts; thus, it must be guided by a structured approach.
Multiple criteria decision aid (MCDA) methods can be important supportive tools in policymaking, making it possible to estimate which impacts various alternative scenarios have in terms of environmental, economic, and social sustainability [
11].
A method for SECAP development was developed and tested within the Life Adaptate project [
12]. This method can be divided into three steps: the identification of local climate change risks and vulnerabilities, the identification of the adaptation actions to be implemented, and the finalization of the SECAP. The overall process heavily relied on stakeholder participation, as a public stakeholder meeting was organized during every phase of the process. In the second step, a multicriteria analysis was performed by stakeholders to evaluate all relevant actions; it considered the following nine criteria: effectiveness, efficiency, equity, flexibility, legitimacy, urgency, synergies, costs, and funding. Stakeholders chose whether weights were assigned to each criterion or whether all criteria would be considered equal, and the highest-rated actions were included in the SECAP.
The Life Adaptate project used the Technique for Order of Preference by Similarity to Ideal Solution (TOPSIS) methodology in the multi-criteria decision-making to weight each criterion and compare actions. In this method, an alternative is chosen if it has the shortest distance from the positive ideal solution and the greatest distance from the negative ideal solution. However, in the transport sector, it is difficult to find an ideal positive or negative scenario; for example, considering public transport speed or private vehicles’ speed as criteria for comparing transport-related actions, it is difficult to define ideal values for these speeds.
Among the multi-criteria decision-making methods, the AHP method developed by Thomas L. Saaty [
13,
14] in the late 1970s allows a set of alternatives to be prioritized with respect to their contributions to achieving a goal, considering several criteria and sub-criteria.
A peculiarity of the AHP method is the hierarchical structure based on several levels: the highest level represents the main objective to be achieved, the intermediate levels are the criteria with which decisions regarding the different options are made, and the lowest level is the list of alternatives, which must be compared with each other by means of the criteria and sub-criteria. The AHP method developed by Saaty involves the pairwise comparison of the elements at each level of the hierarchy with those of the upper level using the Saaty Scale.
In the literature, there are many examples of the application of the AHP method in the transport sector. A review of the literature on this topic is provided by Baric et al. [
15]. Awashti and Chauhan [
16] evaluated the impact of environment-friendly transport measures on city sustainability using a hybrid AHP-based approach. Ignaccolo et al. [
17] combined the AHP method with role-playing games to simulate the engagement of stakeholders in transport decisions.
Several researchers have combined the AHP method with GISs. For example, Melese and Belay [
18] assessed and delineated a groundwater recharge zone through the integration of the AHP method in a GIS environment. They obtained potential zones for groundwater by building several thematic layers in GIS software and then weighting these layers using the AHP technique. A similar approach to delineating a groundwater potential zone was adopted by Saranya and Saravanan [
19]. Aidinidou et al. [
20] prioritized flood mitigation projects in high-risk areas by using the GIS-based AHP approach. Kamdar et al. [
21] used an integrated GIS–AHP approach to run a suitability analysis and find suitable landfill sites.
In the transport sector, Oswald Beiler and Threat [
22] formalized the project prioritization process using an integrative GIS and AHP approach.
The AHP methodology could be one of the most flexible multi-criteria decision-making methods available to solve the problems related to the development of SECAPs. In fact, the AHP method makes it possible to combine a participatory approach with an analytical tool when comparing alternative actions. Thus, our paper aims to demonstrate the application of a hybrid AHP approach for the development of an SECAP and the comparison of transport-related actions. To the best of our knowledge, only the authors of [
9] have proposed a hybrid AHP method for these purposes, but this was only from a theoretical point of view; therefore, this paper aims to expand on the previous study, applying the method to a case study.
3. The Hybrid AHP-Based Approach
As stated in the Literature Review section, the AHP method appears to be a promising tool for the identification of actions to be included in a SECAP.
Before presenting the case study, we describe the hybrid AHP method proposed in [
9]; it consists of the following steps:
Goal definition;
Identification of possible actions to be included in the SECAP;
Engagement with stakeholders in the selection of criteria and sub-criteria (indicators);
Definition of the weights assigned to criteria and sub-criteria;
Application of the hybrid AHP process through pairwise comparisons between the actions.
The method leads to the assessment of the best actions to include in a SECAP.
The steps are shown in
Figure 1, highlighting the roles that urban planners, policymakers, and stakeholders play in the different phases of the method.
The first task for policymakers and urban planners is the definition of the goal. The goal is the first level of the hierarchical structure of the AHP method. Since the developed methodology aims to identify the most effective actions to include in a SECAP, the goal at the top of the hierarchy is represented by the optimal allocation of economic resources.
The second step that the decision makers have to undertake is identifying the possible actions to be included in the SECAP and to be compared through the AHP method. In fact, many transport-related actions can be implemented to reduce greenhouse gas emissions and energy consumption. First, a ”brainstorming” session should be held to list all the relevant actions. This preliminary phase is crucial to avoid the application of the AHP method consuming significant amounts of time; only realistic actions that can be implemented in the short or medium term—i.e., options that are technically and economically possible for the local authorities—should be considered. Reviewing the SECAPs approved by various local authorities and identifying the actions mentioned in them could be a valid way to list all the relevant actions. A list of possible actions is reported in [
9].
Some actions aim to improve the quality of public transport services in order to increase the number of users who choose them as alternatives to private cars, especially for commuting trips. For example, introducing reserved bus lanes could make public transport more attractive, allowing an increase in vehicle speed and lower waiting times at stops for users.
Other policies aim to discourage the use of private cars, which are the main cause of congestion and pollution in urban areas. The introduction of restricted traffic areas and road pricing make it possible to reduce the presence of cars and the emission levels in certain areas of cities.
Promoting walking and cycling, as well as shared mobility services, as complements to public transportation can be effective actions to reduce emissions. Local authorities can also put in place policies to encourage the gradual renewal of the private vehicles in circulation and of the public transport fleet. Finally, freight transport also strongly contributes to producing emissions in cities; thus, an effective action could be the rationalization of urban freight transport.
Finally, while developing a SECAP, local authorities must take into account the policies selected by the Sustainable Urban Mobility Plan (SUMP) and other mobility plans and quantify how much they contribute to reducing emissions. They can also broaden the range of policies already financed and propose new ones. Therefore, horizontal coherence between the plans adopted by local authorities must be considered, avoiding contradictions, identifying specific areas of interaction, and achieving synergy between the plans. In this way, the SECAP can be considered a follow-up to or an execution or integration of the transport strategies and policies included in the mobility plans.
Therefore, the actions generally envisaged in the urban traffic plans and reference scenarios of SUMPs need to be considered. These actions also include all the policies and infrastructural interventions selected for the SUMP and already funded, as well as the less expensive short-term measures selected for the urban traffic plans.
The actions to be compared through the AHP method are the fourth level of the hierarchy.
Once the goal and the possible actions that local authorities could put in place are defined, the criteria (second level of the hierarchical structure of the AHP method) and the indicators (third level) for comparing the transport-related actions with each other and with those related to the other sectors covered by the SECAP need to be identified.
The study by Giaccone et al. [
23] was considered as a starting point. The authors identified various criteria and indicators for the comparison of actions relating to the building sector in the development of the Sicily Regional Energy Master Plan.
We considered the following criteria for comparison:
Reductions in energy consumption and environmental sustainability are the main goals of SECAPs; therefore, the inclusion of the energy and environment areas is easy to understand.
The economy criterion was considered since policies also need to be compared from an economic point of view; as already mentioned, local authorities often face funding shortfalls.
Finally, each action affects the quality of life of citizens and this impact must be considered since the success of some policies also depends on it.
Moving on to the next level of the hierarchy, the sub-criteria were identified.
Impact indicators (measuring how much the actions contribute to reducing energy consumption, reducing emissions, and improving quality of life) and cost-efficiency indicators need to be considered to identify priority measures.
The indicators need to be defined through the involvement of stakeholders. The stakeholders could decide which indicators need to be considered in the comparison of actions.
In fact, the involvement of stakeholders is a fundamental step in the development of SECAPs [
24]; representatives of city planning departments, the regional government, and universities; experts from the transport sector; representatives of the main companies operating in the transport sector and of the major environmental institutions; trades unions; and groups that promote sustainable mobility need to be involved during the planning phase.
The process of involving stakeholders can lead to a set of indicators suitable for the specific urban context.
The next step of the methodology involves assigning weights to criteria and sub-criteria (indicators). In fact, the methodology provides for the adoption of local weights L2 for second-level elements (criteria) and local weights L3 for third-level elements. In this phase, our method differed from the traditional AHP methodology. Indeed, we propose a hybrid scheme for the AHP method.
Experts do not use the Saaty scale to compare the elements of the second level (criteria) with those of the first level (objective) and the elements of the third level (sub-criteria) with those of the second (criteria) two-by-two. A different method is used to assign the local weights to criteria and sub-criteria:
The local weights L2 of the criteria are assigned by taking into consideration the number of sub-criteria (indicators) for each criterion and the total number of indicators. Therefore, they are equal to n/m, where n is the number of indicators for a single criterion and m is the total number of indicators. For example, if four indicators belong to the criterion energy and a total of eight indicators are used, the local weight L2 for this criterion is 0.5 (=4/8);
The local weights L3 to be assigned to indicators are established by the stakeholders through a debate. In this debate, participants are asked to vote on which sub-criterion (indicator) has greater relevance for each criterion; the weight of each indicator is obtained as a percentage by counting the number of preferences obtained for it in relation to the total number of votes (i.e., the total number of stakeholders).
The sum of the weights assigned to all the criteria must be equal to 1, just as the sum of the weights assigned to the indicators belonging to a criterion must be equal to 1.
The role of stakeholders made the method generalizable and usable by every local authority developing a SECAP within the Covenant of Mayors. In fact, depending on the sources of CO2 in the municipal area and the available resources, some policies and some indicators will be more appropriate for consideration than others, and the stakeholders will contribute to choosing the best options.
Once the weights have been defined, a pairwise comparison of the alternative actions from the fourth level is performed using the traditional AHP method. In the traditional AHP method, a consistency check must be applied and a consistency index calculated. This operation was superfluous here because the use of quantitative indicators ensured the consistency of the pairwise comparisons.
The actions, chosen by the decision maker on the basis of their feasibility and adaptation to the urban context, are compared in pairs by means of the indicators: for each indicator, a coefficient aij, which describes the relative importance of action i compared to action j, is assessed.
For example, comparing action 1 with action 2, a coefficient a12 = EN11/EN12 can be obtained for the indicator EN1, where EN11 and EN12 are the values that the indicator EN1 assumes for action 1 and for action 2, respectively.
This coefficient is calculated for each pair of actions, and a square nxn matrix (pairwise comparison matrix) is obtained for each indicator, where n is the number of actions. We thus have m matrices, with m being equal to the number of indicators.
Once the pairwise comparison matrices are filled, the eigenvectors of each of these matrices are determined to assess the local priorities. To determine the eigenvectors, we calculated their components
vi using an approximate solution with the following formula:
where
i = 1, …,
n and
n is the number of actions.
Then, the components of the eigenvectors were normalized by applying normalization factors
xi, calculated as follows:
where
The xi elements are the components of the local priority vector L4 for a certain indicator, which establishes the priority of the actions with respect to the indicator considered. Therefore, a local priority vector must be determined for each indicator.
At this point, to determine the global priority vector for each indicator, we multiplied the elements
xi of the local priority vector by the global weight of the element of the top level. For example, the global weight of the fourth level for indicator A would be calculated as:
where
Ggoal is the weight assigned to the goal, which is equal to 1 when there is only one goal. Then, for each action, the local weights assigned to the action are converted into global weights. All the global weights assigned to the action and referring to the various indicators are then added up to obtain the importance that the action has in achieving the main objective.
At the end of the process, it is possible to rank actions in order of priority: from the action that, with the lowest cost, provides greater contributions to energy saving, reducing emissions, and improving the quality of life of citizens to the one whose implementation involves lower benefits and higher costs. Policymakers can, therefore, use this method to determine the interventions to be included in the action plan and to be implemented as a priority.
4. GIS-Based Methods for the Support of Decisions during the Development of a SECAP
GISs are also a valid tool that can be used during the drafting of a SECAP. Firstly, GISs can be useful to promote community participation and increase awareness of the SECAP at a local level, especially among marginalized populations, facilitating interactive participation through the use of simplified GIS-based maps and models. In this way, GISs can be used to visualize the effects of the SECAP at local levels.
Furthermore, the actions that need to be compared should be designed in such a way that their impacts can be evaluated and compared with each other through the AHP process. In the designing phases of some policies, such as for the introduction of carsharing and bikesharing services, GIS software may represent a valid aid.
For example, station-based carsharing services can be designed following a methodology developed entirely in a GIS environment [
25]. In fact, a suitability analysis can be carried out in order to identify the most suitable areas for the stations of a station-based carsharing service. The approach involves discretizing the space with an orthogonal grid, dividing the urban area into
n square cells with side lengths corresponding to the maximum distance that carsharing users will be willing to walk on average to reach the nearest carsharing station. The suitability of the
n grid cells for siting one or more carsharing stations is determined based on the ability of these cells to generate carsharing demand that can justify the siting of a station.
Therefore, it is necessary to accurately determine the demographic profiles of the service’s target customers, since carsharing demand arises mainly from these users. In the suitability analysis, each grid cell is assigned a suitability score ranging from 0 to 1, depending on the extent to which the inhabitants of the grid cell match the profile of the target user.
Thus, GISs can be used to locate stations in the areas that express carsharing demand, and this demand can also be estimated using a catchment area approach with a GIS [
26]. Moreover, the optimization of the location and the determination of the number of carsharing stations needed to cover demand can be performed using GIS software. This problem can be solved as a location–allocation problem. In this way, the minimum number of carsharing stations needed to cover demand, their locations, and the number of potential users can be assessed and used as input data to estimate the reduction in energy consumption and emissions and the investment cost.
The same approach can be adopted for dock-based bike-sharing services.
Even the creation of new cycle paths can be supported by GIS technology. The method described in [
27,
28] can be used to decide where to construct new cycle paths.
The GIS-based design of new cycle paths must take into account the following factors to identify the routes that the new cycle paths can follow: technical constraints (roads with insufficient width, roads with high traffic flows, absence of safe cycle crossings, topography); the interaction with the vehicular flow, with the aim of situating the cycle paths along road axes that will not disturb the vehicular flow; the demand to be served, with the aim of connecting the cycle paths with the main points of interest (POIs) via the shortest route; and multimodality, aiming to situate cycle paths near the most important intermodal nodes, such as railway stations and tram stops. Only once the design of the new cycle paths is carried out can the impacts of the new cycle infrastructure be assessed.
Finally, another example of the use of GISs in the decision-making process for an SECAP is in finding the best actions to improve walkability [
29]. Macroscale and microscale walkability assessments can be performed using GIS software, identifying where walkability can be improved and which priority actions must be put in place.
5. Case Study
In order to show how the AHP-based methodology can help local authorities in developing SECAPs, a case study of a medium-large municipality that wanted to draw up a SECAP is here presented. This municipality had to choose which of the following transport-related actions to implement and include in the SECAP:
Action A—Introduction of 5 km of reserved bus lanes in a congested area by installing traffic lane separators. This action would cause a small modal shift towards public transport thanks to the improvement in the quality of public transport services on these roads, the reduction in bus delays and cancellations, and the reduction in travel time for users. The intervention would not involve a change in the frequencies of the bus lines. It was also assumed that the intervention would not affect the circulation of cars, although there would be a reduction in the available road space;
Action B—Introduction of a restricted traffic area of about 7 km2 in an urban area highly attractive to traffic flows. In its original condition, this area was unable to accommodate the traffic pressure during peak hours due to the shape of the road network, resulting in congestion. The restricted traffic area would be developed while ensuring adequate access methods without compromising the traffic circulation in the surrounding areas; this would mean identifying a peripheral route capable of absorbing the diverted motor traffic. Therefore, the implementation of this action would presuppose that the adjacent roads would have a residual capacity to accommodate vehicles that cannot access the restricted area without creating congestion during peak hours and that enough parking spaces would be available. Furthermore, it was assumed that the public transport system in the restricted area would have the residual capacity to accommodate users diverted from private cars. It was assumed that this action could reduce the traffic flow present in the current situation by 3000 cars/hour;
Action C—Introduction of a dock-based bikesharing system with 50 stations distributed throughout the city and 500 bikes. It was assumed that the action would attract users, causing a small modal split from private vehicles to bicycles. The bicycles would be regular bikes equipped with GPS and would have to be picked up and dropped off at docks. The pick-up of the bikes and the payment would be made via a mobile app. The usage fee would be per minute, with the first 30 min free. An annual subscription would be required. It was assumed that the average daily turnover rate would be two rentals per bike once the service was launched;
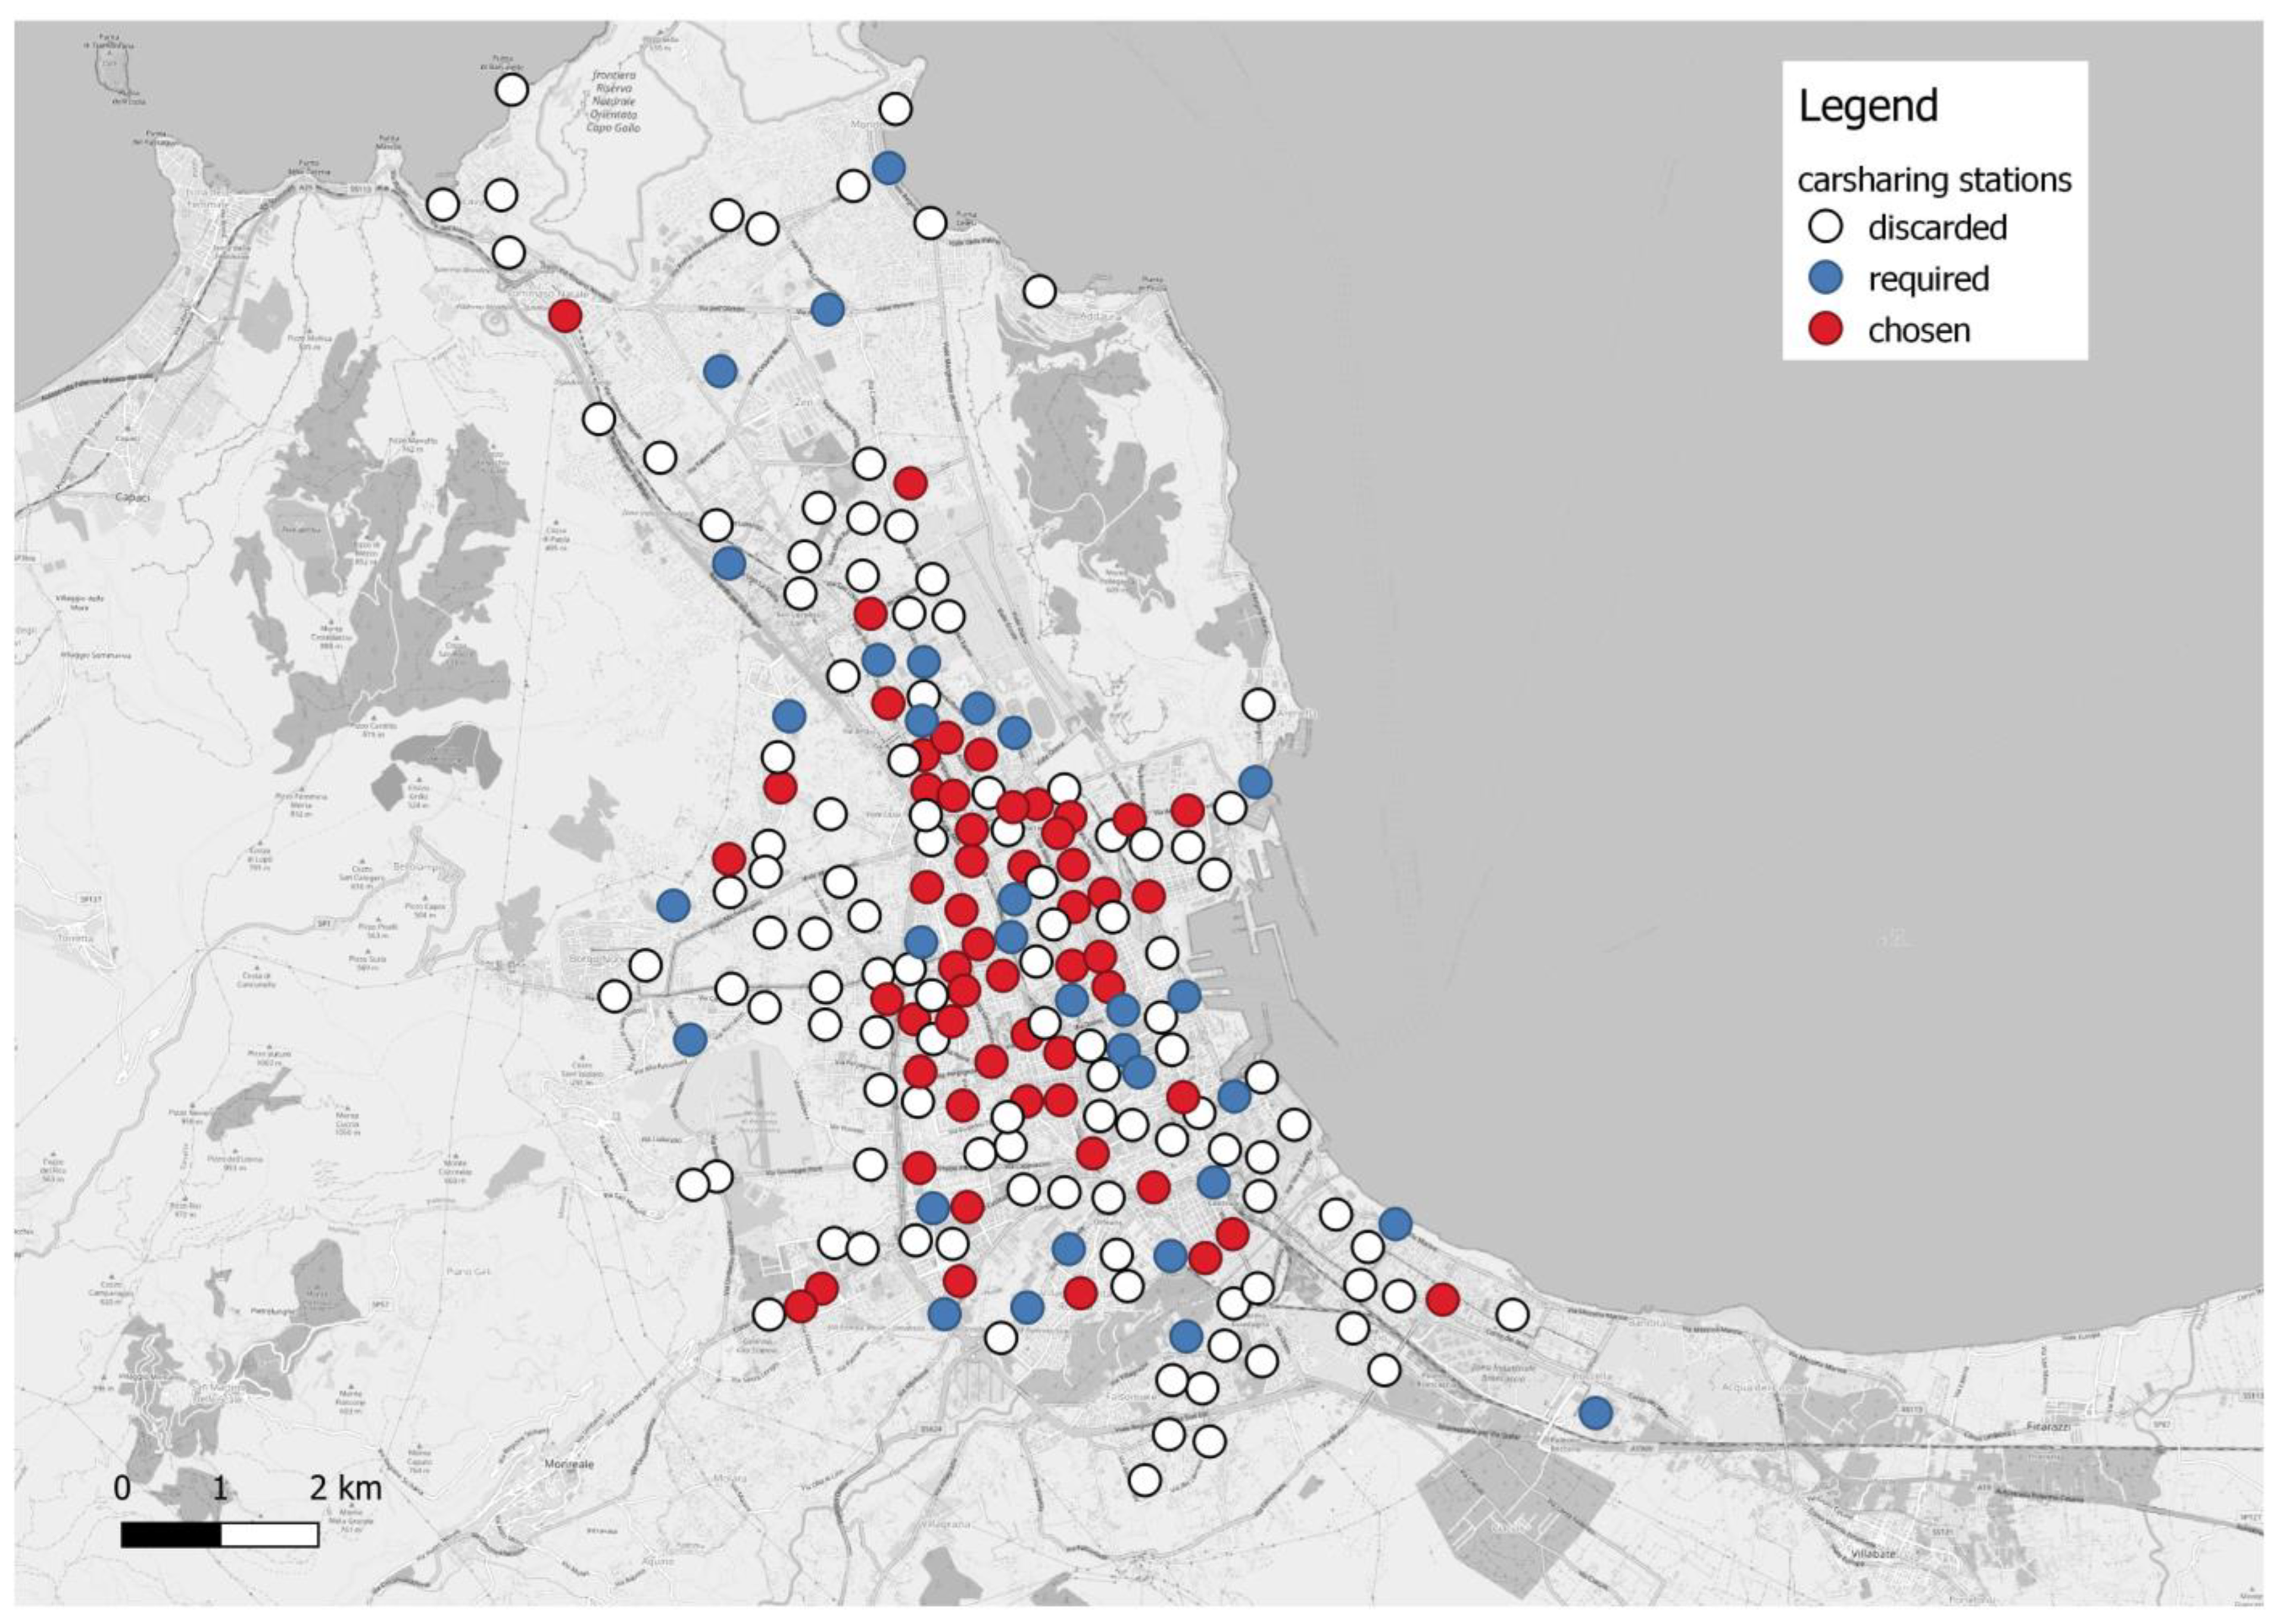
Action D—Introduction of a station-based carsharing system with 85 stations distributed throughout the city and 150 Euro 6 petrol cars available for users. The usage rate would consist of an hourly and a mileage rate. An annual subscription would be required. Users would book, pay, and unlock the car doors via a mobile application. The average number of subscribers was assumed to equal 4000 people;
Action E—Renewal of the bus fleet through the purchase of 70 new Euro 5 buses.
The main stakeholders, previously identified by the planners, were the representatives of the public transport companies operating in the city, the representatives of the shared mobility companies potentially interested in launching a service in the city, the representatives of the municipality and the region, organizations promoting the use of bicycles and other sustainable modes of transport, and representatives of universities dealing with transportation issues. In our case study, 54 stakeholders belonging to these groups participated in the meeting.
During the debate, the indicators chosen by the stakeholders were:
The total amount of energy saved over the life span of the action under consideration (EN1) for the energy criterion;
The CO2 emissions avoided over the life span of the proposed actions (ENV1) for the environment criterion;
The investment cost necessary to implement the individual actions (EC1) and the average cost for each toe saved (EC2) and for each tCO2 avoided (EC3) by 2030 for the economy criterion;
The average car speed (QL1) and the average speed of the public transport fleet (QL2) for the quality of life criterion.
The following developments also stemmed from the debate:
The goal of the methodology was set as prioritizing the transport-related actions and assessing which of them should be implemented and included in the SECAP. Stakeholders attributed a local weight equal to 1 to this goal;
Stakeholders did not want to attach more significance to a particular indicator than to the others belonging to the same criterion, and they associated the same importance for achieving the goal with all indicators. This meant that the stakeholders voted in such a way that all the alternative options had the same numbers of votes.
Table 1 reports the result of the vote, expressed as the percentage of stakeholders who voted for each indicator belonging to the four evaluation ambits, the total percentage being equal to 100 for each ambit. In this case, the local weights
L3 of the indicators were equal to 1/n, where n is the number of indicators belonging to a single criterion. Therefore, the local weights that the indicators assumed were 1 for
EN1 and
ENV1; 0.33 for
EC1,
EC2, and
EC3; and 0.5 for
QL1 and
QL2;
The local weights L2 of the criteria were assigned by taking into consideration the number of indicators for each criterion and the total number of sub-criteria. Therefore, the local weights of the criteria were 0.14 for energy (one indicator out of seven: 1/7 = 0.14), 0.14 for environment (one indicator out of seven: 1/7 = 0.14), 0.43 for economy (three indicators out of seven: 3/7 = 0.43), and 0.29 for quality of life (two indicators out of 7: 2/7 = 0.29).
The hierarchical structure of the AHP method for this case study is illustrated in
Figure 2.
To apply the methodology, the benefits in terms of CO2 emissions avoided each year and energy savings for each action had to be estimated. Input data were required and had to be estimated based on GIS-based methods and traditional transport surveys. These input data included the number of kilometers traveled using cars that it would be possible to avoid thanks to the actions, the turnover rates for bikesharing and carsharing, the average distances traveled during a bikesharing ride or a carsharing ride, the reduction in kilometers traveled with a private car after joining carsharing, the composition of the fleet in terms of emission standards and the difference from the average circulating fleet, the number of potential carsharing and bikesharing users, the number of new passengers attracted by public transport, and the difference in emissions between the new vehicles and the vehicles to be replaced.
A GIS could be used to determine the best locations for carsharing stations and the potential demand that the service would attract through the location-allocation algorithm that this software provides. A GIS could also be used to visualize this kind of data, as
Figure 3 shows.
To calculate energy savings and the CO
2 emissions avoided, the COPERT methodology or the average emission factors can be used, after having estimated the reduction in the number of kilometers travelled by private cars thanks to an action [
30]. For Italy, the emission factors officially available in the database of the average emission factors of road transport provided by the Italian National Institute for Environmental Protection and Research (
http://www.sinanet.isprambiente.it/it/sia-ispra/fetransp (accessed on 13 February 2023)) can be used.
We can discuss the case of bikesharing as an example: with a turnover rate of two rentals per bike per day, we estimated 365,000 rentals per year. Assuming an average trip length of 2.5 km, the kilometers traveled by bike per year by bikesharing users would be 912,500 km. We assumed that only 40% of these kilometers would be traveled by those who would give up the private car in favor of the bicycle, while the remaining 60% would derive from those using a bike instead of walking or public transport. In this case, the kilometers travelled by private cars that would be avoided in one year by all bikesharing users would be 365,000 km. By applying the average emission factor for private cars, which is equal to 167.11 gCO2/km, it was calculated that the action would lead to 60.99 tCO2/year avoided and avoided energy consumption of 232.78 MWh.
Table 2 shows the values that the indicators would assume for each action. It also shows the investment costs, as well as the average costs for one toe of energy saved and for one tCO
2 avoided. The investment costs were obtained by considering the cost of a single bus in the case of renewal of the public fleet; in the case of carsharing and bikesharing, it was assessed by considering the cost of purchasing the fleet vehicles, as well as the cost of the system for managing reservations and payments.
In the case of the restricted traffic area, the creation of infrastructure for the telematic control of access and electronic gates was evaluated. With regard to the introduction of reserved bus lanes, the cost of the installation of horizontal signage, the cost of purchasing lane separators and installing them, and the labor cost were taken into account.
Therefore, the values that the indicators would assume for the actions under comparison were assessed, considering ten years as the life span of the actions.
Table 3 presents these values. It should be noted that, for the indicators of the economy criterion, the inverses of the values were considered in order to use the same criterion as would be valid for the other indicators, whereby higher values correspond to greater benefits; this step was necessary because very high costs would otherwise be interpreted by the model as an advantage and not as a disadvantage.
With regard to indicators QL1 and QL2, it was assumed that the values in the absence of interventions were 16 km/h for private cars and 11 km/h for buses. This would be the situation of a medium-large city where congestion is an urgent issue. The speed increases were the result of how each action triggered a modal shift. For the determination of the increase in the speed of private vehicles after the implementation of each action, once the modal split was assessed, it was possible to assign the origin–destination matrix for rush hour in an average working day to the road network graph using a deterministic user equilibrium (this led to changes in the speed of private vehicles for restricted traffic areas, carsharing, and bikesharing). For public transport, the effect of a single action on the increase in the commercial speed of buses in the single road section was assessed and, subsequently, the benefits for the entire network (this led to changes in the speed of public transport for the restricted traffic area and the reserved bus lanes).
The pairwise comparison matrices were obtained for each indicator by calculating the coefficients a
ij. For example, for the
EN1 indicator, the coefficient
aA,B was equal to:
The matrix, therefore, took the following form:
Next, the eigenvector components were assessed. For example:
The eigenvector for the
EN1 indicator took the following form:
For normalization, the sum of the components of the eigenvector was calculated. For the EN1 indicator, it was equal to S = 14.764.
The local priority vector consisted of the normalization factors
xi = vi/S. The first normalization factor, for example, was equal to:
Therefore, the local priority vector for the
EN1 indicator took the following form:
A local priority vector had to be assessed for all the indicators by repeating the steps described so far.
To determine the global priority vector, assessment of the global weights was necessary. For the
EN1 indicator and action A:
Thus, all the global weights of each indicator were assessed for action A (,,,,,,). By adding these weights, the importance of action A for achieving the objective was assessed.
These steps were followed for all the actions. The priority ranking reported in
Table 4 was thus obtained. In this case study, the introduction of a restricted traffic area was the action that it would be best for the policymakers to implement as a priority and to which they should allocate resources in order to pursue the objective of reducing CO
2 emissions and energy consumption.
6. Results
The usefulness of the methodological approach can be better emphasized by comparing the ranking derived from the AHP process with those derived by considering only one criterion; in particular, economic ones.
Table 5 shows a comparison of the rankings.
As can be noted, the four rankings did not differ in the first and last places. The restricted traffic area was always in the first place because we considered as a case study a congested city with an underutilization of public transport and residual capacity. In the ranking based only on the economic indicator, the introduction of a carsharing service acquired a higher position than in the ranking based on the AHP methodology, overtaking the renewal of the fleet. If, on the other hand, only the benefits in terms of CO2 avoided and energy savings were considered, the central rankings would be very different, with the renewal of the fleet in second place, carsharing in third, and the introduction of reserved bus lanes in fourth place.
Therefore, the AHP methodology makes it possible to consider different criteria and renders the role of the stakeholders fundamental; by deciding the indicators to use and the weights to assign to the indicators and the criteria, the stakeholders can best find the optimal solution.
However, the stakeholders should have adequate numbers and be diversified by area of expertise and affiliation in order to be able to exclude votes that aim at favoring one action rather than another for personal convenience.
Therefore, a well-established procedure for the selection of stakeholders should be assessed with the aim of involving all the interested categories of stakeholders. Moreover, the choice of the indicators utilized directly depends on the stakeholders involved. They could mainly propose technical indicators due to their affiliations: in fact, they could be representatives of companies involved in the management and provision of transport services. Therefore, non-profit organizations and citizens’ organizations should also be involved in the decision process to properly include non-technical indicators, such as the indicators belonging to the quality of life ambit, related to social issues.
Obviously, the ranking we obtained using the hybrid AHP method directly derived from the choice of indicators and weights by the stakeholders involved in the case study. If other indicators were added or other weights resulted from the debate, the ranking would be very different. Thus, the phase of deciding on the indicators and weights is very delicate, and it is necessary to involve experts from the transport sector in order to achieve a balanced and rational decision.
To better explain the influence of the stakeholders’ choices of criteria and sub-criteria weights on the final ranking, a further analysis was performed. The original ranking was compared with those of two hypothetical scenarios in which it was assumed that the stakeholders assigned different weights. In particular, in scenario one (a green-oriented scenario), it was assumed that the stakeholders attributed higher weights to the energy and environment criteria, choosing fewer indicators for the economy and quality of life criteria (removing the EC1 and Q1 indicators). In this scenario, the weights for EN1, ENV1, EC2, EC3, and QL2 were 1.00, 1.00, 0.50, 0.50, and 1.00, respectively.
In scenario two (a cost-saving scenario), it was assumed that stakeholders attributed higher weights to the indicators related to investment costs (EC1) and car speed (Q1), leaving the number of indicators considered unchanged. In this scenario, the weights for EN1, ENV1, EC1, EC2, EC3, QL1, and QL2 were 1.00, 1.00, 0.90, 0.05, 0.05, 0.75, and 0.25, respectively.
Table 6 shows a comparison of the rankings obtained for the considered scenarios. It can be seen that the renewal of the public transport fleet and the promotion of carsharing gained positions in the green-oriented scenario, while bikesharing had a better rank than carsharing in the cost-saving scenario.
7. Conclusions
When involved in the process of developing a SECAP, local authorities must face a significant challenge: they must select the best actions to implement to achieve the goals set by the Covenant of Mayors. The range of possible actions is wide and economic resources are limited. Establishing which interventions are most effective in achieving the goals and where to allocate resources means assessing the priority actions. To do this, we proposed a method that makes it possible to compare the possible policies while considering the energy, environmental, economic, and social impacts.
This method is based on a hybrid AHP approach in which a fundamental role is played by stakeholders, who choose the criteria and sub-criteria for comparing the alternative actions and assign weights to them. Indeed, the involvement of the stakeholders is one of the main pillars of the development of SECAPs.
Among the various MCDA methods, we proposed this method for public administration because it combines ease of use with formal rigor, given its analytical structure based on eigenvalues, allowing the intrinsic comparison of the various actions proposed by means of a simple spreadsheet: therefore, everyone can use it, even those who are not specific experts in the field. Indeed, there are many studies in the literature, such as the study by Alkharabsheh et al. [
31], that have proposed other methods that make it possible to overcome the limitations of the AHP method. However, these methods often involve greater computational complexity; the hybrid AHP method proposed here is less computationally complex, making it easy to use by public administrators.
We refined the method used by Giaccone et al. [
23] by including an important novelty: the quality of life criterion. In this way, socially related issues and benefits deriving from the implementation of the actions were also considered.
A hybrid AHP method was developed using quantitative indicators to compare alternative actions and without using the Saaty scale required by the traditional AHP method. Therefore, expert stakeholders were involved in the choice of criteria and sub-criteria and in the definition of weights for them; however, the sub-criteria were quantitative indicators that could be assessed using measures or simulation tools, such as GIS-based tools.
In this way, one limitation of the traditional AHP methodology was overcome: pairwise comparisons between actions were not based on subjective judgments by experts, and the consistency of the judgments did not have to be checked. At the same time, the fundamental role of the stakeholders was guaranteed by their choice of weights for these indicators.
Furthermore, Italian legislation requires cities to measure some quantitative indicators belonging to the so-called “Sustainable Urban Mobility Plans”, and these indicators must be monitored. Thus, the hybrid AHP method could represent an easy tool that can be implemented by municipal administrations, since it can directly use indicators already in their possession.
The method is also adaptable to different urban contexts, since proper indicators can be chosen by stakeholders during the debate while considering energy consumers, emission sources, emission reduction targets, and monetary funds.
Moreover, the actions to be defined by a SECAP may belong to different sectors, such as transportation, the building sector, or waste. The hybrid AHP method here presented makes it possible to compare very different actions using quantitative indicators, leading to easier and more objective pairwise comparison of the actions associated with different sectors.
A case study was presented to demonstrate the validity of the AHP approach. In this case study, local authorities wanted to compare five possible actions for inclusion in the SECAP: the introduction of reserved bus lanes in a congested part of the city, the implementation of a restricted traffic area in the city center, the introduction of a dock-based bikesharing service, the introduction of a station-based carsharing service, and the renewal of the bus fleet. We found that a multi-criteria approach such as the AHP method led to a ranking of the actions that was very different from the rankings determined when considering only one criterion. Indeed, although the four rankings did not differ in their assignment of the first and last places, the renewal of the public transport fleet had a better rank using the AHP method compared to the rank that the introduction of a carsharing service had when considering the priority based on the indicator EUR/toe. This shows the importance of considering multiple criteria in transport-related decisions during the development of a SECAP.
In order to apply the method, the actions and policies involved in the pairwise comparisons have to be designed. Thus, the paper also showed how GISs are valid tools that can be used to design many of these policies and estimate their impacts.
The AHP method and GISs are, therefore, both useful tools during the development of SECAPs.
Future studies should focus on applying the methodology to other sectors. In fact, the methodology could also be extended to other sectors that are involved in the production of CO2 emissions and energy consumption, such as the waste or building sectors. In this way, local authorities will be able to compare very different actions belonging to different sectors with each other.


