
A BIM–LCA Approach for the Whole Design Process of Green Buildings in the Chinese Context

 , , ,
, , ,
Abstract
1. Introduction
2. State of the Art
2.1. BIM Based LCA/LCC Method

| Literature | BIM Tool | LCA Tool | Integrated Tool/Method | Data Source | Analysis with Green Building Rating System | Indicator | Results Feedback |
|---|---|---|---|---|---|---|---|
| Early design stage | |||||||
| [11] | Revit-Dynamo/MS Excel | - | A script in Dynamo | Ecoinvent/Swiss SIA MB 2032 | - | GWP | The potential to improve the total building impact is indicated by SDEV and color |
| [24] | Rhinoceros (Grasshopper) | - | Bombyx | Ökobilanzdaten im Bauberiich (KBOB) | - | UBP, PE-nr, PE-r, GWP | Values in Grasshopper |
| [30] | SketchUp/Rhinoceros; interface in ArchiCAD and Revit | - | CAALA | Ökobau.dat 2016 I, manually added EPD from users | - | PENRT, EP, AP, POCP, ODP, GWP | Comparison of variants, values, and proportion charts in results |
| [31] | Rhinoceros (Grasshopper) | - | - | Oekobau.dat database, Bauteilkatalog, Milieuprofiel van gebouwelemente, Baubook | DGNB | LCP | Equal to 100% of the DGNB points related LCA criteria. |
| [32] | Revit/MicrosoftAccess | Athena | Revit DB link | Ecoinvent | - | Environmental impacts: GWP, AP, PM, EP, CFCS, ODP | Severity index classification |
| Detailed design stage | |||||||
| [21] | Revit | Tally | - | GaBi | - | AP, EP, GWP, ODP, SFP, PED, NRE, RE | Provide different scenarios comparing, values and proportion charts in results |
| [22] | Revit | - | Revit plug-in | ICE Version 2.0 database | - | Energy | Values and proportion charts |
| [33] | Revit/Green Building Studio | Tally | - | GaBi | - | AP, EP, GWP, ODP, SFP, PED, NRE, RE | Comparison of different scenarios; only values and charts |
| [34] | Revit | Simapro | - | Ecoinvtent v3 | - | Indicators within IMPACT 2002+ | - |
| [35] | Revit | eBalance | - | China Life Cycle Database (CLCD) Ecoinvent | - | GWP | Values and charts |
| Entire design process | |||||||
| [3] | Revit/Rhinoceros (Grasshopper) | - | One Click LCA | 130,000 data points, mostly for Europe and America | More than 50 certifications | Indicators included in environmental impact assessment methodology; LCC | Embodied carbon benchmark; baseline building for early design stage |
| [26] | Revit | - | BIMEELCA tool | CML 2001 (specific data and region-free) | - | ADPE; ADPM; AP; EP; GWP; ODP; POCP; PE-NRe; PE-R, LCC | Sustainable target value (STV) design; single values and charts |
| [27] | Revit-Dynamo | - | Developed Dynamo script | Ökobilanzdaten im Bauberiich (KBOB) Ecoinvent v2 | - | GWP, PE-nr | UBP |
| [28] | Revit | OpenLCA | Ecoinvent 3.3/Functional database | - | Relative indicators included in human health, ecosystem quality, climate change, and resources | Box–whisker plot through data extractor | |
| [29] | Rhinoceros | - | - | KBOB | - | GWP | Range values and specific values within different stages |
| [36] | Revit-Dynamo | - | Dynamic tool for LCA developed in Dynamo | KBOB | - | Grey energy, GHG, UBP | Sustainability targets set by the 2000-Watt Society |
| [37] | BIM software | GENERIS® | BIM2LCA | Ökobau.dat | DGNB | Reference indicators of LCA/LCC | Building benchmarks, construction benchmarks, LCA/LCC results, and scenario comparison |
2.2. National/Regionalized Approach
3. Main Objectives of the Study
4. Method
4.1. Overview of the Method
- Scalable database development,
- BIM-LCA workflows in the design process,
- Implementation of the methods.
4.2. The Scalable Database
4.2.1. Data Sources
4.2.2. Life Cycle Scope
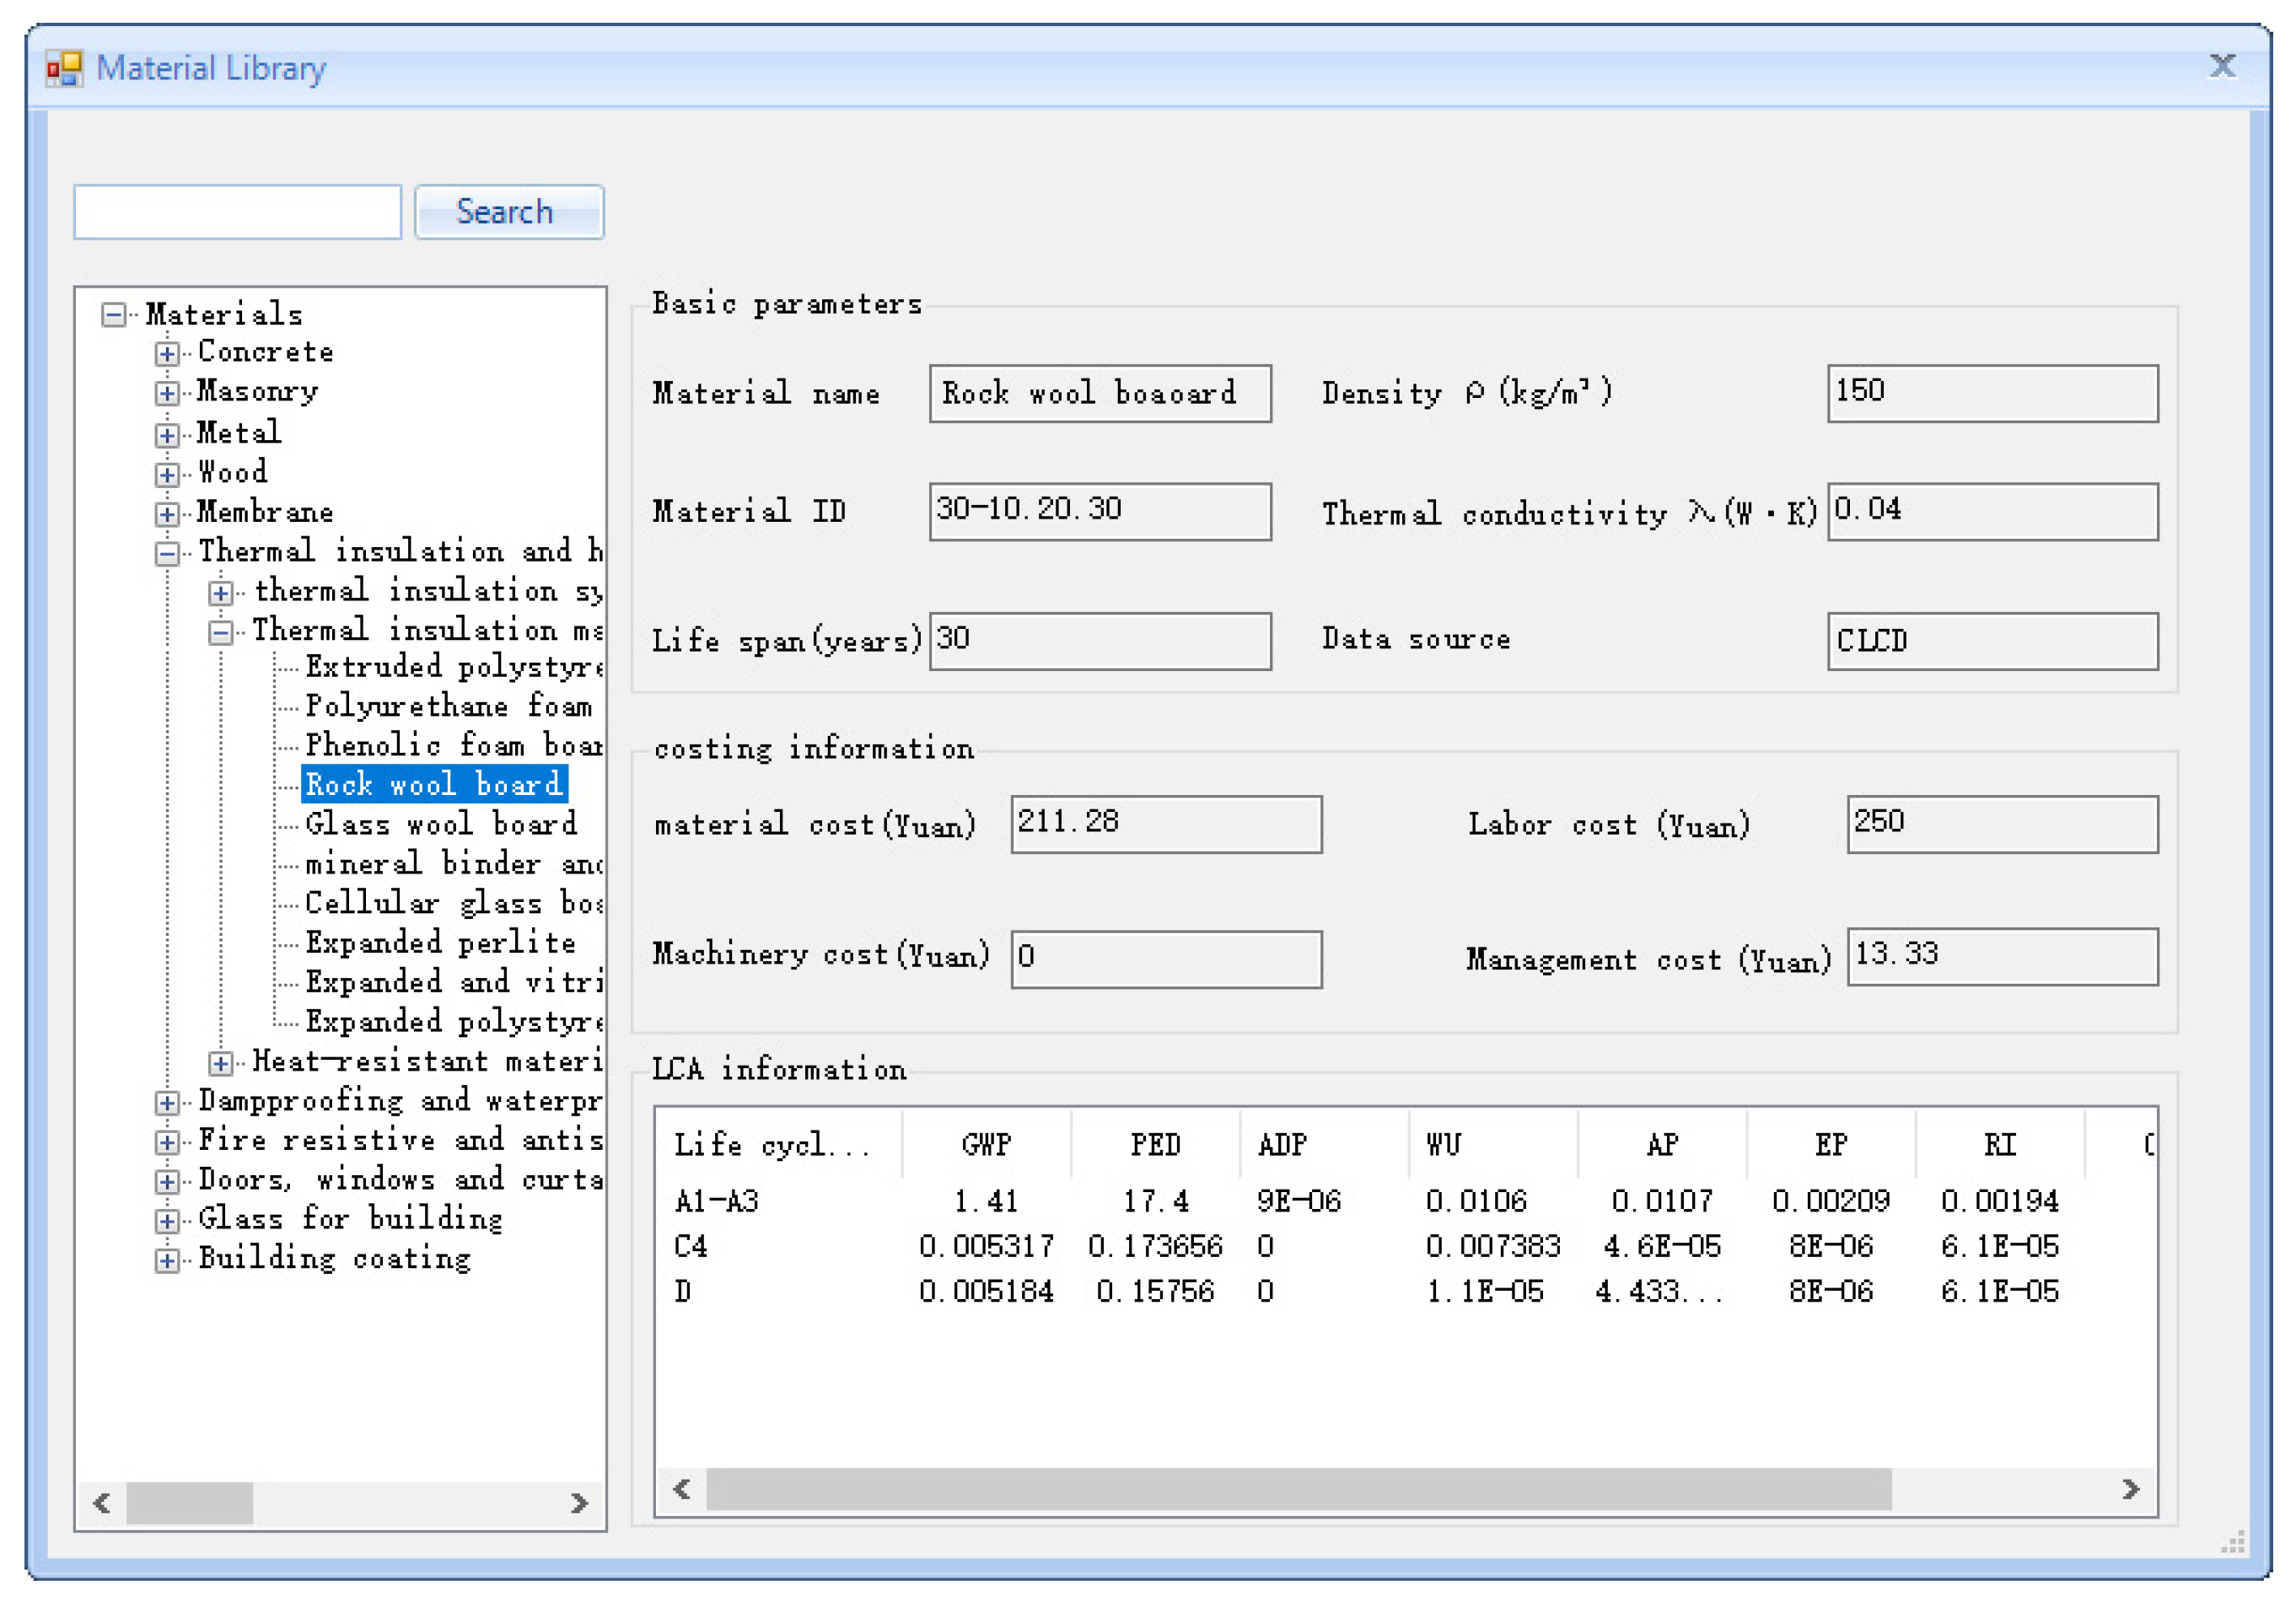
4.2.3. Database Structure
4.3. BIM–LCA/LCC Workflows in the Design Process
4.3.1. Information Extraction
4.3.2. Data Matching
4.3.3. Calculation and Comparison
4.3.4. Results Interpretation and Feedback
4.4. Implementation of the Method
4.4.1. Scalable Approach for Design Process
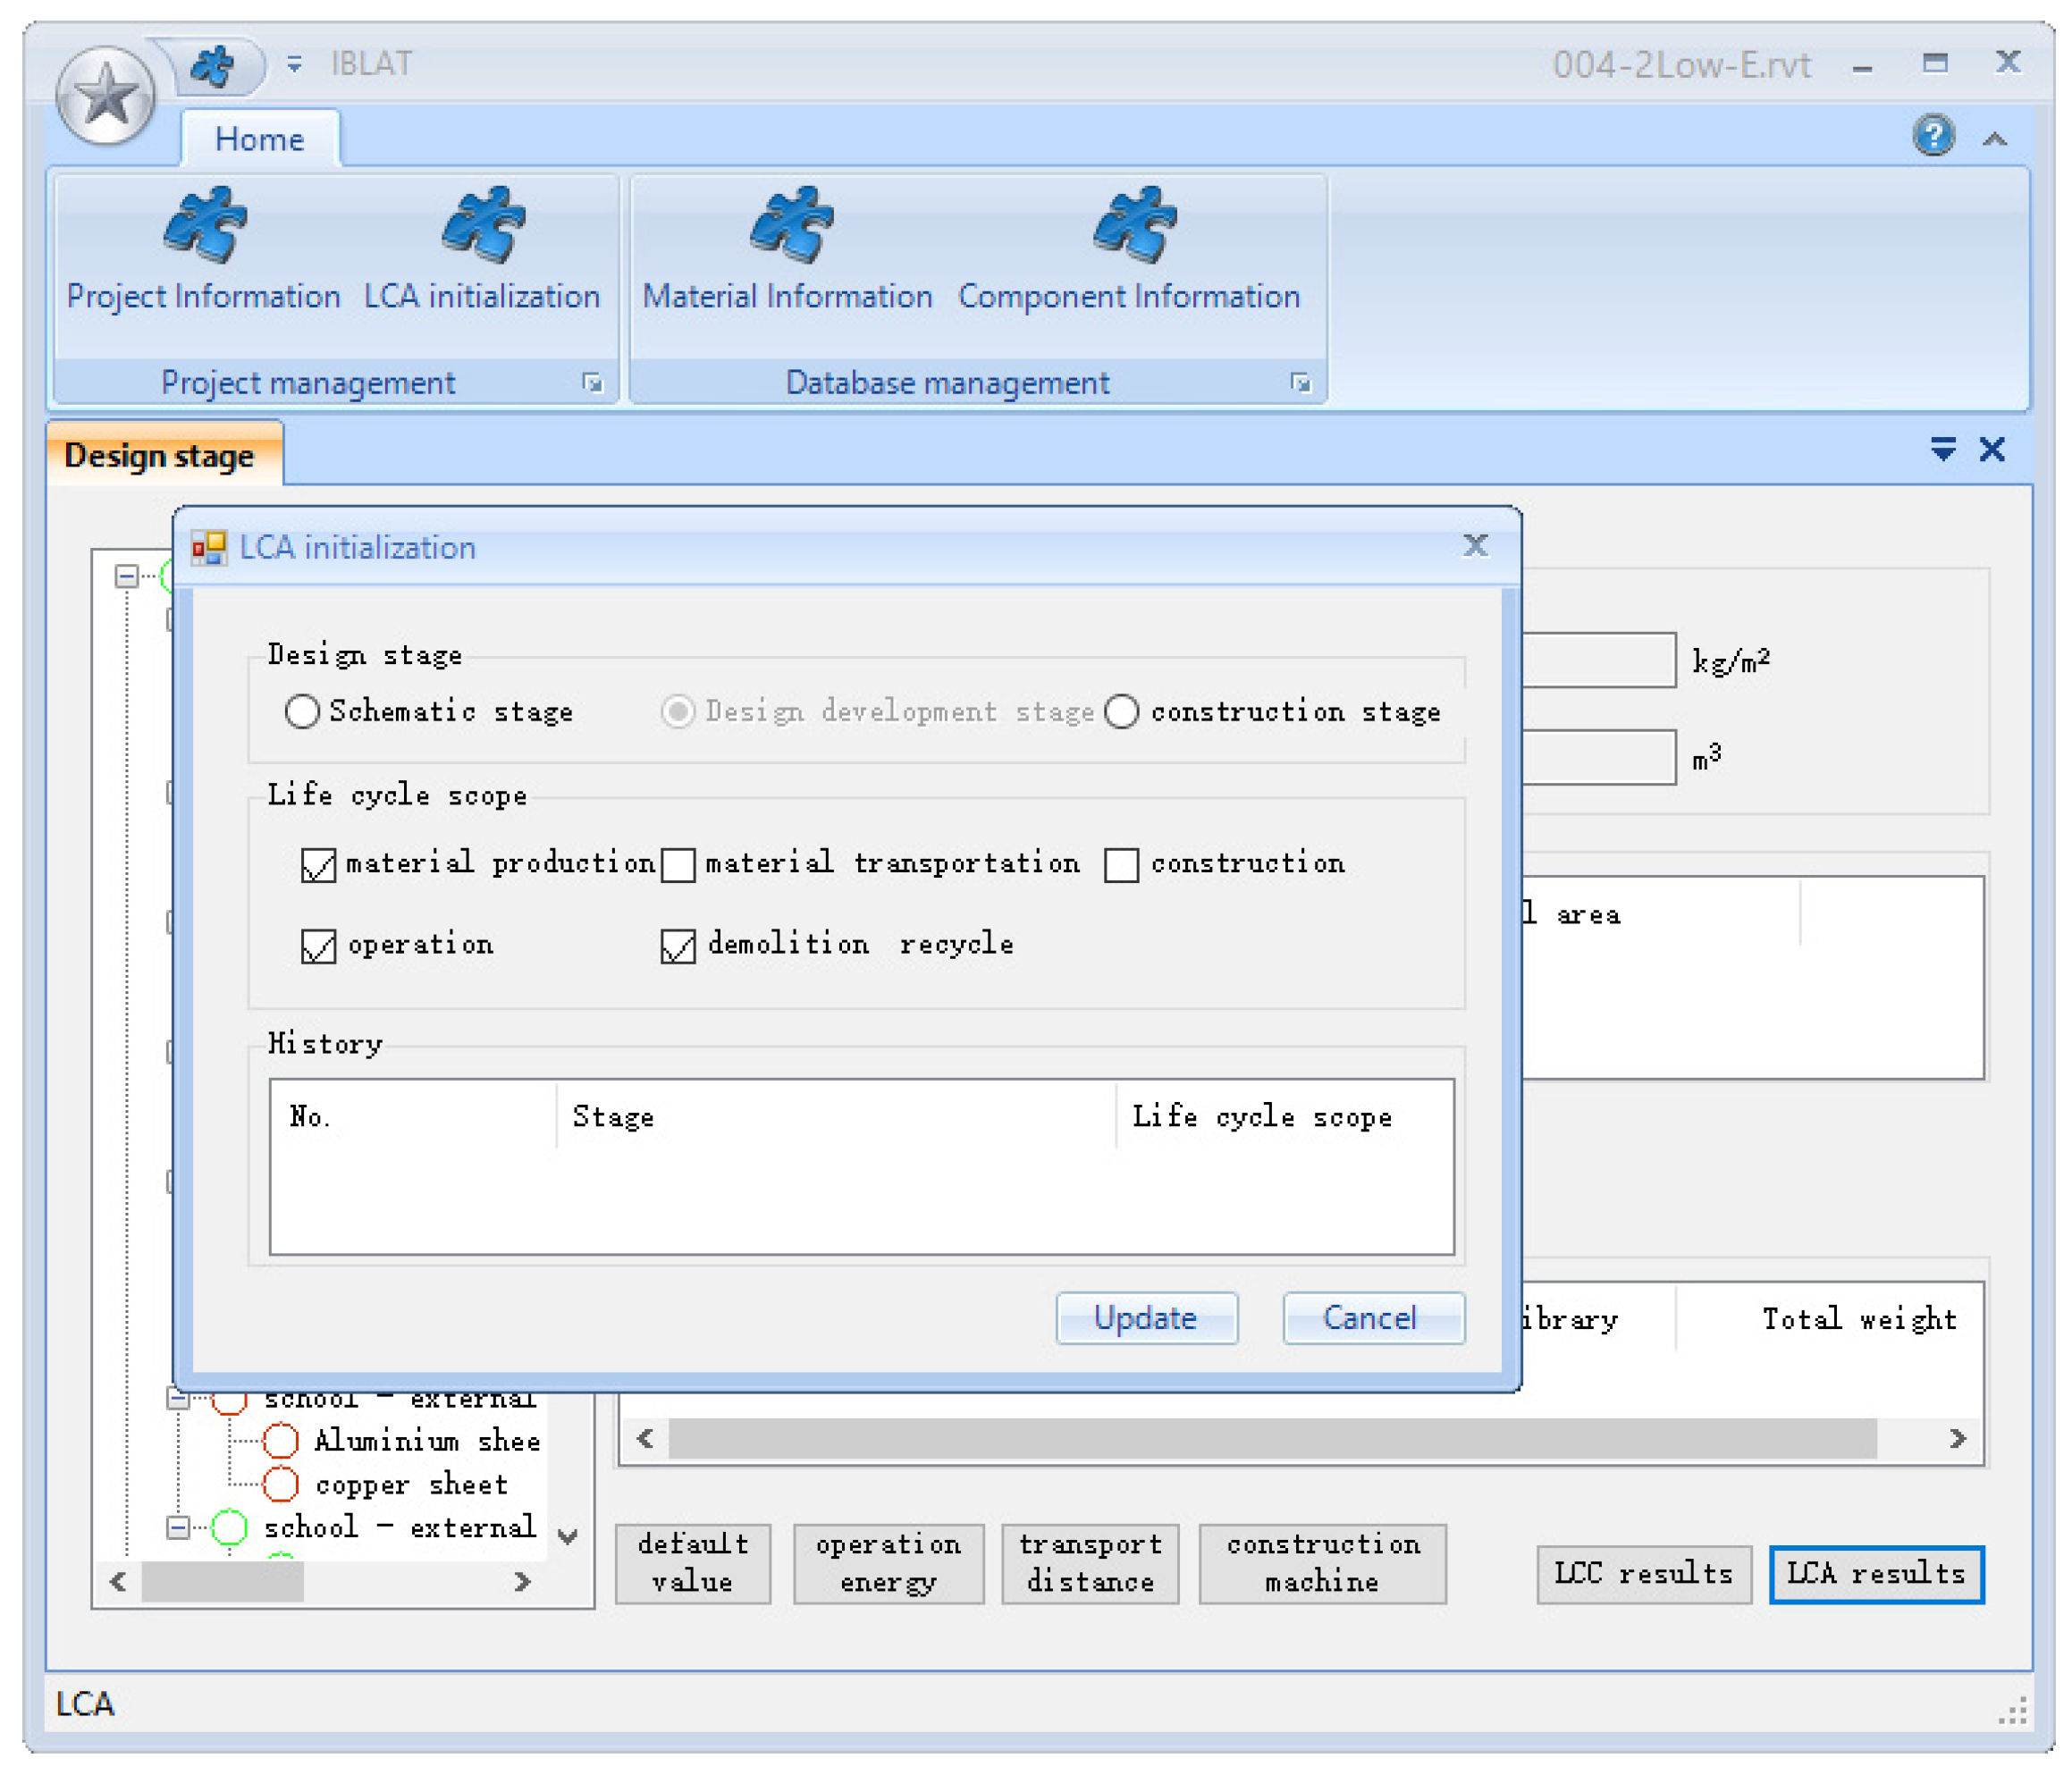
4.4.2. A Tool for BIM–LCA/LCC for the Chinese Context: IBLAT
4.4.3. Match up with the design process
4.5. Parameters Considered at the Respective Stage of the Green Building Design Process
5. Case Study
5.1. The Reference Case and the Baseline Values of the Design Parameters
5.2. The Schematic Design Stage
5.3. The Design Developed Stage
5.4. The Construction Design Stage
6. Discussion
6.1. Summary of the Results with the Implementation of the Method in the Design Process
6.2. Differences between the Results at Different Design Stages
6.3. Discussion of Uncertainties in the LCA/LCC Parameters
6.3.1. The Effect of National/Regionalized Database on LCA Result
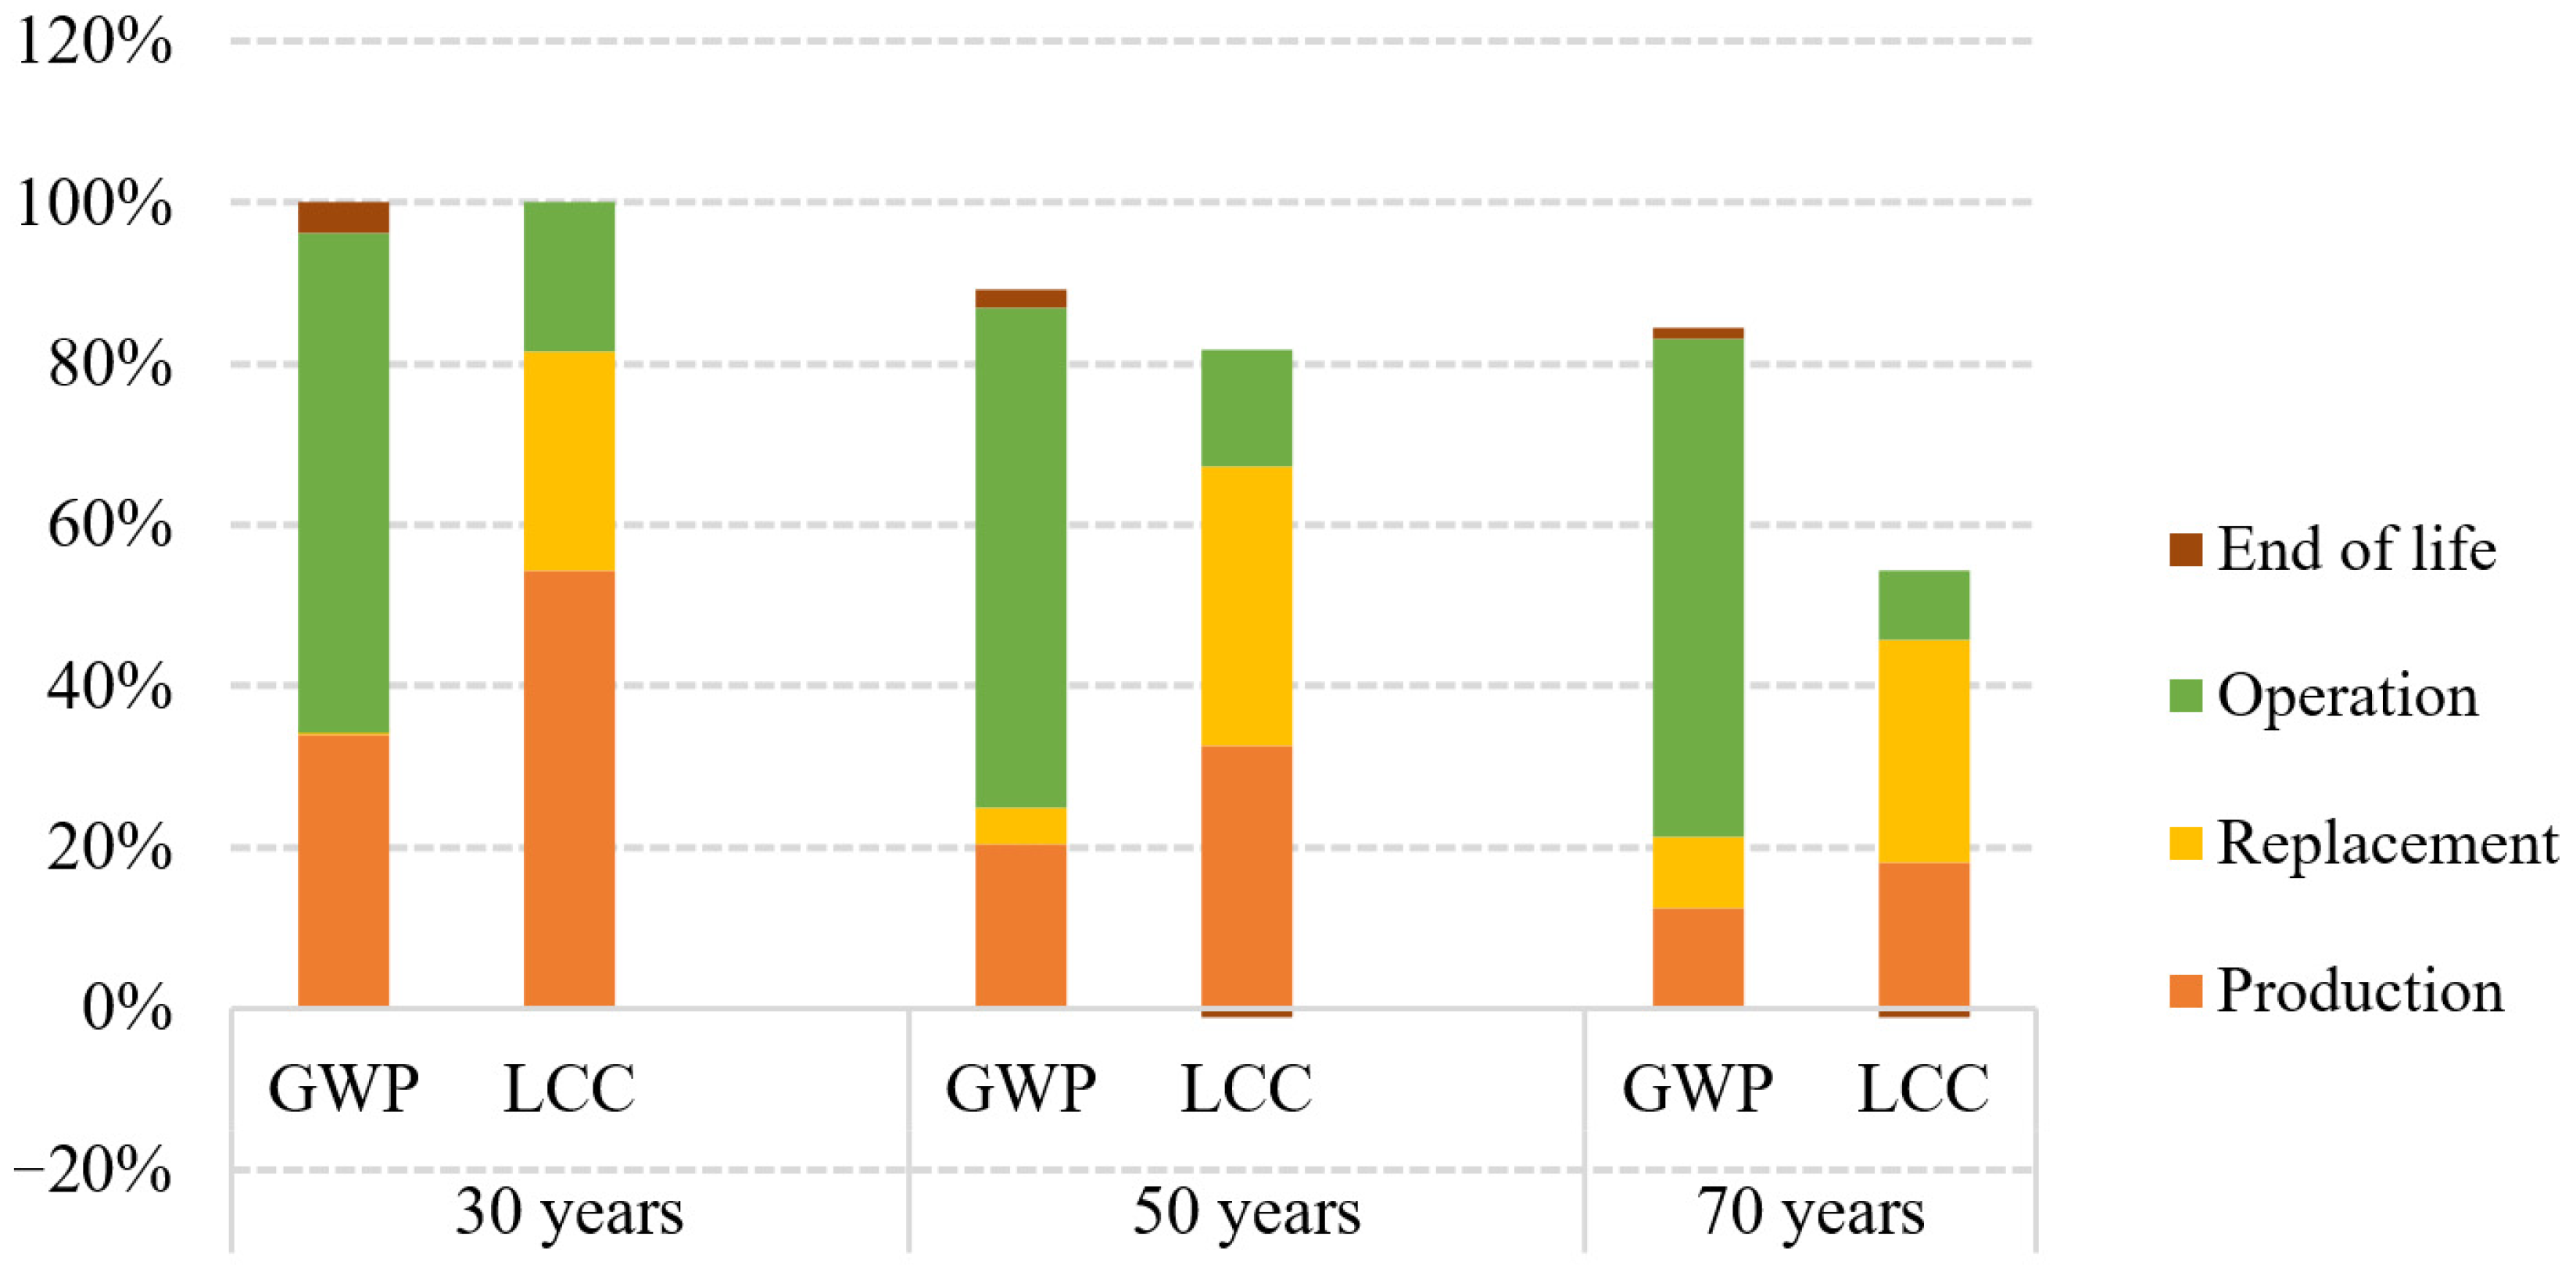
6.3.2. The Influence of Different Building Lifespan on LCA/LCC Results
6.3.3. The Influence of Different Scenario Definitions on LCA/LCC Results
7. Conclusions
Author Contributions
Funding
Institutional Review Board Statement
Informed Consent Statement
Data Availability Statement
Acknowledgments
Conflicts of Interest
Abbreviations
| ADPE | Abiotic depletion potential for fossil fuels | LCA | Life cycle assessment |
| ADPM | Abiotic depletion potential of materials | LCC | Life cycle cost |
| AIA | American Institute of Architects | LCP | Environmental life cycle performance |
| AP | Acidification potential | LOD | Levels of development |
| API | Application programming interface | NRE | Nonrenewable energy |
| BIM | Building information model | ODP | Ozone depletion potential |
| CFCS | Chlorofluorocarbons | PED | Primary energy demand |
| CLCD | China Life Cycle Database | PE-nr | Primary energy, renewable part |
| DGNB | German Sustainable Building Council | PENRT | Total nonrenewable primary energy |
| EP | Eutrophication potential | PM | Particulate matter |
| EPD | Environmental product declaration | POCP | Photochemical ozone creation potential |
| GWP | Global warming potential | RE | Renewable energy |
| IBLAT | Integrated building life cycle assessment tool | SDEV | Standard deviation |
| IC | Initial cost | SFP | Smog formation potential |
| ICE | Inventory of carbon and energy | SQL | Structured Query Language |
| ISO | International standardization organization | UBP | Eco points |
| KBOB | Life cycle assessment data in the construction sector | W/w | Window to wall |
Appendix A
| Content | Main Parameters | Conceptual Design | Schematic Design | Design Development | Construction Design | |
|---|---|---|---|---|---|---|
| Overall layout | Site design | Urban interface | √ | |||
| Function layout | √ | ⚪ | ||||
| Withdraw building line | √ | ⚪ | ||||
| Light environment in site | √ | ⚪ | ||||
| Air environment in site | √ | ⚪ | ||||
| Floor plan | Building plane | Plane dimensions | √ | √ | ⚪ | |
| Form characteristics | Surface/volume ratio | Floor height | √ | ⚪ | ||
| Orientation | √ | ⚪ | ||||
| Facade modeling | Window-to-wall ratio | √ | ⚪ | |||
| Location of functional modules | √ | √ | ⚪ | |||
| Roof form | √ | ⚪ | ||||
| Spatial characteristics | Interior space | Arrangement of functional modules | √ | ⚪ | ||
| Open space | √ | ⚪ | ||||
| Traffic space | √ | ⚪ | ||||
| Outdoor space | Traffic space | √ | ⚪ | |||
| Distributed space | √ | ⚪ | ||||
| Landscape environment | √ | √ | √ | ⚪ | ||
| Section design | Spatial line of sight | √ | ⚪ | |||
| Ventilated design | √ | ⚪ | ||||
| Construction details design | Wall | Construction layers of exterior and interior walls | √ | √ | ⚪ | |
| Material thickness | √ | ⚪ | ||||
| Heat transfer coefficient | √ | √ | ⚪ | |||
| Roof | Roof tectonic hierarchy | √ | √ | ⚪ | ||
| Material thickness | √ | ⚪ | ||||
| Heat transfer coefficient | √ | √ | ⚪ | |||
| Floor | Construction layer of floor | √ | √ | ⚪ | ||
| Material thickness | √ | ⚪ | ||||
| Heat transfer coefficient | √ | √ | ⚪ | |||
| Window | Heat transfer coefficient of exterior windows | √ | √ | ⚪ | ||
| Glass SHGC | √ | √ | ⚪ | |||
| Material thickness | √ | ⚪ | ||||
| Heat transfer coefficient | √ | √ | ⚪ | |||
| Airtightness | Airtightness | √ | ⚪ | |||
| Shading form | Shading form | √ | ⚪ | |||
| Shading component dimensions | √ | √ | ⚪ | |||
| Special construction | Design of structure space (form, size) | √ | √ | ⚪ | ||
| Material design of construction | √ | √ | ⚪ | |||
| Indoor environment | Indoor light environment | Daylight | √ | √ | ⚪ | |
| Artificial lighting | √ | √ | ⚪ | |||
| Indoor air environment | Natural ventilation | √ | √ | ⚪ | ||
| Mechanical ventilation | √ | √ | ⚪ | |||
| Building structure | Size determination | Forms and sizes of the foundation, beams, slabs, and columns | √ | √ | ⚪ | |
| Calculation of materials | Steel bar ratio and concrete dosage | √ | ⚪ | |||
| Equipment system | Heating | Heating form | √ | √ | ⚪ | |
| Equipment system parameters | √ | √ | ⚪ | |||
| Cooling | Cooling form | √ | √ | ⚪ | ||
| Equipment system parameters | √ | √ | ⚪ | |||
| Lighting | Lighting layout | √ | √ | ⚪ | ||
| Lamp selection | √ | √ | ⚪ | |||
| Hot water | Hot water system form | √ | √ | ⚪ | ||
| Parameter | Description | Values |
|---|---|---|
| Heating system | Natural gas district heating | Transfer: 92% |
| Cooling system | Split air conditioning | SEER = 4.0 |
| Airtightness | Infiltration | 0.6 ach |
| Ventilation | Fresh air | 30 m3/h/person |
| Heat recovery | 65% | |
| Occupants | Average area per person 960 students + 120 staff | 8 m2/person |
| Office equipment | 7:00 a.m.–6:00 p.m., school days | 5 w/m2 |
| Illumination | Lights turned on when day lighting <300 lx | 8 w/m2 |
| Day lighting | Window-to-floor ratio of classrooms | 1:5 |
References
- Research Report on Building Energy consumption and Carbon Emissions in China; Professional Committee of Building Energy and Emissions, China Association of Building Energy Efficiency (CABEE): Chongqing, China, 2021.
- Fiès, B.; Lützkendorf, T. Life Cycle Sustainable Assessment and BIM. In Proceedings of the Sustainable Building Conference 2013 Graz, Graz, Austria, 25–28 September 2013; pp. 489–499. [Google Scholar]
- One Click LCA, Ltd. One Click LCA. Available online: https://www.oneclicklca.com/ (accessed on 15 November 2022).
- Santos, R.; Aguiar Costa, A.; Silvestre, J.; Vandenbergh, T.; Pyl, L. BIM-based life cycle assessment and life cycle costing of an office building in Western Europe. Build. Environ. 2020, 169, 106568. [Google Scholar] [CrossRef]
- Kohler, N.; König, H.; Kreissig, J.; Lützkendorf, T. A Life Cycle Approach to Buildings: Principles—Calculations—Design Tools; DETAIL: Munich, Germany, 2010. [Google Scholar]
- Röck, M.; Saade, M.R.M.; Balouktsi, M.; Rasmussen, F.N.; Birgisdottir, H.; Frischknecht, R.; Habert, G.; Lützkendorf, T.; Passer, A. Embodied GHG emissions of buildings—The hidden challenge for effective climate change mitigation. Appl. Energy 2020, 258, 114107. [Google Scholar] [CrossRef]
- Blane, G. A Building Information Model (BIM) Based Lifecycle Assessment of a University Hospital Building Built to Passive House Standards; Institutt for Energi-og Prosessteknikk: Trondheim, Norway, 2012. [Google Scholar]
- Rui, L. Methodology and Tool to Calculate Building’s Equivalent Carbon Dioxide during Design Stage; Southeast University: Dhaka, Bangladesh, 2013. [Google Scholar]
- Yang, W.; Wang, S. A BIM-LCA framework and case study of a residential building in Tianjin. In Proceedings of the Sustainable Building Conference 2013 Graz, Graz, Austria, 25–28 September 2013. [Google Scholar]
- Alexander, H. A Parametric Method for Building Design Optimization Based on Life Cycle Assessment; Bauhaus University Weimar: Weimar, Germany, 2016. [Google Scholar]
- Röck, M.; Hollberg, A.; Habert, G.; Passer, A. LCA and BIM: Visualization of environmental potentials in building construction at early design stages. Build. Environ. 2018, 140, 153–161. [Google Scholar] [CrossRef]
- Theißen, S.; Höper, J.; Wimmer, R.; Zibell, M.; Meins-Becker, A.; Rössig, S.; Goitowski, S.; Lambertz, M. BIM integrated automation of whole building life cycle assessment using German LCA data base ÖKOBAUDAT and Industry Foundation Classes. IOP Conf. Ser. Earth Environ. Sci. 2020, 588, 032025. [Google Scholar] [CrossRef]
- Wastiels, L.; Decuypere, R. Identification and comparison of LCA-BIM integration strategies. In Proceedings of the IOP Conference Series: Earth and Environmental Science, Moscow, Russia, 27 May–6 June 2019. [Google Scholar]
- Safari, K.; AzariJafari, H. Challenges and opportunities for integrating BIM and LCA: Methodological choices and framework development. Sustain. Cities Soc. 2021, 67, 102728. [Google Scholar] [CrossRef]
- Roberts, M.; Allen, S.; Coley, D. Life cycle assessment in the building design process—A systematic literature review. Build. Environ. 2020, 185, 107274. [Google Scholar] [CrossRef]
- Wittstock, B.; Gantner, J.; Saunders, T.; Anderson, J.; Carter, C.; Gyetvai, Z.; Kreißig, J.; Lasvaux, A.; Bosdevigie, B.; Bazzana, M.; et al. EeBGuide Guidance Document Part B: Buildings; Fraunhofer Society: Munich, Germany, 2012; pp. 1–360. [Google Scholar]
- Jrade, A.; Jalaei, F. Integrating building information modelling with sustainability to design building projects at the conceptual stage. Build. Simul. 2013, 6, 429–444. [Google Scholar] [CrossRef]
- Gervásio, H.; Santos, P.; Martins, R.; Simões da Silva, L. A macro-component approach for the assessment of building sustainability in early stages of design. Build. Environ. 2014, 73, 256–270. [Google Scholar] [CrossRef]
- Dupuis, M.; April, A.; Lesage, P.; Forgues, D. Method to Enable LCA Analysis through Each Level of Development of a BIM Model. Procedia Eng. 2017, 196, 857–863. [Google Scholar] [CrossRef]
- Russell-Smith, S.V.; Lepech, M.D. Cradle-to-gate sustainable target value design: Integrating life cycle assessment and construction management for buildings. J. Clean. Prod. 2015, 100, 107–115. [Google Scholar] [CrossRef]
- Building Transparency, KT Innovations, Thinkstep, and Autodesk. Tally. Available online: https://www.choosetally.com/ (accessed on 15 November 2021).
- Nizam, R.S.; Zhang, C.; Tian, L. A BIM based tool for assessing embodied energy for buildings. Energy Build. 2018, 170, 1–14. [Google Scholar] [CrossRef]
- Basbagill, J.; Flager, F.; Lepech, M.; Fischer, M. Application of life-cycle assessment to early stage building design for reduced embodied environmental impacts. Build. Environ. 2013, 60, 81–92. [Google Scholar] [CrossRef]
- Basic, S.; Hollberg, A.; Galimshina, A.; Habert, G. A design integrated parametric tool for real-time Life Cycle Assessment—Bombyx project. IOP Conf. Ser. Earth Environ. Sci. 2019, 323, 012112. [Google Scholar] [CrossRef]
- Shadram, F.; Mukkavaara, J. An integrated BIM-based framework for the optimization of the trade-off between embodied and operational energy. Energy Build. 2018, 158, 1189–1205. [Google Scholar] [CrossRef]
- Santos, R.; Costa, A.A.; Silvestre, J.D.; Pyl, L. Integration of LCA and LCC analysis within a BIM-based environment. Autom. Constr. 2019, 103, 127–149. [Google Scholar] [CrossRef]
- Hollberg, A.; Genova, G.; Habert, G. Evaluation of BIM-based LCA results for building design. Autom. Constr. 2020, 109, 102972. [Google Scholar] [CrossRef]
- Rezaei, F.; Bulle, C.; Lesage, P. Integrating building information modeling and life cycle assessment in the early and detailed building design stages. Build. Environ. 2019, 153, 158–167. [Google Scholar] [CrossRef]
- Cavalliere, C.; Habert, G.; Dell’Osso, G.R.; Hollberg, A. Continuous BIM-based assessment of embodied environmental impacts throughout the design process. J. Clean. Prod. 2019, 211, 941–952. [Google Scholar] [CrossRef]
- Hollberg, A.; Agustí-Juan, I.; Lichtenheld, T.; Klüber, N. Design-integrated environmental performance feedback based on early-BIM. In Proceedings of the Life-Cycle Analysis and Assessment in Civil Engineering (IALCCE2018), Ghent, Belgium, 28–31 October 2018; pp. 433–439. [Google Scholar]
- Hollberg, A.; Tschetwertak, J.; Schneider, S.; Habert, G. Design-Integrated LCA Using Early BIM. In Designing Sustainable Technologies, Products and Policies; Springer: Berlin/Heidelberg, Germany, 2018; pp. 433–439. [Google Scholar] [CrossRef]
- Marzouk, M.; Abdelkader, E.M.; Al-Gahtani, K. Building information modeling-based model for calculating direct and indirect emissions in construction projects. J. Clean. Prod. 2017, 152, 351–363. [Google Scholar] [CrossRef]
- Najjar, M.; Figueiredo, K.; Palumbo, M.; Haddad, A. Integration of BIM and LCA: Evaluating the environmental impacts of building materials at an early stage of designing a typical office building. J. Build. Eng. 2017, 14, 115–126. [Google Scholar] [CrossRef]
- Cavalliere, C.; Dell’Osso, G.R.; Pierucci, A.; Iannone, F. Life cycle assessment data structure for building information modelling. J. Clean. Prod. 2018, 199, 193–204. [Google Scholar] [CrossRef]
- Yang, X.; Hu, M.; Wu, J.; Zhao, B. Building-information-modeling enabled life cycle assessment, a case study on carbon footprint accounting for a residential building in China. J. Clean. Prod. 2018, 183, 729–743. [Google Scholar] [CrossRef]
- Naneva, A.; Bonanomi, M.; Hollberg, A.; Habert, G.; Hall, D. Integrated BIM-Based LCA for the Entire Building Process Using an Existing Structure for Cost Estimation. Sustainability 2020, 12, 3748. [Google Scholar] [CrossRef]
- Horn, R.; Ebertshäuser, S.; Di Bari, R.; Jorgji, O.; Traunspurger, R.; Both, P.v. The BIM2LCA Approach: An Industry Foundation Classes (IFC)-Based Interface to Integrate Life Cycle Assessment in Integral Planning. Sustainability 2020, 12, 6558. [Google Scholar] [CrossRef]
- Yang, W.; Li, Q.; Yang, L.; Ren, J.; Yang, X. Analyzing the life cycle environmental impacts in the Chinese building design process. In Proceedings of the IALCCE 2018, Ghent, Belgium, 28–31 October 2018. [Google Scholar]
- Frischknecht, R.; Ramseier, L.; Yang, W.; Birgisdottir, H.; Chae, C.U.; Lützkendorf, T.; Passer, A.; Balouktsi, M.; Berg, B.; Bragança, L.; et al. Comparison of the greenhouse gas emissions of a high-rise residential building assessed with different national LCA approaches—IEA EBC Annex 72. IOP Conf. Ser. Earth Environ. Sci. 2020, 588, 022029. [Google Scholar] [CrossRef]
- Morales, M.; Moraga, G.; Kirchheim, A.P.; Passuello, A. Regionalized inventory data in LCA of public housing: A comparison between two conventional typologies in southern Brazil. J. Clean. Prod. 2019, 238, 117869. [Google Scholar] [CrossRef]
- ÖKOBAUDAT Sustainable Construction Information Portal. Available online: https://www.oekobaudat.de (accessed on 15 November 2022).
- GB/T 51366-2019; Standard for Building Carbon Emission Calculation. National Standard of the People’s Republic of China: Beijing, China, 2019.
- Cang, Y.; Luo, Z.; Yang, L.; Han, B. A new method for calculating the embodied carbon emissions from buildings in schematic design: Taking “building element” as basic unit. Build. Environ. 2020, 185, 107306. [Google Scholar] [CrossRef]
- Dauletbek, A.; Zhou, P. BIM-based LCA as a comprehensive method for the refurbishment of existing dwellings considering environmental compatibility, energy efficiency, and profitability: A case study in China. J. Build. Eng. 2022, 46, 103852. [Google Scholar] [CrossRef]
- Gong, T. Life Cycle Assessment of Carbon Emission of Buildings; Shanghai Jiao Tong University: Shanghai, China, 2017. [Google Scholar]
- Beijing Glory PKPM Technology Co., Ltd. PKPM-CES. Available online: http://www.pkpm.cn/ (accessed on 15 November 2022).
- Wang, H. A new approach to energy saving and emission reduction goal—Life cycle energy saving and emission reduction evaluation method. High Technol. Commer. 2011, 7, 49–53. [Google Scholar]
- Southeast University. Donghe Building Carbon Emission Calculation and Analysis Software V2.0. Available online: https://www.seuicc.com (accessed on 15 November 2022).
- Gbsware Co. Ltd. Building Carbon Emission CEEB2023. Available online: http://gbsware.cn/news/web_8.html (accessed on 15 November 2022).
- IKE Environmental Technology Co. Efootprint. Available online: http://www.efootprint.net/#/home (accessed on 1 December 2021).
- Xialu, L.; Hongtao, W.; Jian, C. Method and basic model for development of Chinese reference life cycle database of fundamental industries. Acta Sci. Circumstantiae 2010, 30, 2136–2144. [Google Scholar]
- Gu, L.; Lin, B.; Gu, D. Endpoint damage model for building life cycle environmental impact assessment in China. Sci. Bull. 2008, 53, 1858–1863. [Google Scholar] [CrossRef]
- GB50378-2019; Assessment Standard for Green Building. National Standard of the People’s Republic of China: Beijing, China, 2019.
- Yang, Q. Quantificational Life Cycle Assessment of Environmental Impact of Construction Productions. Ph.D. Thesis, Tianjin University, Tianjin, China, 2009. [Google Scholar]
- BNB. BNB_Nutzungsdauern_Von_Bauteilen_2017-02-24. Available online: https://www.nachhaltigesbauen.de/fileadmin/pdf/baustoff_gebauededaten/BNB_Nutzungsdauern_von_Bauteilen_2017-02-24.pdf. (accessed on 15 November 2022).
- Gong, X. Reuse of waste materials from building demolition. Archit. J. 2011, 3, 88–92. [Google Scholar]
- GB/T 51269-2017; Standard for Classification and Coding of Buiding Information Model. National Standard of the People’s Republic of China: Beijing, China, 2017.
- König, H.; Cristofaro, M.L.D. Benchmarks for life cycle costs and life cycle assessment of residential buildings. Build. Res. Inf. 2012, 40, 558–580. [Google Scholar] [CrossRef]
- Yuan, L.Q.; Wei, Y. Methodology of life cycle GWP benchmarking for buildings. Urban Evironment Des. 2023, unpublished results. [Google Scholar]
- GB 55015-2021; General Code for Energy Efficiency and Renewable Energy Application in Buildings. National Standard of the People’s Republic of China: Beijing, China, 2021.
- Sun, D.; Zhao, W. Statistical and study on incremental cost of green building in China. Eco City Green Build. 2009, 6, 34–37. [Google Scholar] [CrossRef]
- GB/T 50326-2017; Code for Construction Project Management. National Standard of the People’s Republic of China: Beijing, China, 2017.
- Yang, L. A Study on BIM-LCA based Green Building Design Optimization. Master’s Thesis, Tianjin University, Tianjin, China, 2016. [Google Scholar]
- DB 29-153-2014; Tianjin Design Standard for Energy Efficiency of Public Buildings. Tianjin Design Standard for Energy Efficiency of Public Buildings: Tianjin, China, 2015.
- GB 50099-2011; Code for Design of School. National Standard of the People’s Republic of China: Beijing, China, 2010.
- National Bureau of Statistic. China Statistical Yearbook. Available online: http://www.stats.gov.cn/tjsj/ndsj/2018/indexch.htm (accessed on 15 November 2022).
- GB 50189-2015; Design Standard for Energy Efficiency of Public Buildings. National Standard of the People’s Republic of China: Beijing, China, 2015.


| Life Cycle Processes | System Limit of LCA | LCI data source | System Limit of LCC | Cost Data Source | |
|---|---|---|---|---|---|
| Stages | |||||
| A1–A3 | Material production | ● | CLCD; Ecoinvent | ● | Local quantity survey data |
| A4 | Transportation to the site | ● | CLCD | ● | Local quantity survey data |
| A5 | Construction on the site | ● | CLCD; The literature [52,54] | ● | Local quantity survey data |
| B4 | Component replacement | ● | CLCD; Ecoinvent component life span [55] | ● | Local quantity survey data |
| B6 | Operational energy use | ● | CLCD; standard for carbon emission; national policy | ● | Local energy prices |
| C4 | Processing and disposal of waste material | ● | CLCD; Ecoinvent; Oekobau.dat; | ● | The literature [56] |
| D | Reuse/recycling potential of building wastes | ● | CLCD; Ecoinvent | ● | The literature [56] |
| Design Stages | Design Parameters | Level of Details | Database Linking | Model Description |
|---|---|---|---|---|
| Schematic design stage | Layout (orientation), rough size, volume ratio, façades | LOD100 | Elements library | LOD100 has a basic shape, rough size, and volume. The model shows the location, shape, and orientation of the building, as well as the area information of the main components of the building. |
| Design development stage | Façade design, construction and space design, service system, heat transfer coefficient of the envelope | LOD200 | Elements library and materials library | The model contains, size, shape, location, and orientation of the main parts of the building. The LOD200 model can reflect the rough geometric characteristics of the object itself. The main appearance size cannot be changed, and the detail dimensions can be adjusted. |
| Construction stage | Material selection, construction details | LOD300–LOD350 | Materials library | The LOD300 model should contain accurate material component attribute information. The model is successfully used for cost estimation and construction coordination. |
| National Standard [60] | Local Standard [64] | Reference Case | ||
|---|---|---|---|---|
| Roof | 0.40 | 0.35 | 0.35 | Concrete board + EPS insulation + waterproof |
| External walls | 0.5 | 0.45 | 0.4 | AAC + EPS insulation |
| Window | 2.5 (0.2 < w/w < 0.3) 2.0 (0.3 < w/w < 0.4) 1.9 (0.4 < w/w < 0.5) | 2.0 (N) 2.3 (E, W) 2.5 (S) | 2.0 | 6 Clear + 12 Air + 6 Low-E glass; thermal break aluminum frames |
| Skylight | 2.4 | 2.3 | 2.2 | |
| Layout 1 | Layout 2 | Layout 3 | |
|---|---|---|---|
| Revit model |  |  |  |
| 001 surface/ volume ratio | 0.20 | 0.23 | 0.21 |
| Scenario 1 | Scenario 2 | Scenario 3 | |
| 002 window/wall ratio (w/w ratio) of the south and north façades | 0.25 | 0.35 | 0.45 |
| Scenario 1 (Sc 1) | Scenario 2 (Sc 2) | Scenario 3 (Sc 3) | ||
|---|---|---|---|---|
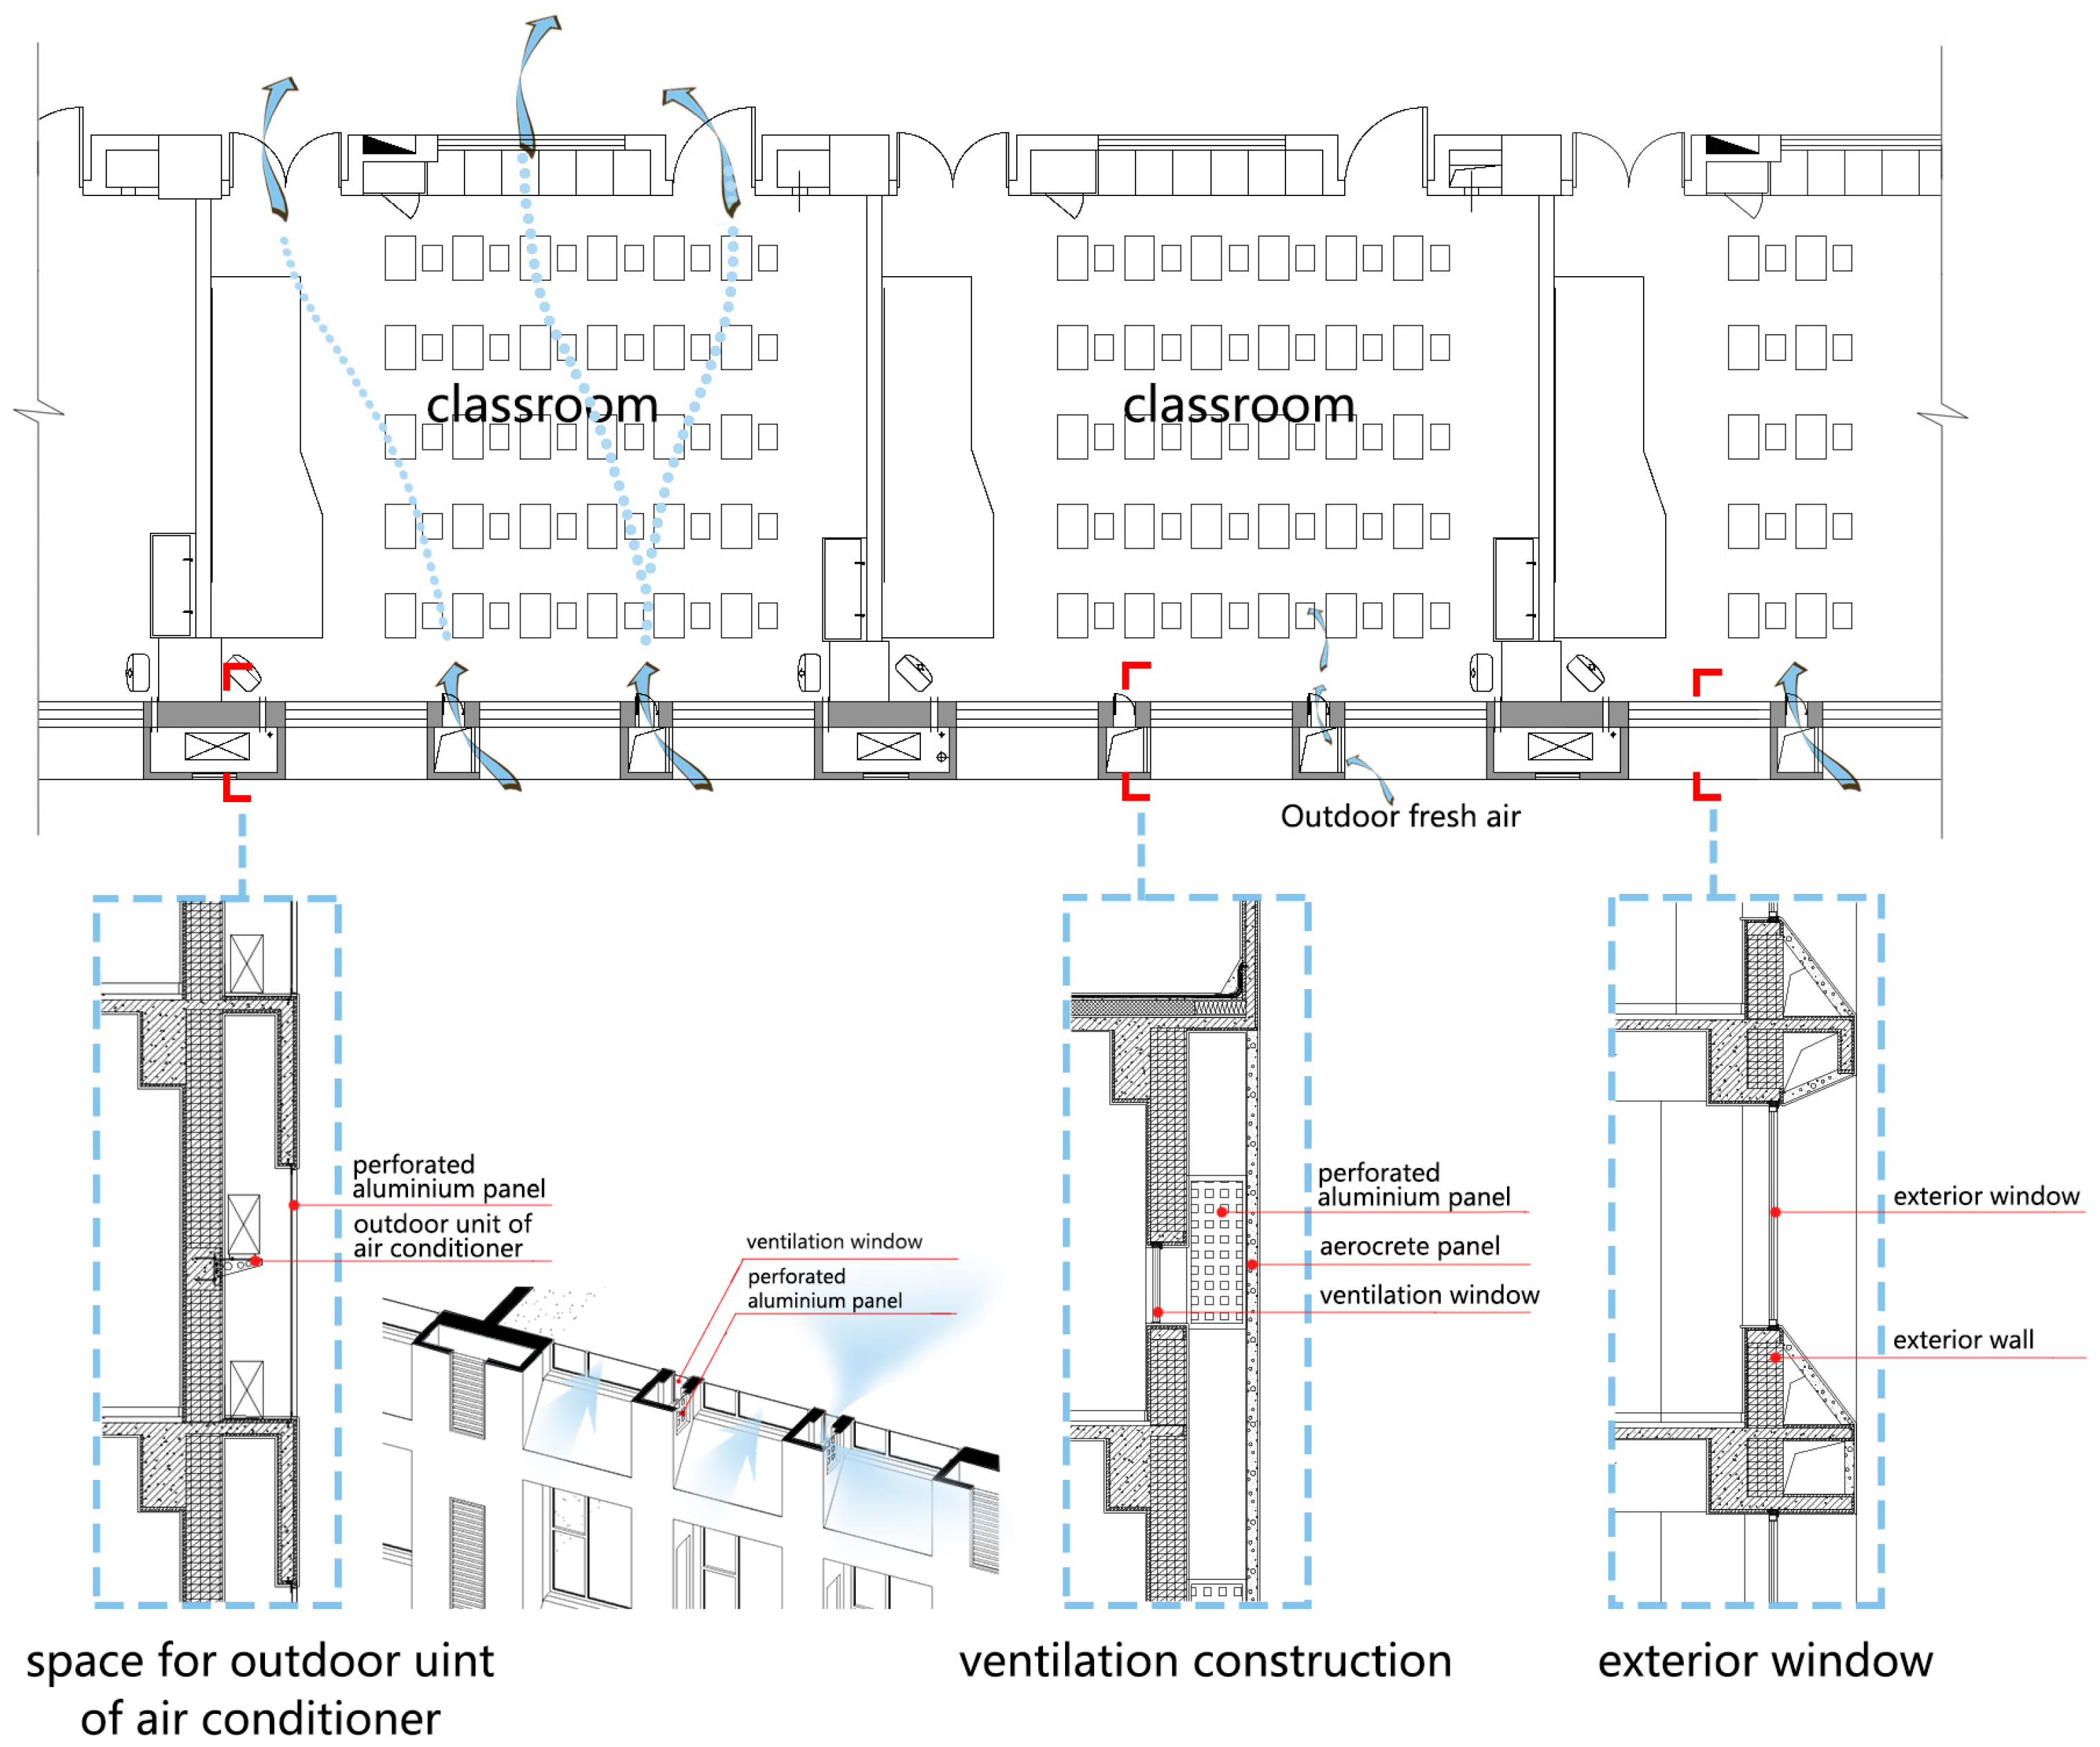
| 003 ventilation construction | With | Without | - | |
| 004 wall material | AAC | CMU | Concrete | |
| 005 window material | Material composition | Double Low-E glass: 5 + 9A + 5Low-E | Triple clear glass 5 + 9A + 5 + 9A + 5 | Other windows: double Low-E glass 5 + 9A + 5 Low-E Southern windows: triple clear glass 5 + 9A + 5 + 9A + 5 |
| Design Parameters | Results |
|---|---|
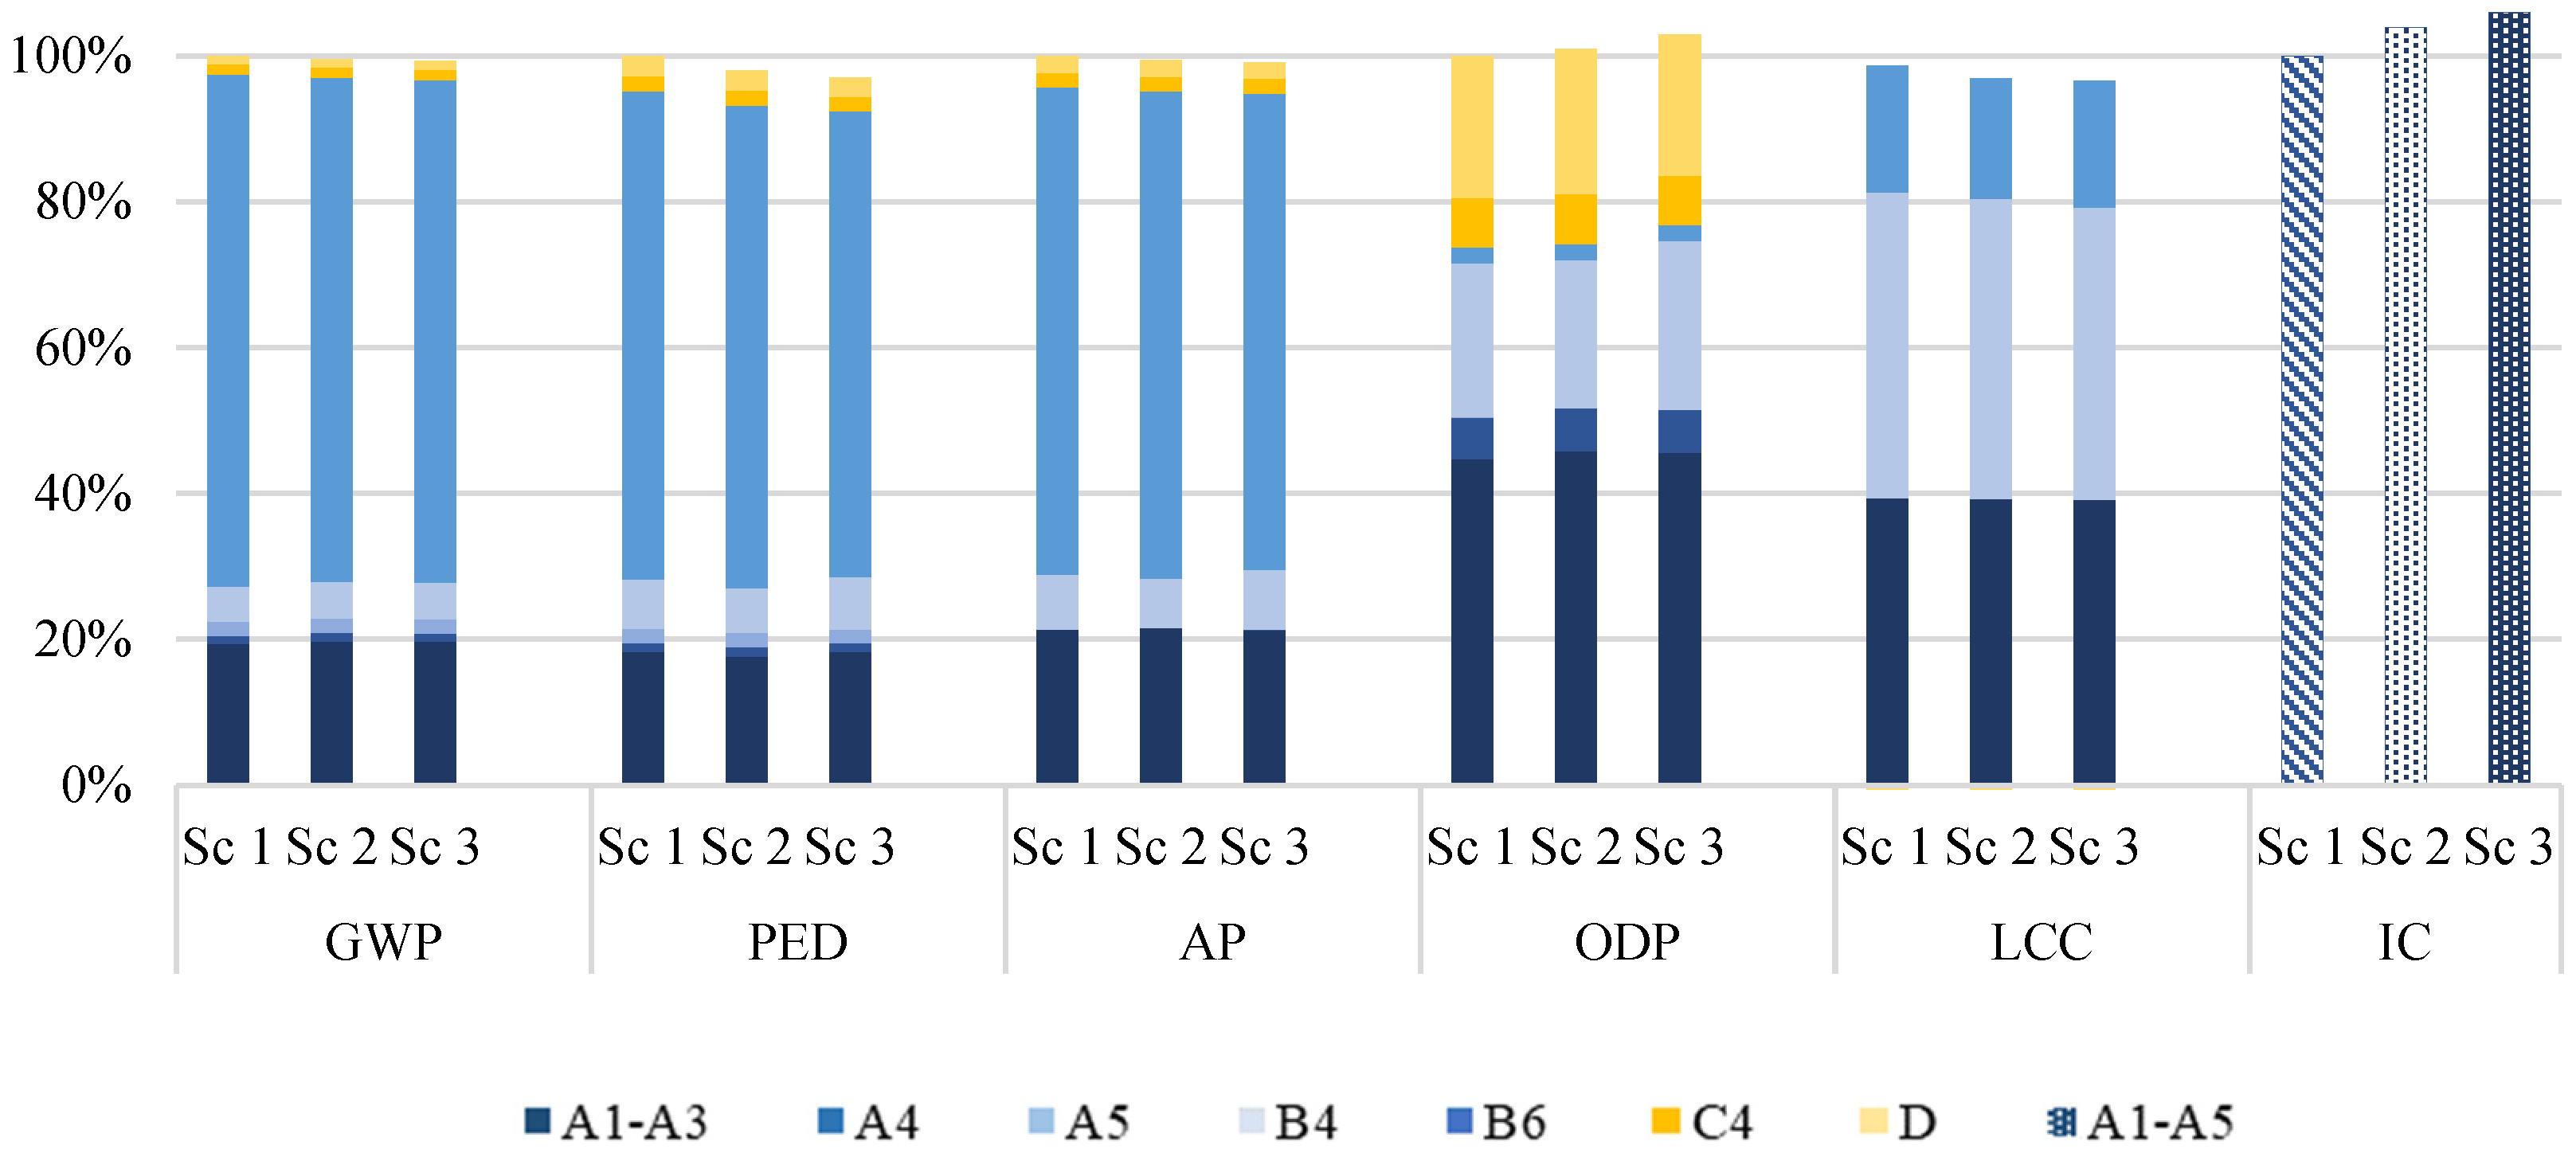
| 003 ventilation construction |  |
| 004 wall material |  |
| 005 window material |  |
| 006 U-Values of Building Envelope | Reference Scenario (Scenario 1) | −20% (Scenario 2) | −30% (Scenario 3) |
|---|---|---|---|
| Roof | 0.35 | 0.28 | 0.25 |
| Reinforced fine aggregate concrete: 40 mm Mortar: 20 mm XPS: 85 mm Expanded perlite cement: 30 mm Reinforced concrete: 120 mm Mortar and painting: 10 mm | Reinforced fine aggregate concrete: 40 mm Mortar: 20 mm XPS: 95 mm Expanded perlite cement: 30 mm Reinforced concrete: 120 mm Mortar and painting: 10 mm | Reinforced fine aggregate concrete: 40 mm Mortar: 20 mm XPS: 110 mm Expanded perlite cement: 30 mm Reinforced concrete: 120 mm Mortar and painting: 10 mm | |
| Exterior wall | 0.40 | 0.32 | 0.28 |
| Description | Exterior mortar: 15 mm AAC: 200 mm Rock wool insulation board: 40 mm Mortar and painting: 10 mm | Exterior mortar: 15 mm AAC: 200 mm Rock wool insulation board: 80 mm Mortar and painting: 10 mm | Exterior mortar: 15 mm AAC: 200 mm Rock wool insulation board: 110 mm Mortar and painting: 10 mm |
| Window (south) | 2.20 | 1.78 | 1.51 |
| Ug = 1.9; Uf = 2.2 Triple clear glass: 5 + 9A + 5 + 9A + 5, Frame: insulated aluminum alloy, 75 mm | Ug = 1.5; Uf = 2.0 Quadric clear glass: 4 + 9A + 4 + 9A + 4 + 9A + 4 Frame: insulated aluminum alloy, 85 mm | Ug = 1.1; Uf = 2.0 Triple low-E glass: 5 + 9Ar + 5 Low-E + 9Ar + 5 Low-E Frame: bridge-cut heat insulation aluminum alloy frame, 75 mm | |
| Window (north, east, west) Skylight | 2.20 | 1.78 | 1.51 |
| Ug = 1.9; Uf = 2.2 Double glass: 5 + 9A + 5Low-E Frame: insulated aluminum alloy, 65 mm | Ug = 1.5; Uf = 2.0 Triple glass: 5 + 9A + 5 + 9A + 5Low-E Frame: insulated aluminum alloy, 75 mm | Ug = 1.1; Uf = 2.0 Triple glass: 5 + 9Ar + 5 Low-E + 9Ar + 5 Low-E Frame: bridge-cut heat insulated aluminum alloy, 75 mm |
| Operational Energy | Life Cycle GWP | Life Cycle Primary Energy Consumption | LCC | Initial Cost | ||
|---|---|---|---|---|---|---|
| Kwh electr. e/m2/a | Kg CO2 e. m2/a | MJ/m2/a | Yuan/m2 | Yuan/m2 | ||
| Schematic | Initial | 46.5 | 47.4 | 582.37 | 5237.3 | 2022.4 |
| Improved | 46.1 | 46.2 | 567.62 | 5185.7 | 2024.4 | |
| Design Development | Reference | 47.3 | 49.5 | 625.25 | 5566.1 | 2024.42 |
| Improved | 45.4 | 47.5 | 595.06 | 5340.9 | 2101.35 | |
| Construction Design | Reference | 45.1 | 51.3 | 616.26 | 5715.0 | 2132.3 |
| Final | 44.2 | 48.7 | 604.18 | 5577.5 | 2244.5 | |
| Deduced benchmarks | Baseline value | 59.4 | 55.8 | - | - | 8400 |
| Target value | 47.9 | 47.8 | - | - | 6300 |
| Material/Energy | Description | Unit | Data Source | GWP | PED | ODP | AP |
|---|---|---|---|---|---|---|---|
| Kg CO2 e. | MJ | Kg CFC-11 e. | Kg SO2 e. | ||||
| Concrete | C30 | 1 m3 | Gabi | 324.97 | 2068.88 | 1.86 × 10⁻⁶ | 1.41 |
| CLCD | 295.3 | 2296 | 3.77 × 10⁻⁶ | 0.87 | |||
| C80 | 1 m3 | Gabi | 470.65 | 2532.75 | 3.78 × 10⁻⁶ | 2.08 | |
| CLCD | 511.15 | 3445 | 3.94 × 10⁻⁶ | 1.27 | |||
| Steel | Hot rolled steel; reinforcing rod | 1 Kg | Gabi | 1.22 | 17.01 | 6.17 × 10⁻⁹ | 0.01 |
| CLCD | 1.64 | 27.11 | 2.45 × 10⁻⁸ | 0.01 | |||
| Glass | Double low-E glass | 1 Kg | Gabi | 1.44 | 20.7 | 5.47 × 10⁻¹³ | 0.01 |
| Float glass | 1 Kg | CLCD | 1.08 | 12.5 | 1.34 × 10⁻⁹ | 0.02 | |
| Aluminum | Thermal break window frame | 1 Kg | Gabi | 4.25 | 66.91 | 6.82 × 10⁻⁹ | 0.02 |
| CLCD | 7.95 | 142 | 1.72 × 10⁻⁶ | 0.06 | |||
| Electricity | China average | 1 Kwh | Gabi | 0.86 | 10.4 | 1.70 × 10⁻⁹ | 3.56 × 10⁻³ |
| Northeast China | 1 Kwh | CLCD | 0.94 | 13.36 | 1.10 × 10⁻⁹ | 6.05 × 10⁻³ | |
| Natural gas | China average | 1 Kwh | Gabi | 0.26 | 4.39 | 1.11 × 10⁻¹⁷ | 3.11 × 10⁻⁴ |
| 1 Kwh | CLCD | 0.19 | 3.48 | 1.75 × 10⁻⁹ | 8.42 × 10⁻⁴ |
| Impact Category | GWP | PED | ODP | AP | |
|---|---|---|---|---|---|
| Unit | Kg CO2 e./m2/a | MJ/m2/a | Kg CFC-11 e./m2/a | Kg SO2 e./m2/a | |
| Embodied impacts | Tally | 9.9 | 87.08 | 6.26 × 10⁻⁸ | 0.04 |
| Chinese data | 14.67 | 211.64 | 1.20 × 10⁻⁶ | 0.09 | |
| Impacts from operational energy | Tally | 34.91 | 408.85 | 3.86 × 10⁻⁸ | 0.10 |
| Chinese data | 32.93 | 392.54 | 3.51 × 10⁻⁸ | 0.14 | |
| Total | Tally | 44.82 | 495.97 | 1.01 × 10⁻⁷ | 0.14 |
| Chinese data | 48.67 | 604.18 | 1.23 × 10⁻⁶ | 0.23 | |
| Sc1 | Sc2 | Sc3 | Sc4 | Sc5 | |
|---|---|---|---|---|---|
| Price index of energy product | 0.18% | 1.18% (+1%) | 1.68% (+1.5%) | 0.18% | 3.18% (+3%) |
| Price index of building product | 2.94% | 2.94% | 1.44% (−1.5%) | 2.94% | 2.94% |
| Discounting rate | 4.35% | 4.35% | 4.35% | 2.85% (−1.5%) | 2.85% (−1.5%) |
Disclaimer/Publisher’s Note: The statements, opinions and data contained in all publications are solely those of the individual author(s) and contributor(s) and not of MDPI and/or the editor(s). MDPI and/or the editor(s) disclaim responsibility for any injury to people or property resulting from any ideas, methods, instructions or products referred to in the content. |
© 2023 by the authors. Licensee MDPI, Basel, Switzerland. This article is an open access article distributed under the terms and conditions of the Creative Commons Attribution (CC BY) license (https://creativecommons.org/licenses/by/4.0/).
Share and Cite
Li, Q.; Yang, W.; Kohler, N.; Yang, L.; Li, J.; Sun, Z.; Yu, H.; Liu, L.; Ren, J. A BIM–LCA Approach for the Whole Design Process of Green Buildings in the Chinese Context. Sustainability 2023, 15, 3629. https://doi.org/10.3390/su15043629
Li Q, Yang W, Kohler N, Yang L, Li J, Sun Z, Yu H, Liu L, Ren J. A BIM–LCA Approach for the Whole Design Process of Green Buildings in the Chinese Context. Sustainability. 2023; 15(4):3629. https://doi.org/10.3390/su15043629
Chicago/Turabian StyleLi, Qiyuan, Wei Yang, Niklaus Kohler, Lu Yang, Jie Li, Zhen Sun, Hanze Yu, Lu Liu, and Jun Ren. 2023. "A BIM–LCA Approach for the Whole Design Process of Green Buildings in the Chinese Context" Sustainability 15, no. 4: 3629. https://doi.org/10.3390/su15043629
APA StyleLi, Q., Yang, W., Kohler, N., Yang, L., Li, J., Sun, Z., Yu, H., Liu, L., & Ren, J. (2023). A BIM–LCA Approach for the Whole Design Process of Green Buildings in the Chinese Context. Sustainability, 15(4), 3629. https://doi.org/10.3390/su15043629