1. Introduction
Affected by the coronavirus disease 2019 pandemic and the development of global e-commerce, courier delivery problems are often in the news. The large pile of goods and yard irregularities has caused some problems, such as low efficiency of courier delivery, inflexible loading and unloading, and high rate of cargo damage, which have affected the quality of courier services. The greatest number of express complaints in the year in China is every November, among which express delay, loss, and damage are the main reasons for complaints. The low efficiency of courier delivery and the high cargo damage rate are the problems that need to be addressed in the industry. In addition, behind the booming development of express delivery is the price war among major courier companies to seize the market. Cost control should be considered when improving express delivery efficiency. In the above context, a large number of centralized express processing can cause low loading and unloading efficiency and delayed delivery of goods, which will lead to inefficient sorting and an increase in delivery time cost, reflected in the decline of logistics service quality on the macro level. To address these issues, a three-dimensional loading constraint with a vehicle routing problem (3LCVRP) with time windows for the delivery vehicle path problem under the 3D loading constraint has become increasingly important.
A 3D bin packing problem (3D-BPP) means finding the best placement to improve space utilization through regular, orderly arrangement and stacking of internal goods in a 3D space [
1]. Since Eilon and Christofides [
2] raised the issue of loading in 1971, it has received widespread attention. The 3D-BPP belongs to the NP-hard problem [
3]. It is hard to use exact solutions. Pisinger [
4] divided packing method algorithms into four categories: wall-building algorithm, pile-building algorithm, cube arrangement algorithm, and cutting algorithm. The idea of layering walls has been widely applied. George and Robinson [
5] first proposed the wall-building algorithm and divided layering containers into rows so as to make full use of the space inside containers and reduce space waste. Bortfeldt and Gehring [
6,
7] constantly explore the hierarchical processing method and solve the hierarchical segmentation method through a greedy algorithm. Rajaei et al. [
8] and Gzara et al. [
9] changed stratification into column generation to solve the support problem. However, loading by layer method will produce a lot of gaps between layers, which will lead to a decrease in the loading rate. Later, space-cutting and merging methods were adopted by various scholars. Huang et al. [
10] and Ali et al. [
11] used the remaining space method in space segmentation to constantly update space information for loading. El-Ashmawi and Elminaam [
12] and Santos et al. [
13] also adopted the cargo rotation method and improved the iterative method of the algorithm. Among them, references [
14,
15,
16,
17,
18] adopted six rotation modes and carried out a comprehensive study with the maximum remaining space theory based on the I-DBLF method. These methods solve the problem of low loading rate, but the methods of space segmentation require a constant calculation of the remaining space, which is too long for the huge volume of express delivery.
Although the above methods can solve problems from different angles, in some aspects, there are still deficiencies. In order to obtain more effective results, Bortfeldt and Mack [
19] improved the way of layering and combined it with spatial decomposition to discuss the application of heuristic, which was derived from the branch and bound to reduce the gap between layers. Further expansion was needed. References [
20,
21,
22,
23,
24] are simplifying particle swarm optimization or other algorithms to reduce the time consumed by algorithms. Fleszar and Charalambous [
25] considered the maximum objective of weight loading rate. Santos et al. [
13] combined this problem with path optimization to reduce the number of boxes used. In order to distinguish goods, Muyldermans and Pang [
26] and Wang et al. [
27] also divided the space into several parts according to the needs of customers, and Alonso et al. [
28] proposed to use pallets to plan the customers’ needs in the carriage, which, theoretically, is easy to load and unload but still not well enough to discuss the problem of loading and unloading efficiency of a large number of goods. Moreover, since the top support of the pallet is affected by the amount of cargo, Alonso’s solution cannot properly balance the high loading rate of the carriage with the function of distinguishing the customer points in the case of the variable amount of cargo at the customer points.
From another aspect, combining 3D loading and path optimization considerations plays an important role in the logistics distribution vehicle path problem. Gendreau et al. [
29] proposed the 3LCVRP model. Subsequently, Chen et al. [
30] designed a forbidden search algorithm that integrates the customer’s requirements for service time and ultimately produces a higher quality solution based on the study of [
29]. Bortfeldt and Yi [
31] developed a mixed-integer planning model that considered 3D loading constraints and vehicle assignment use and improved the genetic algorithm for solving it. The study was helpful in advancing the vehicle scheduling problem for 3D loading. Koch et al. [
32] extend the vehicle routing problem with pickup and distribution to an integrated vehicle routing and loading problem for transportation. Avoid the process of readjusting goods after loading. Wang et al. [
27] and Meliani et al. [
33] solved the vehicle path optimization scheme for multi-cargo types under 3D loading constraints and compared the results with those of classical heuristic algorithms. In Küçük and Yildiz’s study [
34], the 3LCVRP problem is decomposed into a mixture of 93 problems, among which 36 of the best-known results are improved. However, considering the combination of 3D loading and path is difficult, and the current study only considers a relatively small number of cargo types. Furthermore, there are many different sizes of packages in the real courier industry.
The customer demand time window is the time interval in which the customer expects the goods to arrive. In the vehicle routing problem with time windows (VRPTW), whether the goods can arrive on time will directly affect the service quality and even the distribution cost [
35]. In the design of the time window problem, Figliozzi [
36] considered the number of routes, cost, and the importance of time windows to customers and other factors. Baños et al. [
37] proposed a hybrid meta-heuristic for multi-objective vehicle routing problems with time windows and considered the workload imbalance in terms of the distances traveled by the used vehicles and their loads. Shi et al. [
38] studied the vehicle routing problem of simultaneous pickup and delivery with a time window, constructed a multi-objective mathematical model that minimized distribution cost and vehicle usage, and proposed an effective algorithm based on tabu search to solve the model. Shi et al. [
39] then combined the time window problem with carbon emission to promote the research and development of a green supply chain. They take the time window as the optimization criterion and consider various objectives in the routing problem. In the improvement of the time window, Taş [
40] used flexible time windows in which vehicles are allowed to serve customers before and after the time window interval. Sun et al. [
41] proposed release dates to solve the problem that the time window was not flexible for in-home delivery. Li et al. [
42] proposed that service time is proportional to the units of delivered products, which makes time windows more reasonable. Jalilvand et al. [
43] proposed an effective progressive hedging algorithm for vehicle routing problems with two-layer time window assignments. All these studies made the time window more reasonable in restricting the distribution problem, but they ignored the factors affecting the time window are not only the distribution path but also the production speed. In this paper, the variable of unloading efficiency is introduced in the process of optimizing the distribution route, and the influence of unloading efficiency on the time window is discussed.
Briefly, two considerations motivate us to conduct this study. First, efficient loading and unloading should be considered when a large number of goods are loaded into the carriage. Second, the distribution cost with the high loading rate should be involved. In this study, a pallet with telescopic height is introduced as a cargo stacking carrier to expand the type of goods. On the one hand, pallets can be used as a unit to distinguish customers and cooperate with forklifts to improve loading and unloading efficiency. On the other hand, it can solve the pain points of traditional pallets stacked by stable top. A 3D pallet loading-vehicle routing problem (3DPP-VRP) model with a time window combined with the hierarchy theory was constructed based on the 3D pallet loading constraint, and the influence of the 3D pallet loading scheme on the time window cost was discussed. First, the initial solution of 3D loading was generated by the volume of cargo, and the initial solution of the path was generated through spatio-temporal clustering. Then, the solution process of the pallet loading, vehicle loading, and distribution path was completed by combining with the heuristic solution method of hybrid simulated annealing and genetic algorithm. The main contributions of this paper are as follows.
(1) We construct a pallet with a telescopic support structure as the intermediate carrier to improve the handling efficiency of cargo. In this regard, the special pallet is convenient for a forklift truck to load and unload and greatly promotes the handling efficiency of cargo.
(2) We design a novel distribution scheme based on the constraints of a three-dimensional pallet loading time window. The scheme can save more time. With the improving speed of the loading and unloading, the proposed scheme can greatly save delivery time and reduce the time cost by optimizing the line and considering the time window.
(3) We utilize the empirical data of an express company in Chongqing, China, to implement the proposed approach to demonstrate the analysis.
2. Problem Description
The routing problem of delivery vehicles under the three-dimensional pallet loading constraints proposed in this paper needs to consider the three-dimensional constraints of carriages, customer demand, customer service time window, loading and unloading time, and the optimization of distribution routes. In the loading process, due to the difference in the demand of different customers, whether there is enough supporting surface on the top layer of the pallet to support the pallet stacking problem. In the process of route optimization, the distribution cost is higher due to the different service time windows of customer points and the improper distribution order of customer points. A pallet with adjustable support structure height is proposed as the carrier to improve the loading rate and loading and unloading efficiency. It is necessary to effectively integrate distribution resources for reasonable scheduling to reduce the distribution cost. Therefore, we construct a dual-objective model minimizing the distribution cost and maximizing the loading rate to solve the routing optimization problem of distribution vehicles under the constraint of three-dimensional pallet loading.
The traditional courier loading process mainly has two ways: The first way is to directly use the sack, which will be attributed to each site of the goods sub-assembly; its advantage is to facilitate the distinction of the goods of each site, but effectively using the limited carriage space is difficult, and the express packaging extrusion can easily break or damage the goods. The second way is to directly stack the goods as regularly as possible in the carriage space. In this way, the carriage space can be effectively used, but without the necessary stack carrier, the loading and unloading process requires more workforce and time, resulting in difficulties in loading and unloading. Compared with the traditional express delivery method, this study introduces the retractable support structure pallet as the express cargo loading and unloading carrier. The study also designs the 3D loading rules to centralize the goods of each distribution site. This unified and orderly operation is not only good at improving the loading and unloading speed of the site, thereby saving cargo distribution time, but can also ensure that the goods are neat and orderly in the distribution process and improve the quality of logistics services.
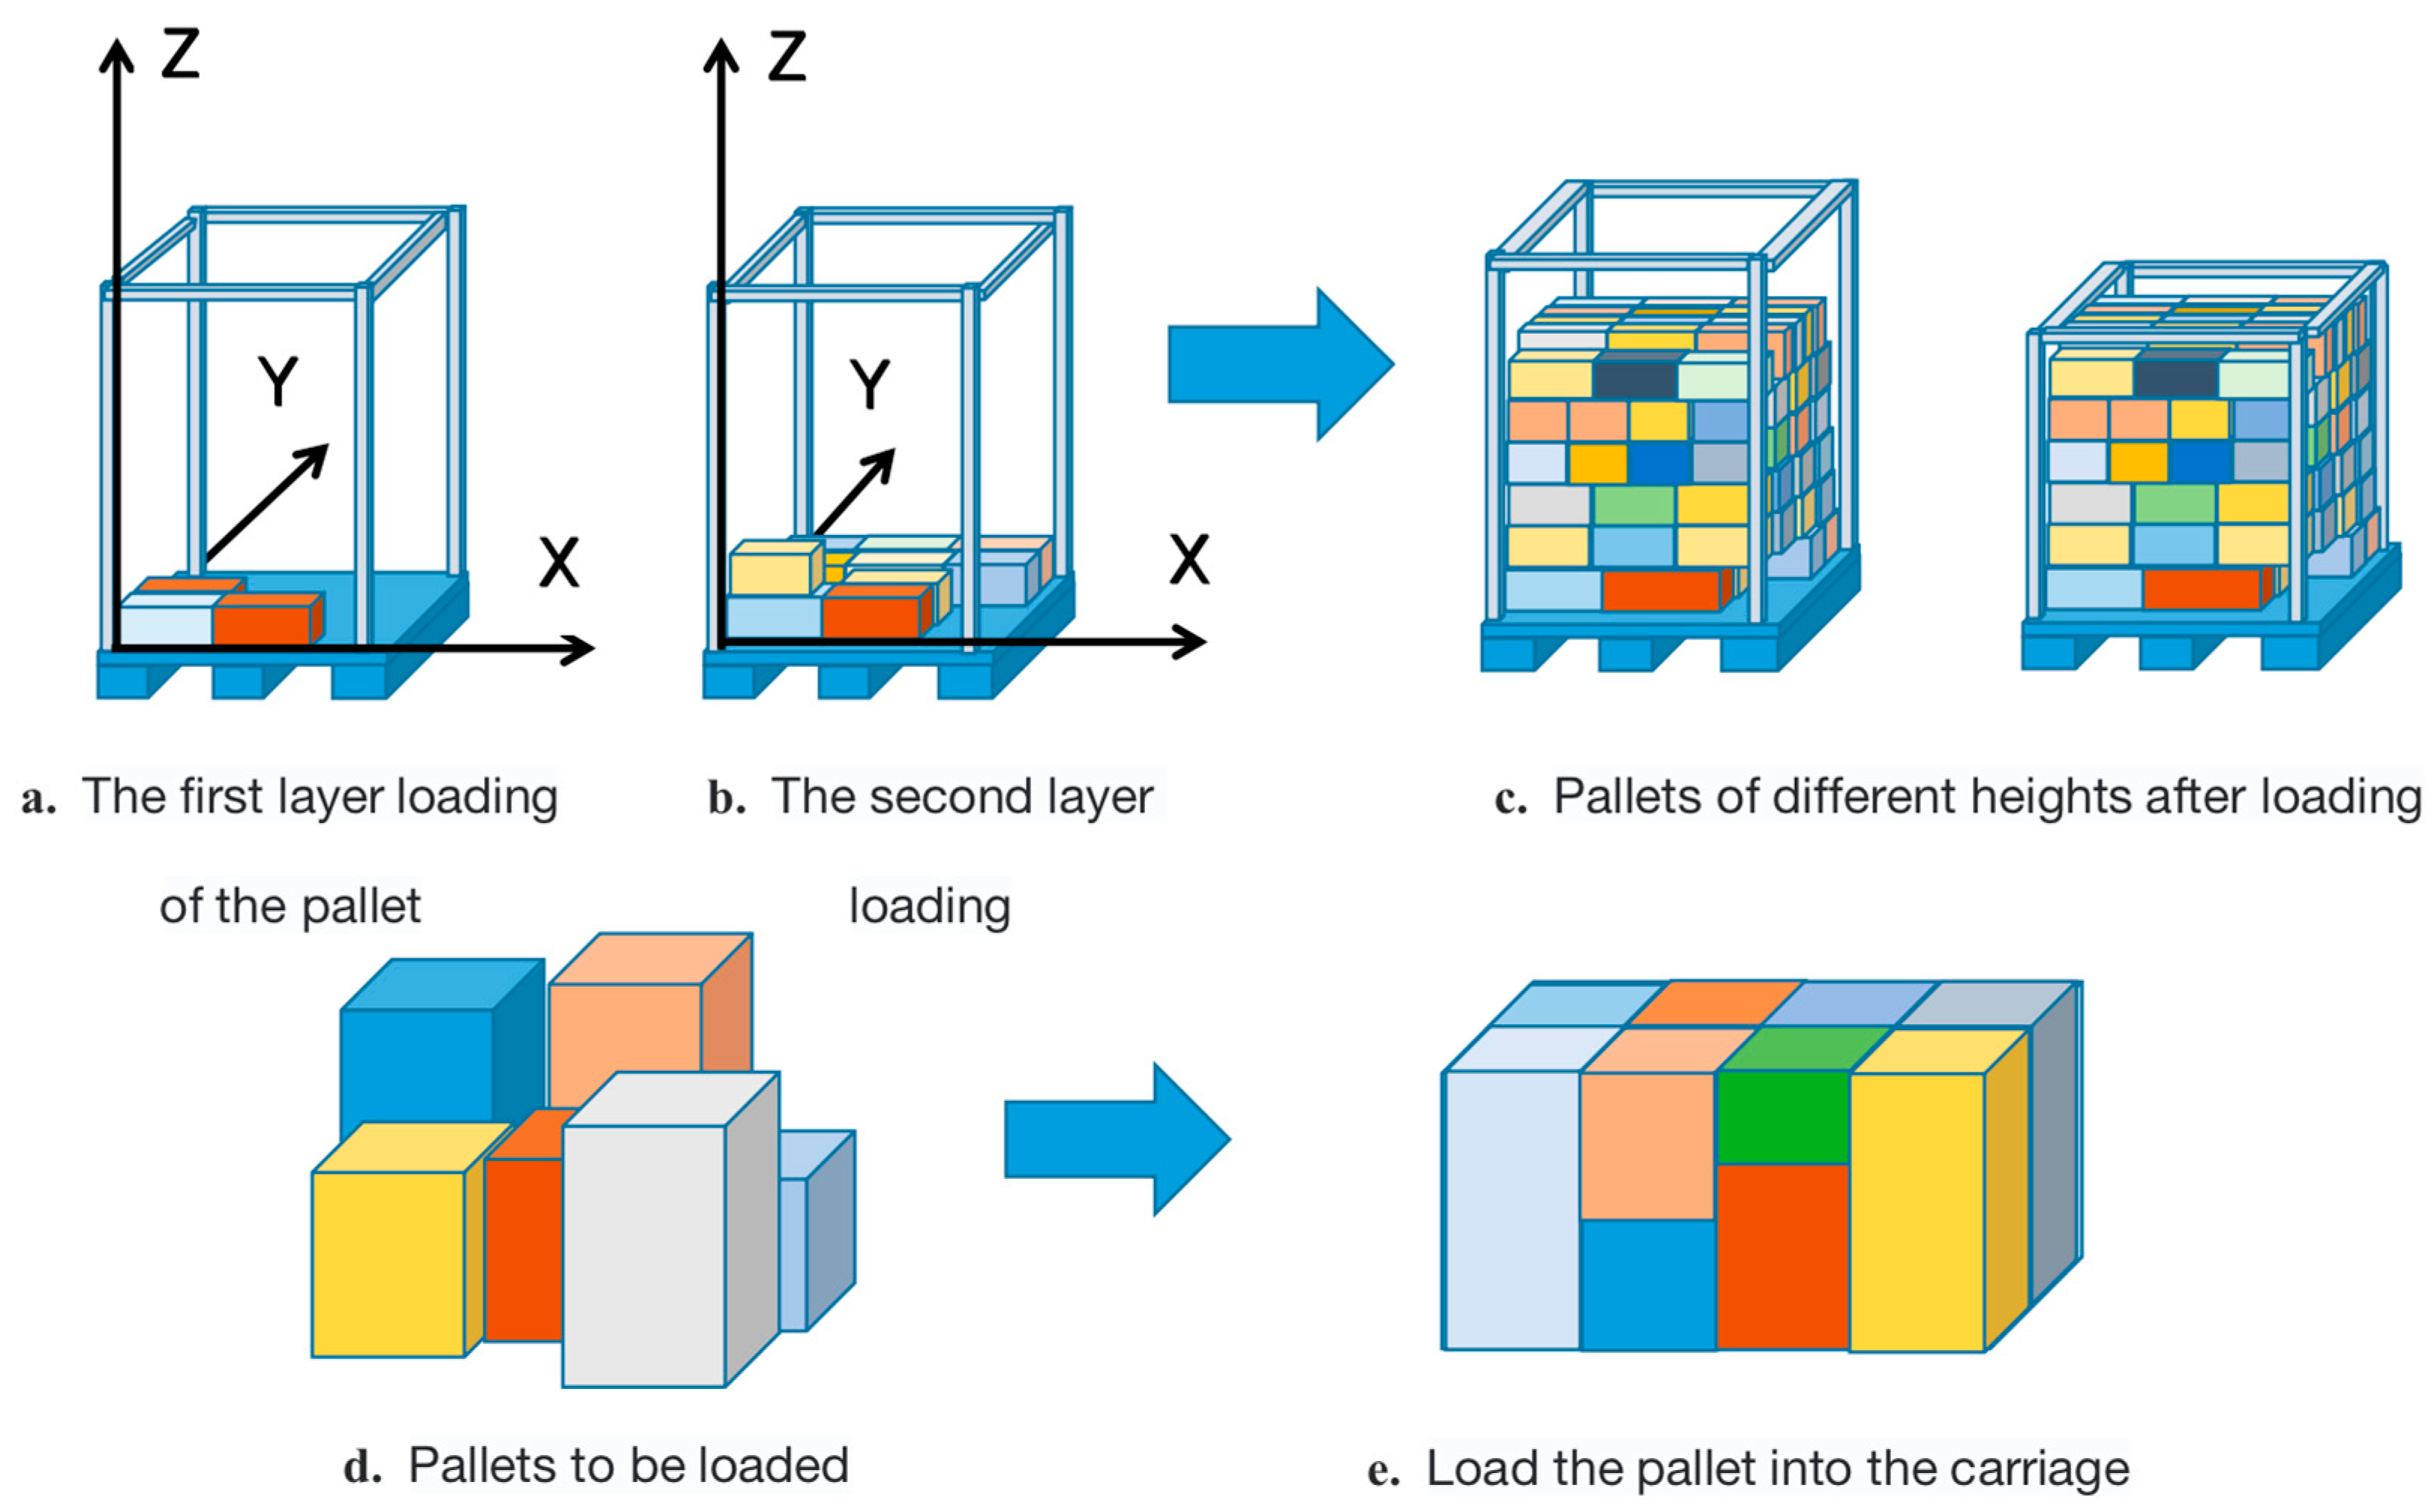
The retractable support structure pallet is used for regular, classified, and uniform stacking of express cargo, as shown in
Figure 1. The structure is conducive to flexible height adjustment and stacking regular yarding according to the number of cargo. Using a 3D loading constraint algorithm can also further optimize the space utilization of the pallet and vehicle. The specific approach is to differentiate pallets according to different customer nodes. When too many cargoes cause the yarding height to exceed the maximum height limit (the carriage height), the next pallet will be used for cargo loading until the cargo yarding of that customer point is completed.
The efficiency of express cargo distribution is influenced by the loading rate of vehicles, cargo loading and unloading speed, and the length of the vehicle distribution path. Under constant vehicle speed, the larger the vehicle loading rate, the faster the cargo loading and unloading speed. Moreover, the shorter the distribution path mileage, the higher the efficiency of vehicle distribution. To this end, this study fully considers the relevant factors to improve vehicle distribution efficiency, introduces height-adjustable 3D pallets for loading cargo, and combines constraints, such as cargo 3D loading space constraints and customer service time window. This study also examines the distribution vehicle path optimization problem with the time window under the 3D loading constraint of pallets.
Evidently, using the 3D loading method for express cargo can improve the operational efficiency of the whole logistics system. To sum up, this study explores the vehicle path optimization problem with the time window under the pallet 3D loading constraint, considering the constraint of cargo for pallet 3D loading and the time window and cargo demand at the customer point. Influenced by the time window of customer points and various cargo demands, the traditional cargo loading and distribution method have the problems of low vehicle loading rate, violation of distribution time window, and high total cost of logistics operation. The 3D space of distribution vehicle loading is optimized and designed to adjust to maximize the utilization efficiency of logistics resources and improve the vehicle loading rate. In addition, constraints, such as 3D pallet loading and customer service time window, are introduced to build a dual-objective vehicle path optimization model with the maximum loading rate of distribution vehicles and the minimum total cost of logistics operation. The distribution path optimization scheme using traditional 3D loading distribution and optimization based on the 3D loading of pallets and combined with the field research data is compared and analyzed.
Figure 2 shows the results, and the color of goods in the figure is only used for distinction.
Suppose the speed of the distribution vehicle is 25 km/h, the cost of distribution per kilometer is CNY 4, the cost of violating the time window is 35 CNY/h, and the time of unloading each pallet is 0.083 h.
Figure 2a shows the traditional 3D loading distribution, which has the highest loading rate as pallets are not used as loading and unloading carriers. Suppose the volume of goods (16.8 m
2) is loaded into the vehicle, and the loading rate is 87.5%. In this case, it takes approximately 0.5 h for cargo differentiation and unloading work to reach the customer point.
Figure 2b shows the 3D loading scheme for pallets, which is to load the pallets first by site number and then into the compartment, maximizing the space inside the vehicle.
Table 1 shows that based on the above conditions, the use of the pallet 3D loading scheme can save more time and cost than the traditional 3D loading scheme in terms of loading and unloading speed and can maintain a high loading rate.
3. Modeling
3.1. Research Hypothesis
This study is based on the following assumptions to facilitate the research.
(1) Express cargo packaging is a regular rectangular box shape; this study does not consider the loading situation of bagged goods.
(2) The goods are sorted from the largest to smallest in volume to improve the utilization rate of layer theory, with a difference of no more than 5 cm between the adjacent height of goods. With sufficient support by default, when the total volume is less than the pallet volume, the goods can be loaded onto the pallet; that is, the upper layer of goods will not deform the lower layer of goods.
(3) Gaps created through layer theory are automatically filled by the upper layer of goods moving down, and only the loading rate component is calculated in this study.
(4) The quality of the goods in the carriage, the gradient in the route, and others do not affect the cost per distance delivered.
(5) The traditional 3D loading scheme of the vehicle takes at least 0.5 h per customer point for the unloading process by default owing to the need to differentiate the cargo at each customer point.
(6) Each distribution vehicle is responsible for one distribution route, and any two distribution vehicles do not cross-service the same customer point.
3.2. Load Design
For the loading design of the pallet and carriage, this study uses the layer theory for the 3D loading constraint design. As shown in
Figure 3a,b, the specific steps are as follows.
Step 1: Reorder the 3D of the goods being loaded in the order of .
Step 2: The initial traversal sequence is generated by sorting the volume of the goods in order from largest to smallest.
Step 3: The pallet is given to the height of the carriage as a height constraint, and the leftmost-outer side of the pallet is used as the coordinate origin to check whether the three dimensions of the goods satisfy .
Step 4: For goods that do not exceed the pallet constraint, first check , if they exceed the condition and then check the next goods. If they do not exceed the pallet height, then check , or else update the y coordinate, that is, go up one level for loading. If they do not exceed the pallet height, then continue to check if the length of the goods can fit into the current x-axis, that is . If they exceed, then update the x coordinate and go back to one level for loading, or else put the goods in the current position and update the x, y, and z coordinates again. For example, if the first cargo is loaded in an empty pallet and is detected as not exceeding the pallet in three dimensions, the new detection nodes are updated as , and .
Before the
m pallet in the
kth vehicle is placed into the
n goods, the rightmost-outer coordinates,
,
, and
, of the layer of existing loads are checked to determine if the length,
, width,
, and height,
, of the pallet do not exceed after the
nth load is placed, as expressed by the following:
and
where
,
, and
denote the length, width, and height of the
nth goods, respectively.
After completing the pallets at each customer point, the individual pallets are seen as rectangular bodies of the same length and width and different heights. They continue to the next level of 3D loading using machinery to move each pallet into the vehicle compartment, as shown in
Figure 3.
3.3. Definition of Symbols
Table 2 presents the names and meanings of the relevant variables involved in the study.
3.4. Model Construction
In this study, the total cost of logistics operation and the average vehicle loading rate of the distribution center are taken as the objectives. A vehicle path-optimization model based on 3D pallet loading is established to find the lowest total cost and the highest vehicle loading rate.
The double target expression is as follows:
and
In Equation (4),
denotes the distribution cost of the vehicle
k from node
i to
j in service period
t,
denotes the usage cost of the vehicle,
denotes the time cost of waiting when the vehicle arrives at the unloading site too early, and
denotes the time cost to be borne when the vehicle arrives at the unloading site too late. Equation (5) represents the average loading rate of all distribution vehicles. The volume of the pallet
m of the vehicle
k after loading in service time
T.
is expressed as follows:
For the multi-objective optimal value problem with a maximum value of a percentage and a minimum value of a constant, this study uses the multi-objective linear weighting method to convert Equations (4) and (5) into a single-objective optimization model. The larger the value is, the better the solution. Equation (7) is an objective function formed after conversion [
44].
The objective function is
where
is the weighting factor, which is taken as 0.5 in this study, implying that the loading rate and the total cost are equally important.
is the parameter that ensures that the objective function is non-negative, considering the actual loading problem, and
,
and
are generally taken as the regularization factors of the multi-objective function, which is theoretically obtained through the optimization process of Equation (8).
The constraint condition include
and
Equations (9)–(11) indicate that the 3D limit of the pallet cannot be exceeded when the nth cargo is placed. Equations (12)–(14) indicate that no spatial overlap occurs between any two cargoes. Equation (15) indicates that only one vehicle is assigned to each transport route for distribution. Equation (16) indicates that only one vehicle is accepted at each node. Equation (17) is the elimination of sub-loops in route planning. Equation (18) indicates that the sum of the weight of the goods in the vehicle must not exceed the maximum load capacity of the transport vehicle. Equations (19) and (20) indicate the time of arrival of the distribution vehicle at the customer point. Equations (21) and (22) indicate that the time of departure and arrival of the distribution vehicle at the distribution center should be within its service time window as far as possible. Equations (23)–(25) are decision variables.
4. Algorithm Design
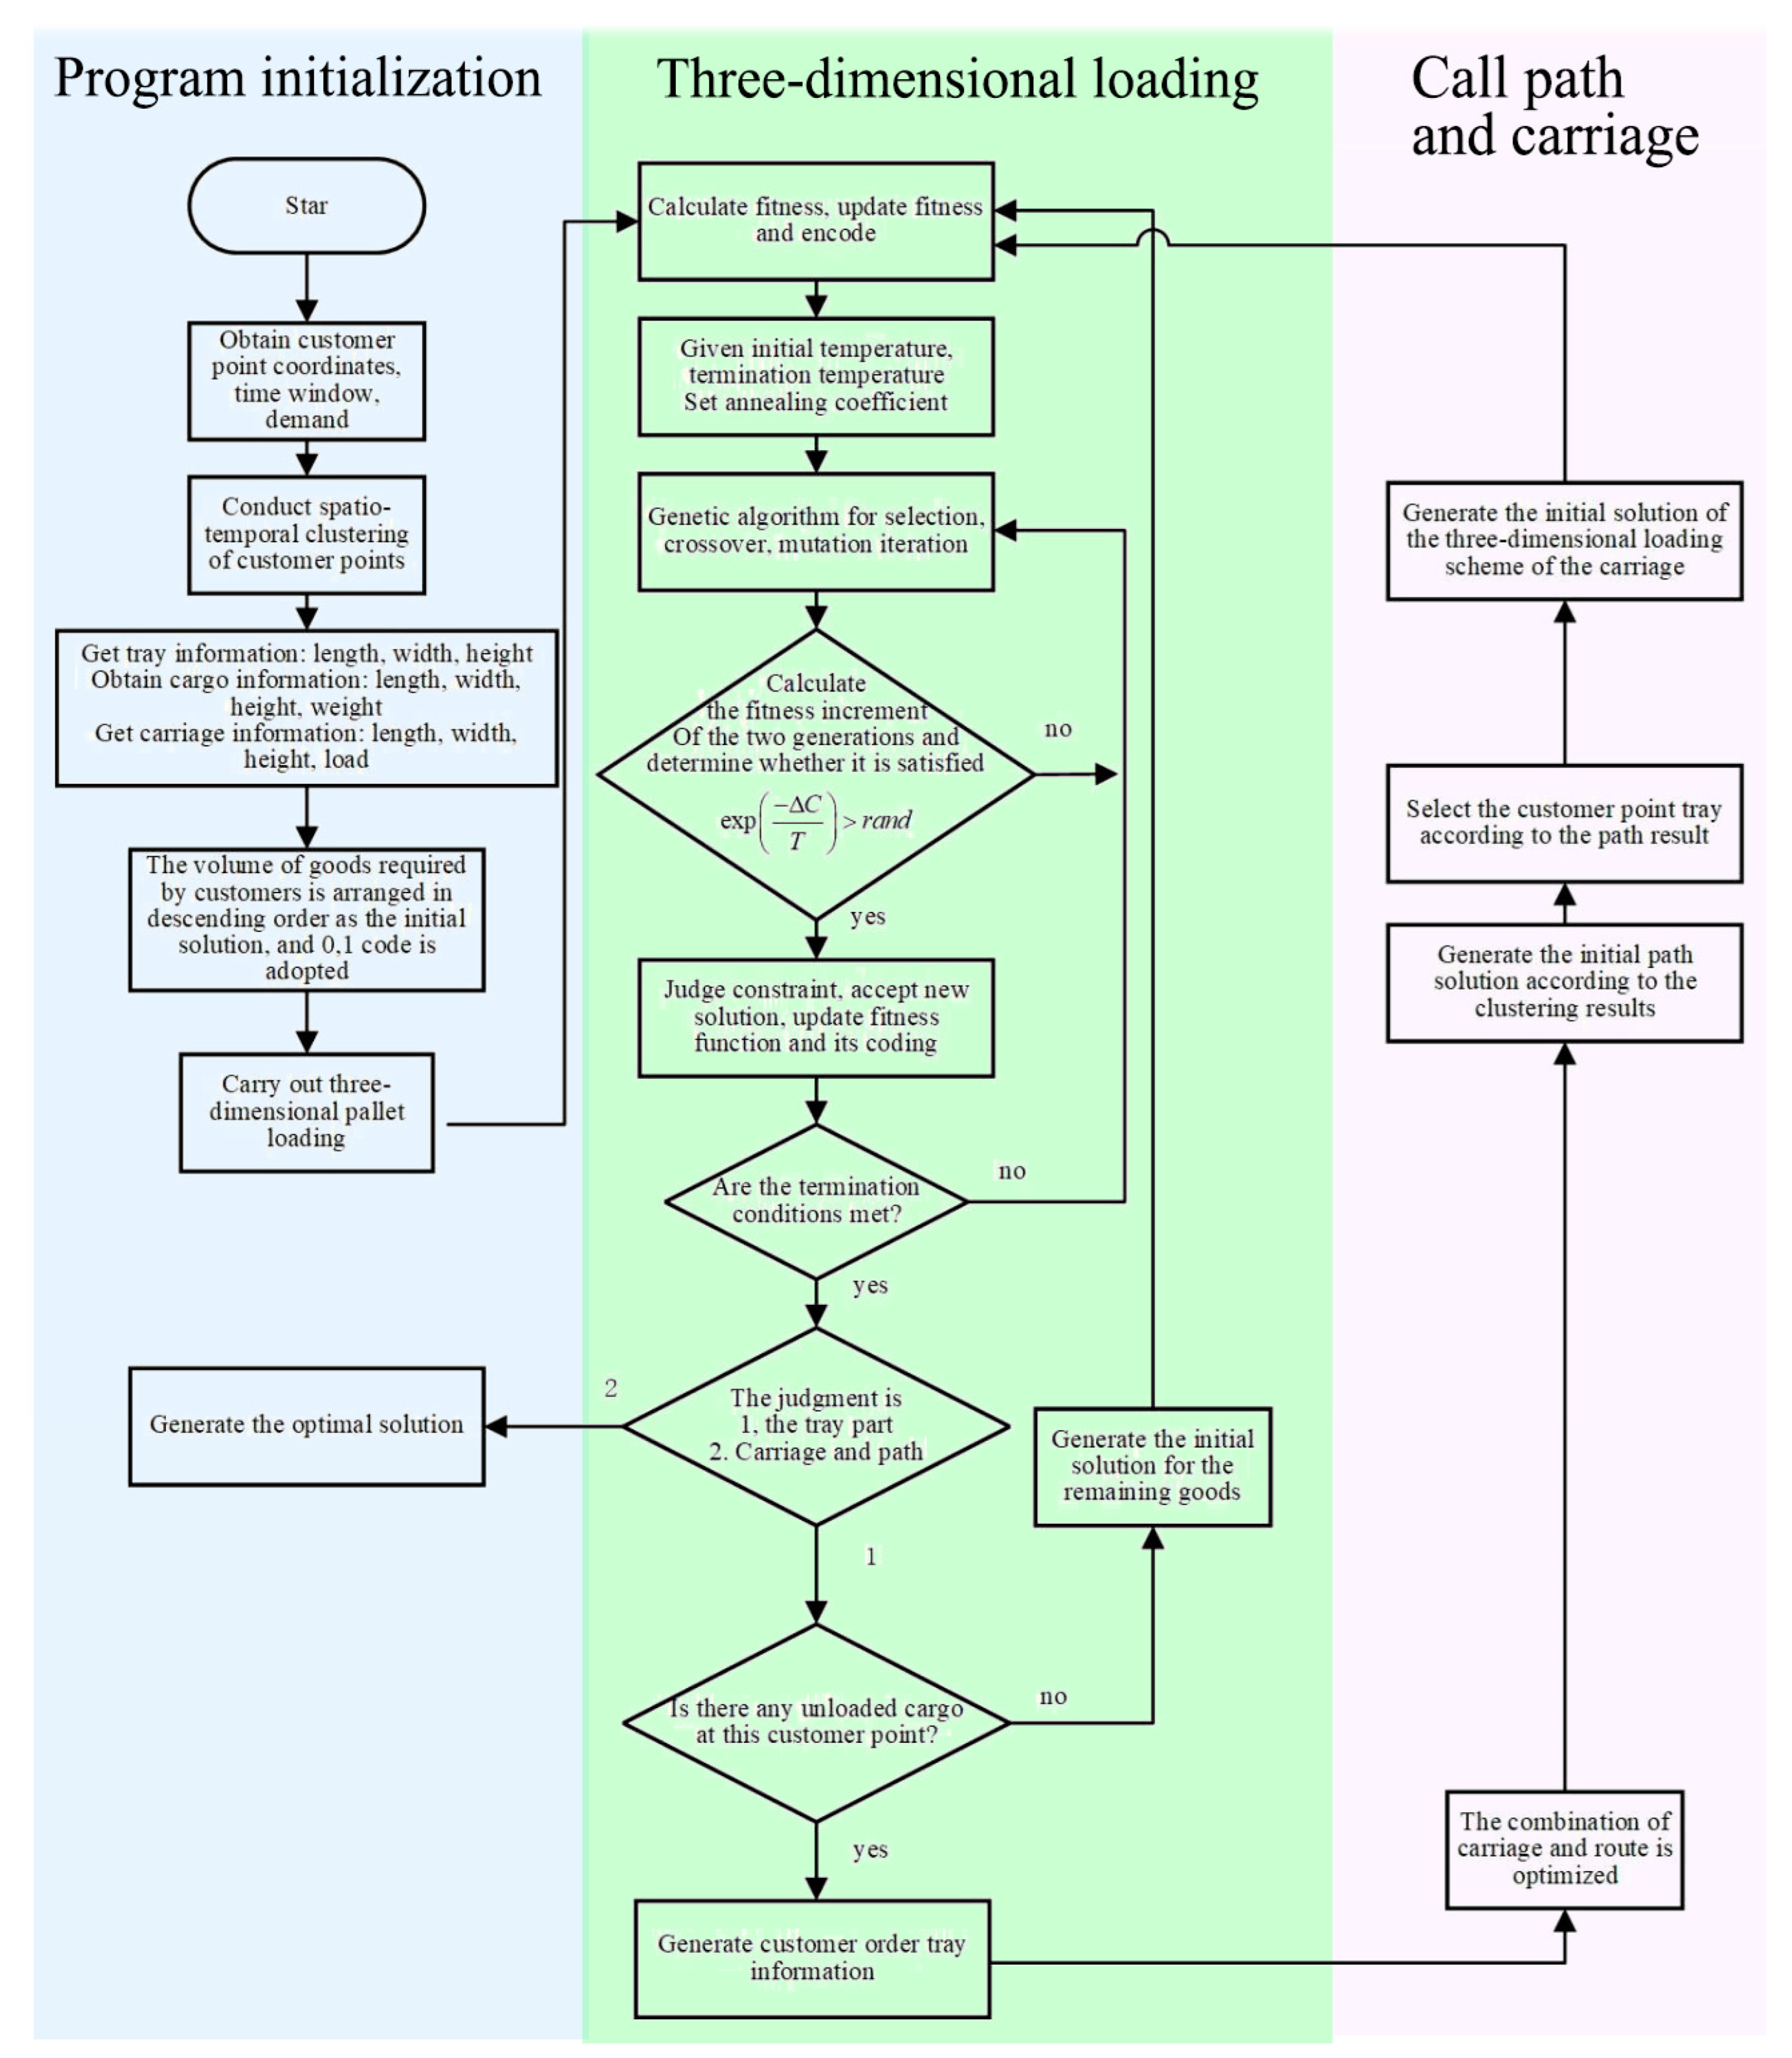
4.1. General Design of the Algorithm
In this study, a hybrid simulated annealing-genetic algorithm is used for the solution algorithm. The algorithm is mainly divided into three parts, program initialization, three-dimensional loading, as well as path and carriage calling. The first step is spatio-temporal clustering of the positions of each logistics node in space and updating the clustering center to obtain better clustering results. Then initialize the initial sequence of goods, carriages, iteration information, and so on. Next comes the 3D loading part. Here, we need to use the loading logic of hierarchy theory to judge the goods in the sequence one by one. The fitness is calculated, and a new sequence is generated by the crossover, variation, and selection operations of the simulated annealing-genetic algorithm. Moreover, a new solution is obtained through testing, the solution corresponding to the highest fitness is selected in the process of continuous annealing iterations, and the goods that are not loaded are packed as new goods to be loaded into the next pallet. The path and carriage call section is responsible for the carriage loading and the output of the optimal solution. Then, the hybrid simulated anneal-genetic algorithm is also used to generate the optimal scheme according to the clustering results, carriage loading, and volume weight constraints. Finally, the results of total distance, loading rate, total cost, and loading and unloading time are obtained.
Figure 4 shows the algorithm flow chart.
4.2. Spatio-Temporal Clustering
This paper combines the spatial location of each logistics distribution point with spatio-temporal clustering of logistics nodes to facilitate path optimization and reduce the running time of the algorithm [
27]. Customer clustering is a way to obtain better logistics network configurations and ensure efficient distribution.
4.3. Simulated Annealing-Genetic Algorithm
For VRP problems, using exact solutions is generally more difficult, and the computational speed is comparatively slower. At present, domestic and foreign scholars commonly use heuristic algorithms to solve the path model. The solutions obtained through iteration and other means are of high quality and can be adapted to a more complex and large number of computational solutions. In the process of algorithmic search, the classical heuristic algorithm will continue to search in the direction of the local optimum near the solution that it has searched for, which then keeps repeating to obtain a certain value that cannot continue to obtain the optimal solution. Thus, it is easy to fall into the process of local optimum, which may sometimes be very different from the optimal global solution. This study adopts an improved hybrid simulated annealing-genetic algorithm to solve and avoid this path problem and obtain the optimal global value. When the algorithm finds a value with better fitness than the previous generation, a certain probability,
, will not accept the new solution for iteration [
25]. Instead, the current solution will be accepted to replace the previous generation.
is denoted as the difference between the two solutions of the fitness function before and after the genetic operation, and
T is the annealing temperature. The improved simulated annealing-genetic algorithm combines the local optimal search capability of the simulated annealing algorithm and the global search capability of the genetic algorithm, using the simulated annealing algorithm as the main algorithm structure with cross, variation, and operation of the genetic algorithm for chromosome iteration.
4.4. Coding Design
The coding in this study is divided into the coding of 3D loading and the coding of path optimization, where the initial coding of 3D loading is sorted according to the size of the goods from largest to smallest. Moreover, the coding of the goods for loading is 1; otherwise, it is 0. In path optimization, this study is based on the number of express nodes in order of numbering from 1, 2, 3, 4, 5, 6, ..., n. If a path assignment result of the distribution center is 0→4→2→5→1→0, the path chromosome code is [0, 4, 2, 5, 1, 0], which means that the distribution vehicle starts from distribution center 0, first arrives at customer point 4, then successively arrives at customer nodes 2, 5, and 1, and finally return to distribution center 0.
4.5. Population Initialization
The heuristic algorithm will be influenced by the initial solution. The optimal solution closer to the process of the algorithm solution will obtain better results. The loading part of this study uses the cargo container volume sorted from largest to smallest as the initial population. Clustering is performed before the path optimization process to ensure that the path results for each cluster center are within a reasonable range. Random numbers are used as the initial solution in each cluster center, as follows.
Step 1: determine the location information of logistics nodes 1, 2, 3, 4, 5, 6, …, n and the location information of distribution center 0.
Step 2: set the location information of the distribution center as the coordinates of the origin and calculate the distance using the distance formula between two nodes to produce the distance matrix D.
Step 3: the nodes in the set are arranged in ascending order, and a random number is obtained by the Rand*n function as the node position for swapping the order before and after the chromosome, and the positions are swapped and used as a new chromosome.
Step 4: repeat Step 3 to generate the initial population.
In the case of 3D loading, full loading of the vehicle is used as the initial solution to obtain the best possible loading of the goods into the vehicle.
4.6. Adaptation Function
The fitness function is set , where F denotes the objective function to minimize the total cost in the objective function. The higher the fitness function, the smaller the objective function, and the better the obtained solution. Conversely, a larger value of the objective function indicates a poor result and a lower fitness function.
4.7. Genetic Manipulation
Selection operation: Generally speaking, the high or low parent chromosomes’ fitness affects the algorithm results. The better-quality chromosome fitness function is selected, and the higher probability will be saved. In this study, the parents are arranged in terms of the volume of the cargo from largest to smallest, which can improve the algorithm results.
Crossover operation: During the crossover operation, as the distribution center is the start and end point of the distribution path, the distribution center gene 0 is removed before and after the chromosome before the crossover operation to avoid losing the distribution center during the crossover operation. The crossover uses a local mapping method to perform a two-by-two swap of randomly generated segments, followed by the replacement of duplicate genes. Moreover, the two parts of the crossover operation are independent of each other, as shown in
Figure 5.
Step 1: Randomly select two paternal chromosomes named F1 and F2, select two random numbers from the range [1, N], and choose the segment of the random number interval [begin, end] corresponding to the beginning to the ending of the chromosome for a two-by-two crossover swap.
Step 2: Delete the genes that duplicate the original segment of the new chromosome, and retain the gene segments that are unduplicated.
Step 3: Supplement the deleted gene fragments with unduplicated genes, with the newly supplemented genes arranged in random order backward and forward.
Step 4: Return the new offspring.
Mutation manipulation: Mutation manipulation is the random selection of one or more genes to produce a mutation after the chromosomes are produced by selection and crossover manipulation. First, a certain probability is given,
. Second, two genes are randomly selected to be swapped in the chromosome to produce a new offspring. The mutation swap does not produce duplicate genes and therefore does not require the operation of deletion and addition of duplicate genes. The detail of mutation manipulation operation is shown in the
Figure 6.
4.8. Termination Conditions
Let the initial temperature of the annealing algorithm be , and the termination temperature of the algorithm be . The rate of cooling during annealing satisfies and is a temperature coefficient in the range [0.8, 1.0], which is randomly generated. The cycle is terminated when the temperature is less than or equal to the termination temperature or when the number of iterations reaches 100. In cases where there is a large number of goods, a second or even a third pallet is required for loading. According to the above coding method for loading goods, the loaded goods will be coded as 1. Therefore, the unloaded goods (goods coded as 0) are packed as a new initial solution is generated for loading the next pallet.
4.9. Description of the Procedure
Based on the description, the pseudo-code of the initial sequence preparation for the 3D loading in this study is shown in
Figure 7.
The pseudo-code of the 3D loading logic is shown in
Figure 8.
The rest of the code can be found in the relevant literature and is not shown in this article.
5. Example Analysis
5.1. Case Overview
This study takes the distribution center of an express company in Chongqing, China, as an example to analyze the distribution of 104 customer nodes. The carriage size is 4.8 × 2 × 2.2 m, the vehicle travel speed is 25 km/h, and the maximum load of the vehicle is 15 tons. Moreover, the rental and maintenance cost is CNY 100 per time, the penalty cost of violating the customer service time window during the transportation is 35 CNY/h, the transportation cost is 4 CNY/km, the vehicle arrives with 10 min of preparation, and each unloading of the pallet consumes 5 min.
As shown in
Figure 9, its logistics distribution nodes are distributed around the distribution center 0, its location coordinates, and customer demand time window as shown in
Table 3. As logistics are usually distributed twice a day from each distribution center to the same site, the demand for logistics nodes is calculated on a 0.5-day basis. In this study, the earliest time window for each node is 8 am, and the latest time window is different from each other. There is no specific standard for packaging in the courier industry, so this study uses seven common sizes of goods of varying sizes for study. As shown in
Table 3, the demand for goods varies from one distribution point to another.
As shown in
Table 3, the goods’ serial numbers are arranged according to volume requirements from largest to smallest, which facilitates the layer theory to produce higher loading rates. Goods 1–3 belong to medium-sized goods, 4 to small- and medium-sized goods, and 5–7 to small goods.
Table 4 indicates the demand for all goods (pieces) at each logistics and distribution point.
5.2. Results and Analysis
An example is based on an improved hybrid simulated annealing-genetic algorithm, where the initial temperature is , and the end temperature is . The population size is 150. In this study, the goods are loaded onto a pallet of 1 m in length and 1.2 m in width, and the maximum height of the pallet load is restricted to 2 m, with the pallet bottom bracket being 0.1 m high. Additional pallets can be added when the goods are loaded beyond the 2 m limit. This algorithm runs on MATLAB R2018a, Windows 10 Intel(R) Core(TM) i7-7660U CPU @ 2.50GHz.
5.2.1. Scheme Results
The following is the optimization scheme result of the distribution path under the pallet constraint waiting time window. As can be seen from
Table 4, the scheme can still obtain an average vehicle loading rate of 81.68% after using pallets. The average violation time window of each route is 1.43 h.
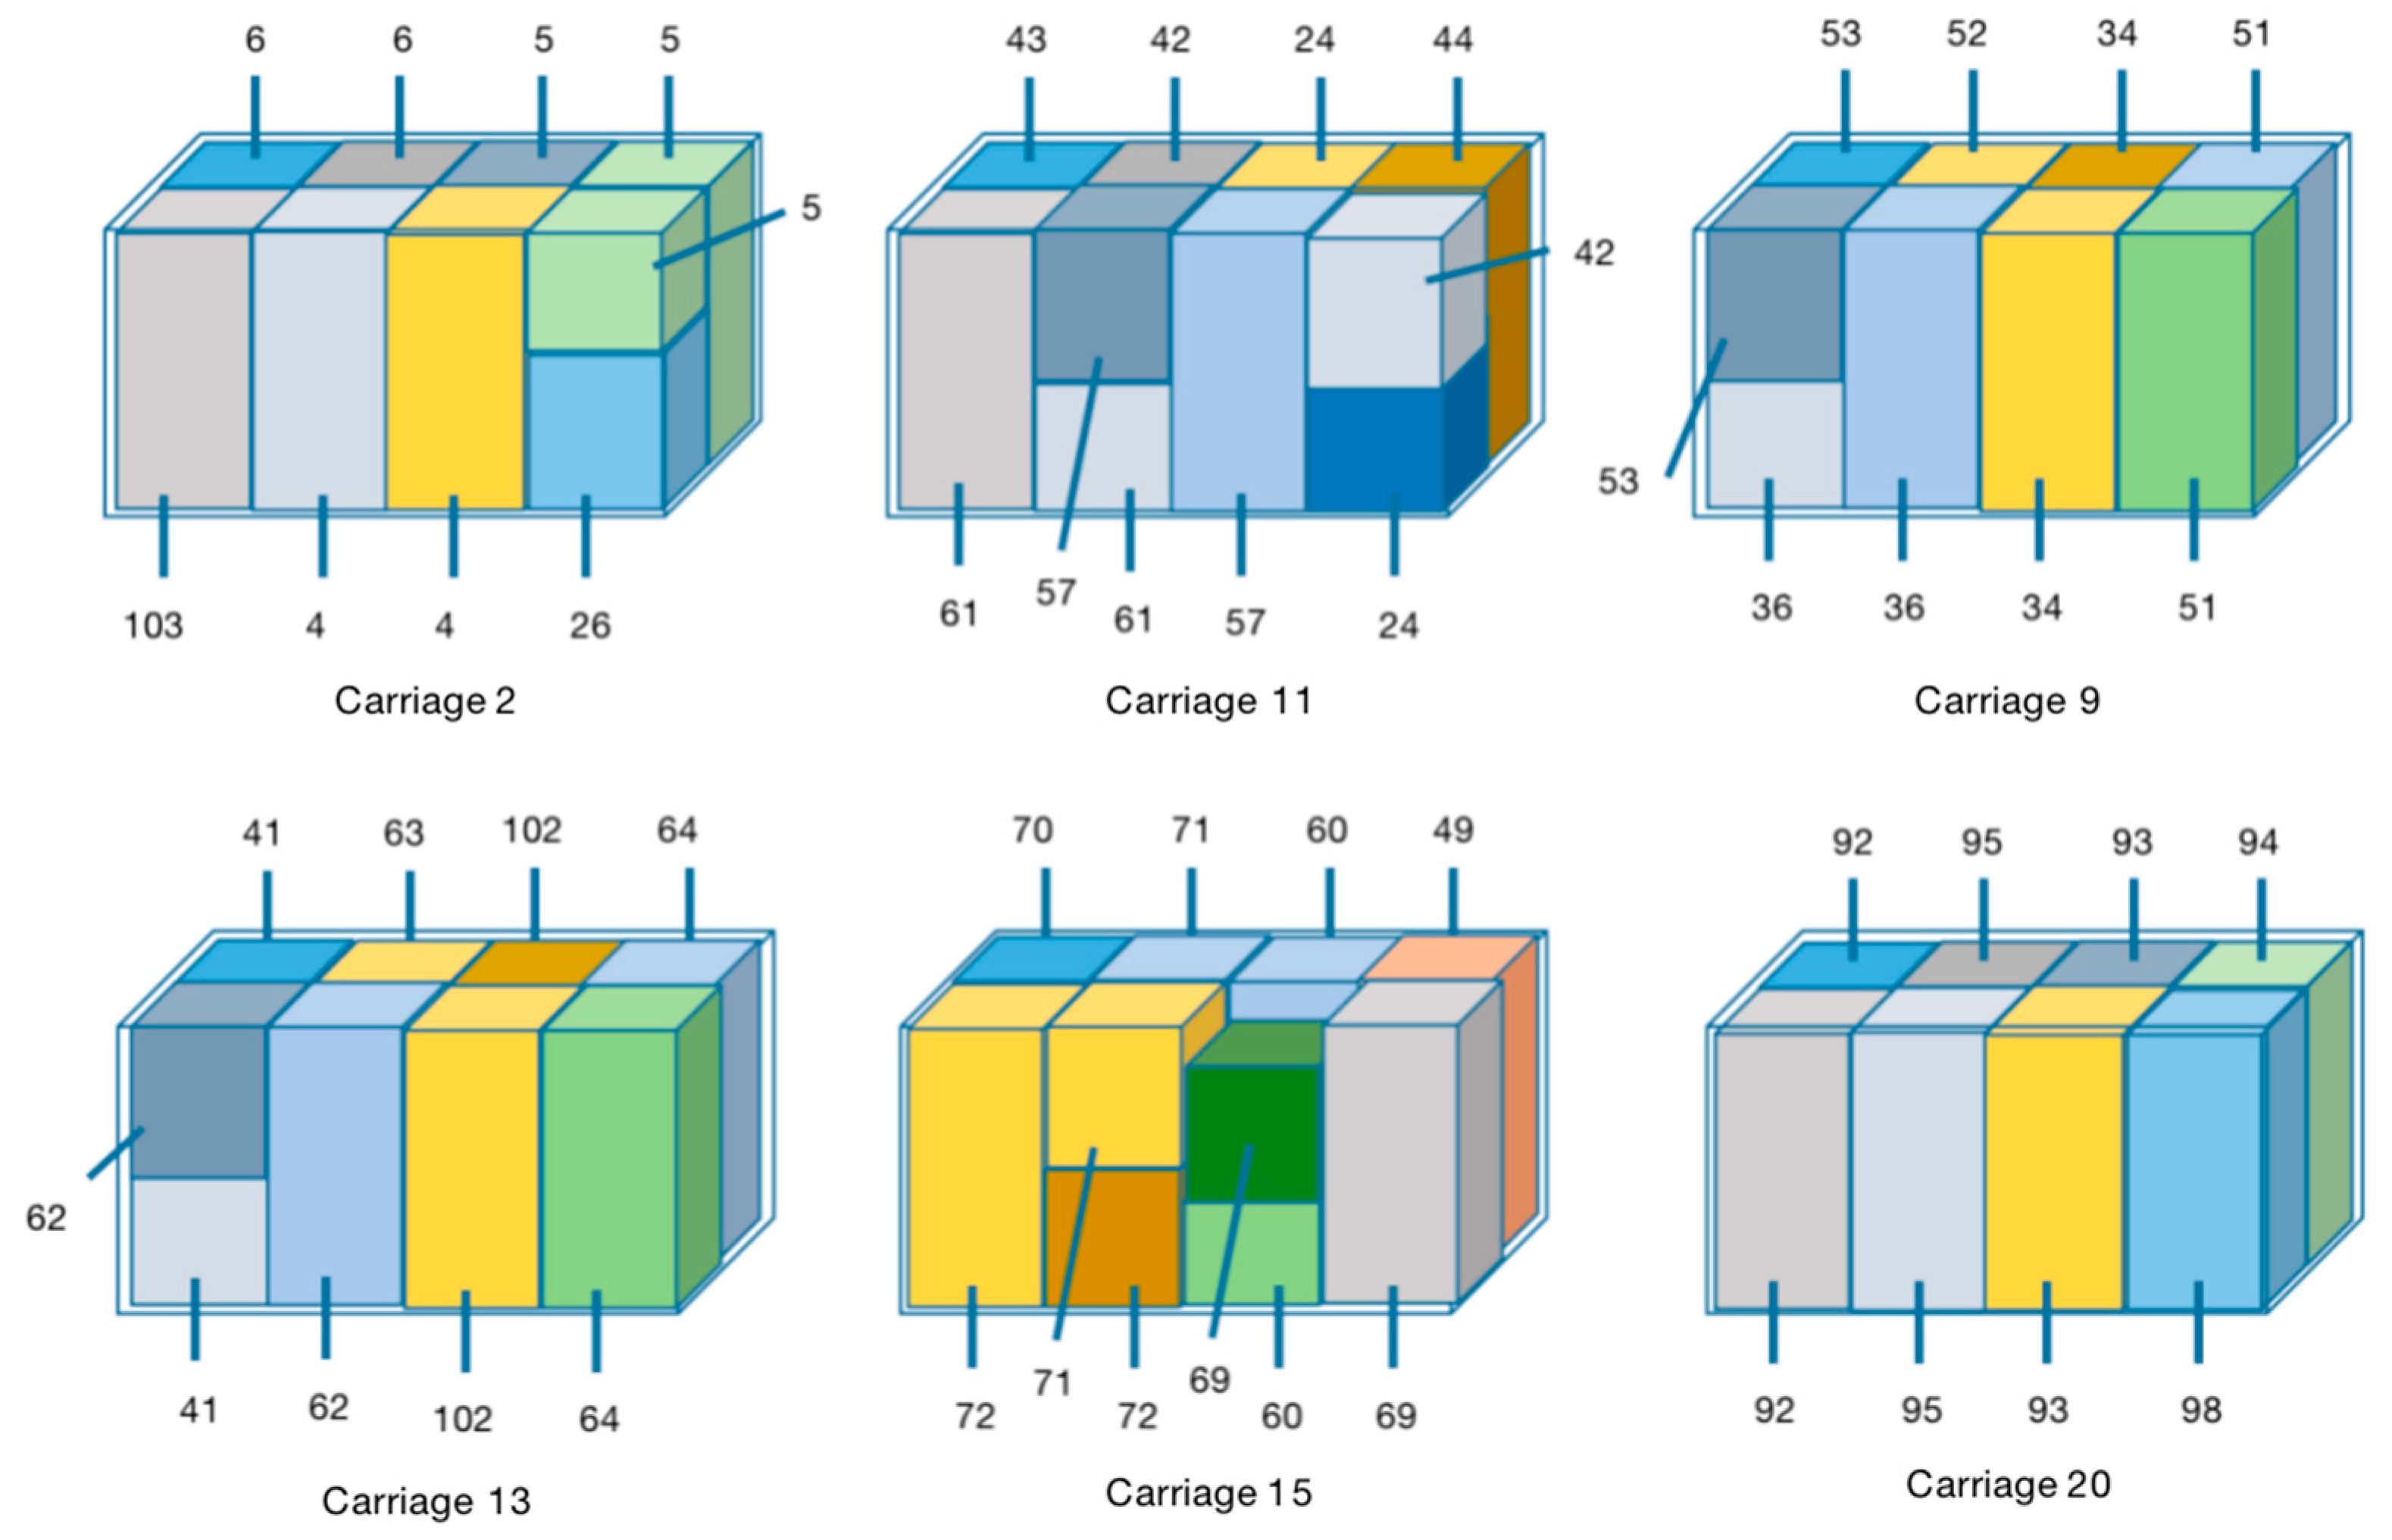
5.2.2. Carriage Loading Results
Figure 10 shows the layout diagram of the pallet in some carriages obtained by the hybrid simulated annealing-genetic algorithm. In this case, each rectangular body is considered a loaded pallet, the number shown is the number of the pallet unloading node, and the left side of the carriage is the direction of the carriage door. The unloading time is different for each node because of the different number of pallets. For example, the distribution route of the first car in the figure is 0-103-6-4-5-26-0. The first delivery is at customer point 15, and it takes 0.083 h to unload one pallet; the second node is at customer point 6, and it takes 0.167 h to unload two pallets; and the third node is 4, and the unloading time is also 0.167 h. Therefore, the unloading time should be calculated according to different conditions for each unloading customer point, and the impact on the service time window should be obtained by combining the distance consumption and docking time.
5.2.3. Pallet Loading Results
In all carriages, pallets at each customer point are loaded in accordance with the goal of maximizing the loading rate. Due to space constraints, we show the pallets loading at all customer points in Carriage 11 in
Figure 10.
Figure 11 is the layout diagram of the pallets, and
Figure 12 is the display diagram of all the customers’ goods after loading into pallets. Pallets are loaded inside the carriage according to the targets’ maximum loading rate. The transport route is 0-43-61-42-44-24-57-0.
The number of goods and the pallet loading rate are positively correlated, as the algorithm will look for the optimal cargo box to be retained in the iteration with a similar height to this layer to reduce the height gap when the number of goods is high in the layer theory. In the example, the cargo demand is generally high, so the loading rate is mostly above 80%. When the cargo is large enough to fill a whole pallet, the pallet loading rate can even reach more than 85%.
5.3. Comparative Analysis and Discussion
This section demonstrates the feasibility of the proposed method. The results are analyzed and commented on the following perspectives: (1) the effectiveness of the proposed algorithm; (2) the superiority of the using pallet.
To demonstrate the effectiveness of the proposed method, we undertake a comparative study with Bortfeldt’s improved genetic algorithm [
31] and simulated annealing (SA) algorithm. The specific experimental data parameters are shown in
Table 5.
As shown in
Table 5, the loading rate of the proposed method is 81.68%, only slightly below Bortfeldt’s method, but only costs 54.85% of the time taken by Bortfeldt’s method. Although the simulated annealing-genetic algorithm can obtain a higher loading rate in a shorter period of time, it is more likely to fall into a local optimum solution. Thus, the average loading rate is affected by the individual lower results and struggles to reach 77.42%. The comparative analysis shows that a hybrid simulated annealing-genetic algorithm can obtain higher loading rate results in a shorter period of time.
In addition, to reflect the advantages of using pallets, a comparative analysis between the scheme of the three-dimensional pallet loading and the traditional three-dimensional loading was conducted. The following is the overall scheme discussion of the case. Part of the research results made in this paper mainly includes the optimized loading rate of the path under the three-dimensional pallet loading scheme and the ordinary three-dimensional loading scheme, the time window of violation, the total cost and the target value, as well as the comparison of the two schemes in the unloading time consumed. The number of pallets used has an effect on the loading rate in the carriage (mainly from the independence of the pallets and the volume of the pallets themselves).
As shown in
Table 6, the average vehicle loading rate of 83.18% for the traditional 3D loading solution is higher than 81.68% for the 3D loading solution using pallets. However, owing to the lack of loading and unloading carriers, a significant amount of time is consumed for loading and unloading work when the node is reached, resulting in an average violation time window of 3.81 h for the former and only 1.43 h for the latter. From the target values, the pallet 3D loading solution is superior to the traditional 3D loading solution when the vehicle loading rates and distribution costs are considered. The unloading times for the two options are compared as follows.
As presented in
Table 7, the difference in time cost between the pallet loading solution and the 3D loading solution is mainly the time spent on unloading the goods. The 3D loading solution with pallet loading uses a forklift to unload the pallets as a unit to differentiate the customer nodes when unloading the goods, and the time spent is 29.85% of the time spent on traditional 3D loading. By contrast, traditional 3D loading not only takes time to differentiate between customer nodes of goods but also requires manual unloading, which increases the risk of errors in the process.
The study also further classifies palletized 3D loading distribution vehicles into four categories based on the number of pallets loaded in the carriages, no pallets (traditional 3D loading solution), eight pallets, nine pallets, and ten pallets, to explore the effect of the number of pallets on the loading rate of the carriages. The graph below shows the average vehicle loading rates for each type.
As depicted in
Figure 13, the loading rate decreases by 0.19875% on average for each additional pallet from no pallets to eight pallets; increasing from eight to nine pallets decreases the loading rate by 0.095%. However, when increasing to 10-pallet carriages, the use of pallets has a greater impact on the vehicle loading rate, decreasing by 2.56%. Therefore, under this data condition, the loading rate of the vehicle with up to nine pallets smoothly decreases. However, as the number of pallets increases, its effect on the loading rate increases, and the process is a non-linear one.
5.4. Management Insights
Optimization of 3D loading is a crucial link in the process of transportation and distribution. The improvement of the loading rate can reduce the occurrence of unreasonable transportation. It is a more standardized and specific form of zero-load transportation in the development process of modern logistics. In this study, for the logistics distribution vehicle routing problem with a time window under the constraint of 3D pallet loading, a pallet with adjustable support structure height is introduced as the intermediate carrier of loading and unloading. Combined with the customer point routing problem as well as the time window, a two-stage 3D loading optimization scheme is carried out, which improves the loading rate and reduces the time cost. The management insights can be summarized as follows.
(1) The use of pallets improves the efficiency of cargo handling. Compared with the traditional space division strategy, hundreds and even thousands of goods can be integrated by taking the pallet with the height of the retractable support structure as the unit of the minimum customer point goods. Using a forklift to remove the pallet greatly improves the loading and unloading speed, reduces the residence time of the customer point, and enables the distribution vehicles to flow more flexibly in the path. In the future, this method can be operated on the basis of existing equipment, such as pallets, forklifts, and box trucks, as well as computers, and can also be further adapted to the development and application of fully automatic AGV vehicles, bar codes, PDA, RF, and other technologies. It adapts to the development trend of automation and information technology of modern logistics that will make production more efficient.
(2) High loading rates reduce the number of vehicles used. Reducing the loading gap in the distribution carriage can reduce the occurrence of irrational transport. Through the 3D loading optimization and the cooperative use of loading and unloading equipment, the carriage can no longer strictly follow the principle of “first in, last out”, which can make full use of the interior space and reduce the use of distribution vehicles. It not only promotes the sharing of logistics resources and reduces logistics costs, but more importantly, it can reduce carbon emissions and promote the development of green logistics.
(3) Two-stage three-dimensional loading can save more time. In this paper, two stages of three-dimensional loading are proposed, which can greatly save delivery time and reduce the time cost by optimizing the line and considering the time window. The first stage is to integrate the goods from the same customer point and load the goods into the pallet, which is more convenient for centralized operation. Different specifications and different natures of the goods need independent packaging to meet the special protective requirements. In the process of dealing with a large number of express delivery, a chaotic situation is easy to appear, and this hidden danger is not perceived in the process of transportation. Multi-stage loading can not only meet the transportation requirements of different goods but also centralize the processing of multi-batch goods. In the express industry, the customer attribute is more complex than in enterprise transportation. Often, there will be a variety of single processing, especially when it is time to find a lost delivery or pick up goods in the new transfer station; the sorter can handle only the inside of the pallet or the whole pallet, which is much more convenient than handling an entire carriage of express goods.


