Article

Spatial Concentration in Relation to Industrial Resilience

Department of Land Economics, National Chengchi University, Taipei 11605, Taiwan
Sustainability 2023, 15(4), 3546; https://doi.org/10.3390/su15043546
Submission received: 12 December 2022 / Revised: 10 February 2023 / Accepted: 12 February 2023 / Published: 15 February 2023

Abstract

:
The resilience of industry has caught much attention since the outbreak of the COVID-19 pandemic. Most of the literature argues that spatial concentration is beneficial to industrial development, but few reports discuss its impact on industrial survival from a long-term perspective, namely resilience. Therefore, this study tries to answer whether spatial patterns impact the long-term survival performance of the industry through investigating the longevity of production sites. We take the semiconductor industry in the Hsinchu area, Taiwan as a case study and hypothesize that the survival period of production sites in clustered areas is longer than that in non-clustered areas. After conducting the research, it was found that the survival period of production sites in clustered areas is not always longer than non-clustered areas. Our results show that only larger clusters and those with higher degrees of clustering might have advantages toward longer survival, rather than the number of average-sized clusters. Our research pioneers in the field of sustainability by bridging spatial studies and industrial resilience theories. As it explores the resilience of an influential industry in the world, its outputs provide new suggestions for future industrial planning, resource distribution and regional development.

1. Introduction

Sustainability in an ever-changing environment requires resilience at many levels. Among all, the industry, which concerns human communities and economies, is a crucial player. In the words of Fiksel [1], under the ever-increasing complexity and volatility that sways the world, sustainability, too, needs dynamism to cope with uncertainties. Resilience and sustainability are directly linked. Gunderson and Pritchard [2] even consider that resilience, the ability to recover from disorder, is the essence of sustainability. The outbreak of the COVID-19 pandemic in 2020 has created serious impacts toward the industry, and the calamity has led people to pay attention to resilience, carrying out a series of discussions to improve industrial resilience. To be able to swiftly recover from the cataclysm, it requires urgent review of resilient and sustainable strategies.
This study intends to discuss the relation between industrial resilience, namely survival, and spatial concentration (clustering). It raises the research question of whether some spatial patterns impact the long-term survival performance of the industry and, therefore, contribute to resilience, which leads to sustainability. In terms of industrial development, many have proved the positive effects of spatial concentration for labor productivity, cost reduction and knowledge exchange [3,4]. However, these benefits alone cannot properly indicate resilience. In general, resilience is described as a dynamically adaptive process [5], and, through resilience and recovery, the system will return or move to one or several equilibriums [6,7].
In this paper, the concept of “survival”, “longevity” and “resilience” all refer to the state of withstanding and overcoming shocks and all lead to sustainable outcomes. Industrial resilience is essential to the survival of industries, ensuring their longevity, and a resilient industry has a good long-term survival performance. An opposite concept is mortality, and a high mortality rate signifies lower survival, shorter longevity and less resilience, which is unsustainable. To verify the research question, this study hypothesizes that the longevity of production sites in a clustered area is longer than those in a non-clustered area. We take the semiconductor industry in Taiwan as a case study, analyze the survival performance of all operating firms in the Hsinchu area based on a dataset for every year during the period of 1997–2020 and calculate the survival period of each production site. It uses the corresponding geographic information to survey the relationships among industrial clusters, long-term survival performance and a range of spatial patterns.
There are two main contributions from our research.
(1)
The first is an in-detail analysis of the long-term survival performance of the Taiwanese semiconductor industry, with regards to spatial patterns. Our first-hand data are provided by the Taiwanese government; thus, the case study serves as a novelty to the academia. These days, semiconductors are regarded as “the oil in the 21st century”, and the Taiwanese semiconductor industry has been an astute production on a global scale for decades. In 2020, Taiwan contributed 21% of highly sophisticated semiconductor products to the global supply, and the pandemic further accelerated the 4th Industrial Revolution, which urged all nations to purchase semiconductor products that are the core to high-tech manufacturing [8]. As semiconductor manufacturing in Taiwan is such an influential industry that is starring on the global stage, its resilience and impacts on sustainability are some things worth looking into.
(2)
Our second main contribution is from our results. Interestingly, we discover that certain thresholds might exist in some spatial indicators, which would significantly affect survival performances. For example, although there is a strong positive correlation between the degree of clustering and survival performance, its effects might not be in a linear manner, and a certain threshold may exist that alters the performance significantly thereover.
Practically, as the semiconductor industry is a nation-supported and influential product worldwide, the unique findings may provide future decision-makers with new suggestions for industrial planning, resource distribution and regional development. Furthermore, this research contributes to the field of sustainability with industrial resilience knowledge and theories in depth. As most of the literature discusses only the environmental dimension when it comes to sustainability, this research sheds light on the economic and industrial aspects of sustainability. Our research is pioneering in this field, and no other similar studies can be found.
To provide the structure of this paper, the “introduction” section is followed by the sections of “literature review”, “research design”, “results”, “discussion” and “conclusion”. To better understand the context of the research question, this paper will first explore the nature of resilience by reviewing resilience theories and understanding how resilience contributes to sustainability. This literature review part clarifies how agglomeration economies and clusters impact industrial development to answer the question related to the relationships between spatial concentration and industrial resilience. After that, we discuss sustainable actions that improve resistance in industries. In the research design section, it will illustrate the research concept based on the literature reviews above and explain how this research is designed. The two following sections will present the results of the average survival periods of clustered and non-clustered areas, respectively, and discuss the correlation between spatial patterns (such as cluster numbers, cluster size, degree of clustering, etc.) and survival performance. Finally, the last section presents the conclusion and discusses limitations and future research.

2. Literature Review: Resilience and Sustainability

2.1. Resilience for Sustainability

The modern concept of sustainability can be traced back to the 1987 Brundtland Report. Sustainability was defined as satisfying the needs of the present generation without compromising future generations [9]. It touched upon the concept of resilience by addressing that advanced technology, stronger national economies and a developed institutional infrastructure give resilience in the industrial world. Nowadays, most organizations are conscious that new concepts such as sustainability, digitalization, resilience and agility are crucial for the competitiveness of a company. However, despite these concepts having become common for both scholars and practitioners, for industries to have resilience, sustainable actions need to be in place to improve supply chain resistance [10].
As resilience directly impacts sustainability, to maintain or improve sustainability, we may look into the causes that improve or hamper resilience. After Royal Dutch Shell conducted a historical study to understand what contributes to corporate longevity, they identified four distinguishing factors: “sensitivity and adaptability to the business environment”, “cohesion and sense of identity”, “tolerance of diversity (decentralization)” and “conservative use of capital” [11]. Actions that improve resilience and sustainability are often qualitative and hard to measure but can be illustrated as guidelines for the industry. Fiksel [12] outlines some major characteristics that contribute to industrial resilience: “diversity” (existence of multiple forms and behaviors), “efficiency”, “adaptability” and “cohesion” (existence of unifying forces or linkages). From a top-down approach, good national or regional policies can strengthen resilience and promote sustainability. Under the pandemic, regional frameworks emphasized the importance of keeping the markets open in order to maintain the resilience and sustainability of regional supply chains [13]. To provide a resilience strategy after suffering from severe socio-economic loss from the pandemic, D’Adamo and Lupi [14] have outlined several actions toward sustainability, which include “circular premium”, “green reputation”, “eco-design and bio-based materials”, “efficient use of utilities”, “responsible human capital management”, “traceability”, “sustainability certification” and “incentives”.
Some of the literature highlights technology as a solution to combat the causes that disrupt resilience. Combating counterfeit products ensure product quality and prevent losses that lead to unsustainability, and technologies such as blockchain can be effective in improving traceability of products at various stages of the supply chain [15,16]. For the semiconductor industry, some worry that certain manufacturing subprocesses, guarded by trade secrets, can involve hazardous chemicals, and come up with alternative materials as more sustainable options [17]. Others have proposed new techniques for quality control and production line automation to promote economic sustainability [18].
This research evaluates the survival performance of production sites rather than individual firms, but the above actions that improve firm performances can be applied to production sites in the same manner.

2.2. Definitions of Resilience

Resilience can be defined as the strength of survival after encountering shocks. Holling [6] was the first to raise the term “resilience”, and it is most often addressed in three forms: “ecological resilience”, “engineering resilience” and “adaptive resilience”. According to Holling [6], Walker [19], O’Neill et al. [20] and Pimm [7], both ecological and engineering resilience refer to the ability of maintaining, recovering or transforming a system’s state from disturbances in a single equilibrium. In terms of adaptive resilience, it is simply regarded as the capability to adapt, or how well a system restructures itself in response to shocks, and it is not limited to one single equilibrium [21,22,23,24]. In the literature on economics studies, the engineering perspective is widely used to explain shocks and recessions [25,26,27], although, regional or local economic systems do not always aim to reach an equilibrium [5]. In fact, economics itself is not only a static characteristic, but an evolutionary process of recession and recovery. When a system recovers from recession, the evidence of adaptation will be hard to present. As a result, the empirical studies of economic resilience evaluation usually adopt an engineering perspective and define the economic system as resilient once the indicators can recover and reach the expected development. To illustrate the concept of resilience in a simple way, we can imagine it in terms of the trajectory of a ball. When encountering a crisis, the ball rolls down the hill, but, if it has the momentum to be able to bounce back and climb upwards after reaching the lowest point and not falling back again, it is considered as resilient (see Figure 1.).
This research explores the industrial aspect of resilience, but, since economic resilience is still more widely discussed compared to industrial resilience, we first look at discussions surrounding economic resilience and draw the relevance with respect to industrial resilience. Generally, indicators used to evaluate economic resilience include employment [28,29], GDP [30,31], macroeconomic stability, microeconomic market efficiency, governance and social development [32], etc. Meanwhile, Sensier et al. [33] argue that some indicators may not be appropriate for economic evaluation since they may lead to later problems of autocorrelation. This argument reminds researchers to consider indicators’ interpretability to resilience. Regarding the industry, especially manufacturing industries, the GDP per capita is usually higher than the other industries and plays a critical role in the economic system. The method of evaluating industrial resilience is somehow similar to that of evaluating economic resilience. Since economic resilience is hard to define in one single perspective of resilience, Rose [34] advances a universal argument, that economic resilience is essentially related to loss reduction and survival from impacts. In this sense, under the premise that the indicators would not lead to the problem of autocorrelation, industrial resilience might also be evaluated based on the loss and survival. The relationships between economic resilience and industrial resilience may be described as general resilience and specified resilience [35]. In other words, industrial resilience contributes to specific targeted changes on specific scales and addresses the relationship between the status of the system and a particular disorder [36]. Notably, the exceeding focus on specified resilience may lead to a possible threat to general resilience, since increasing resilience of particular parts of a system to specific disturbances may cause the system to lose resilience in other ways [37]. It is realized that a system may be resilient in a specific scale but not necessarily in a general scale, and vice versa. While the above literature has identified different types of resilience, the term “resilience” in this study mainly refers to industrial resilience, with regards to spatial concentration.

2.3. Agglomeration, Cluster and Industrial Resilience

Agglomeration or cluster defines the concentrated state of certain industries within a space. Spatial concentration or agglomeration of economic activities could lead to various externalities, and further accelerates the development of industrial clusters. Observing across the animal kingdom, it is not difficult to find that many species live in clusters to enhance the survival rate of an individual and sustainability of the community, as seen in the realms of bees and ants. In the viewpoint of Porter [38], industrial agglomeration can promote regional competitiveness and maintain or increase the speed of regional economic growth, demonstrating positive effects on industrial development. Regarding clusters, scholars believe they are advantageous to industrial development due to better access to resources, advanced knowledge innovation and informal knowledge exchange networks that facilitate technology spillovers, the improvement of labor productivity and lower production costs [3,4,39,40]. When economies are shocked, industrial agglomerations and clusters are more prone to resilience [41,42]. Zhang et al. [41] not only agreed with the benefit of agglomeration to resilience, but further noted that cities with more diverse industrial agglomeration have greater economic resilience during the impact resistance period, while cities with more specialized industrial agglomeration have greater economic resilience during the period of recovery and adjustment. This finding points out that not only would spatial patterns of industry affect industrial development, but the composition of clusters is also critical to industrial development.
Among the literature surrounding the topic of survival, there has been an increasing recognition that geographic location influences the performance of firms, but, actually, the relation between clusters and resilience is quite complex, and clustering might not always be positive to industrial resilience. For example, Cainelli et al. [43] believe that agglomeration economies significantly attenuate firm mortality in industries regardless of diversified or specialized agglomeration, while Staber [44] argued that a specialized cluster may reduce firm survival chances and be negatively related to economic resilience. Staber [44] indicated that clusters of firms in the same industry would increase business failure rates, but firms operating in complementary industries in diversified clusters would reduce failure rates. De Silva and McComb [45], on the other hand, found that, in the same industry, within a distance of 1 mile, a greater firm density leads to greater mortality, but the mortality decreases if it surpasses 1 mile. From here, we can say that the benefits from clusters may not always compensate for the damages caused by competitions, so it is not appropriate to assume that clusters are always beneficial to firms and industries.
The industrial life cycle can be a probable explanation for the contradicting findings. Since the performances of firms vary according to the evolution of industry and the stage of industrial life cycles [46,47], firm mortality would possibly be affected by the stage of life cycles at that time. This leads to the question of whether the firm mortality is affected by the industrial life cycle, thereby influencing the estimation of industrial resilience. Fortunately, there is little empirical evidence proving that surviving firms are qualitatively different at different stages of the evolution of an industry [48]. In other words, the industrial life cycle might have limited influence on the firm mortality and industrial resilience.
With regards to the above research, no matter if agreeing that spatial concentrations can enhance the survival chance of firms or not, their research objects all focus on firms. However, in reality, even if a firm fails after shock, the production could continue in the same location by another operator. From the spatial point of view, the industry is somehow resilient, since its economic activities are not interrupted after shock and it keeps producing. Additionally, Bentley et al. [49] doubted that taking the outcome of the actions of individual firms in the sector is not sectorial resilience. This implies that the survival chance of firms probably cannot directly refer to industrial resilience, as, once a firm closes down, another firm can replace it and continue production in the same location, extending the survival period of this production site. Therefore, focusing on the economic performance of production sites instead of firms may be a better approach to evaluate industrial resilience. This study intends to evaluate industrial resilience based on the survival performance (longevity) of production sites to explore spatial concentration in relation to industrial resilience.

3. Research Design

3.1. Research Concept

To answer whether spatial patterns impact the long-term survival performance of industry, we clarify several concepts and provide definitions. First, as the previous literature contains contradicting arguments as to whether agglomeration economies and spatial concentration are essentially equal to industrial resilience, we hypothesize that the survival period (longevity) in clustered areas is longer than in non-clustered areas and test this hypothesis with our research outcome. If the average longevity of clustered production sites is longer than non-clustered production sites, we could say that spatial concentration is beneficial to industrial resilience. While comparing the survival periods between clustered and non-clustered areas is crucial, due to the fact that life cycles can affect the performance of firms, in this study, we choose to observe the performance of production sites and calculate the survival period of production sites instead of firms. In this sense, we mitigate the possible influences from business operational factors of firms.
The second thing we investigate is how to define the boundaries of the clusters to be able to distinguish between production sites of clustered areas and non-clustered areas. Generally, industrial clusters are given the names of their locality, such as the high-tech cluster in Silicon Valley and the automotive cluster in Stuttgart. If we distinguish the production site by an administrative boundary, it will inevitably encounter two problems. First, the administrative boundary is more related to governance rather than production area. Clusters may be located in one or multiple administrative regions. To take an administrative region as a cluster boundary is not precise enough. The second concern is that we have to make sure our non-clustered production sites, namely the control group, are not located in another cluster, or we cannot eliminate the possible effects from other clusters. Therefore, we intend to focus on a single mature industrial cluster, utilize a spatial analysis tool to define the cluster area and set the boundaries distinguishing clustered production sites and non-clustered production sites.
Finally, regardless of whether the survival period of clustered production sites is longer than non-clustered sites or not, we will survey their spatial patterns to explore possible relationships. We have set the spatial patterns of “clustered or non-clustered production sites”, “total clustered areas (number of HH COType)”, “degree of spatial concentration (clustering)”, “cluster number”, “average cluster size” and “cluster distribution” as indicators for exploration, and we look at their correlations with the “average survival years” of production sites. We utilize a spatial analysis tool to define the spatial concentration area. It distinguishes production sites into clustered and non-clustered areas, and, thereby, enables a comparison of their survival periods.

3.2. Case Study: The Semiconductor Industry in Taiwan

In order to investigate the externalities of clusters, we have chosen a long-lasting and mature cluster as a research subject. In recent years, the global shortage of chip production has forced many manufacturers to decrease production, and the semiconductor industry has attracted the world’s attention. Taiwan, as a leading supplier of global chip production, has a long history in the semiconductor industry. In the 1970s, a geopolitical economic crisis forced Taiwan to establish the semiconductor industry, even though it was a relatively new and capital-intensive technology for Taiwan at that time, and the investment capital exceeded most private firms [50]. This challenging strategy was rooted in a particular economic model, the developmental state strategy, which led towards rapid economic growth with positive government and strategic industrial policies [51,52].
In 1979, a notable construction for the semiconductor industry, Hsinchu Science-based Industrial Park (HSIP), was established in Hsinchu, a northern city in Taiwan. The science park attracts new high-tech firms through tax incentives and public infrastructure. Since the establishment of HSIP, the number of semiconductor firms has increased rapidly. By the mid-1990s, the industry had reached a level of output that placed it behind only the US, Japan and Korea [53]. In recent years, Taiwanese semiconductor production has gained even greater momentum, making it the second largest producer in the world. Early into the pandemic, the International Monetary Fund (IMF) forecasted that Taiwan’s GDP would shrink by 4% in 2020 [54]; however, by October of the same year, Taiwan’s exports grew by 3.4% and GDP increased by 2%. The surprising outperformance was partly due to Taiwan’s effective counter-pandemic measures, and it contributed to the export growth of semiconductors and related industries, whose rate was as high as 20%. In 2020, the semiconductor industry contributed 15% of Taiwan’s GDP, and Taiwan’s formidable position in global semiconductor manufacturing has led to the NY Times naming it “the most important place in the world”. Its international recognition also attracted The Economist, who asserted that technology parks (such as HSIP) in Taiwan are the “21st century’s economic choke-points”, similar to what oil used to be at the Strait of Hormuz in the previous century [55].
According to a dataset from Taiwan’s Ministry of Economic Affairs, the total number of semiconductor firms reached 695 in 2021 and evolved into three main clusters, Hsinchu, Taichung and Tainan. The subject of our study, the Hsinchu cluster, has the largest area and the greatest number of firms.

3.3. Material

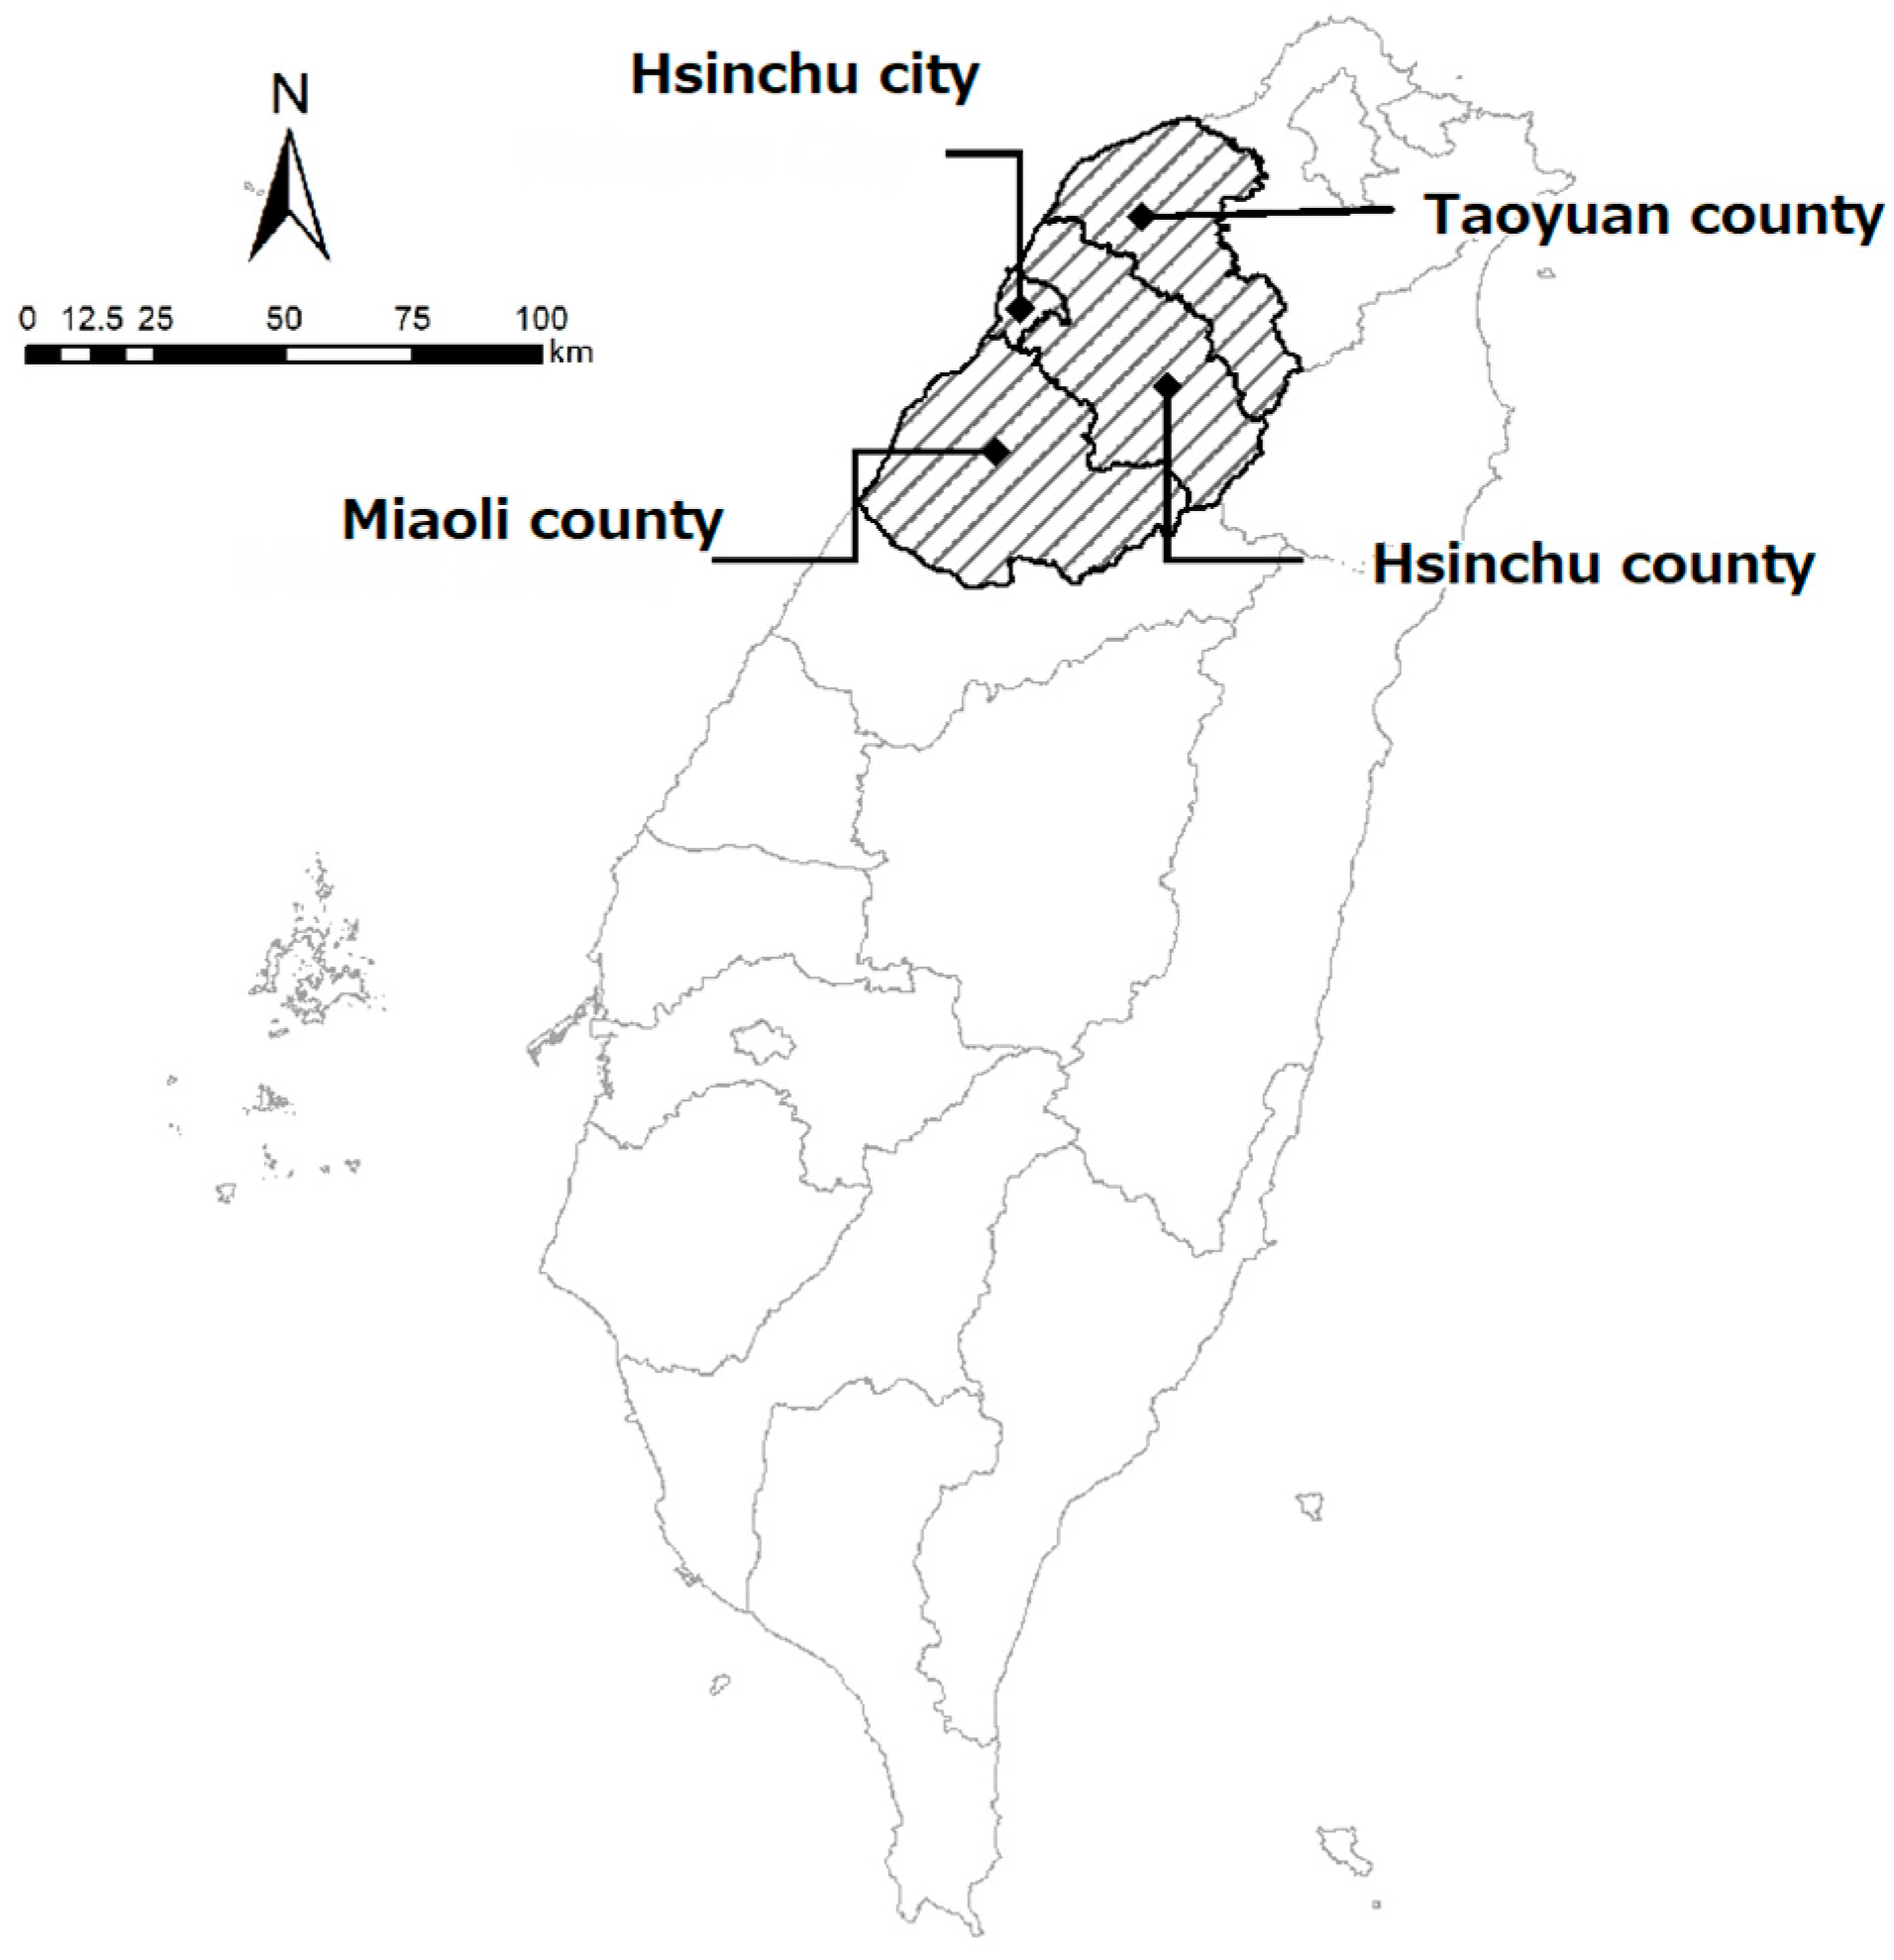
This research utilizes open data from Taiwan’s Industrial Development Bureau of the Ministry of Economic Affairs, for an industrial timespan of 24 years (1997–2020), to address the operation of the semiconductor industry. While, the data of year 2001, 2006, 2011 and 2016 are not available, as national census by the economic authority was not conducted, and the category 2643 has no data prior to year 2005. For the purpose of this research, we focused on the Hsinchu area, the oldest and largest semiconductor production area in Taiwan. Its total area is about 4532 km2 and comprises the administrative units of Taoyuan City, Hsinchu County, Hsinchu City and Miaoli County (see Figure 2). The data explore the following six industry categories:
  • 2611—Manufacturing of Integrated Circuits;
  • 2612—Manufacturing of Discrete Devices;
  • 2613—Packaging and Testing of Semi-Conductors;
  • 2641—Manufacturing of Liquid Crystal Panels and Components;
  • 2642—Manufacturing of Light Emitting Diodes; and
  • 2643—Manufacturing of Solar Cells.
Figure 2. Research area.
Sustainability 15 03546 g002

3.4. Research Framework and Methodology

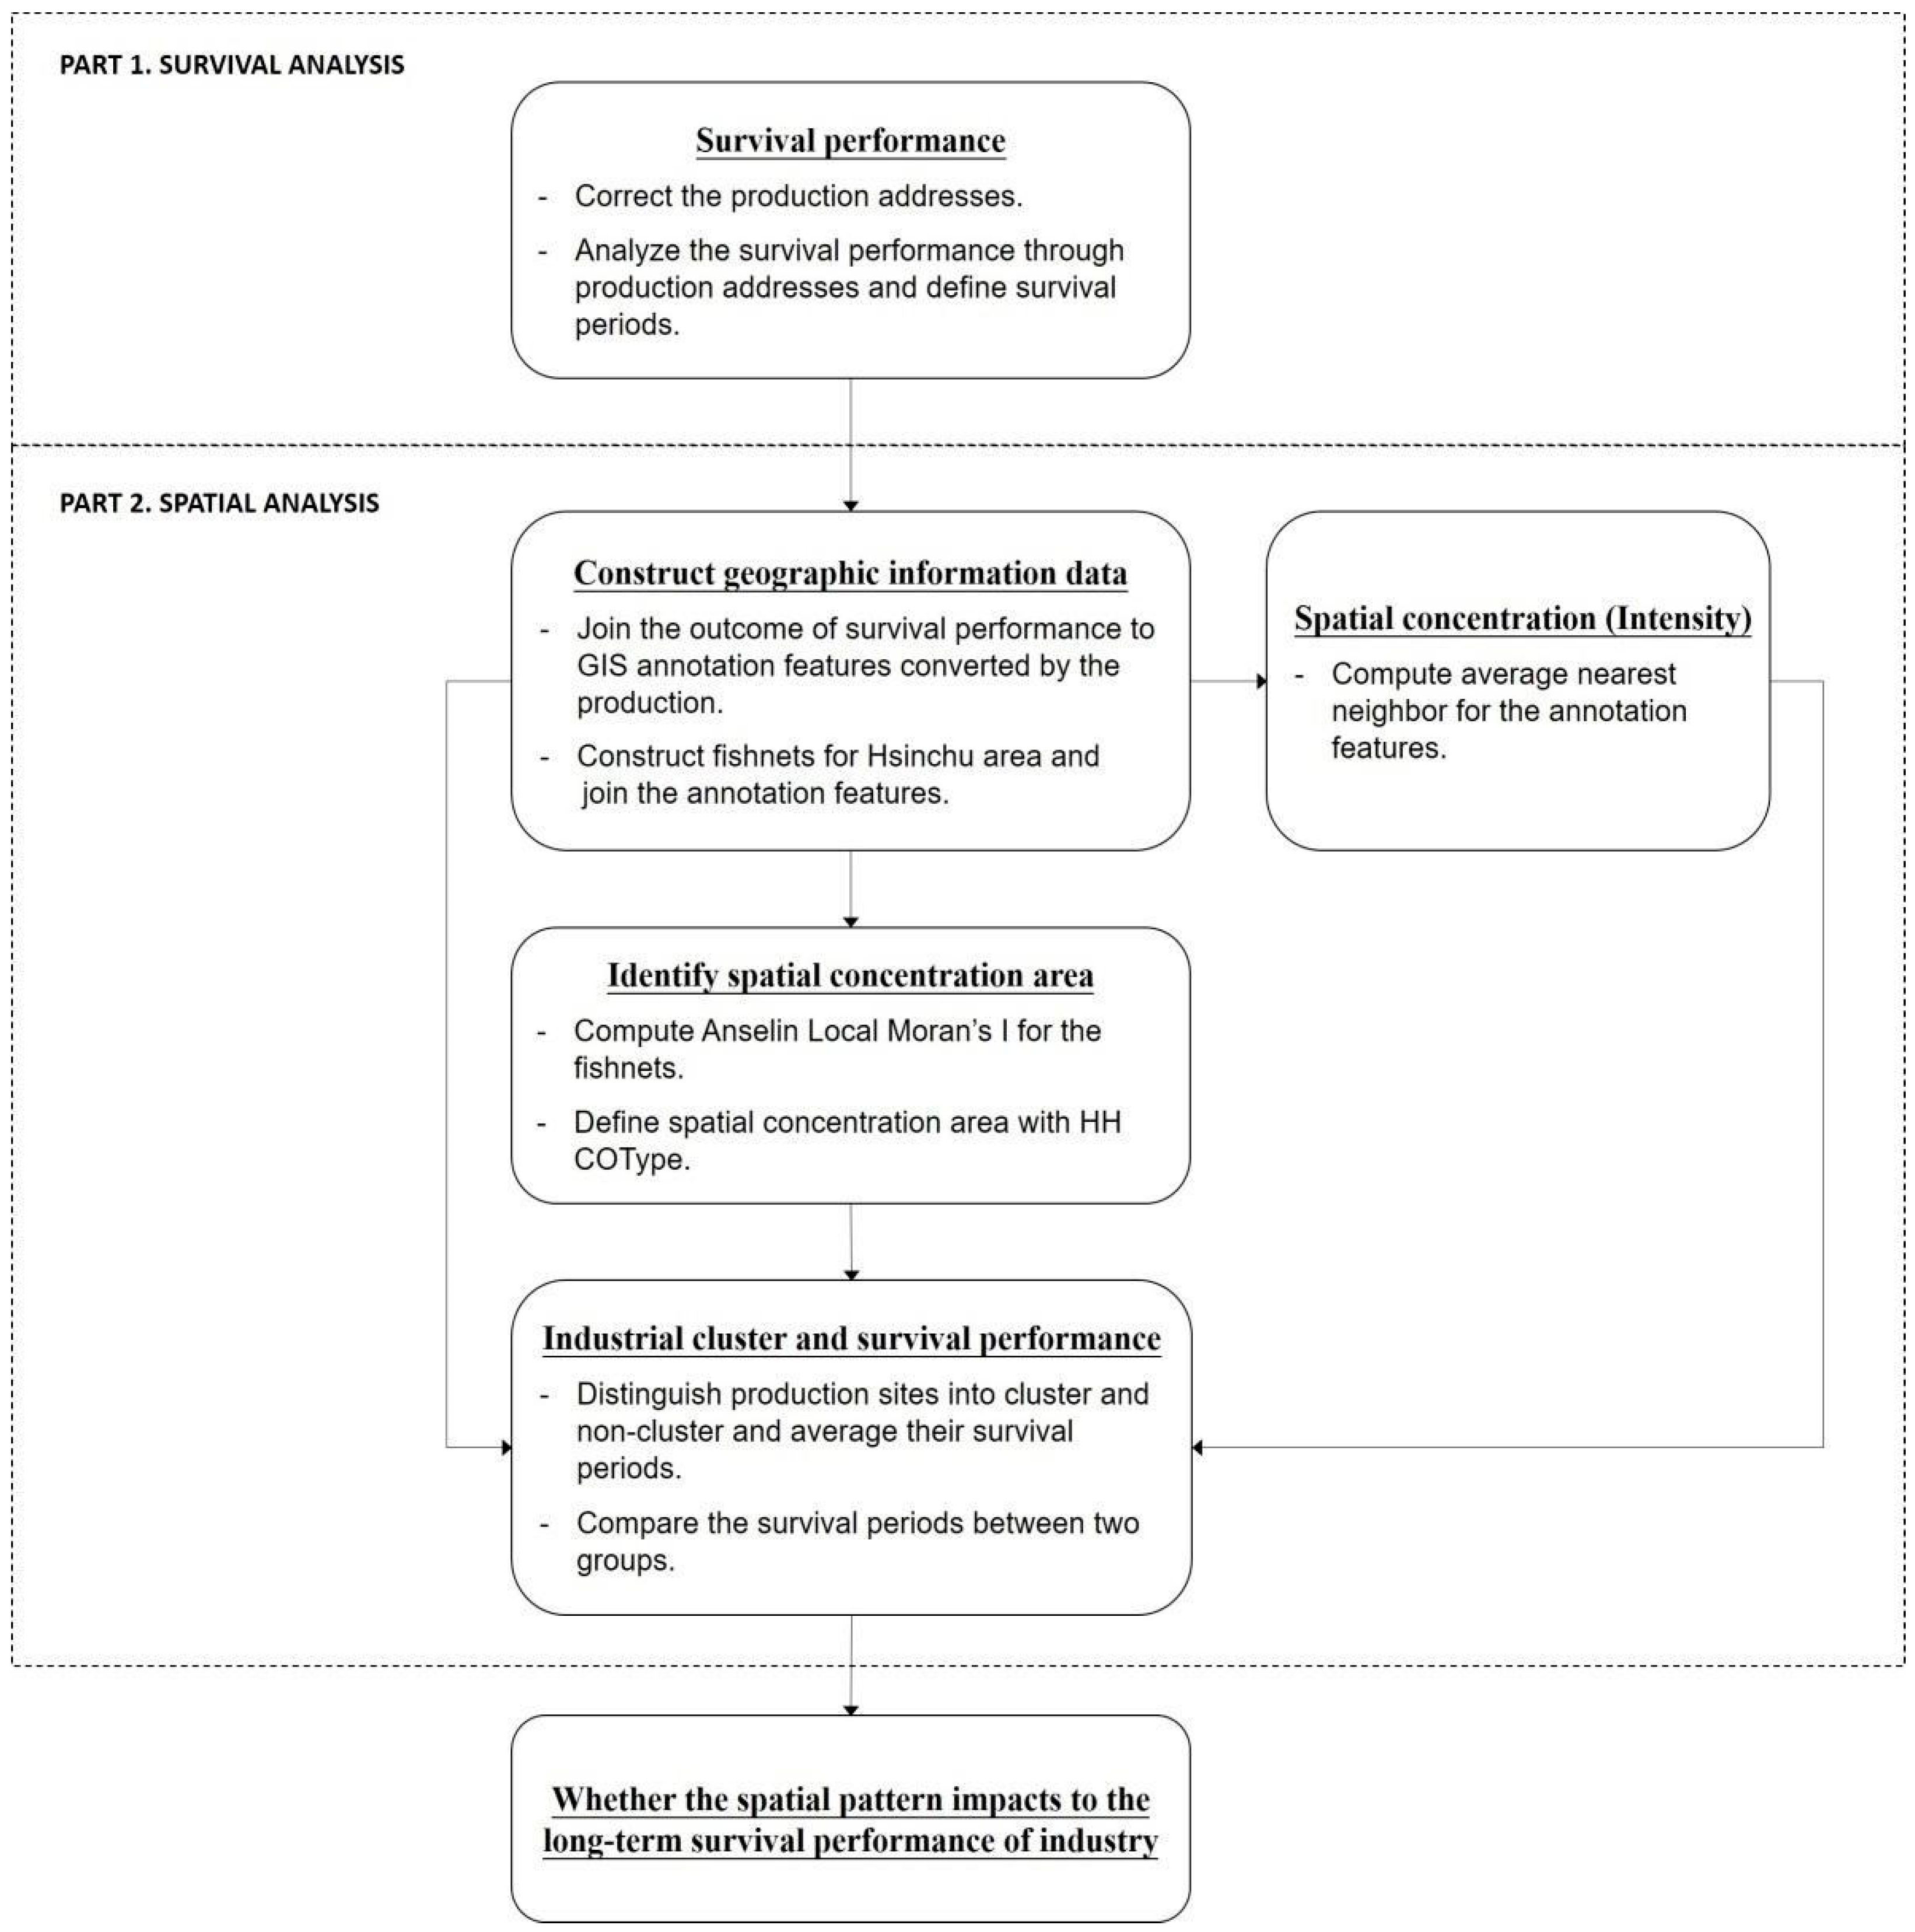
The research framework of this study consists of two parts (see Figure 3). The first part investigates the survival performance of production sites, and the second part further takes spatial factors into account to discuss the relationships between survival and spatial patterns. The methodology mainly employs functions from Excel and spatial analysis tools from geographic information systems, including the average nearest neighbor analysis and a cluster and outlier analysis.
In part one, “survival analysis”, we focus on the survival of production sites rather than firms. To solve the problem of overlapping coordinates, the three-dimensional addresses for firms will be adjusted to two-dimensional addresses for production sites. To provide an example, the semiconductor industry in Hsinchu area is usually located in Hsinchu Science Park, which is a modern industrial park with vertical production. It is not uncommon to find cases such as one production site located on the 2nd floor, and the other one on the 4th floor of the same building. In normal situations, these two sites will be given the same coordinates, but, after, we adjust the items and differentiate them on the xy coordinates. Redundant information is removed to reduce errors from the survival analysis and coordinate conversion.
After that, we look up the consistent addresses for the 24 years to investigate the survival period of each production site. Once a specific production site is found in N, N + 1 and N + 2 years, we will then define N + 3 as the death year and define the survival period as 4 years, no matter whether the site corresponds to various firms or the same one. Afterwards, this data will be distinguished into clustered and non-clustered areas, and average survival years will be calculated.
In part two, “spatial analysis”, we utilize the annotation files containing each industry’s 24-year survival performance and the fishnets file over the research to compute Anselin Local Moran’s I (cluster and outlier analysis). A fishnet area is equal to 1 km2, and we use it to survey the distribution and area of clusters. This spatial analysis tool is a local indicator of spatial association, which identifies spatial clusters with high or low values with a given set of features and field of analysis [56]. It also identifies spatial outliers by calculating a Local Moran’s I value, a z-score, a pseudo p-value and a code representing the cluster type for each statistically significant feature. The z-scores and pseudo p-values represent the statistical significance of the computed index value. The cluster/outlier type (COType), a code representing the cluster type for each statistically significant feature, distinguishes among a statistically significant cluster of high values (HH), a cluster of low values (LL), outliers in which a high value is surrounded primarily by low values (HL) and outliers in which a low value is surrounded primarily by high values (LH). In this study, we only define production sites located in HH areas as clustered production sites, and all the others are considered as non-clustered production sites.
Finally, in terms of the influence of spatial patterns, we utilize the average nearest neighbor analysis (hereafter ANN) to explore the intensity of the industrial cluster. This tool measures the distance between each feature centroid and its nearest neighbor’s centroid location, and then averages all these nearest neighbor distances [57]. If the average distance is less than the average for a hypothetical random distribution (z-score < −1.65), the distribution of the features being analyzed is considered clustered. If the average distance is greater than the distribution (z-score > +1.65), the features are considered dispersed. To simplify the concept, a smaller z-score means a greater extent of clustering and a bigger z-score indicates greater dispersion.
In summary, in order to verify the research hypothesis that the performance of industrial survival in space would be better in a cluster, we have to consider the outcomes of spatial analysis and answer two crucial questions. First, is the average survival period of production sites in clustered areas longer than those in non-clustered areas? Second, is the extent of clustering related to survival performance? The second question would refer to the z-scores for the ANN and the ratios of the annotation numbers within an HH area to the fishnet numbers of the HH area. If the answer to either of the questions is no, the research hypothesis might not be verified. In this case, we will examine the results and try to explain the inconsistency with the intensity of the industrial cluster.

4. Results

4.1. Survival Analysis

In this study, we analyzed six categories of the semiconductor industry surrounding the Hsinchu area. Firstly, we corrected firm addresses to production site addresses, then looked up the consistent addresses for the 24-year timeframe to investigate the survival performance of the production sites. This analysis could calculate the respective survival period by defining the birth year, survival year and death year of each production site. Table 1 shows the survival periods of production sites and the average for each category.
For category 2611, the survival periods for most production sites are 2, 3 and 4 years, and the average is 8.52 years. A total of 46.31% of production sites have survived for 1 to 5 years, 19.13% have survived for 6 to 10 years, 16.11% have survived for 11 to 15 years, 9.73% have survived for 16 to 20 years and 8.72% have survived for over 21 years.
For category 2612, the survival periods for most production sites are 2, 4 and 3 years, and the average is 6.01 years. A total of 62.16% of production sites have survived for 1 to 5 years, 20.27% have survived for 6 to 10 years, 10.14% have survived for 11 to 15 years, 5.41% have survived for 16 to 20 years and 2.03% have survived for over 21 years.
For category 2613, the survival periods for most production sites are 2, 4 and 3 years, and the average is 7.77 years. A total of 51.27% of production sites have survived for 1 to 5 years, 18.64% have survived for 6 to 10 years, 13.56% have survived for 11 to 15 years, 13.98% have survived for 16 to 20 years and 2.54% have survived for over 21 years.
For category 2641, the survival periods for most production sites are 3, 2 and 4 years, and the average is 6.58 years. A total of 55.66% of production sites have survived for 1 to 5 years, 23.58% have survived for 6 to 10 years, 12.74% have survived for 11 to 15 years, 6.60% have survived for 16 to 20 years and 1.42% have survived for over 21 years.
For category 2642, the survival periods for most production sites are 2, 4 and 3 years, and the average is 6.26 years. A total of 57.05% of production sites have survived for 1 to 5 years, 24.83% have survived for 6 to 10 years, 10.74% have survived for 11 to 15 years, 5.37% have survived for 16 to 20 years and 2.01% have survived for over 21 years.
For category 2643, the survival periods for most production sites are 6, 10, 5 and 3 years. The average is 6.63 years. A total of 37.71% of production sites have survived for 1 to 5 years, 55.36% have survived for 6 to 10 years and 8.93% have survived for over 11 years.
In general, most of the survival periods for production sites are around 2 to 4 years. The production sites that have a survival period under 5 years account for the highest percentage, except for category 2643.

4.2. Spatial Analysis

The ANN for the production sites is computed in Table 2. The outcomes show that the z-scores of all categories are less than −2.58, which means that their spatial distributions are all significantly clustered. Among all the categories, 2611 is the most clustered, 2613 is the second most clustered and 2641 is the third most clustered.
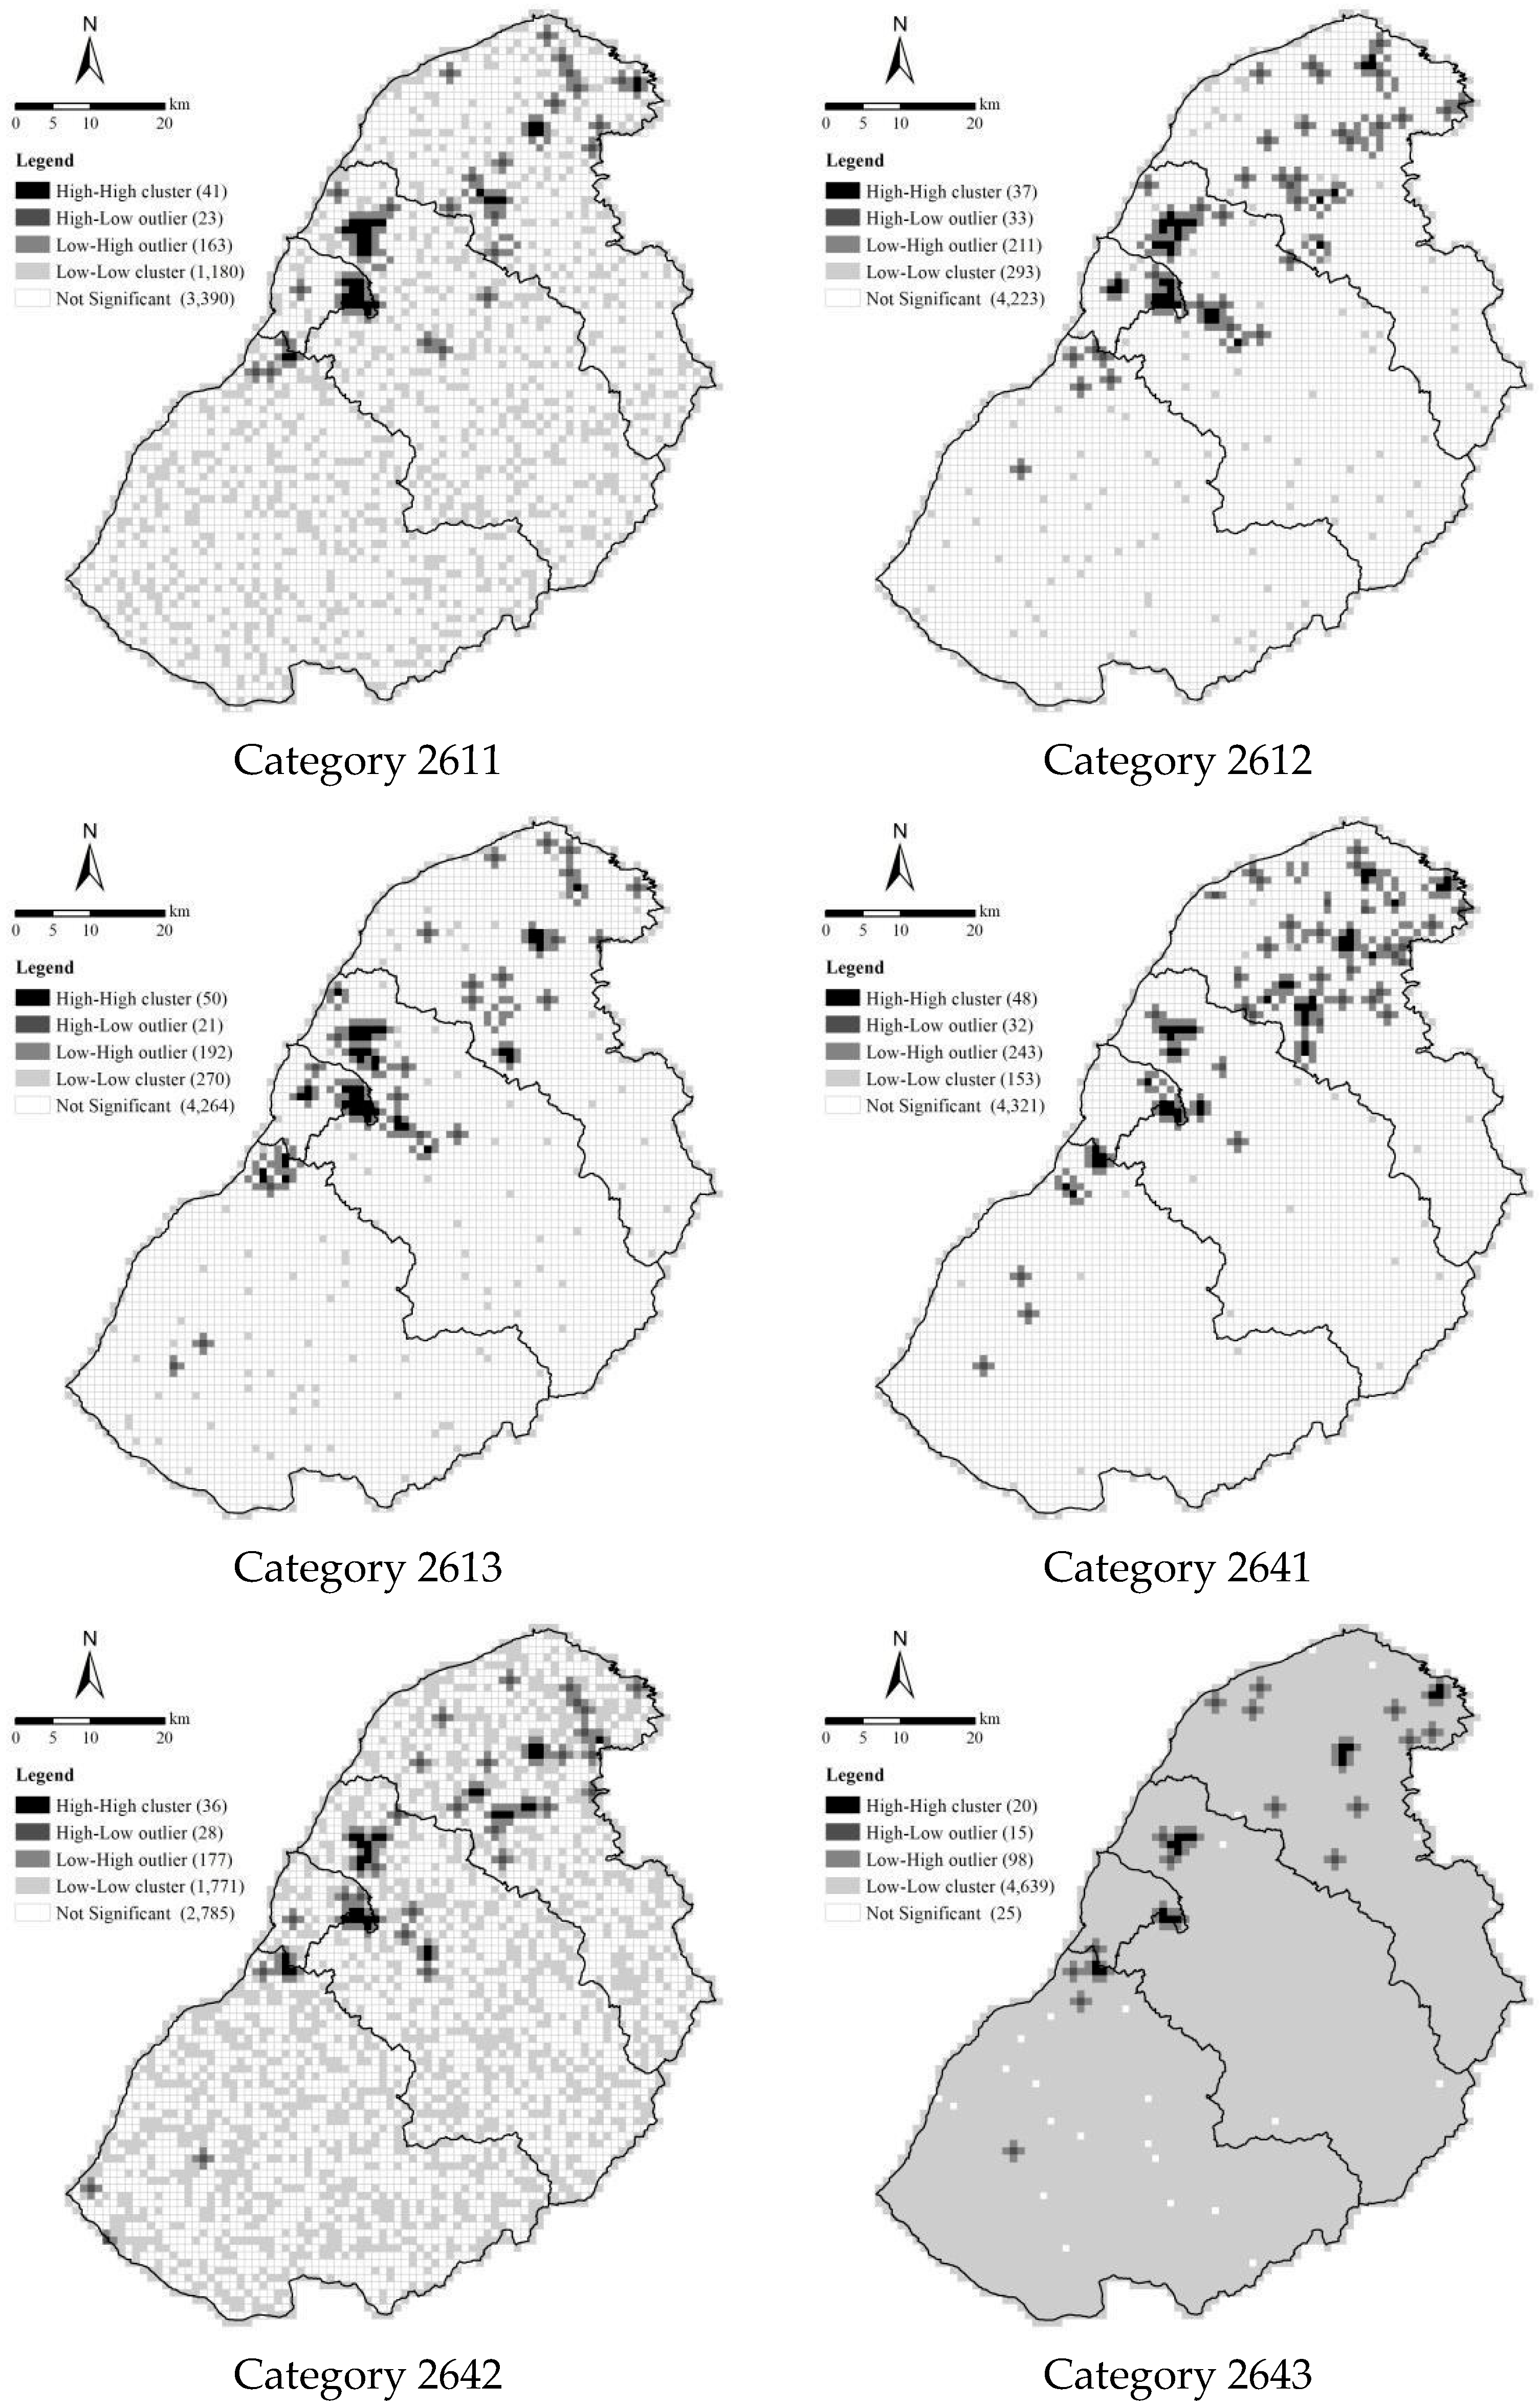
To identify the industrial clusters in the Hsinchu area, ArcGIS was utilized to conduct the cluster and outlier analysis (Anselin Local Moran’s I). In this study, we provided a different interpretation for the cluster/outlier type (COType). Only HH represents an industrial cluster; HL, LH and LL are all categorized as non-clusters in this study.
According to the spatial analysis (see Table 2 and Figure 4), there are 232 HH fishnets for the semiconductor industry in the Hsinchu area. Category 2613 has 50 HH fishnets and represents the highest, category 2641 has 48 HH fishnets and is the second highest and category 2611 has 41 HH fishnets and is the third highest. As for the cluster number, the total number is 58. Category 2641 has 16 clusters and is the highest, category 2613 has 13 clusters and is the second highest and categories 2612 and 2642 have 9 clusters and are the third highest. In terms of cluster size, the average size for all clusters is 4.27 fishnets. Category 2611 has the largest average cluster size of 6.83, category 2612 has the second largest average cluster size of 4.11 and category 2642 has the third largest average cluster size of 4.00.
We categorize the clusters into four groups according to size: one to four fishnets, five to eight fishnets, nine to twelve fishnets and thirteen to sixteen fishnets. It is found that about 72% clusters are smaller than four fishnets, and almost 90% of clusters are smaller than eight fishnets. Only around 10% of clusters contain more than nine fishnets. We, therefore, define the clusters of more than nine fishnets as large clusters. For the semiconductor industry in the Hsinchu area, there are six large clusters, including two for category 2611, two for category 2612, one for category 2613 and one for category 2642; meanwhile, categories 2641 and 2643 have no large clusters.
In terms of cluster distribution type, category 2641 has the largest number of clusters with the smallest size (1~4 fishnets). A similar spatial pattern is also seen in category 2613. They both have smaller-sized clusters in relatively great numbers. On the contrary, categories 2611, 2612 and 2642 have larger clusters in relatively small numbers. Meanwhile, category 2643 is an exception due to the shorter data length, it has smaller-sized clusters in smaller numbers.
According to the scope of the HH type, the production sites were distinguished into clusters and non-clusters (see Table 3). It is found that category 2611 is the only one whose average survival period performs much better in the clustered area. Its average survival period of clustered production sites is 8.91 years, while the average survival period of non-clustered production sites is 6.02 years. The former is almost 3 years longer than the latter.
The survival periods of clustered production sites for categories 2613 and 2641 are a little longer than non-clustered production sites, while the survival periods of clustered production sites of category 2612 are slightly shorter than non-clustered production sites. In fact, the outcomes for these three categories are very close, as the difference of the average survival years between clusters and non-clusters only ranges from −0.19 to 0.29 years. As for categories 2642 and 2643, their survival periods of clustered production sites are less than non-clustered production sites, with the difference ranging from −1.37 to −2.09 years.
In summary, we discuss the spatial patterns that may impact the survival period of production sites in Table 4. It is found that greater numbers of the HH COType and smaller z-score may be positively correlated with the survival period of production sites. On the other hand, smaller numbers of the HH COType and bigger z-score may be negatively correlated with the survival period.
As for the numbers and average sizes of clusters, they are not likely to impact the survival period. For instance, categories 2611 and 2612 have the opposite performance for the number of clusters and average size. Category 2612 has a shorter survival period in clustered areas, even though its average cluster size is the second biggest and the cluster number is the third highest.
To look at the correlation between survival period and a range of spatial patterns (shown in Table 5), only the ANN z-score shows statistical significance with the survival period in clustered areas (p-value < 0.05). Note that, while the Pearson correlation of ANN z-score is in a negative number, since the z-score itself is negative, and lower numbers signify greater extent of clustering, the result of Pearson correlation actually indicates a highly positive relation between the degree of spatial concentration (clustering) and survival period. In light of this, we argue that, since the survival periods in clustered areas for categories 2641 and 2613 are only a little longer than non-clustered areas, compared to category 2611, which has a significant difference, we speculate that a threshold of the ANN z-score may exist and that only when it exceeds this value, such as in the case of category 2611, would the survival period of clustered production sites be significantly longer than non-clustered production sites.

5. Discussion

5.1. Theoretical and Practical Implications

Usually, when an industry has a better survival performance, namely surviving longer from more threats than other firms, the industry is considered as more resilient. In other words, longer-surviving industries are considered more resilient than those surviving for shorter periods. This study focused on industrial long-term performance and applied the resilience concept to production sites. From the survival period of each category of the Taiwanese semiconductor industry, we have explored the relation between industrial resilience and spatial concentration in order to answer the research question of whether spatial patterns impact the long-term survival performance of the industry.
Theoretical and practical implications of this research are presented as follows:
  • Theoretically, the possible existence of thresholds, such as in z-score towards survival, may provide new perspective on industrial planning and resource distribution. As this research tries to study industrial resilience, identifying such thresholds that greatly extend industrial survival can be meaningful for future theoretical frameworks in the field.
  • Practically, the case study used in this research, namely the Taiwanese semiconductor industry, is an influential player in global production. Semiconductors are preeminent products that are growingly crucial for various industries as well as daily lives, and Taiwan accounts for 21% of global semiconductor production. With such great potential toward the dominance of future global market, the resilience and sustainability of such industry is also crucial for maintaining its vitality toward the future, and exploring its resilience and sustainability provides a blueprint for future planners.

5.2. Output

In this research, we have set “average surviving years”, “clustered or non-clustered production sites”, “number of HH COType”, “degree of clustering (ANN z-score)”, “cluster number”, “cluster size” and “cluster distribution (clusters grouped according to fishnet size)” as indicators for comparison and explored the correlations. From statistics, we lead to the following output:
(1)
The average surviving periods of production sites in clustered areas are not always longer than those in non-clustered areas (from Table 3).
Before distinguishing the areas into cluster and non-clustered areas, the survival periods of each category range from 6.01 to 8.52 years (Table 1). While the survival periods of clustered production sites range from 5.73 to 8.91 years, the survival periods of non-clustered production sites range from 6.02 to 7.82 years. Half of the categories perform better in the clustered areas, half do not. Analyzing the mortality of clustered firms in the same industry, the performance of the survival period does not conform with the arguments from Cainelli et al. [41] and Staber [42].
(2)
The degree of clustering has positive correlations with survival years, although it might be not proportional.
It is found that the degree of spatial concentration (ANN z-score) is indicative of longer survival, as it is significantly correlated with the survival period statistically. This finding may be somewhat supported by the viewpoint of De Silva and McComb [43], that the spatial pattern is related to survival performance of industry. However, despite the strong positive correlation, we found that the performance seems to be not completely proportional. In this study, a z-score above −11.13 did not make the survival period in clusters longer than in non-clusters. Only when the z-score reached the range between −16.81 and −19.33 did it make the survival period in clusters a little longer than in non-clusters, while a z-score of −22.33 contributed 2.89 years of extension compared to non-clustered sites. It implies that, even when industrial distribution is concentrated, there might be a threshold z-score that would significantly extend the survival period once exceeded. This exciting result may provide planners a new perspective on industrial planning, resource distribution and regional development.
(3)
The numbers of the HH COType might contribute to survival, but the cluster numbers do not.
From Table 5, we find that cluster number has almost no correlation with survival years, while a moderate positive correlation is found between HH number and survival years, although the p-value is too large to be statistically significant. However, if we look at Table 4, categories whose survival periods are better in clusters tend to have greater HH numbers than otherwise, thus, we may infer that the number of total clustered areas (HH fishnets) might contribute to survival performance somehow, especially after exceeding a certain threshold. The striking difference between the performance of HH number and cluster number is something interesting to observe, and to infer the reason for, and the difference in each category’s cluster distribution (which has a more detailed grouping by cluster size) might be a cause.
(4)
The average cluster size might not affect the survival period, but larger clusters might be beneficial to survival.
Statistically, the correlation between average cluster size and survival period bears no significance, and, although the number is rather high in Pearson correlation, the real numbers presented in Table 4 show no such tendency. Thus, we may say that cluster size on average does not matter to survival. However, we may discover different patterns when we zoom in and look at the detailed scope of grouped cluster sizes. Notably, when we look at the cluster distribution (Table 2) of category 2611, it has two of the largest clusters (13~16 fishnets), which is the only category with such a feature. Although it is too quick to conclude that larger clusters are better for survival, it is interesting to draw a relation between the cluster distribution and the extension of 2.89 years in survival for clustered sites of category 2611. For other categories, 2613 and 2641 are the ones that have slightly longer survival in clusters (+0.23 and +0.29, respectively), and, from Table 2, we find both of them having a higher number of small- and middle-sized clusters. However, since both categories have low ANN z-scores, we might attribute the survival result to the degree of clustering (ANN z-score). For those with worse survival performance in clusters, namely categories 2612, 2642 and 2643, they have small numbers but a few relatively larger clusters (except 2643 with short data length). Both categories 2612 and 2642 had worse survival in clusters, but 2612 performed much better (−0.19) than 2642 (−2.09), and, looking at the cluster distribution, category 2612 contains a cluster of the largest size (13~16 fishnets), while 2642 does not, and this is the only significant difference between the two categories, as all other indicators (ANN z-score, HH and cluster number, average cluster size) show similar results between the two. From this, although we cannot guarantee that bigger clusters always contribute to longer survival, we have observed this qualitative feature that clusters above a certain size might mitigate the impacts from other factors that threaten survival performance.
Above are the quantitative analyses from the statistics, and, from a qualitative perspective, we might wonder if there are some other reasons for category 2611, namely “Manufacturing of Integrated Circuits” to outperform other categories in terms of survival. It is worth mentioning that category 2611 even had 13 production sites still surviving in 2020, having resilience against the global pandemic. From the literature in Section 2 that outline some actions and strategies that enhance resilience, we may infer that there exist some other qualitative factors that impact the survival performance of industries, such as having a stronger sustainable management within the production sites of this category. Another thing is that Taiwanese semiconductor production is a unique manufacturing industry. It is neither a consumer good nor luxury, but a high-tech supply and state-supported production that contributes to one-fifth of global semiconductor supply. As a result, its resilience can be impacted by not only the market, per se, but also other external factors such as government policies, international trade frameworks and think tanks from academic institutions.
From above, although some of the literature believes that clusters can bring about positive effects on industrial development including cost reduction and shared infrastructure, our results proved that we cannot infer the performance of survival periods from the number and average size of clusters alone. Linking the concept of survival with resilience and sustainability, we can say that cluster number and average cluster size alone may not contribute to resilience and sustainability. However, certain spatial patterns such as extent of clustering and larger clusters can be beneficial to longer survival, and, thus, resilience and sustainability. The positive correlation between degree of spatial concentration (clustering) and survival performance (resilience) can reflect what Zhang et al. [39] proposed, that industrial clusters are more advantageous to resilience.

6. Conclusions, Limitations and Future Research

6.1. Conclusions

This research looks into the relation between spatial patterns and industrial survival, utilizing Taiwan’s semiconductor industry as a case study. From our research, we have found out that spatial concentration is somehow related to the long-term survival performance of industry. We hypothesized that the survival periods of production sites in clustered areas are longer than those in non-clustered areas, and, to verify the hypothesis, we raised the following two questions. First, is the average survival period of production sites in the cluster group longer than that in the non-cluster group? Second, is the intensity of the industrial cluster related to survival performance? Our statistics gave an answer of “no” to the first question, but “yes” to the second one. Therefore, although the hypothesis cannot be verified, we may say that the extent of clustering does contribute to higher survival performances.
As survival signifies resilience, and the previous literature indicates the close link between resilience and sustainability, the concept of survival, resilience and sustainability can be understood as mutually interchangeable, thus, the extension in survival indicates greater resilience and higher sustainability. In other words, resilience of clustered production sites will be improved with greater spatial concentration. However, although it is realized that clusters can bring about economic and knowledge advantages, our results show that, only when the spatial concentration reaches a certain degree, the survival period can be extended significantly and, thereby, contribute to resilience in a greater way. In terms of qualitative performances, addressing actions that lead to greater efficiency and responsibility can improve the resilience of industry, leading to higher chances of survival during shocks, expanding longevity and, thus, strengthening sustainability.
As this study looks into sustainability from a perspective of spatial studies, using a case study of Taiwan’s semiconductor industry, its novelty can be explained as follows:
(1)
It enriches sustainability research with knowledge and methodologies used in spatial and industrial studies. As discussions with regards to sustainability typically focus on environmental sustainability, this research touches upon different dimensions of sustainability, enriching this concept with economic and industrial theories. This research is conducted with Anselin Local Moran’s I (cluster and outlier analysis) and average nearest neighbor analysis (ANN), which is unique in sustainability research.
(2)
When it comes to semiconductor production, most discussions surround its business administration [58,59], history [60], geo-political values [61,62] or technological aspects [63,64]. Its impacts toward sustainability, especially industrial resilience, are not much debated. As the semiconductor begins to occupy an unignorable share in the global market, we cannot underestimate its impacts toward sustainability, and the resilience evaluation of the semiconductor industry serves as another novelty.
(3)
The semiconductor industry of Taiwan has gained huge growth, especially in recent years. Currently, it supplies over one-fifth of global semiconductor products. Sustainability regarding the Taiwanese semiconductor industry are being discussed, but mostly regarding corporation performances on environmental sustainability [65]. A similar study explores the economic and environmental efficiency of Taiwan’s semiconductor industry [66], but our study pioneers in exploring the resilience of the industry from a spatial approach.

6.2. Limitations and Future Research

Firstly, given that spatial concentration is statistically correlated with survival periods, the critical threshold of spatial concentration that leads clusters to longer survival periods attracts us to further research. It would be interesting to investigate more cases to explore the particular threshold and simultaneously confirm whether or not this finding is applicable to other industries and locations.
Secondly, in this study, we took six categories in the semiconductor industry as examples to investigate survival periods in relation to spatial patterns. It should be recognized that the survival periods among different industries, or even different categories within the same industry, may not generate similar results. Furthermore, each industry may correspond to a specific average survival length during each stage of evolution, and, without further research, the survival period cannot refer to industrial maturity or life cycles. Though this study tried to mitigate the potential influence from life cycles by investigating production sites rather than firms, we still cannot eliminate the possibility of such influence. Therefore, the relationship between survival periods and life cycles might be a future topic.
Finally, this study focused on a specific industry in the case of specialized agglomeration. As scholars argue, specialized agglomeration and diversified agglomeration have different effects on resilience and recovery, thus, in this sense, the relations among diversified agglomeration, resilience and spatial patterns are worth being discussed in the future.

Funding

This research was funded by the National Science and Technology Council, Taiwan, grant number [NSTC 111-2410-H-004-229].

Institutional Review Board Statement

Not applicable.

Informed Consent Statement

Not applicable.

Data Availability Statement

The data presented in this study are available on request from the author.

Conflicts of Interest

The author declares no conflict of interest.

References

  1. Fiksel, J. Sustainability and resilience: Toward a systems approach. Sustain. Sci. Pract. Policy 2006, 2, 14–21. [Google Scholar] [CrossRef]
  2. Gunderson, L.; Pritchard, L.J.R. Resilience and the Behavior of Large-Scale Systems, 1st ed.; Island Press: Washington, DC, USA, 2002. [Google Scholar]
  3. Tallman, S.; Jenkins, M.; Henry, N.; Pinch, S. Knowledge, clusters, and competitive advantage. Acad. Manag. Rev. 2004, 29, 258–271. [Google Scholar] [CrossRef]
  4. Cioccone, A.; Hall, R. Productivity and the density of economic activity. Am. Econ. Rev. 1996, 86, 54–70. [Google Scholar]
  5. Martin, R. The Roepke lecture in economic geography—Rethinking regional path dependence: Beyond lock-in to evolution. Econ. Geogr. 2010, 86, 1–27. [Google Scholar] [CrossRef]
  6. Holling, C.S. Resilience and stability of ecological systems. Annu. Rev. Ecol. Evol. Syst. 1973, 4, 1–23. [Google Scholar] [CrossRef] [Green Version]
  7. Pimm, S.L. The complexity and stability of ecosystems. Nature 1984, 307, 321–326. [Google Scholar] [CrossRef]
  8. Park, S.C. Cooperation versus competition: Preconditions for balanced global politics. In Cooperation Versus Rivalry in Times of Pandemic: Which Will Be the Shape of International Politics? 1st ed.; Fiedler, R., Park, S.C., Pohl, A., Eds.; Logos Verlag Berlin: Berlin, Germany, 2021; Volume 1, pp. 5–10. [Google Scholar]
  9. Brundtland, G. Our Common Future: Report of the World Commission on Environment and Development; Oxford University Press: Oxford, UK, 1987; Available online: http://www.un-documents.net/ocf-ov.htm (accessed on 2 February 2023).
  10. Miceli, A.; Hagen, B.; Riccardi, M.P.; Sotti, F.; Settembre-blundo, D. Thriving, not just surviving in changing times: How sustainability, agility and digitalization intertwine with organizational resilience. Sustainability 2021, 13, 2052. [Google Scholar] [CrossRef]
  11. Degeus, A. The Living Company, 1st ed.; Harvard Business School Press: Cambridge, UK, 1997. [Google Scholar]
  12. Fiksel, J. Designing resilient, sustainable systems. Environ. Sci. Technol. 2003, 37, 5330–5339. [Google Scholar] [CrossRef]
  13. ASEAN. ASEAN Plus Three Leaders’ Statement on Strengthening ASEAN Plus Three Cooperation for Economic and Financial Resilience in the Face of Emerging Challenges. Available online: https://www.mofa.go.jp/files/100115521.pdf (accessed on 2 February 2023).
  14. D’Adamo, I.; Lupi, G. Sustainability and resilience after COVID-19: A circular premium in the fashion industry. Sustainability 2021, 13, 1861. [Google Scholar] [CrossRef]
  15. Gayialis, S.P.; Kechagias, E.; Papadopoulos, G.A.; Konstantakopoulos, G.D. Design of a Blockchain-Driven System for Product Counterfeiting Restraint in the Supply Chain. In IFIP Advances in Information and Communication Technology (2019); Springer: Cham, Switzerland, 2019; pp. 474–481. [Google Scholar]
  16. Gayialis, S.P.; Kechagias, E.P.; Papadopoulos, G.A.; Kanakis, E.A. Smart-Contract Enabled Blockchain Traceability System against Wine Supply Chain Counterfeiting. In IFIP Advances in Information and Communication Technology (2022); Springer: Cham, Switzerland, 2022; pp. 477–484. [Google Scholar]
  17. Mullen, E.; Morris, M.A. Green Nanofabrication Opportunities in the Semiconductor Industry: A Life Cycle Perspective. Nanomaterials 2021, 11, 1085. [Google Scholar] [CrossRef]
  18. Huang, S.H.; Pan, Y.C. Automated visual inspection in the semiconductor industry: A survey. Comput. Ind. 2015, 66, 1–10. [Google Scholar] [CrossRef]
  19. Walker, B.H. Is succession a viable concept in African savanna ecosystems? In Forest Succession, 1st ed.; West, D.C., Shugart, H.H., Botkin, D.B., Eds.; Springer: New York, NY, USA, 1981; pp. 431–447. [Google Scholar]
  20. O’neill, R.V.; Deangelis, D.L.; Waide, J.B.; Allen, T.F.; Allen, G.E. A Hierarchical Concept of Ecosystems; MPB-23; Princeton University Press: Princeton, NJ, USA, 1986; Volume 23. [Google Scholar] [CrossRef]
  21. Pike, A.; Dawley, S.; Tomaney, J. Resilience, adaptation and adaptability. Camb. J. Reg. Econ. Soc. 2010, 3, 59–70. [Google Scholar] [CrossRef]
  22. Simmie, J.; Martin, R. The economic resilience of regions: Towards an evolutionary approach. Camb. J. Reg. Econ. Soc. 2010, 3, 27–43. [Google Scholar] [CrossRef] [Green Version]
  23. Skålholt, A.; Thune, T. Coping with economic crises—The role of clusters. Eur. Plan. Stud. 2014, 22, 1993–2010. [Google Scholar] [CrossRef]
  24. Boschma, R. Towards an evolutionary perspective on regional resilience. Reg. Stud. 2015, 49, 733–751. [Google Scholar] [CrossRef] [Green Version]
  25. Martin, R.; Gardiner, B. The resilience of cities to economic shocks: A tale of four recessions (and the challenge of Brexit). Reg. Sci. 2019, 98, 1801–1832. [Google Scholar] [CrossRef]
  26. Gong, H.; Hassink, R.; Tan, J.; Huang, D. Regional resilience in times of a pandemic crisis: The case of COVID-19 in China. Tijdschr. Voor Econ. En Soc. Geogr. 2020, 111, 497–512. [Google Scholar] [CrossRef]
  27. Lazzeroni, M. Industrial decline and resilience in small towns: Evidence from three European case studies. Tijdschr. Voor Econ. En Soc. Geogr. 2020, 111, 182–195. [Google Scholar] [CrossRef]
  28. Hu, X.; Hassink, R. Exploring adaptation and adaptability in uneven economic resilience: A tale of two Chinese mining regions. Camb. J. Reg. Econ. Soc. 2017, 10, 527–541. [Google Scholar] [CrossRef]
  29. Ringwood, L.; Watson, P.; Lewin, P. A quantitative method for measuring regional economic resilience to the great recession. Growth Chang. 2019, 50, 381–402. [Google Scholar] [CrossRef]
  30. Xie, W.; Rose, A.; Li, S.; He, J.; Li, N.; Ali, T. Dynamic economic resilience and economic recovery from disasters: A quantitative assessment. Risk Anal. 2018, 38, 1306–1318. [Google Scholar] [CrossRef]
  31. Opera, F.; Onofrei, M.; Lupu, D.; Vintila, G.; Paraschiv, G. The determinants of economic resilience. The case of Eastern European regions. Sustainability 2020, 12, 4228. [Google Scholar] [CrossRef]
  32. Briguglio, L.; Cordina, G.; Farrugia, N.; Vella, S. Conceptualizing and measuring economic resilience. In Pacific Islands Regional Integration and Governance, 1st ed.; Chand, S., Ed.; ANU Press: Canberra, Australia, 2006; Volume 3, pp. 265–288. [Google Scholar]
  33. Sensier, M.; Bristow, G.; Healy, A. Measuring Regional Economic Resilience across Europe: Operationalizing a Complex Concept. Spat. Econ. 2016, 11, 128–151. [Google Scholar] [CrossRef]
  34. Rose, A. Springerlink Defining and Measuring Economic Resilience from a Societal, Environmental and Security Perspective; Springer: Singapore, 2017. [Google Scholar]
  35. Folke, C.; Carpenter, S.R.; Walker, B.; Scheffer, M.; Chapin, T.; Rockström, J. Resilience Thinking: Integrating Resilience, Adaptability and Transformability. Ecol. Soc. 2010, 15, 20. [Google Scholar] [CrossRef]
  36. Garcia, E.J. The Application of Ecological Resilience to Urban Landscapes. Ph.D. Dissertation, Victoria University of Wellington, Wellington, New Zealand, 2013. [Google Scholar]
  37. Cifdaloz, O.; Regmi, A.; Anderies, J.M.; Rodriguez, A.A. Robustness, Vulnerability, and Adaptive Capacity in Small-Scale Social-Ecological Systems: The Pumpa Irrigation System in Nepal. Ecol. Soc. 2010, 15, 39. [Google Scholar] [CrossRef]
  38. Porter, M.E. The Competitive Advantage of Nations; Macmillan: London, UK, 1990. [Google Scholar]
  39. Henderson, J. Vernon. Efficiency of Resource Usage and City Size. J. Urban Econ. 1986, 19, 47–70. [Google Scholar] [CrossRef]
  40. Jaffe, A.B.; Trajtenberg, M.; Henderson, R. Geographic Localization of Knowledge Spillovers as Evidenced by Patent Citations. Q. J. Econ. 1993, 108, 577–598. [Google Scholar] [CrossRef]
  41. Zhang, M.; Wu, Q.; Li, W.; Sun, D.; Huang, F. Intensifier of Urban Economic Resilience: Specialized or Diversified Agglomeration? PLoS ONE 2021, 16, e0260214. [Google Scholar] [CrossRef]
  42. Dai, R.; Mookherjee, D.; Quan, Y.; Zhang, X. Industrial Clusters, Networks and Resilience to the COVID-19 Shock in China. J. Econ. Behav. Organ. 2021, 183, 433–455. [Google Scholar] [CrossRef]
  43. Cainelli, G.; Montresor, S.; Vittucci, M.G. Firms’ Death Rate and Spatial Agglomeration. Evidence on the Resilience of Italian Local Production Systems. Riv. Econ. E Stat. Territ. 2012, 101–126. [Google Scholar] [CrossRef]
  44. Staber, U. Spatial Proximity and Firm Survival in a Declining Industrial District: The Case of Knitwear Firms in Baden-Wu¨Rttemberg. Reg. Stud. 2001, 35, 329–341. [Google Scholar] [CrossRef]
  45. De Silva, D.G.; McComb, R.P. Geographic Concentration and High Tech Firm Survival. Reg. Sci. Urban Econ. 2012, 42, 691–701. [Google Scholar] [CrossRef] [Green Version]
  46. Kukalis, S. Agglomeration Economies and Firm Performance: The Case of Industry Clusters. J. Manag. 2009, 36, 453–481. [Google Scholar] [CrossRef]
  47. Shin, D.-H.; Hassink, R. Cluster Life Cycles: The Case of the Shipbuilding Industry Cluster in South Korea. Reg. Stud. 2011, 45, 1387–1402. [Google Scholar] [CrossRef]
  48. Peltoniemi, M. Reviewing Industry Life-Cycle Theory: Avenues for Future Research. Int. J. Manag. Rev. 2011, 13, 349–375. [Google Scholar] [CrossRef]
  49. Bentley, G.; Bailey, D.; Braithwaite, D. Resilience, adaptation and survival in industry sectors: Remaking and remodelling of the automotive sector. In Creating Resilient Economies, 1st ed.; Vorley, T., Williams, N., Eds.; Entrepreneurship, Growth and Development in Uncertain Times; Edward Elgar Publishing Limited: Northampton, MA, USA, 2017; pp. 55–69. [Google Scholar]
  50. Hsu, J. State Transformation and the Evolution of Economic Nationalism in the East Asian Developmental State: The Taiwanese Semiconductor Industry as Case Study. Trans. Inst. Br. Geogr. 2017, 42, 166–178. [Google Scholar] [CrossRef]
  51. Wade, R. Governing the Market: Economic Theory and the Role of Government in East Asia; Princeton University Press: Princeton, NJ, USA, 1990. [Google Scholar]
  52. Wade, R.H. What Strategies Are Viable for Developing Countries Today? The World Trade Organization and the Shrinking of “Development Space”. Rev. Int. Polit Econ. 2003, 10, 621–644. [Google Scholar] [CrossRef]
  53. Mathews, J.A. A Silicon Valley of the East: Creating Taiwan’s Semiconductor Industry. Calif. Manag. Rev. 1997, 39, 26–54. [Google Scholar] [CrossRef]
  54. IMF. World Economic Outlook, April 2020: The Great Lockdown. 2020. Available online: https://www.imf.org/en/Publications/WEO/Issues/2020/04/14/weo-april-2020 (accessed on 2 February 2023).
  55. Kuo, Y.C.; Klingler-Vidra, R. Post-COVID-19 Taiwan in the Global Semiconductor Industry: The Context of the New US Administration. Taiwan Insight. 2021. Available online: https://taiwaninsight.org/2021/02/16/post-covid-19-taiwan-in-the-global-semiconductor-industry-the-context-of-the-new-u-s-administration/ (accessed on 2 February 2023).
  56. Anselin, L. Local Indicators of Spatial Association-LISA. Geogr. Anal. 2010, 27, 93–115. [Google Scholar] [CrossRef]
  57. Whallon, R. Spatial Analysis of Occupation Floors II: The Application of Nearest Neighbor Analysis. Am. Antiq. 1974, 39, 16–34. [Google Scholar] [CrossRef]
  58. Irwin, D.A.; Klenow, P.J. Learning-by-doing spillovers in the semiconductor industry. J. Political Econ. 1994, 102, 1200–1227. [Google Scholar] [CrossRef] [Green Version]
  59. Elia, G.; Petruzzelli, A.M.; Urbinati, A. Implementing open innovation through virtual brand communities: A case study analysis in the semiconductor industry. Technol. Forecast. Soc. Change 2020, 155, 119994. [Google Scholar] [CrossRef]
  60. Morris, P.R. A History of the World Semiconductor Industry; IET: London, UK, 1990. [Google Scholar]
  61. Mathews, J.A.; Cho, D.S. Tiger Technology: The Creation of a Semiconductor Industry in East Asia; Cambridge University Press: Cambridge, UK, 2000. [Google Scholar]
  62. Shattuck, T.J. Stuck in the Middle: Taiwan’s Semiconductor Industry, the US-China Tech Fight, and Cross-Strait Stability. Orbis 2021, 65, 101–117. [Google Scholar] [CrossRef]
  63. Kanarik, K.J.; Lill, T.; Hudson, E.A.; Sriraman, S.; Tan, S.; Marks, J.; Vahedi, V.; Gottscho, R.A. Overview of atomic layer etching in the semiconductor industry. J. Vac. Sci. Technol. A Vac. Surf. Film. 2015, 33, 020802. [Google Scholar] [CrossRef] [Green Version]
  64. Moss, S.J.; Ledwith, A. Chemistry of the Semiconductor Industry; Springer Science & Business Media: Berlin/Heidelberg, Germany, 1989. [Google Scholar]
  65. Hsu, C.W.; Hu, A.H.; Chiou, C.Y.; Chen, T.C. Using the FDM and ANP to construct a sustainability balanced scorecard for the semiconductor industry. Expert Syst. Appl. 2011, 38, 12891–12899. [Google Scholar] [CrossRef]
  66. Lin, F.; Lin, S.W.; Lu, W.M. Dynamic eco-efficiency evaluation of the semiconductor industry: A sustainable development perspective. Environ. Monit. Assess. 2019, 191, 435. [Google Scholar] [CrossRef]
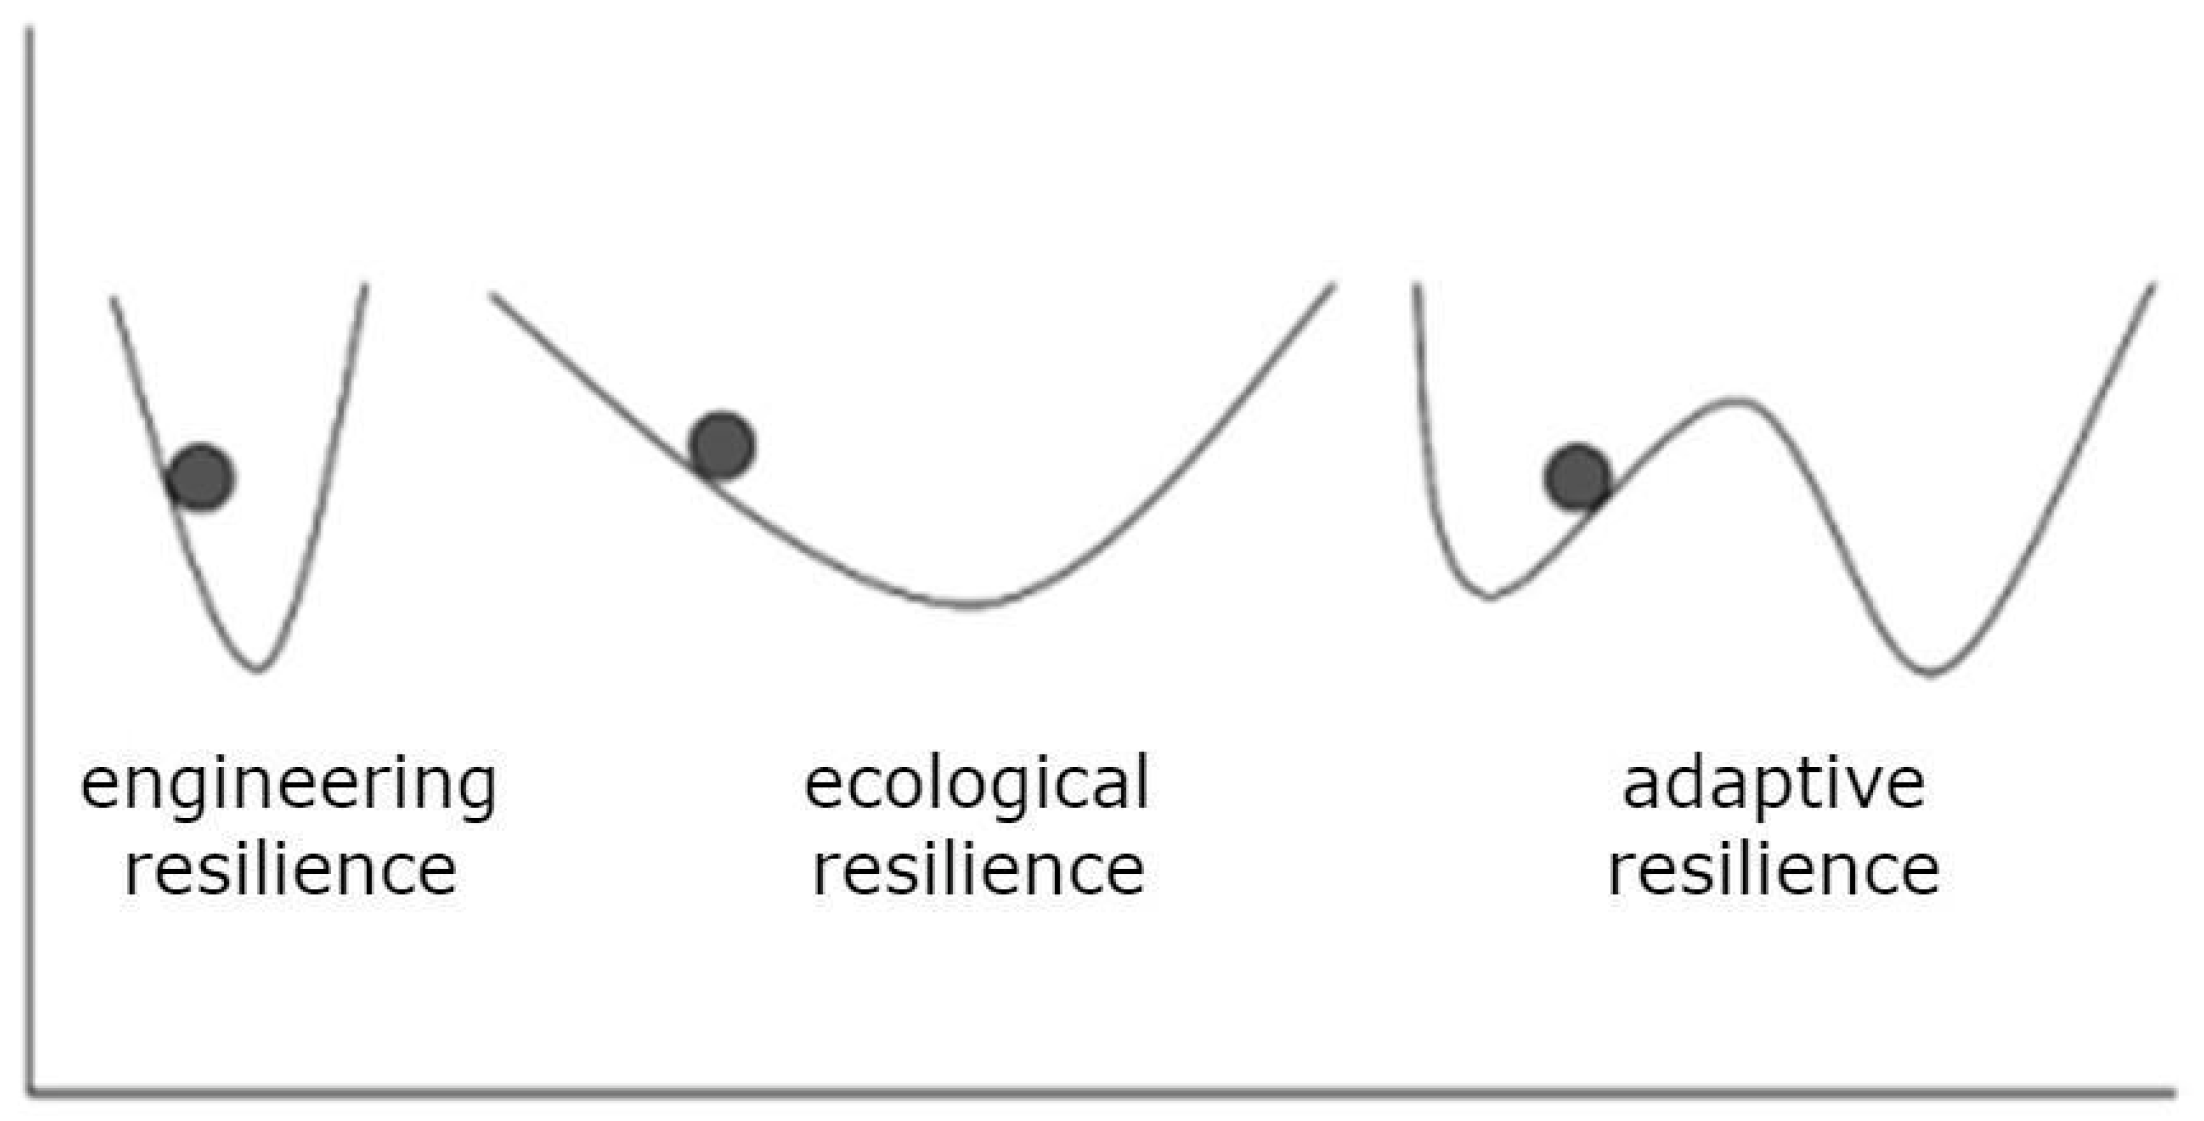
Figure 1. Resilience analogy (adapted from Fiksel [12], reprinted with permission from Fiksel, J. Designing resilient, sustainable systems. Environ. Sci. Technol. 2003, 37, 5330–5339. Copyright 2023 American Chemical Society).
Sustainability 15 03546 g001
Figure 3. Research framework.
Sustainability 15 03546 g003
Figure 4. Cluster/outlier type (COType) distribution maps for the semiconductor industry.
Sustainability 15 03546 g004
Table 1. Survival periods for production sites.
Survival Period261126122613264126422643
Num%Num%Num%Num%Num%Num%
1 year346.31362.16351.27455.66457.05035.71
2 years55324533285
3 years45232744226
4 years29253023243
5 years69161476
6 years2119.131320.271418.641323.581524.831255.36
7 years15911842
8 years12381475
9 years64710103
10 years314519
11 years616.11410.14313.561012.74710.7448.93
12 years1065450
13 years10210610
14 years19311611
15 years303120
16 years109.7315.411113.9836.6025.3700.00
17 years205410
18 years1137130
19 years6410620
20 years000000
21 years38.7212.0332.5431.4202.0100.00
22 years501020
23 years511010
24 years1311000
SUM29810014810023610021210014910056100
Average8.526.017.776.586.266.63
Note: because of the official dataset, the survey period for category 2643 is from 2005 to 2020, while the others are from 1997 to 2020.
Table 2. Spatial patterns of semiconductor production sites.
CategoryANNCluster and Outlier Analysis
Z-ScoreHH Num.Cluster Num.Cluster Size (Fishnet)
1~45~89~12 13~16 AVG.
2611−22.3341640026.83
2612−10.7137970114.11
2613−19.33501393013.85
2641−16.814816115003.00
2642−11.1336971104.00
2643−6.5520541003.80
Total--232584210244.27
------72.41%17.24%3.45%6.90%--
Note: a fishnet is 1 km2.
Table 3. The survival period of production sites.
CategoryClustered Production SiteNon-Clustered Production SiteDifference
(Year)
Average YearsNumberAverage YearsNumber
26118.912576.0241+2.89
26125.92786.1170−0.19
26137.821837.5853+0.23
26416.701296.4183+0.29
26425.731117.8238−2.09
26436.09347.4522−1.37
Table 4. Spatial patterns and survival periods.
CategorySurvival PeriodHH Num.Cluster Num.Avg.
Cluster Size
ANN
Z-Score
ClusterDifference from
Non-Cluster
Better in clusters26118.91+2.894166.83−22.33
26416.70 +0.29 48163.00−16.81
26137.82 +0.23 50133.85−19.33
Worse in clusters26125.92 −0.19 3794.11−10.71
26436.09 −1.37 2053.80−6.55
26425.73 −2.09 3694.00−11.13
Table 5. Correlation of survival period and spatial patterns.
ANN Z-ScoreHH NumberCluster NumberAverage Cluster Size
Survival period in clusterPearson correlation−0.8990.490−0.0140.709
p-value (two-tailed)0.0150.3240.980.115
Disclaimer/Publisher’s Note: The statements, opinions and data contained in all publications are solely those of the individual author(s) and contributor(s) and not of MDPI and/or the editor(s). MDPI and/or the editor(s) disclaim responsibility for any injury to people or property resulting from any ideas, methods, instructions or products referred to in the content.