Article

Monitoring Cadmium Content in the Leaves of Field Pepper and Eggplant in a Karst Area Using Hyperspectral Remote Sensing Data

1
College of Forestry, Guizhou University, Guiyang 550025, China
2
Guizhou Institute of Mountainous Resources, Guiyang 550001, China
3
School of Geography and Environmental Science, Guizhou Normal University, Guiyang 550001, China
4
Urban-Rural Planning & Design Institute of Guihzou, Guiyang 550001, China
*
Author to whom correspondence should be addressed.
Sustainability 2023, 15(4), 3508; https://doi.org/10.3390/su15043508
Submission received: 8 November 2022 / Revised: 9 February 2023 / Accepted: 12 February 2023 / Published: 14 February 2023
(This article belongs to the Special Issue Food Security and Environmentally Sustainable Food Systems)

Abstract

:
The ability to quickly and non-destructively monitor the cadmium (Cd) content in agricultural crops is the basic premise of effective prevention and control of Cd contamination in agricultural products. Hyperspectral technology provides a solution for this issue. The potential capability for the spectral prediction of the Cd content in the leaves of pepper and eggplant in the field was explored, and a spectral prediction model of the Cd content in these leaves was established. In this study, based on the indoor spectrum, the sensitive wavebands for predicting the Cd content in leaves were determined preliminarily by correlation analysis. Partial least squares regression (PLSR) and support vector machine regression (SVMR) were used to establish spectral prediction models, and the final sensitive wavebands were determined by the size of the model index. The results show that the SVMR model exhibited higher prediction accuracy than the PLSR model. The RPDp (relative percent different of prediction set) values of the best SVMR prediction models for the pepper leaves and the eggplant leaves were 1.82 and 1.49, respectively. The values of Rp2 (coefficient of determination of prediction set), which can quantitatively estimate the Cd content in leaves, were 0.897 (p < 0.01) and 0.726 (p < 0.01), respectively. This study demonstrated that the leaf spectra of pepper and eggplant in the field can be used to predict the Cd content in leaves, providing a reference for monitoring the Cd content in the fruits of pepper and eggplant in the future.

1. Introduction

Cadmium (Cd) is toxic, is easily absorbed by plants and has a long half-life [1,2,3]. It is listed as the world’s greatest hazardous substance by the United Nations Environment Programme (UNEP) [4]. After being enriched by vegetables, Cd is brought into the human body through consumption. When Cd content reaches a certain level, it can damage the human nervous system and skeletal system, increase the risk of painful diseases and other ailments and pose a major threat to human health [5,6,7]. Thus, the accumulation of Cd in vegetables has aroused great concern [8,9].
Some studies have pointed out that cadmium pollution exists in soils of 11 provinces and 25 regions in China [10], accounting for approximately 20% of China’s farmland soil area [11]. Cd pollution in soil should receive greater attention [12]. Guizhou province belongs to a geochemically anomalous area with respect to Cd, and the average content of Cd in soil is as high as 0.659 mg/kg, much higher than the average Cd content of cultivated soil (0.27 mg/kg) in China [13]. Due to the application of pesticides and chemical fertilizers, the probability of heavy metal accumulation in cultivated land is much higher than it is in general land use types [14]. Pepper, as an important agricultural product in Guizhou Province, poses the risk of Cd pollution in some areas [15]. Meanwhile, the content of heavy metals in eggplant, as a traditional crop, is positively correlated with the concentration of heavy metals in soil [16]. To ensure the safety of vegetables, it is necessary to employ effective and rapid methods to monitor the content of Cd in pepper and eggplant.
The traditional method is to collect plant samples from the field and detect Cd content in the laboratory [17]. This method has high accuracy, but it takes a long time and costs a lot. Now, the development of hyperspectral technology provides technical support for nondestructive, real-time, broad-scale monitoring of the Cd content in crops [18]. Only the spectral data of plant leaves are needed, and the Cd content model can be established according to sensitive bands or a spectral index [19]. In some solanaceous plants, according to the internal relationship between the Cd content in leaves and the Cd content in fruits, Cd content in fruits can be predicted by leaf spectra. Wang et al. [20] analyzed the relationship between the spectral reflectance of pepper leaves and the Cd content of pepper fruits at maturity under different cadmium stress levels in four growth stages and predicted the Cd content of pepper fruits by multiple regression. Mirzaei et al. [21] selected the characteristic wavebands of heavy metals in grape leaves with partial least squares (PLS) as the feature selection technique and established spectral prediction models for Cu, Zn, Pb, Cr and Cd in grape leaves by multiple linear regression (MLR) and support vector machine (SVMR) regression. Using DB4 and DB6 as wavelet basis functions, Jun et al. [22] established a model for estimating the Cd content in tomato leaves. W. Zhou et al. [23] obtained the spectral reflectance of leaves under six different levels of Cd stress through the entire growth period in rice and established hyperspectral prediction models of Cd content for three growth stages of rice by PLSR. Sun et al. [24] and Feng et al. [25] established spectral prediction models of the Cd content in lettuce leaves and Miscanthus sacchariflorus leaves by PLSR and SVMR under laboratory-controlled conditions. The above research shows that on the basis of controlling the heavy metal content of crops, the indoor spectra can establish a relatively accurate estimation model of heavy metal content. However, the content of heavy metals in soil under natural conditions is relatively low [26]. Under the influence of different climatic environments, there are certain differences in the concentration of heavy metals in crops [27]. Whether the spectral model established under controlled conditions is suitable for the prediction of heavy metal content in field crops still needs further verification. Therefore, this study attempts to establish a spectral estimation model of Cd content in pepper and eggplant leaves in the field in order to provide a reference for the specific application of the spectral model of heavy metal content in crops.
Altogether, the objectives of this study are as follows: (1) to evaluate the capability of the spectral method to quantitatively predict Cd content in pepper and eggplant leaves in the field; (2) to determine the sensitive wavebands of hyperspectral data for predicting the Cd content in pepper and eggplant leaves; (3) to establish spectral prediction models of the Cd content in pepper and eggplant leaves and compare the difference in accuracy of leaf Cd content values estimated by PLSR and SVMR.

2. Materials and Methods
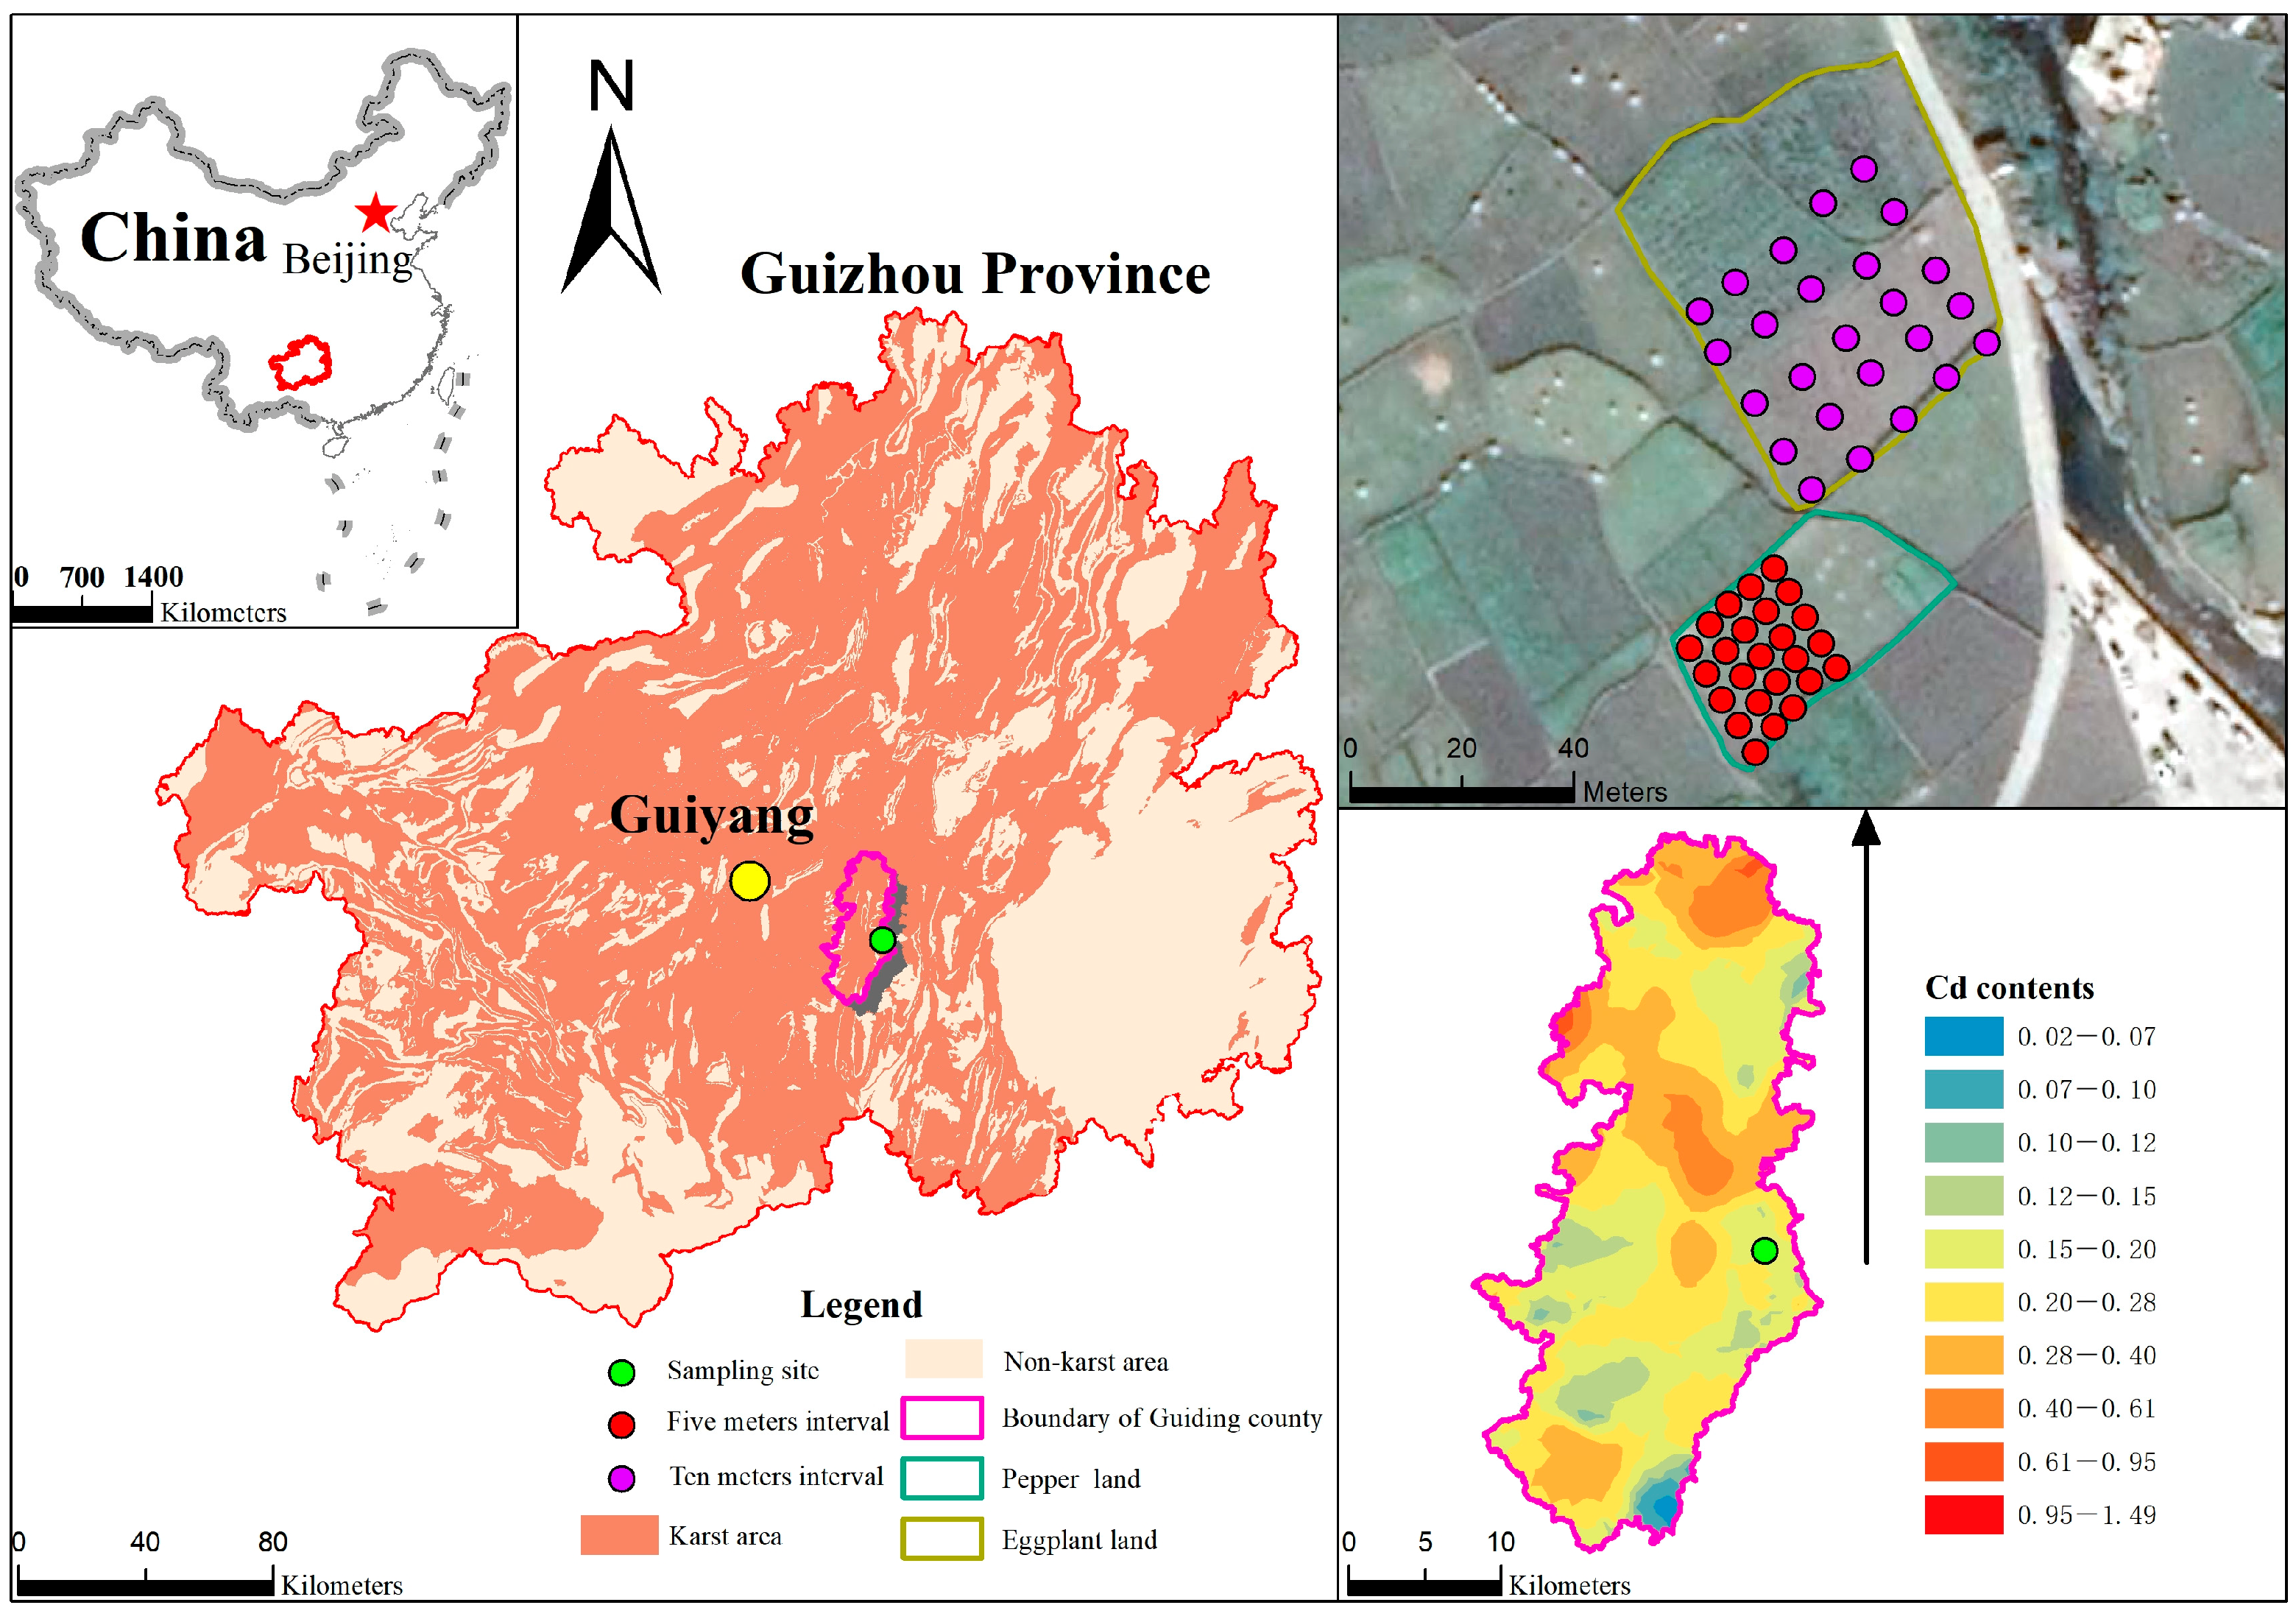
2.1. Study Area

The sample area is located in Guiding County, Guizhou Province. Guizhou province is within an area of geochemical anomaly for Cd [28] and is characterized by a typical karst topography. The soil layer in a karst area is shallow and discontinuous, and the area of good farmland and good soil is relatively scarce [29]. These conditions make it necessary to implement Cd pollution control successfully in the limited arable land resources and effectively prevent Cd contamination of agricultural products. Guiding county is located in the central part of Guizhou Province. The cultivated land area of the whole county is approximately 13,233.4 hm2. It is mainly composed of middle and low farmland and is suitable for the comprehensive development of agriculture, forestry and animal husbandry. Using Cd content data for 421 soil samples from Guiding County obtained by the research team in 2015, a map of the distribution of the Cd content in Guiding County was obtained by Kriging interpolation simulation. Based on the interpolation map, typical farmland in the area with relatively high Cd content was selected for sample plots for the plant spectral experiment. Figure 1 is the location map of the study area.

2.2. Data Acquisition

2.2.1. Sample Collection and Processing

According to the actual terrain of the field, 25 soil samples were collected at 5-m intervals in a pepper field, and 25 soil samples were collected at 10-m intervals in an eggplant field, using an isometric sampling method. The depth of sampling was 0–20 cm, with a total of 50 soil samples. The leaves and fruits of pepper and eggplant plants were collected at the corresponding soil sample points until the fruit ripened. Because some plants failed to survive in the pepper field, 18 pepper samples and 25 eggplant samples were obtained.
Due to the strong heterogeneity of soil in karst area, in order to understand whether there is significant difference in the background value of soil in the sample sites, soil samples from various sites were sent to the laboratory for determination of pH, organic matter, As, Pb, Cr, Cd and Hg content. After being air-dried and ground, the soil samples pass through 2 mm and 0.149 mm soil sieves for pH value, organic matter and heavy metal analysis. At the same time, the contents of As, Pb, Cr, Cd and Hg in the leaves and fruits of pepper and eggplant were also detected. The soil organic matter was determined by potassium permanganate external heating method, and the soil pH was measured by pH meter. Cd and Pb in plants and soil are measured by graphite furnace atomic absorption method, Hg and As are measured by atomic fluorescence method, and Cr is measured by atomic absorption spectrophotometry. The detection limits of As, Pb, Cr, Cd and Hg in soil are 0.01, 0.1, 5, 0.01 and 0.002 mg·kg−1, respectively. The detection limits of As, Pb, Cr, Cd and Hg in plants are 0.04, 0.005, 0.008, 0.0003 and 0.01 mg·kg−1, respectively.

2.2.2. Spectral Data Acquisition and Processing

The wavelength range of ASD FieldSpec 4 is 350–2500 nm, and the resampling interval is 1 nm. There are 2151 output wavebands. Under stable indoor conditions, the spectral reflectance of leaves was obtained with an ASD Leaf Clip; the canopy spectral reflectance was measured from 11:30 am to 14:30 am (Beijing time) under favorable weather conditions and no wind. Five spectral curves were collected from each sample, and the wrong spectral curves were eliminated using ViewSpec Pro. The breakpoints of 1000 and 1800 nm were corrected by the split correction tool, and arithmetic averages were obtained as the final spectral reflectance data.
The original spectrum was denoised by Savitzky–Golay smoothing with a window length of 10. To reduce redundant information [30], data were resampled at 350–1000 nm with a standard spectral resolution of 3 nm and at 1000–2500 nm at a resolution of 10 nm. Finally, the first derivative transformation was performed by using the spectrum after the breakpoint correction, smoothing and impulse sampling.

2.3. Model Construction and Evaluation

2.3.1. Sensitive Wavebands

A large number of hyperspectral wavebands show high correlation and redundant data. Therefore, some sensitive wavebands must be selected from the whole spectrum to participate in model construction. These sensitive wavebands refer to the spectral wavebands which are highly correlated with some attributes of ground features. They are important reference wavebands for identifying ground features and important indicator wavebands for hyperspectral quantitative inversion of surface features [31]. In this study, Pearson correlation analysis was carried out between the Cd content in leaves and spectral data, and significance testing at the level of p < 0.05 was used to determine the sensitive wavebands. In order to avoid internal collinearity between spectral bands, the spectral resolution of 1 nm is resampled to 3 nm (350–1000 nm) and 10 nm (1000–2500 nm). At the same time, when selecting the sensitive band, the adjacent band is removed as the sensitive band.

2.3.2. Partial Least Squares Regression (PLSR)

PLSR combines principal component analysis, general multiple linear regression and canonical correlation analysis. Based on the idea of principal component extraction, PLSR can simplify the structure of spectral data, reduce the redundancy of spectral data and overfitting problems in regression models as much as possible, effectively solving the problem of multiple collinearity in a large number of wavebands in hyperspectral data to enhance model stability [32].

2.3.3. Support Vector Machine Regression (SVMR)

SVM is a new machine learning method proposed by Vanpik based on dimension theory and structural risk minimization theory. In SVM classification, the radial basis function (RBF) is selected, and penalty parameters (c) and kernel function parameters (g) are determined by cross-validation. The minimum root mean square error of cross-validation is used as the selection criterion for penalty parameters and kernel function parameters [33]. Support vector machine learning can also be used for regression, which is called support vector machine regression (SVMR).

2.3.4. Model Index Evaluation Method

Model fitting was evaluated by three statistical methods: coefficient of determination (R2), relative percent different (RPD) and root mean square error (RMSE) [34]. When the RMSE is smaller, R2 and RPD are larger, which indicates that the prediction accuracy is higher. RPD > 2.50 indicates that the model has excellent predictive ability; when 2.00 < RPD ≤ 2.50, the model has good quantitative predictive ability; when 1.80 < RPD ≤ 2.00, the model has quantitative predictive ability; when 1.40 < RPD ≤ 1.80, the model has general quantitative predictive ability; when 1.00 < RPD ≤ 1.40, the model has the ability to distinguish high values from low values; when RPD ≤ 1.00, the model has no predictive ability [35].
R 2 = 1 y ^ k y k 2 y ^ k y ¯ k 2
RMSE = y ^ k y k 2 n
RPD = SD RMSECV
where n is the number of samples, y k and y ^ k are actual measurement value and evaluation values obtained by the model for sample k, y ¯ is mean value of actual measurements, and the range of k is 1, 2, 3, …, n. SD is the standard deviation of validation. A flow chart of the article is shown in Figure 2.

2.4. Software Platform

The original spectra were processed in ViewSpect, and the spectrum smoothing and first derivative transformation were performed based on origin 2019. Resampling was accomplished in Envi 5.3. PLSR models were completed in SPSS 22, and SVMR models were carried out in LIBSVM 3.17.

3. Results

3.1. Characteristics of Cadmium Accumulation

3.1.1. Characteristics of Cadmium Accumulation in Soil

The contents of As, Pb, Cr, Cd, Hg, pH and organic matter in 50 soil samples were investigated and analyzed. As shown in Table 1, the organic matter content of the sample plot was high, with an average value of 44.80 g/kg; the contents of As, Pb, Cr and Hg were low, avoiding the stress of these four heavy metals on plants. Only the content of Cd was high, with an average value of 0.33 mg/kg. The soil of the sample plot is at risk of heavy metal Cd pollution, and agricultural products are under certain Cd stress, for which vigilance is required. The standard deviation of the Cd content in 50 samples was 0.04, and the coefficient of variation was 12.18%, which indicates that the degree of dispersion of the Cd content in the soil samples was small; the kurtosis was −0.02, and the skewness −0.12, indicating that the Cd content of the soil samples conforms to a normal distribution. On the whole, the plots meet the needs of the study.

3.1.2. Characteristics of Cadmium Accumulation in Plants

Chemical detection in the laboratory showed that As, Pb, Cr and Hg contents in leaves and fruits were low and were not detected in a large number of samples, so Cd content was mainly analyzed. As shown in Table 2, the Cd enrichment coefficients for pepper fruit and leaf were low, and the average values of Cd content were low: 0.025 mg/kg and 0.041 mg/kg, respectively. Cd enrichment coefficients of eggplant fruit and leaf were higher, and the average values of Cd content were higher: 0.132 mg/kg and 0.227 mg/kg, respectively.
The EF (enrichment coefficient) is the ratio of heavy metal content in each plant part to the total level of heavy metals in the soil. The Cd content of one eggplant fruit sample was not detected, so the total number of eggplant fruit samples was 24.
As shown in Table 3, there was a significant positive correlation between pepper leaves and pepper fruits at maturity (p < 0.05), and the correlation coefficient was 0.492; the correlation coefficient between eggplant leaves and eggplant fruits at a mature stage was 0.199, and the correlation coefficient was low.

3.2. Selection of Sensitive Wavebands for Leaf Spectra

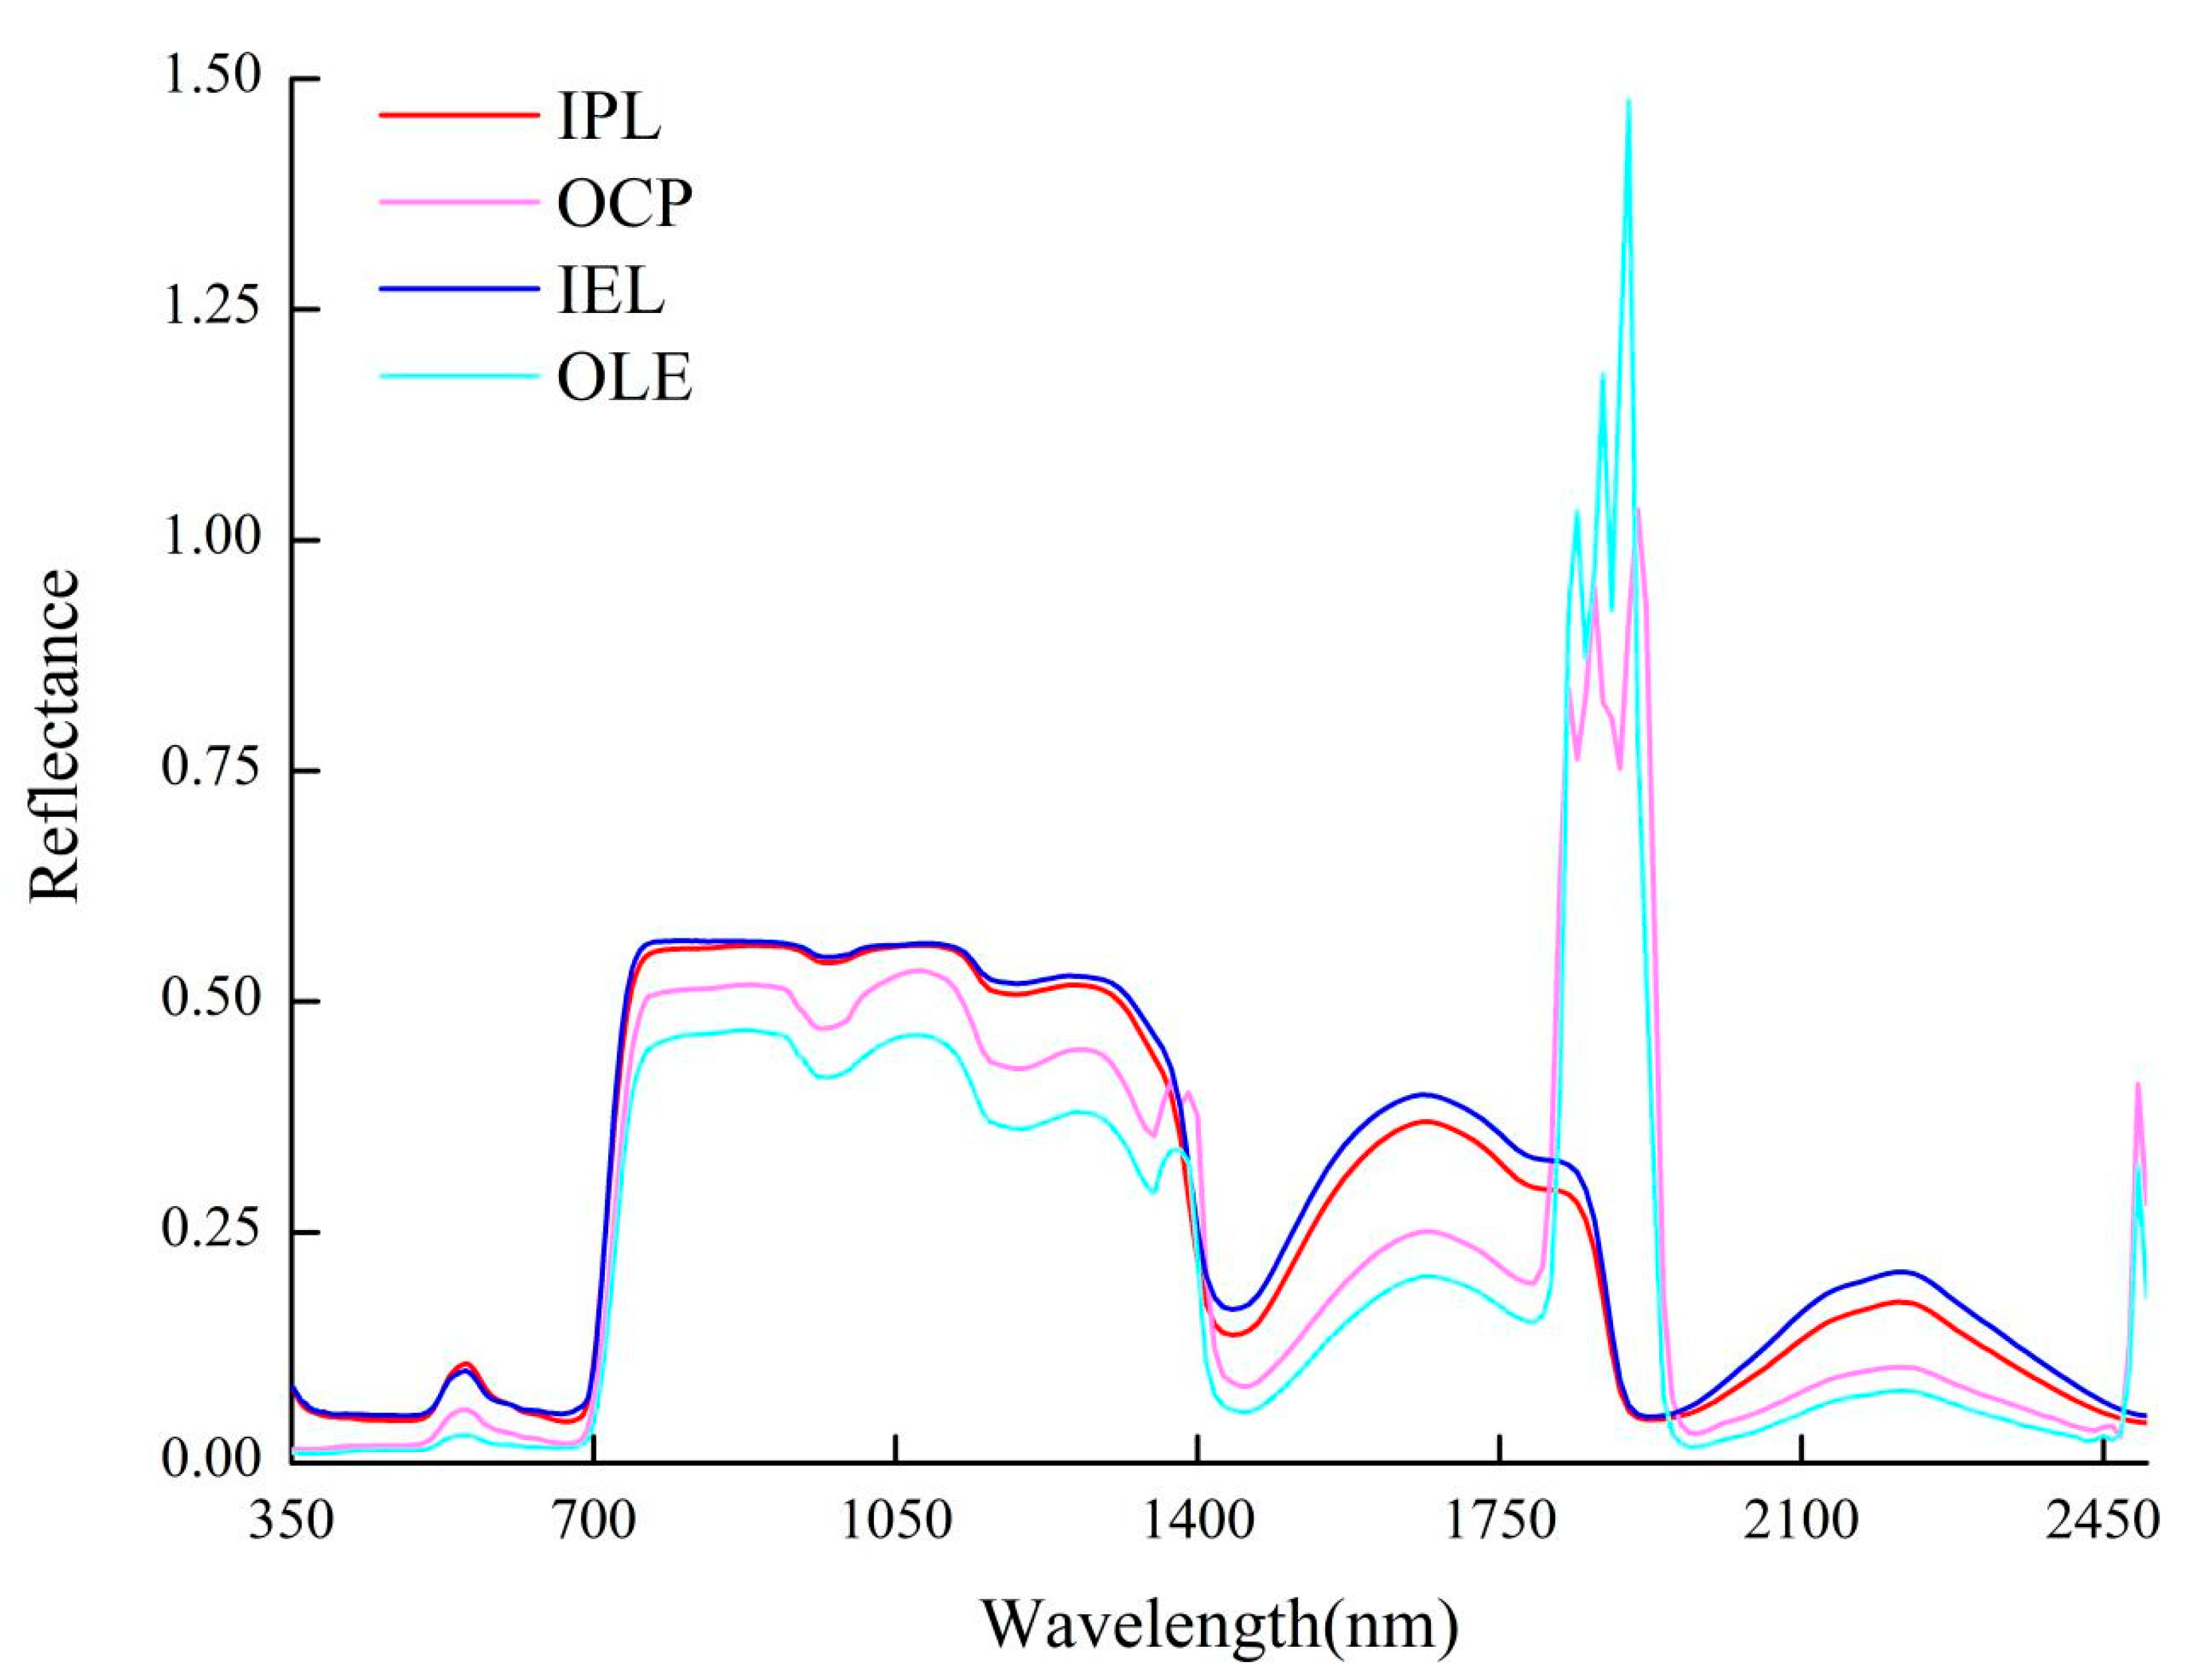
3.2.1. Original Spectral Characteristics

Spectral data for pepper leaves and eggplant leaves were obtained indoors by ground object spectrometry, and spectral data for pepper plant canopy and eggplant canopy were obtained outdoors. The indoor conditions were relatively stable, and the outdoor canopy spectral reflectance corresponding to pepper and eggplant was generally lower than indoor spectral reflectance due to the influence of environmental conditions such as solar radiation size, cloud cover, wind and human factors (Figure 3). Therefore, in order to obtain better modeling effect, the indoor leaf spectrum with higher reflectivity was selected for subsequent analysis. In general, the leaf spectra of pepper and eggplant in the sample plot were not markedly affected by Cd stress, and the leaf spectra were consistent with the general spectral characteristics of plant leaves. Chlorophyll is dominant in the visible region, the near-infrared region is mainly affected by leaf cell structure, and the far-infrared region is greatly influenced by water content [36]. Because the outdoor spectrum is located at 350–400 nm and 2400–2500 nm at both ends of the test range, and 1400 nm and 1900 nm are dominated by the strong absorption band of water, the spectral noise near these wavebands was relatively large. The visible to near-infrared region of the indoor spectrum with higher reflectivity was selected as the research band interval for a follow-up study.

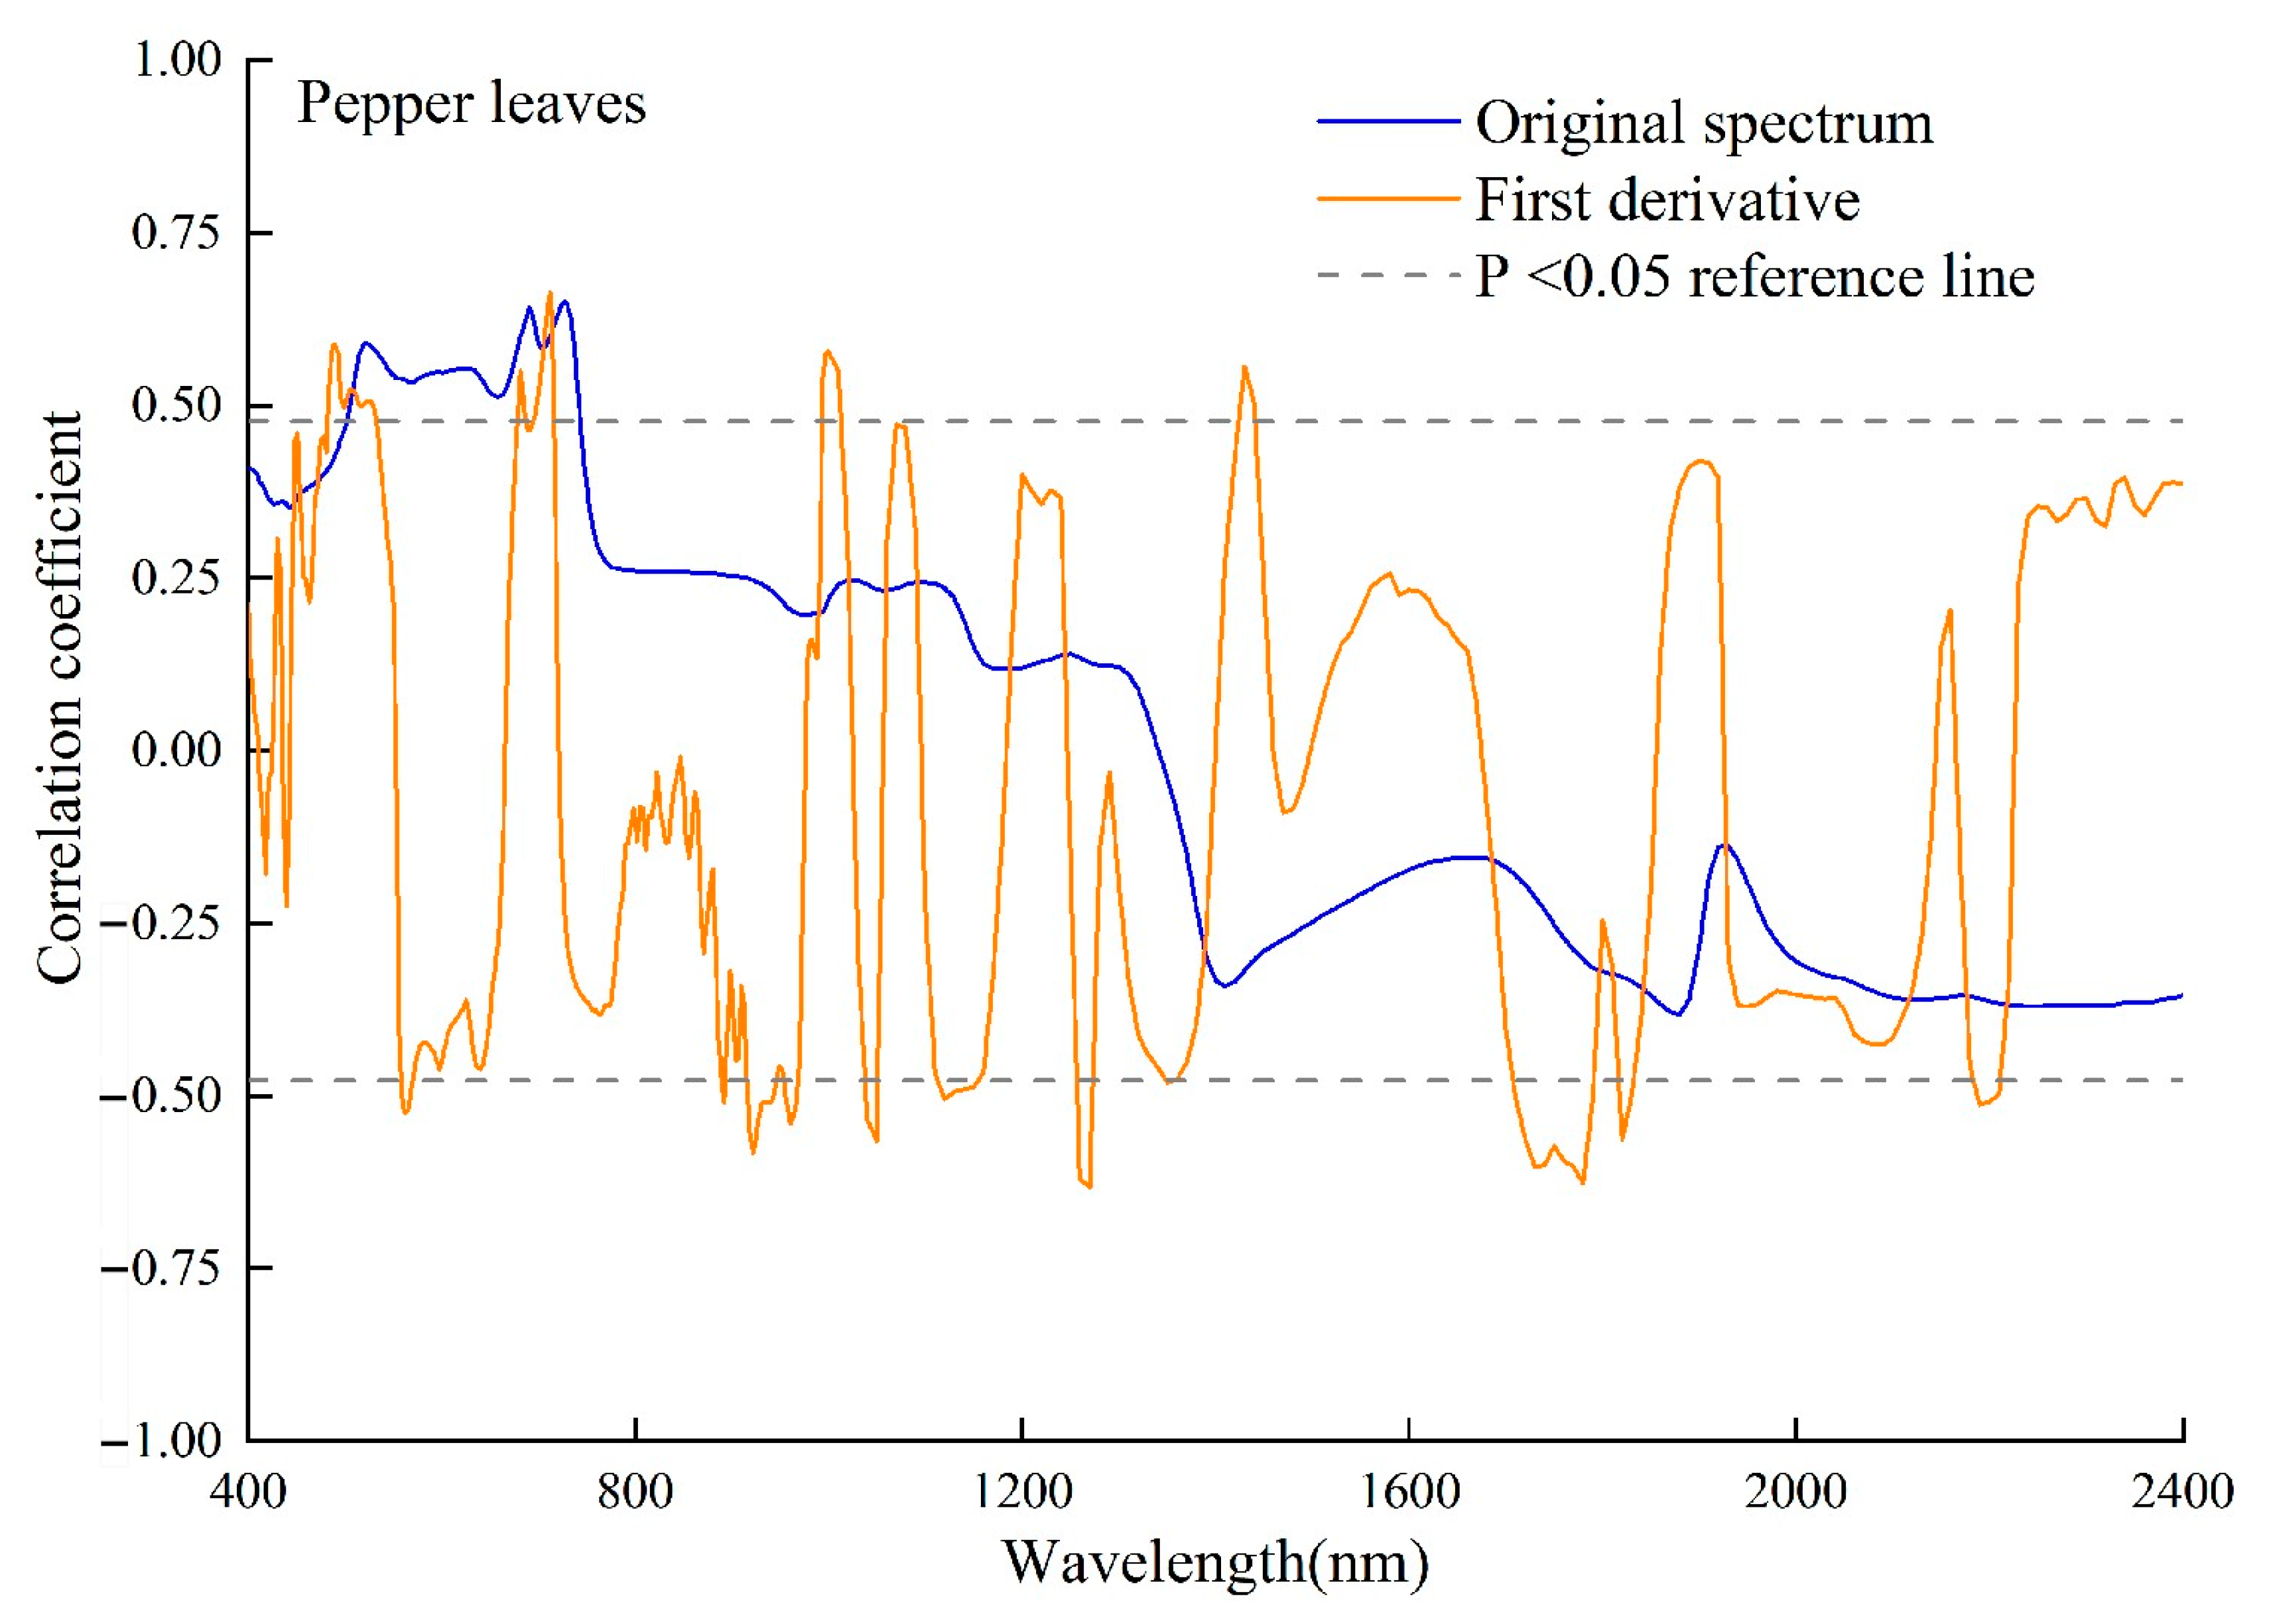
3.2.2. Screening of Sensitive Wavebands in Pepper Leaves

Based on the indoor leaf spectra, the correlation coefficients between the original spectra, the first derivative spectra and the Cd content of pepper leaves were calculated (Figure 4). The correlation coefficient between the original spectrum and the Cd content was relatively low; the visible to near-infrared band was positively correlated, and the far-infrared band was negatively correlated. In the original spectrum, the sensitive wavebands were positively correlated with the Cd content, and the number was small, mainly located in the range of 500–750 nm. The highest correlation coefficient was 0.650, and the most sensitive wavebands were 595, 619 and 700 nm. On the whole, the first derivative transformation highlighted the correlation between the spectrum and the Cd content in leaves and significantly improved the correlation coefficient between 700–1400 nm. The sensitive wavebands were widely distributed in various wavebands, with the highest correlation coefficient being 0.664. The most sensitive wavebands were 712, 922, 997 and 1270 nm. After the first derivative transformation, the correlation between the spectrum and the Cd content in leaves was significantly improved.

3.2.3. Screening of Sensitive Wavebands in Eggplant Leaves

The correlation coefficients of the Cd content with the original spectra and first derivative spectra in eggplant leaves were calculated (Figure 5). The correlation coefficients between the original spectra and the Cd content in leaves were relatively low, and all of these correlations were negative. The sensitive wavebands were mainly between 1500–1800 nm, and the highest correlation coefficient was −0.415. Because the sensitive wavebands of the original spectra were in the far-infrared band, which is not in the range of this study, the most sensitive wavebands were not selected. On the whole, the first derivative transformation enhanced the correlation between the spectra and the Cd content in leaves, and the correlation coefficient were improved over the entire band range. The most sensitive wavebands were 823, 982 and 1280 nm.

3.3. Prediction and Accuracy Evaluation of the Cd Content in Leaves

First, the samples of pepper leaves and eggplant leaves were sorted according to Cd content from low to high. One sample was taken from every two samples for model prediction, and the remaining samples were used for calibration [34]. Finally, 12 samples for the pepper leaf correction set and 6 samples for the prediction set were obtained; 17 samples for the eggplant leaf correction set and 8 samples for the prediction set were obtained. Based on correlation coefficient analysis, the most sensitive wavebands were determined, and the relationship between spectral data and Cd content in leaves was modeled by PLSR and SVMR.

3.3.1. Regression Model Analysis of the Cd Content in Pepper Leaves

The PLSR (Table 4) and SVMR regression models were established based on these optimal sensitive wavebands of 595, 619 and 700 nm of the original spectrum and 712, 922, 997 and 1270 nm of the first derivative spectral. As shown in Table 5, the PLSR RPDc and SVMR RPDp of the original spectral modeling are 1.23 and 1.13, respectively, and the modeling results do not meet the prediction conditions. However, the first derivative spectral correction set and prediction set of PLSR and SVMR have high prediction accuracy. From the first derivative correction set, the Rc2, RMSEc and RPDc of PLSR and SVMR were almost identical, but in the most important prediction set, values of SVMR Rp2 (0.897) and RPDp (1.82) were significantly higher than Rp2 (0.771) and RPDp (1.61) for PLSR, and SVMR RMSEp (0.0264) was less than PLSR RMSEp (0.0299), so SVMR attained better modeling accuracy. It can be seen from the scatterplot that the distribution of observed and predicted values in the model established by SVMR (Figure 6b) was more uniform than that of PLSR (Figure 6a).

3.3.2. Regression Model Analysis of the Cd Content in Eggplant Leaves

Since the original spectrum showed no sensitive wavebands from visible to near-infrared, the spectral model was based on the first derivative spectral data. PLSR (Table 6) and SVMR regression models were established based on the most sensitive wavebands 823, 982 and 1280 nm. As shown in Table 7, from the perspective of the correction set, values for Rc2 (0.834) and RPDc (2.47) of SVMR were significantly higher than RC2 (0.533) and RPDc (1.51) for PLSR, and SVMR RMSEc (0.0218) was significantly less than PLSR RMSEp (0.0357). In the most important prediction set, SVMR Rp2 (0.726) was higher than the value for PLSR (0.608), and the RMSEp and RPDp of PLSR and SVMR were almost identical, so SVMR appears to have better modeling accuracy. It can be seen from the scatterplot that the distribution of observed and predicted values in the model established by SVMR (Figure 7b) were more centralized than that of PLSR (Figure 7a).

4. Discussion

Different species or different varieties of the same species exhibited different concentrations of Cd in different environments [37]. Wang et al. [20] controlled the concentration of Cd in pepper leaves and fruits by setting different gradient soil Cd concentrations, and indirectly predicted the content of Cd in pepper fruits through leaf spectra. In this study, the spectral model of pepper leaf content was also established by spectral model (RPDp = 1.82, Rp2 = 0.897 (p < 0.01)). However, the Cd content of pepper fruit could not be predicted by leaf spectrum because the Cd content of leaves and fruits in the divided correction set, with a correlation coefficient of 0.514, did not reach a significant correlation. Soil properties such as texture, organic matter and pH are also key factors affecting the availability of heavy metals in soils [38]. At the same time, the enrichment characteristics of Cd in pepper roots, stems, leaves and fruits are different, and the lower content of Cd in soil will further affect the content of Cd in pepper [39]. In this study, it may be that the acidic soil in the sample plot, the complex effect of organic matter on Cd and differences among pepper varieties may have led to some differences in Cd enrichment in pepper fruits, resulting in a poor prediction effect of leaf spectra on the Cd content in fruits. In the future, the sample size can be increased for further experiments on pepper varieties planted in large areas or in areas with high background Cd levels.
The SVMR RPDp of the eggplant leaves in prediction set was 1.49, and Rp2 was 0.726 (p < 0.01), indicating SVMR was able to predict the Cd content in eggplant leaves to a certain extent. The enrichment coefficients of Cd in leaves and fruits of eggplant were relatively high, but the correlation coefficient between leaves and fruits of eggplant was only 0.199. The relationship between the Cd content in leaves and fruits could not be established, and the Cd content in fruits could not be predicted by leaf spectra. At present, most studies have pointed out that the Cd content in eggplant fruits grown on Cd-contaminated soil is usually relatively high [40], but few studies have focused on the relationship between the Cd content in eggplant leaves and fruits. If the relationship between leaves and fruits can be established, and eggplant leaves are large enough, the spectra of leaves will be purer, allowing the rapid prediction of the Cd content of eggplant fruits through indoor or outdoor spectra.
Indoor spectral modeling can directly predict heavy metal content through the surface feature spectrum. At the same time, it also paves the way for the prediction of heavy metal content by outdoor aerial and satellite hyperspectral images. However, further experiments are needed to apply the indoor spectral model to outdoor aerial or satellite hyperspectral data. The main reason is that the indoor environment is relatively stable, while in the outdoor environment, cloud cover limitation, wind, air moisture and plant canopy leaf size will affect the acquisition of outdoor spectra. Therefore, when selecting the corresponding sensitive wavebands, it is necessary to avoid selecting wavebands with large spectral fluctuations (350–400 nm, 1400 nm, 1900 nm and 2400–2500 nm) in the outdoor environment [21]. In addition, most of the existing studies have focused on controlling the Cd content in soil in the laboratory to cultivate plants for spectral experiments, which can establish a good spectral estimation model of the Cd content in leaves. However, the heavy metal Cd content in the field is relatively low, and the Cd content in most plants grown from it is not high. Chlorophyll content in the corresponding leaves has been found not to decrease significantly [41], and either the reflectance of the corresponding visible light region has been low, making it difficult to select sensitive wavebands, or the accuracy of the models has been low. For leaves with relatively low Cd content, red edge and near-infrared wavebands with high reflectance should be selected as sensitive wavebands for spectral modeling. There is also a special case in which the content of heavy metals in soil is not high, but certain plants have enrichment effects on Cd, which leads to high Cd content in plants. In this case, it is difficult to judge the content of heavy metals in plants according to the content of heavy metals in the soil. Altogether, it is necessary to predict the Cd content in plant leaves directly. In a follow-up study, we can simulate the field according to the soil background pH, heavy metal content and other factors in the large area and conduct a spectral experiment on plants with higher Cd content caused by relatively low soil Cd content. Thus, the detection limit level and practicability of the spectral model will be improved.

5. Conclusions

This study shows that the indoor stable leaf spectral data are more suitable for building spectral models than the outdoor canopy spectral data. If indoor models are to be applied to aerial or satellite hyperspectral images, it is necessary to avoid selecting outdoor wavebands (350–400 nm, 2400–2500 nm, 1400 nm, 1900 nm) to establish models. The first derivative transformation significantly improved the potential ability for spectral prediction of the Cd content in leaves. It was found that the wavelengths at approximately 712, 922, 997 and 1270 nm were determined to be the best wavebands for predicting the Cd content in pepper leaves, and the wavelengths at approximately 823, 982 and 1280 nm were the best wavebands for predicting the Cd content in eggplant leaves. Among the PLSR and SVMR prediction models of Cd content in pepper and eggplant leaves, the SVMR model has better accuracy, in which the accuracy of Cd concentration estimation in pepper leaves RPDp is 1.82, and Rp2 is 0.897 (p < 0.01); the estimation accuracy of Cd concentration in eggplant leaves RPDp was 1.49, and Rp2 was 0.726 (p < 0.01).
In this study, PLSR and SVMR were used to predict the Cd content in leaves of pepper and eggplant in the field, providing a reference for the subsequent rapid and convenient prediction of the Cd content in pepper and eggplant fruits. In the future, it will be necessary to increase the number or types of experimental samples. For effective establishment of the Cd content in leaves, the relationship between the Cd content in leaves and the Cd content in fruits can be used to monitor the Cd content of certain solanaceous plants; the internal relationship between the Cd content in leaves and the Cd content in soil can be used to monitor the Cd content in soil. Finally, indoor and outdoor spectral modeling provides a reference for subsequent broad-scale aerial and satellite hyperspectral images to predict the Cd content of crops and soil.

Author Contributions

X.Y., X.W. and A.L. conceived the idea of this paper. X.Y., Q.D. and Y.Y. (Youjin Yan) performed the model. X.Y., Y.Z. and Y.Y. (Yiwen Yao) wrote the paper. All authors have read and agreed to the published version of the manuscript.

Funding

This work was jointly supported by the Planning Project of Guiyang City (No. Zhukehe [2021] 3-27), the Guizhou Science and Technology Support Plan Project (No. [2016]2595-2), China Postdoctoral Science Foundation(2020M673296), the First-class Discipline Construction Project of Guizhou Province (GNYL [2017]007) and the Guizhou Province Graduate Research Fund (YJSCXJH [2020]066, YJSCXJH[2020]065).

Conflicts of Interest

The authors declare no conflict of interest.

References

  1. Wang, Y.; Su, Y.; Lu, S. Predicting Accumulation of Cd in Rice (Oryza Sativa L.) and Soil Threshold Concentration of Cd for Rice Safe Production. Sci. Total Environ. 2020, 738, 139805. [Google Scholar] [CrossRef] [PubMed]
  2. Zhou, X.; Sun, J.; Tian, Y.; Lu, B.; Hang, Y.; Chen, Q. Development of Deep Learning Method for Lead Content Prediction of Lettuce Leaf Using Hyperspectral Images. Int. J. Remote Sens. 2020, 41, 2263–2276. [Google Scholar] [CrossRef]
  3. Wei, J.; Gao, J.; Cen, K. Levels of Eight Heavy Metals and Health Risk Assessment Considering Food Consumption by China’s Residents Based on the 5th China Total Diet Study. Sci. Total Environ. 2019, 689, 1141–1148. [Google Scholar] [CrossRef] [PubMed]
  4. Li, X.; Duan, Q.; Li, J. Hazard and Pollution Analysis of Cadmium in Chinese Domestic Shellfish. Food Sci. 2010, 31, 457–461. (In Chinese) [Google Scholar] [CrossRef]
  5. Jan, A.T.; Azam, M.; Siddiqui, K.; Ali, A.; Choi, I.; Haq, Q.M.R. Heavy Metals and Human Health: Mechanistic Insight into Toxicity and Counter Defense System of Antioxidants. Int. J. Mol. Sci. 2015, 16, 29592–29630. [Google Scholar] [CrossRef]
  6. Tariq Rafiq, M.; Aziz, R.; Yang, X.; Xiao, W.; Stoffella, P.J.; Saghir, A.; Azam, M.; Li, T. Phytoavailability of Cadmium (CD) to Pak Choi (Brassica Chinensis L.) Grown in Chinese Soils: A Model to Evaluate the Impact of Soil CD Pollution on Potential Dietary Toxicity. PLoS ONE 2014, 9, e111461. [Google Scholar] [CrossRef]
  7. Satarug, S.; Baker, J.R.; Urbenjapol, S.; Haswell-Elkins, M.; Reilly, P.E.B.; Williams, D.J.; Moore, M.R. A Global Perspective on Cadmium Pollution and Toxicity in Non-Occupationally Exposed Population. Toxicol. Lett. 2003, 137, 65–83. [Google Scholar] [CrossRef]
  8. Wu, H.; Liu, Q.; Ma, J.; Liu, L.; Qu, Y.; Gong, Y.; Yang, S.; Luo, T. Heavy Metal(Loids) in Typical Chinese Tobacco-Growing Soils: Concentrations, Influence Factors and Potential Health Risks. Chemosphere 2020, 245, 125591. [Google Scholar] [CrossRef]
  9. Fang, Y.; Sun, X.; Yang, W.; Ma, N.; Xin, Z.; Fu, J.; Liu, X.; Liu, M.; Mariga, A.M.; Zhu, X.; et al. Concentrations and Health Risks of Lead, Cadmium, Arsenic, and Mercury in Rice and Edible Mushrooms in China. Food Chem. 2014, 147, 147–151. [Google Scholar] [CrossRef]
  10. Tang, X.; Li, Q.; Wu, M.; Lin, L.; Scholz, M. Review of Remediation Practices Regarding Cadmium-Enriched Farmland Soil with Particular Reference to China. J. Environ. Manag. 2016, 181, 646–662. [Google Scholar] [CrossRef]
  11. Rafiq, M.T.; Aziz, R.; Yang, X.; Xiao, W.; Rafiq, M.K.; Ali, B.; Li, T. Cadmium Phytoavailability to Rice (Oryza Sativa L.) Grown in Representative Chinese Soils. A Model to Improve Soil Environmental Quality Guidelines for Food Safety. Ecotoxicol. Environ. Saf. 2014, 103, 101–107. [Google Scholar] [CrossRef]
  12. Zou, M.; Zhou, S.; Zhou, Y.; Jia, Z.; Guo, T.; Wang, J. Cadmium Pollution of Soil-Rice Ecosystems in Rice Cultivation Dominated Regions in China: A Review. Environ. Pollut. 2021, 280, 116965. [Google Scholar] [CrossRef]
  13. Zhang, C.; Zang, X.; Dai, Z.; Zhang, X.; Ma, Z. Remediation Techniques for Cadmium-Contaminated Dredged River Sediments after Land Disposal. Sustainability 2021, 13, 6093. [Google Scholar] [CrossRef]
  14. Zeng, S.; Yu, H.; Ma, J.; Liu, J.; Chen, F. Identifying the Status of Heavy Metal Pollution of Cultivated Land for Tradeoff Spatial Fallow in China. Acta Pedol. Sin. 2022, 59, 1036–1047. (In Chinese) [Google Scholar] [CrossRef]
  15. Zhang, J.; Yang, R.; Chen, R.; Peng, Y. Bioconcentration of Heavy Metals in Soil-Capsicum annuum L. System in Karst Areas of Guizhou Province. Food Sci. 2017, 38, 175–181. (In Chinese) [Google Scholar] [CrossRef]
  16. Ai, S.; Liu, B.; Yang, Y.; Ding, J.; Yang, W.; Bai, X.; Naeem, S.; Zhang, Y. Temporal Variations and Spatial Distributions of Heavy Metals in a Wastewater-Irrigated Soil-Eggplant System and Associated Influencing Factors. Ecotoxicol. Environ. Saf. 2018, 153, 204–214. [Google Scholar] [CrossRef]
  17. Liu, W.; Yu, Q.; Niu, T.; Yang, L.; Liu, H. Inversion of Soil Heavy Metal Content Based on Spectral Characteristics of Peach Trees. Forests 2021, 12, 1208. [Google Scholar] [CrossRef]
  18. Wu, F.; Wang, X.; Liu, Z.; Ding, J.; Tan, K.; Chen, Y. Assessment of Heavy Metal Pollution in Agricultural Soil around a Gold Mining Area in Yitong County, China, Based on Satellite Hyperspectral Imagery. J. Appl. Remote Sens. 2021, 15, 5034. [Google Scholar] [CrossRef]
  19. Zhang, B.; Guo, B.; Zou, B.; Wei, W.; Lei, Y.; Li, T. Retrieving Soil Heavy Metals Concentrations Based on GaoFen-5 Hyperspectral Satellite Image at an Opencast Coal Mine, Inner Mongolia, China. Environ. Pollut. 2022, 300, 118981. [Google Scholar] [CrossRef]
  20. Wang, T.; Wei, H.; Zhou, C.; Gu, Y.; Li, R.; Chen, H.; Ma, W. Estimating Cadmium Concentration in the Edible Part of Capsicum Annuum Using Hyperspectral Models. Environ. Monit. Assess. 2017, 189, 548. [Google Scholar] [CrossRef]
  21. Mirzaei, M.; Verrelst, J.; Marofi, S.; Abbasi, M.; Azadi, H. Eco-Friendly Estimation of Heavy Metal Contents in Grapevine Foliage Using in-Field Hyperspectral Data and Multivariate Analysis. Remote Sens. 2019, 11, 2731. [Google Scholar] [CrossRef] [PubMed]
  22. Jun, S.; Xin, Z.; Xiaohong, W.; Bing, L.; Chunxia, D.; Jifeng, S. Research and Analysis of Cadmium Residue in Tomato Leaves Based on WT-LSSVR and Vis-NIR Hyperspectral Imaging. Spectrochim. Acta—Part A Mol. Biomol. Spectrosc. 2019, 212, 215–221. [Google Scholar] [CrossRef] [PubMed]
  23. Zhou, W.; Zhang, J.; Zou, M.; Liu, X.; Du, X.; Wang, Q.; Liu, Y.; Liu, Y.; Li, J. Prediction of Cadmium Concentration in Brown Rice before Harvest by Hyperspectral Remote Sensing. Environ. Sci. Pollut. Res. 2019, 26, 1848–1856. [Google Scholar] [CrossRef]
  24. Sun, J.; Wu, M.; Hang, Y.; Lu, B.; Wu, X.; Chen, Q. Estimating Cadmium Content in Lettuce Leaves Based on Deep Brief Network and Hyperspectral Imaging Technology. J. Food Process Eng. 2019, 42, e13293. [Google Scholar] [CrossRef]
  25. Feng, X.; Chen, H.; Chen, Y.; Zhang, C.; Liu, X.; Weng, H.; Xiao, S.; Nie, P.; He, Y. Rapid Detection of Cadmium and Its Distribution in Miscanthus Sacchariflorus Based on Visible and Near-Infrared Hyperspectral Imaging. Sci. Total Environ. 2019, 659, 1021–1031. [Google Scholar] [CrossRef]
  26. Zou, B.; Tu, Y.L.; Jiang, X.L.; Tao, C.; Zhou, M.; Xiong, L.W. Estimation of Cd Content in Soil Using Combined Laboratory and Field DS Spectroscopy. Spectrosc. Spectr. Anal. 2019, 39, 3223–3231. [Google Scholar] [CrossRef]
  27. Ahmad, K.; Khan, Z.I.; Kaukab, R.; Wajid, K.; Mehmood, N.; Muqaddas, H.; Abbas, T.; Ullah, M.F.; Elshikh, M.S.; Al Sahli, A.; et al. Health Risk Assessment of Toxic Heavy Metals in Wheat Crop Grown under Domestic Wastewater Irrigation. Fresenius Environ. Bull. 2017, 25, 7643–7650. [Google Scholar]
  28. Zhang, X.; Chen, D.; Zhong, T.; Zhang, X.; Cheng, M.; Li, X. Assessment of Cadmium (Cd) Concentration in Arable Soil in China. Environ. Sci. Pollut. Res. 2015, 22, 4932–4941. [Google Scholar] [CrossRef]
  29. Bai, X.Y.; Wang, S.J.; Xiong, K.N. Assessing Spatial-Temporal Evolution Processes Of Karst Rocky Desertification Land: Indications For Restoration Strategies. Land Degrad. Dev. 2013, 24, 47–56. [Google Scholar] [CrossRef]
  30. Xie, X.; Sun, B.; Hao, H. Relationship between Visible-near Infrared Reflectance Spectroscopy and Heavy Metal of Soil Concentration. Acta Pedol. Sin. 2007, 44, 982–993. (In Chinese) [Google Scholar]
  31. Xia, F.; Peng, J.; Wang, Q.; Zhou, L.; Shi, Z. Prediction of Heavy Metal Content in Soil of Cultivated Land: Hyperspectral Technology at Provincial Scale. J. Infrared Millim. Waves 2015, 34, 593–599. (In Chinese) [Google Scholar] [CrossRef]
  32. Shen, L.; Gao, M.; Yan, J.; Li, Z.L.; Leng, P.; Yang, Q.; Duan, S.B. Hyperspectral Estimation of Soil Organic Matter Content Using Different Spectral Preprocessing Techniques and PLSR Method. Remote Sens. 2020, 12, 1206. [Google Scholar] [CrossRef]
  33. Zhao, J.; Fang, Y.; Chu, G.; Yan, H.; Hu, L.; Huang, L. Identification of Leaf-Scale Wheat Powdery Mildew (Blumeria Graminis F. Sp. Tritici) Combining Hyperspectral Imaging and an SVM Classifier. Plants 2020, 9, 936. [Google Scholar] [CrossRef]
  34. Lu, Q.; Wang, S.; Bai, X.; Liu, F.; Wang, M.; Wang, J.; Tian, S. Rapid Inversion of Heavy Metal Concentration in Karst Grain Producing Areas Based on Hyperspectral Bands Associated with Soil Components. Microchem. J. 2019, 148, 404–411. [Google Scholar] [CrossRef]
  35. Rossel, R.A.V.; Taylor, H.J.; McBratney, A.B. Multivariate Calibration of Hyperspectral γ-Ray Energy Spectra for Proximal Soil Sensing. Eur. J. Soil Sci. 2007, 58, 343–353. [Google Scholar] [CrossRef]
  36. Daud, M.K.; Mei, L.; Azizullah, A.; Dawood, M.; Ali, I.; Mahmood, Q.; Ullah, W.; Jamil, M.; Zhu, S.J. Leaf-Based Physiological, Metabolic, and Ultrastructural Changes in Cultivated Cotton Cultivars under Cadmium Stress Mediated by Glutathione. Environ. Sci. Pollut. Res. 2016, 23, 15551–15564. [Google Scholar] [CrossRef]
  37. Bingham, F.T.; Page, A.L.; Mahler, R.J.; Ganje, T.J. Growth and Cadmium Accumulation of Plants Grown on a Soil Treated with a Cadmium-Enriched Sewage Sludge. J. Environ. Qual. 1975, 4, 207–211. [Google Scholar] [CrossRef]
  38. Chen, H.; Yuan, X.; Li, T.; Hu, S.; Ji, J.; Wang, C. Characteristics of Heavy Metal Transfer and Their Influencing Factors in Different Soil-Crop Systems of the Industrialization Region, China. Ecotoxicol. Environ. Saf. 2016, 126, 193–201. [Google Scholar] [CrossRef]
  39. Luo, K.; Liu, H.; Liu, Q.; Tu, Y.; Yu, E.; Xing, D. Cadmium Accumulation and Migration of 3 Peppers Varieties in Yellow and Limestone Soils under Geochemical Anomaly. Environ. Technol. 2022, 43, 10–20. [Google Scholar] [CrossRef]
  40. Ye, X.; Xiao, W.; Zhang, Y.; Zhao, S.; Wang, G.; Zhang, Q.; Wang, Q. Assessment of Heavy Metal Pollution in Vegetables and Relationships with Soil Heavy Metal Distribution in Zhejiang Province, China. Environ. Monit. Assess. 2015, 187, 378. [Google Scholar] [CrossRef]
  41. Ouzounidou, G.; Moustakas, M.; Eleftheriou, E.P. Physiological and Ultrastructural Effects of Cadmium on Wheat (Triticum Aestivum L.) Leaves. Arch. Environ. Contam. Toxicol. 1997, 32, 154–160. [Google Scholar] [CrossRef] [PubMed]
Figure 1. Study area and sampling point distribution diagram.
Sustainability 15 03508 g001
Figure 2. Flow chart of predicting cadmium content in the leaves of pepper and eggplant.
Sustainability 15 03508 g002
Figure 3. Original spectrogram (IPL: indoor spectrum of pepper leaves; OCP: outdoor canopy spectra of pepper; IEL: indoor spectrum of eggplant leaves; OLE: outdoor canopy spectra of eggplant).
Sustainability 15 03508 g003
Figure 4. Correlation coefficient between the Cd content and the leaf spectra of the pepper.
Sustainability 15 03508 g004
Figure 5. Correlation coefficient between Cd content and leaf spectrum of eggplant.
Sustainability 15 03508 g005
Figure 6. Scatterplot of spectral prediction of the Cd content in pepper leaves by different models (first derivative). (a) Prediction results of PLSR model; (b) Prediction results of SVMR model. * Indicates the significance reaches the 0.05 level; ** indicates the significance reaches the 0.01 level.
Sustainability 15 03508 g006
Figure 7. Scatterplot of spectral prediction of the Cd content in eggplant leaves by different models (first derivative). (a) Prediction results of PLSR model; (b) Prediction results of SVMR model. * Indicates the significance reaches the 0.05 level; ** indicates the significance reaches the 0.01 level.
Sustainability 15 03508 g007
Table 1. Statistical characteristics of soil physical and chemical properties in a field environment.
TypeNumberMinMaxMeanSDCV (%)KURTSKEW
As (mg/kg)501.392.251.750.2112.18−0.990.30
Pb (mg/kg)5016.1031.7020.243.1215.433.881.78
Cr (mg/kg)5027.5074.0040.489.0422.343.941.85
Cd (mg/kg)500.220.430.330.0412.18−0.02−0.12
Hg (mg/kg)500.040.060.050.006.701.150.82
SOM (g/kg)5031.3061.0044.808.1718.24−1.380.17
SD: standard deviation; CV: coefficient of variation; KURT: kurtosis; SKEW: skewness (pH < 7.5).
Table 2. Statistical characteristics of the Cd content in plants in the field.
TypeNumberMax (mg/kg)Min (mg/kg)Mean (mg/kg)EF
Pepper fruits180.0330.0190.0250.069
Pepper leaf180.1400.0090.0410.111
Eggplant fruits240.2400.0890.1320.436
Eggplant leaf250.3300.1400.2270.749
Table 3. Correlation analysis of the Cd contents in plants in the field.
Cd Content in Pepper LeavesCd Content in Eggplant Leaves
Cd content in fruits0.492 *0.199
* Indicates the significance reaches the 0.05 level.
Table 4. PLSR model of the Cd content in pepper leaves under different spectral transformation forms.
Model TypeSpectral Transformation FormModel Structure
PLSROriginal reflectance Y = 0.289 24.123 X 595 + 19.034 X 619 + 8.091 X 700
PLSRFirst derivative reflectance Y = 0.335 + 18.776 X 712 + 778.301 X 922 + 29.046 X 997 2244.798 X 1270
Table 5. Spectral prediction of Cd content in pepper leaves by different models.
Model TypeSpectral Transformation FormCalibration SetPrediction Set
Rc2RMSEc (mg/kg)RPDcRp2RMSEp (mg/kg)RPDp
PLSROriginal reflectance0.2770.03381.230.941 **0.01882.56
First derivative reflectance0.548 **0.02671.550.771 *0.02991.61
SVMROriginal reflectance0.988 **0.00725.760.1070.04271.13
First derivative reflectance0.546 **0.02691.540.897 **0.02641.82
* Indicates the significance reaches the 0.05 level; ** indicates the significance reaches the 0.01 level.
Table 6. PLSR model of the Cd content in eggplant leaves based on first derivative spectral transformation.
Model TypeSpectral Transformation FormModel Structure
PLSRFirst derivative reflectance Y = 0.224 + 1177.567 X 823 + 832.696 X 982 + 708.9 X 1280
Table 7. Spectral prediction of the Cd content in eggplant leaves by different models (first derivative).
Model TypeSpectral Transformation FormCalibration SetPrediction Set
Rc2RMSEc (mg/kg)RPDcRp2RMSEp (mg/kg)RPDp
PLSRFirst derivative reflectance0.533 **0.03571.510.608 *0.03101.60
SVMRFirst derivative reflectance0.834 **0.02182.470.726 **0.03321.49
* Indicates the significance reaches the 0.05 level; ** indicates the significance reaches the 0.01 level.
Disclaimer/Publisher’s Note: The statements, opinions and data contained in all publications are solely those of the individual author(s) and contributor(s) and not of MDPI and/or the editor(s). MDPI and/or the editor(s) disclaim responsibility for any injury to people or property resulting from any ideas, methods, instructions or products referred to in the content.

