
Risk Assessment and Spatial Distribution of Heavy Metals with an Emphasis on Antimony (Sb) in Urban Soil in Bojnourd, Iran

 ,
,  ,
, 
Abstract
:1. Introduction
2. Materials and Methods
2.1. Site Description and Sampling
2.2. Analytical Methods
2.3. HM Risk Assessment
2.3.1. Geo-Accumulation Index (Igeo)
2.3.2. Contamination Factor (CF)
2.3.3. Health Risk Assessment
Non-Carcinogenic and Carcinogenic Risk Assessment
2.4. Statistical Analysis
3. Results and Discussion
3.1. Descriptive Statistics of HMs in Soils

| Origin | Sb | Cd | Cr | Pb | As | Ni | Hg | Reference |
|---|---|---|---|---|---|---|---|---|
| World soils | - | 1.1 | 42 | 14 | 4.7 | 18 | - | CEPA [93] |
| Indian urban soils | - | - | 211.16 | 16.715 | 9.9 | 52.46 | - | Adimalla [7] |
| Dutch soil quality guidelines | 3 | 0.8 | 100 | 100 | 29 | 35 | 0.3 | VROM [35] |
| Canadian soil quality | - | 22 | 87 | 87 | 12 | 50 | - | CEPA [93] |
| Chinese urban soils | - | 1.8 | 122 | 187 | 14 | 42 | 0.26 | Pecina et al. [48] |
| African urban soils | - | 5 | 250 | 150 | - | 100 | - | Yabe et al. [94] |
| Soil geochemical background | 0.45 | 0.33 | 30.07 | 3.45 | 8.59 | 33.45 | 0.068 | This study |
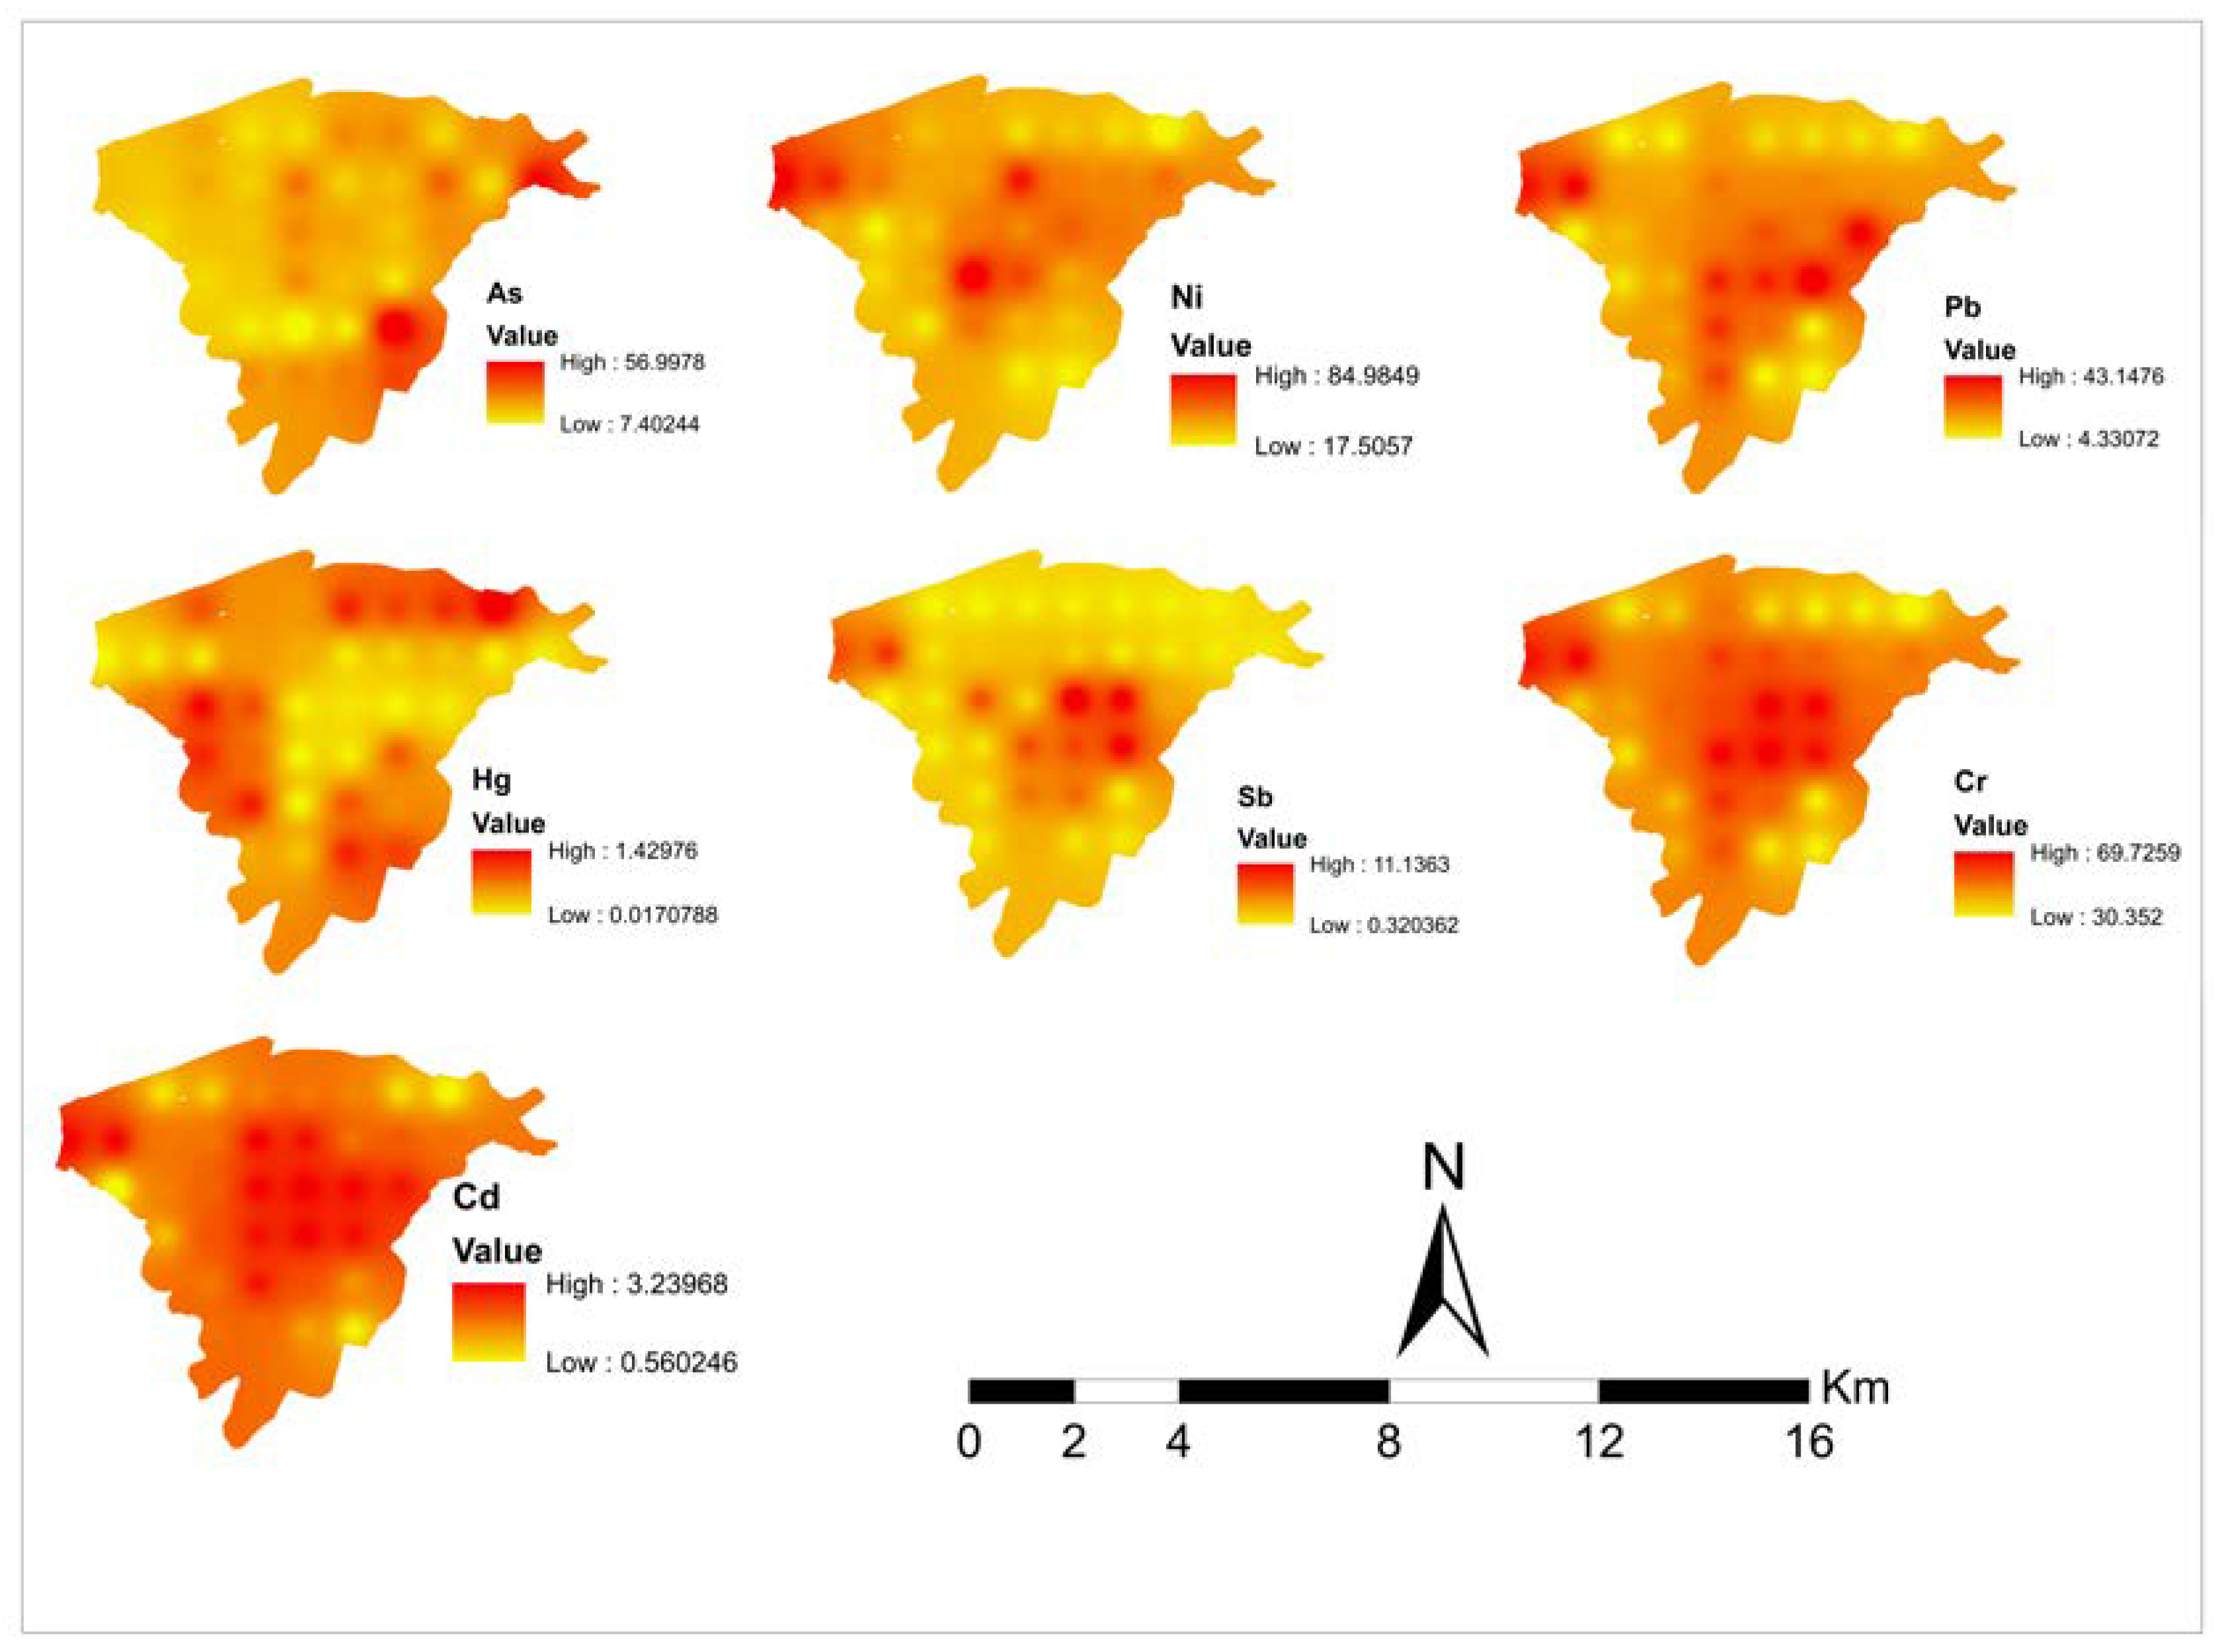
3.2. Spatial Distribution of HMs
3.3. Ecological Risk Assessment
3.4. Multivariate Analysis of HMs in Soil
3.5. Health Risk Assessment of HMs
4. Conclusions
Supplementary Materials
Author Contributions
Funding
Institutional Review Board Statement
Informed Consent Statement
Data Availability Statement
Conflicts of Interest
References
- Baltas, H.; Şirin, M.; Gökbayrak, E.; Ozcelik, A.E. A case study on pollution and a human health risk assessment of heavy metals in agricultural soils around Sinop province, Turkey. Chemosphere 2019, 241, 125015. [Google Scholar] [CrossRef] [PubMed]
- Jiang, H.; Cai, L.; Wen, H.; Hu, G.; Chen, L.; Luo, J. An integrated approach to quantifying ecological and human health risks from different sources of soil heavy metals. Sci. Total Environ. 2019, 701, 134466. [Google Scholar] [CrossRef]
- Shojaee Barjoee, S.; Malverdi, E.; Kouhkan, M.; Alipourfard, I.; Rouhani, A.; Farokhi, H.; Khaledi, A.A. Health assessment of industrial ecosystems of Isfahan (Iran) using phytomonitoring: Chemometric, micromorphology, phytoremediation, air pollution tolerance and anticipated performance indices. Urban Clim. 2023, 48, 101394. [Google Scholar] [CrossRef]
- Gu, Y.; Gao, Y.; Lin, Q. Contamination, bioaccessibility and human health risk of heavy metals in exposed-lawn soils from 28 urban parks in southern China’s largest city, Guangzhou. Appl. Geochem. 2016, 67, 52–58. [Google Scholar] [CrossRef]
- Lu, X.; Wang, L.; Li, L.; Lei, K.; Huang, L.; Kang, D. Multivariate statistical analysis of heavy metals in street dust of Baoji, NW China. J. Hazard. Mater. 2010, 173, 744–749. [Google Scholar] [CrossRef]
- Różański, S.Ł.; Castejón, J.M.P.; McGahan, D.G. Child risk assessment of selected metal(loid)s from urban soils using in vitro UBM procedure. Ecol. Indic. 2021, 127, 107726, ISSN 1470-160X. [Google Scholar] [CrossRef]
- Adimalla, N. Heavy metals pollution assessment and its associated human health risk evaluation of urban soils from Indian cities: A review. Environ. Geochem. Health 2019, 42, 173–190. [Google Scholar] [CrossRef]
- Han, X.; Lu, X.; Zhang, Q.; Wuyuntana Hai, Q.; Pan, H. Grain-size distribution and contamination characteristics of heavy metal in street dust of Baotou, China. Environ. Earth Sci. 2016, 75, 1–10. [Google Scholar] [CrossRef]
- Dąbkowska-Naskręt, H.; Różański, S.; Bartkowiak, A. Forms and mobility of trace elements in soils of park areas from the city of Bydgoszcz, north Poland. Soil Sci. Annu. 2016, 67, 73. [Google Scholar] [CrossRef]
- Li, Z.; Ma, Z.; Kuijp, T.; Yuan, Z.; Huang, L. A review of soil heavy metal pollution from mines in China: Pollution and health risk assessment. Sci. Total. Environ. 2014, 468–469, 843–853. [Google Scholar] [CrossRef]
- Hu, B.; Shao, S.; Ni, H.; Fu, Z.; Hu, L.; Zhou, Y.; Min, X.; She, S.; Chen, S.; Huang, M.; et al. Current status, spatial features, health risks, and potential driving factors of soil heavy metal pollution in China at province level. Environ. Pollut. 2020, 266, 114961. [Google Scholar] [CrossRef]
- Baruah, S.; Ahmed, I.; Das, B.; Ingtipi, B.; Boruah, H.; Gupta, S.; Nema, A.; Chabukdhara, M. Heavy metal(loid)s contamination and health risk assessment of soil-rice system in rural and peri-urban areas of lower Brahmaputra valley, Northeast India. Chemosphere 2020, 266, 129150. [Google Scholar] [CrossRef]
- Gujre, N.; Mitra, S.; Soni, A.; Agnihotri, R.; Rangan, L.; Rene, E.; Sharma, M. Speciation, contamination, ecological and human health risks assessment of heavy metals in soils dumped with municipal solid wastes. Chemosphere 2021, 262, 128013. [Google Scholar] [CrossRef]
- Liu, P.; Hu, W.; Tian, K.; Huang, B.; Zhao, Y.; Wang, X.; Zhou, Y.; Shi, B.; Kwon, B.; Ryu, J.; et al. Accumulation and ecological risk of heavy metals in soils along the coastal areas of the Bohai Sea and the Yellow Sea: A comparative study of China and South Korea. Environ. Int. 2020, 137, 105519. [Google Scholar] [CrossRef]
- Sun, J.; Zhao, M.; Huang, J.; Liu, Y.; Wu, Y.; Cai, B.; Han, Z.; Huang, H.; Fan, Z. Determination of priority control factors for the management of soil trace metal (loid)s based on source-oriented health risk assessment. J. Hazard. Mater. 2021, 423, 127116. [Google Scholar] [CrossRef]
- Yang, S.; Sun, L.; Sun, Y.; Song, K.; Qin, Q.; Zhu, Z.; Xue, Y. Towards an integrated health risk assessment framework of soil heavy metals pollution: Theoretical basis, conceptual model, and perspectives. Environ. Pollut. 2023, 316, 120596. [Google Scholar] [CrossRef]
- Świdwa-Urbańska, J.; Batlle-Sales, J. Data quality oriented procedure, for detailed mapping of heavy metals in urban topsoil as an approach to human health risk assessment. J. Environ. Manag. 2021, 295, 113019. [Google Scholar] [CrossRef]
- Liang, J.; Liu, Z.; Tian, Y.; Shi, H.; Fei, Y.; Qi, J.; Mo, L. Research on health risk assessment of heavy metals in soil based on multi-factor source apportionment: A case study in Guangdong Province, China. Sci. Total Environ. 2023, 858, 159991. [Google Scholar] [CrossRef]
- Ajani, M.; Maleka, P.P.; Penabei, S.; Usman, I.T. Health risk assessment of heavy metals concentration from soil; a case study of the Mayo-Dallah in Southern area of Chad. J. Radiat. Res. Appl. Sci. 2022, 15, 130–138. [Google Scholar] [CrossRef]
- Kumar, S.; Prasad, S.; Shrivastava, M.; Bhatia, A.; Islam, S.; Yadav, K.K.; Kharia, S.K.; Dass, A.; Gupta, N.; Yadav, S.; et al. Appraisal of probabilistic levels of toxic metals and health risk in cultivated and marketed vegetables in urban and peri-urban areas of Delhi, India. Environ. Toxicol. Pharmacol. 2022, 92, 103863. [Google Scholar] [CrossRef]
- Yüksel, B.; Ustaoğlu, F.; Tokatlı, C.; Islam, M.S. Ecotoxicological risk assessment for sediments of Çavuşlu stream in Giresun, Turkey: Association between garbage disposal facility and metallic accumulation. Environ. Sci. Pollut. Res. 2022, 29, 17223–17240. [Google Scholar] [CrossRef]
- Penteado, J.; Brum, R.D.; Ramires, P.F.; Garcia, E.M.; Santos, M.D.; Júnior, F.M. Health risk assessment in urban parks soils contaminated by metals, Rio Grande city (Brazil) case study. Ecotoxicol. Environ. Saf. 2021, 208, 111737. [Google Scholar] [CrossRef] [PubMed]
- Pan, C.; Yu, F.; Tao, X.; Guo, J.; Yu, Y. Contamination, spatial distribution and source analysis of heavy metals in surface soil of Anhui Chaohu Economic Development Zone, China. Sustainability 2020, 12, 8117. [Google Scholar] [CrossRef]
- Xu, X.; Zhang, X.; Peng, Y.; Li, R.; Liu, C.; Luo, X.; Zhao, Y. Spatial distribution and source apportionment of agricultural soil heavy metals in a rapidly developing area in East China. Bull. Environ. Contam. Tox. 2021, 106, 33–39. [Google Scholar] [CrossRef] [PubMed]
- Lyla, P.S.; Manokaran, S.; Ajmalkhan, S.; Ansari, K.G.; Raja, S.; Reshi, O.R. Spatial distribution, ecological risk assessment, control factors, and sources of heavy metal pollution in the shelf surface sediments of the southwest Bay of Bengal, India. Reg. Stud. Mar. Sci. 2022, 56, 102705. [Google Scholar] [CrossRef]
- Xiang, Q.; Yu, H.; Chu, H.; Hu, M.; Xu, T.; Xu, X.; He, Z. The potential ecological risk assessment of soil heavy metals using self-organizing map. Sci. Total Environ. 2022, 843, 156978. [Google Scholar] [CrossRef]
- Saha, A.; Gupta, B.S.; Patidar, S.; Martínez-Villegas, N. Spatial distribution based on optimal interpolation techniques and assessment of contamination risk for toxic metals in the surface soil. J. S. Am. Earth Sci. 2022, 115, 103763. [Google Scholar] [CrossRef]
- Zheng, F.; Guo, X.; Tang, M.; Zhu, D.; Wang, H.; Yang, X.; Chen, B. Variation in pollution status, sources, and risks of soil heavy metals in regions with different levels of urbanization. Sci. Total Environ. 2023, 866, 161355. [Google Scholar] [CrossRef] [PubMed]
- Hoshyari, E.; Hassanzadeh, N.; Keshavarzi, B.; Jaafarzadeh, N.; Rezaei, M. Spatial distribution, source apportionment, and ecological risk assessment of elements (PTEs, REEs, and ENs) in the surface soil of shiraz city (Iran) under different land-use types. Chemosphere 2023, 311 Pt 1, 137045. [Google Scholar] [CrossRef]
- Wan, F.; Zhong, G.; Wu, S.; Jiang, X.; Liao, J.; Zhang, X.; Zhang, H.; Mehmood, K.; Tang, Z.; Hu, L. Arsenic and antimony co-induced nephrotoxicity via autophagy and pyroptosis through ROS-mediated pathway in vivo and in vitro. Ecotoxicol. Environ. Saf. 2021, 221, 112442. [Google Scholar] [CrossRef]
- Lewińska, K.; Karczewska, A. Antimony in soils of SW Poland—An overview of potentially enriched sites. Environ. Monit. Assess. 2019, 191, 70. [Google Scholar] [CrossRef] [PubMed]
- Johnson, C.A. Antimony, a challenge for environmental scientists. In The L.A. Colding Lecture Series in Environmental Science and Technology, Abstract; Technical University of Denmark: Lyngby, Denmark, 2008. [Google Scholar]
- Emsley, J. Nature’s Building Blocks. In An A–Z Guide to the Elements; Oxford University Press: Oxford, UK, 2001. [Google Scholar]
- Shotyk, W.; Krachler, M.; Chen, B. Anthropogenic impacts on the biogeochemistry and cycling of antimony. In Metal Ions in Biological Systems 44 (Biogeochemistry, Availability and Transport of Metals in the Environment); Sigel, H., Sigel, R., Eds.; Marcel Dekker: Heidelberg, Germany, 2005; pp. 171–203, Chapter 7. [Google Scholar]
- VROM. Circular on Target Values and Intervention Values for Soil Remediation. In Dutch Ministry of Housing Spatial Planning and Environment (VROM); Annex, A., Ed.; VROM: The Hague, The Netherlands, 2000. [Google Scholar]
- CCME. Canadian Soil Quality Guidelines for the Protection of Environmental and Human Health: Summary Table. In Canadian Council of Ministers of the Environment; CCME: Winnipeg, MB, Canada, 1999. [Google Scholar]
- Arditsoglou, A.; Samara, C. Levels of total suspended particulate matter and major trace elements in Kosovo: A source identification and appointment study. Chemosphere 2005, 59, 669–678. [Google Scholar] [CrossRef] [PubMed]
- Weckwerth, G. Verification of traffic emitted aerosol components in the ambient air of Cologne (Germany). Atmos. Environ. 2001, 35, 5525–5536. [Google Scholar] [CrossRef]
- Gomez, D.; Fernanda Giné, M.; Claudia Sánchez Bellato, A.; Smichowski, P. Antimony: A traffic-related element in the atmosphere of Buenos Aires, Argentina. J. Environ. Monit. JEM 2005, 7, 1162–1168. [Google Scholar] [CrossRef]
- Iijima, A.; Sato, K.; Fujitani, Y.; Fujimori, E.; Saito, Y.; Tanabe, K.; Ohara, T.; Kozawa, K.; Furuta, N. Clarification of the predominant emission sources of antimony in airborne particulate matter and estimation of their effects on the atmosphere in Japan. Environ. Chem. 2009, 6, 122–132. [Google Scholar] [CrossRef]
- Földi, C.; Sauermann, S.; Dohrmann, R.; Mansfeldt, T. Traffic-related distribution of antimony in roadside soils. Environ. Pollut. 2018, 237, 704–712. [Google Scholar] [CrossRef]
- Li, G.; Sun, G.; Ren, Y.; Luo, X.; Zhu, Y. Urban soil and human health: A review. Eur. J. Soil Sci. 2018, 69, 196–215. [Google Scholar] [CrossRef]
- Jahandari, A.; Abbasnejad, A.; Jamasb, R. Concentration, likely sources, and ecological risk assessment of potentially toxic elements in urban soils of Shiraz City, SW Iran: A preliminary assessment. Arab. J. Geosci. 2020, 13, 936. [Google Scholar] [CrossRef]
- Bineshpour, M.; Payandeh, K.; Nazarpour, A.; Sabzalipour, S. Status, source, human health risk assessment of potential toxic elements (PTEs), and Pb isotope characteristics in urban surface soil, case study: Arak city, Iran. Environ. Geochem. Health 2021, 43, 4939–4958. [Google Scholar] [CrossRef] [PubMed]
- Sun, L.; Guo, D.; Liu, K.; Meng, H.; Zheng, Y.; Yuan, F.; Zhu, G. Levels, sources, and spatial distribution of heavy metals in soils from a typical coal industrial city of Tangshan, China. Catena 2019, 175, 101–109. [Google Scholar] [CrossRef]
- Han, Q.; Wang, M.; Cao, J.; Gui, C.; Liu, Y.; He, X.; He, Y.; Liu, Y. Health risk assessment and bioaccessibilities of heavy metals for children in soil and dust from urban parks and schools of Jiaozuo, China. Ecotoxicol. Environ. Saf. 2020, 191, 110157. [Google Scholar] [CrossRef] [PubMed]
- Morera-Gómez, Y.; Alonso-Hernández, C.; Armas-Camejo, A.; Viera-Ribot, O.; Morales, M.C.; Alejo, D.; Elustondo, D.; Lasheras, E.; Santamaría, J. Pollution monitoring in two urban areas of Cuba by using Tillandsia recurvata (L.) L. and top soil samples: Spatial distribution and sources. Ecol. Indic. 2021, 126, 107667. [Google Scholar] [CrossRef]
- Pecina, V.; Brtnický, M.; Baltazár, T.; Juřička, D.; Kynický, J.; Galiová, M.V. Human health and ecological risk assessment of trace elements in urban soils of 101 cities in China: A meta-analysis. Chemosphere 2021, 267, 129215. [Google Scholar] [CrossRef] [PubMed]
- Wu, D.; Yu, X.; Lai, M.; Feng, J.; Dong, X.; Peng, W.; Su, S.; Zhang, X.; Wan, L.; Jacobs, D.F.; et al. Diversified effects of co-planting landscape plants on heavy metals pollution remediation in urban soil amended with sewage sludge. J. Hazard. Mater. 2021, 403, 123855. [Google Scholar] [CrossRef]
- Yuan, X.; Xue, N.; Han, Z. A meta-analysis of heavy metals pollution in farmland and urban soils in China over the past 20 years. J. Environ. Sci. 2021, 101, 217–226. [Google Scholar] [CrossRef]
- Thestorf, K.; Makki, M. Pseudo-total antimony content in topsoils of the Berlin Metropolitan Area. J. Soils Sediments 2020, 21, 2102–2117. [Google Scholar] [CrossRef]
- Tashakor, M.; Modabberi, S.; Argyraki, A. Assessing the contamination level, sources and risk of potentially toxic elements in urban soil and dust of Iranian cities using secondary data of published literature. Environ. Geochem. Health 2022, 44, 645–675. [Google Scholar] [CrossRef]
- Soltani-Gerdefaramarzi, S.; Ghasemi, M.; Gheysouri, M. Pollution, human health risk assessment and spatial distribution of toxic metals in urban soil of Yazd City, Iran. Environ. Geochem. Health 2021, 43, 3469–3484. [Google Scholar] [CrossRef]
- Vaziri, A.; Nazarpour, A.; Ghanavati, N.; Babainejad, T.; Watts, M.J. An integrated approach for spatial distribution of potentially toxic elements (Cu, Pb and Zn) in topsoil. Sci. Rep. 2021, 11, 7806. [Google Scholar] [CrossRef] [PubMed]
- Dehghani, S.; Moore, F.; Keshavarzi, B.; Hale, B. Health risk implications of potentially toxic metals in street dust and surface soil of Tehran, Iran. Ecotoxicol. Environ. Saf. 2017, 136, 92–103. [Google Scholar] [CrossRef]
- Piazzetta, K.D.; Ramsdorf, W.; Maranho, L. Use of airplant Tillandsia recurvata L.; Bromeliaceae, as biomonitor of urban air pollution. Aerobiologia 2018, 35, 125–137. [Google Scholar] [CrossRef]
- Ashraf, M.A.; Maah, M.J.; Yusoff, I. Soil contamination, risk assessment and remediation. Environ. Risk Sssessment Soil Contam. 2014, 1, 3–56. [Google Scholar] [CrossRef]
- Yousefi, M.; Ashrafi, A. Urban growth modeling in Bojnurd by using remote sensing data (Based on neural network and Markov modeling changes). J. Reg. Plan. 2016, 6, 179–192. (In Persian) [Google Scholar]
- Orgiazzi, A.; Ballabio, C.; Panagos, P.; Jones, A.; Fern’andez-Ugalde, O. LUCAS Soil, the largest expandable soil dataset for Europe: A review. Eur. J. Soil Sci. 2018, 69, 140–153. [Google Scholar] [CrossRef]
- IAEA (International Atomic Energy Agency). Soil Sampling for Environmental Contaminants; IAEATECDOC-1415; IAEA: Vienna, Austria, 2004. [Google Scholar]
- Man, Y.B.; Sun, X.L.; Zhao, Y.G.; Lopez, B.N.; Chung, S.S.; Wu, S.C.; Cheung, K.C.; Wong, M.H. Health risk assessment of abandoned agricultural soils based on heavy metal contents in Hong Kong, the world’s most populated city. Environ. Int. 2010, 36, 570–576. [Google Scholar] [CrossRef]
- Tanner, P.A.; Ma, H.L.; Yu, P.K. Fingerprinting metals in urban street dust of Beijing, Shanghai, and Hong Kong. Environ. Sci. Technol. 2008, 42, 7111–7117. [Google Scholar] [CrossRef] [PubMed]
- USEPA. Exposure Factors Handbook, Volume 1: General Factors; U.S. Environmental Protection Agency, Office of Research and Development: Washington, DC, USA, 1997.
- Soltani, N.; Keshavarzi, B.; Moore, F.; Tavakol, T.; Lahijanzadeh, A.R.; Jaafarzadeh, N.; Kermani, M. Ecological and human health hazards of heavy metals and polycyclic aromatic hydrocarbons (PAHs) in road dust of Isfahan metropolis, Iran. Sci. Total Environ. 2015, 505, 712–723. [Google Scholar] [CrossRef]
- Chen, H.; Teng, Y.; Lu, S.; Wang, Y.; Wang, J. Contamination features and health risk of soil heavy metals in China. Sci. Total Environ. 2015, 512, 143–153. [Google Scholar] [CrossRef]
- Ryan, J.; Estefan, G.; Rashid, A. Soil and Plant Analysis Laboratory Manual; ICARDA: Beirut, Lebanon, 2001. [Google Scholar]
- Rouhani, A.; Bradák, B.; Makki, M.; Ashtiani, B.; Hejcman, M. Ecological risk assessment and human health risk exposure of heavy metal pollution in the soil around an open landfill site in a developing country (Khesht, Iran). Arab. J. Geosci. 2022, 15, 1523. [Google Scholar] [CrossRef]
- Muller, G. Schwermetalle in den Sedimenten des Rheins-Veränderungen seit 1971. Umschau 1969, 79, 778–783. [Google Scholar]
- Håkanson, L. An ecological risk index for aquatic pollution control. A sedimentological approach. Water Res. 1980, 14, 975–1001. [Google Scholar] [CrossRef]
- Rouhani, A.; Shahivand, R. Potential ecological risk assessment of heavy metals in archaeology on an example of the Tappe Rivi (Iran). SN Appl. Sci. 2020, 2, 1–11. [Google Scholar] [CrossRef]
- USEPA. Risk Assessment Guidance for Superfund. Volume I. Human Health Evaluation Manual (Part A); EPA/540/1-89/002; US Environmental Protection Agency: Washington, DC, USA, 1989.
- Rouhani, A.; Azimzadeh, H.; Sotoudeh, A.; Ehdaei, A. Health Risk Assessment of Heavy Metals in Archaeological Soils of Tappe Rivi Impacted by Ancient Anthropogenic Activity. Chem. Africa 2022, 5, 1751–1764. [Google Scholar] [CrossRef]
- USEPA. Risk Assessment Guidance for Superfund: Volume III—Part A, Process for Conducting Probabilistic Risk Assessment; EPA 540-R-02-002; US Environmental Protection Agency: Washington, DC, USA, 2001.
- USEPA. Regional Screening Levels (RSLs)—Generic Tables (May 2016). 2016. Available online: https://19january2017snapshot.epa.gov/risk/regional-screening-levels-rsls-generic-tables-may-2016_.html (accessed on 25 May 2020).
- Pan, L.; Wang, Y.Y.; Ma, J.; Hu, Y.; Su, B.; Fang, G.; Wang, L.; Xiang, B. A review of heavy metal pollution levels and health risk assessment of urban soils in Chinese cities. Environ. Sci. Pollut. Res. 2017, 25, 1055–1069. [Google Scholar] [CrossRef]
- Kusin, F.M.; Azani, N.F.; Hasan, S.N.; Sulong, N.A. Distribution of heavy metals and metalloid in surface sediments of heavily-mined area for bauxite ore in Pengerang, Malaysia and associated risk assessment. Catena 2018, 165, 454–464. [Google Scholar] [CrossRef]
- Konstantinova, E.; Minkina, T.M.; Sushkova, S.; Konstantinov, A.O.; Rajput, V.D.; Sherstnev, A.K. Urban soil geochemistry of an intensively developing Siberian city: A case study of Tyumen, Russia. J. Environ. Manag. 2019, 239, 366–375. [Google Scholar] [CrossRef]
- Utermann, J.; Fuchs, M.; Düwel, O. Flächenrepräsentative Hintergrundwerte für Arsen, Antimon, Beryllium, Molybdän, Kobalt, Selen, Thallium, Uran und Vanadium in Böden Deutschlands aus lönderübergreifender Sicht; Bundesanstalt für Geowissenschaften und Rohstoffe: Hannover, Germany, 2008. [Google Scholar]
- Wang, H.; Lu, S. Spatial distribution, source identification and affecting factors of heavy metals contamination in urban–suburban soils of Lishui city, China. Environ. Earth Sci. 2011, 64, 1921–1929. [Google Scholar] [CrossRef]
- Yan, G.; Mao, L.; Liu, S.; Mao, Y.; Ye, H.; Huang, T.; Li, F.; Chen, L. Enrichment and sources of trace metals in roadside soils in Shanghai, China: A case study of two urban/rural roads. Sci. Total Environ. 2018, 631–632, 942–950. [Google Scholar] [CrossRef]
- Kabata-Pendias, A. Trace Elements in Soils and Plants, 3rd ed.; CRC Press: Boca Raton, FL, USA, 2000. [Google Scholar]
- Okoye, E.A.; Ezejiofor, A.N.; Nwaogazie, I.L.; Frazzoli, C.; Orisakwe, O.E. Heavy Metals and Arsenic in Soil and Vegetation of Niger Delta, Nigeria: Ecological Risk Assessment. Case Stud. Chem. Environ. Eng 2022, 6, 100222. [Google Scholar] [CrossRef]
- Reimann, C.; Fabian, K. Quantifying diffuse contamination: Comparing silver and mercury in organogenic and minerogenic soil. Sci. Total Environ. 2022, 832, 155065. [Google Scholar] [CrossRef]
- Zhang, D.; Lee, D.J.; Pan, X. Potentially harmful metals and metalloids in urban street dusts of Urumqi City: Comparison with Taipei City. J. Taiwan Instit. Chem. Eng. 2014, 45, 2447–2450. [Google Scholar] [CrossRef]
- Hjortenkrans, D.S.; Bergbäck, B.G.; Häggerud, A.V. New Metal Emission Patterns in Road Traffic Environments. Environ. Monit. Assess. 2006, 117, 85–98. [Google Scholar] [CrossRef] [PubMed]
- von Uexküll, O.; Skerfving, S.; Doyle, R.; Braungart, M. Antimony in brake pads—A carcinogenic component? J. Clean. Prod. 2005, 13, 19–31. [Google Scholar] [CrossRef]
- Iijima, A.; Sato, K.; Yano, K.; Kato, M.; Kozawa, K.; Furuta, N. Emission factor for antimony in brake abrasion dusts as one of the major atmospheric antimony sources. Environ. Sci. Technol. 2008, 42, 2937–2942. [Google Scholar] [CrossRef] [PubMed]
- Duong, T.T.; Lee, B. Determining contamination level of heavy metals in road dust from busy traffic areas with different characteristics. J. Environ. Manag. 2011, 92, 554–562. [Google Scholar] [CrossRef]
- Sezgin, N.; Ozcan, H.K.; Demir, G.; Nemlioglu, S.; Bayat, C. Determination of heavy metal concentrations in street dusts in Istanbul E-5 highway. Environ. Int. 2004, 29, 979–985. [Google Scholar] [CrossRef]
- Al-Khashman, O.A. Determination of metal accumulation in deposited street dusts in Amman. Jordan Environ. Geochem. Health 2007, 29, 1–10. [Google Scholar] [CrossRef]
- Raghunath, R.; Tripathi, R.M.; Kumar, A.; Sathe, A.P.; Khandekar, R.N.; Nambi, K.S. Assessment of Pb, Cd, Cu, and Zn exposures of 6- to 10-year-old children in Mumbai. Environ. Res. 1999, 80, 215–221. [Google Scholar] [CrossRef]
- Guney, M.; Onay, T.T.; Copty, N.K. Impact of overland traffic on heavy metal levels in highway dust and soils of Istanbul, Turkey. Environ. Monit. Assess. 2010, 164, 101–110. [Google Scholar] [CrossRef]
- CEPA. Canadian Soil Quality Guidelines for the Protection of Environmental and Human Health; CEPA: Washington, DC, USA, 2007. [Google Scholar]
- Yabe, J.; Ishizuka, M.; Umemura, T. Current levels of heavy metal pollution in Africa. J. Vet. Med. Sci. 2010, 72, 1257–1263. [Google Scholar] [CrossRef]
- Simon, E.; Vidic, A.; Braun, M.; Fábián, I.; Tóthmérész, B. Trace element concentrations in soils along urbanization gradients in the city of Wien, Austria. Environ. Sci. Pollut. Res. 2012, 20, 917–924. [Google Scholar] [CrossRef]
- Imperato, M.; Adamo, P.; Naimo, D.; Arienzo, M.M.; Stanzione, D.; Violante, P. Spatial distribution of heavy metals in urban soils of Naples city (Italy). Environ. Pollut. 2003, 124, 247–256. [Google Scholar] [CrossRef] [PubMed]
- Wei, B.; Yang, L. A review of heavy metal contaminations in urban soils, urban road dusts and agricultural soils from China. Microchem. J. 2010, 94, 99–107. [Google Scholar] [CrossRef]
- Luo, X.; Ding, J.; Xu, B.; Wang, Y.; Li, H.; Yu, S. Incorporating bioaccessibility into human health risk assessments of heavy metals in urban park soils. Sci. Total Environ. 2011, 424, 88–96. [Google Scholar] [CrossRef] [PubMed]
- Li, S.; Yang, L.; Chen, L.; Zhao, F.; Sun, L. Spatial distribution of heavy metal concentrations in peri-urban soils in eastern China. Environ. Sci. Pollut. Res. 2018, 26, 1615–1627. [Google Scholar] [CrossRef]
- Wang, J.; Li, S.; Cui, X.; Li, H.; Qian, X.; Wang, C.; Sun, Y. Bioaccessibility, sources and health risk assessment of trace metals in urban park dust in nanjing, southeast China. Ecotoxicol. Environ. Saf. 2016, 128, 161–170. [Google Scholar] [CrossRef] [PubMed]
- Said, I.; Salman, S.A.E.-R.; Samy, Y.; Awad, S.A.; Melegy, A.; Hursthouse, A.S. Environmental factors controlling potentially toxic element behaviour in urban soils, El Tebbin, Egypt. Environ. Monit. Assess. 2019, 191, 267. [Google Scholar] [CrossRef]
- Pobi, K.K.; Nayek, S.; Gope, M.; Rai, A.K.; Saha, R. Sources Evaluation, Ecological and Health Risk Assessment of Potential Toxic Metals (PTMs) in Surface Soils of an Industrial Area. Environ. Geochem. Health India 2020, 42, 4159–4180. [Google Scholar] [CrossRef]
- Fei, X.; Christakos, G.; Lou, Z.; Xiao, R.; Lv, X.; Ren, Z. Assessment and source apportionment of toxic metal in soils using integrated positive matrix factorization and Bayesian maximum entropy: A case study in Z county, southeastern China. Ecol. Indic. 2022, 145, 109647. [Google Scholar] [CrossRef]
- Shrivastava, A.; Barla, A.; Majumdar, A.; Singh, S.; Bose, S. Arsenic mitigation in rice grain loading via alternative irrigation by proposed water management practices. Chemosphere 2020, 238, 124988. [Google Scholar] [CrossRef]
- Majumdar, A.; Upadhyay, M.K.; Ojha, M.; Afsal, F.; Giri, B.; Srivastava, S.; Bose, S. Enhanced phytoremediation of Metal (loid) s via spiked ZVI nanoparticles: An urban clean-up strategy with ornamental plants. Chemosphere 2022, 288, 132588. [Google Scholar] [CrossRef]
- Zhang, B.; Jia, T.; Peng, S.; Yu, X.; She, D. Spatial distribution, source identification, and risk assessment of heavy metals in the cultivated soil of the Qinghai–Tibet Plateau region: Case study on Huzhu County. Glob. Ecol. Conserv. 2022, 35, e02073. [Google Scholar] [CrossRef]
- Jadoon, S.; Muhammad, S.; Hilal, Z.; Ali, M.J.; Khan, S.; Khattak, N.U. Spatial distribution of potentially toxic elements in urban soils of Abbottabad city, (N Pakistan): Evaluation for potential risk. Microchem. J. 2020, 153, 104489. [Google Scholar] [CrossRef]
- Chen, H.; Teng, Y.; Lu, S.; Wang, Y.; Wu, J.; Wang, J. Source apportionment and health risk assessment of trace metals in surface soils of Beijing metropolitan, China. Chemosphere 2016, 144, 1002–1011. [Google Scholar] [CrossRef] [PubMed]
- Tyagi, N.; Upadhyay, M.K.; Majumdar, A.; Pathak, S.K.; Giri, B.; Jaiswal, M.K.; Srivastava, S. An assessment of various potentially toxic elements and associated health risks in agricultural soil along the middle Gangetic basin, India. Chemosphere 2022, 300, 134433. [Google Scholar] [CrossRef]
- Li, F.; Yang, H.; Ayyamperumal, R.; Liu, Y. Pollution, sources, and human health risk assessment of heavy metals in urban areas around industrialization and urbanization-Northwest China. Chemosphere 2022, 308, 136396. [Google Scholar] [CrossRef] [PubMed]
- Huang, Y.; Zhang, S.; Chen, Y.; Wang, L.; Long, Z.; Hughes, S.S.; Ni, S.; Cheng, X.; Wang, J.; Li, T.; et al. Tracing Pb and Possible Correlated Cd Contamination in Soils by Using Lead Isotopic Compositions. J. Hazard. Mater. 2019, 385, 121528. [Google Scholar] [CrossRef] [PubMed]
- Wu, W.; Wu, P.; Yang, F.; Sun, D.; Zhang, D.X.; Zhou, Y.K. Assessment of heavy metal pollution and human health risks in urban soils around an electronics manufacturing facility. Sci. Total Environ. 2018, 630, 53–61. [Google Scholar] [CrossRef] [PubMed]
- Ghani, J.; Nawab, J.; Faiq, M.E.; Ullah, S.; Alam, A.; Ahmad, I.; Ali, S.W.; Khan, S.; Ahmad, I.; Muhammad, A.; et al. Multi-geostatistical analyses of the spatial distribution and source apportionment of potentially toxic elements in urban children’s park soils in Pakistan: A risk assessment study. Environ. Pollut. 2022, 311, 119961. [Google Scholar] [CrossRef]
- Shen, W.; Hu, Y.; Zhang, J.; Zhao, F.; Bian, P.; Liu, Y. Spatial distribution and human health risk assessment of soil heavy metals based on sequential Gaussian simulation and positive matrix factorization model: A case study in irrigation area of the Yellow River. Ecotoxicol. Environ. Saf. 2021, 225, 112752. [Google Scholar] [CrossRef]
- Ghanavati, N.; Nazarpour, A.; De Vivo, B. Ecological and human health risk assessment of toxic metals in street dusts and surface soils in Ahvaz Iran. Environ. Geochem. Health 2019, 41, 875–891. [Google Scholar] [CrossRef]
- Ihedioha, J.; Ukoha, P.; Ekere, N. Ecological and human health risk assessment of heavy metal contamination in soil of a municipal solid waste dump in Uyo Nigeria. Environ. Geochem. Health 2017, 39, 497–515. [Google Scholar] [CrossRef] [PubMed]
- Tongo, I.; Ogbeide, O.; Ezemonye, L. Human health risk assessment of polycyclic aromatic hydrocarbons (PAHs) in smoked fish species from markets in Southern Nigeria. Toxicol. Rep. 2017, 4, 55–61. [Google Scholar] [CrossRef] [PubMed]
- De Miguel, E.; Iribarren, I.; Chacón, E.; Ordóñez, A.; Charlesworth, S. Risk-based evaluation of the exposure of children to trace elements in playgrounds in Madrid (Spain). Chemosphere 2007, 66, 505–513. [Google Scholar] [CrossRef]
- Cao, S.; Duan, X.; Zhao, X.; Wang, B.; Ma, J.; Fan, D.; Sun, C.; He, B.; Wei, F.; Jiang, G. Health risk assessment of various metal(loid)s via multiple exposure pathways on children living near a typical lead-acid battery plant, China. Environ. Pollut. 2015, 200, 16–23. [Google Scholar] [CrossRef]
- Cheng, Z.; Chen, L.; Li, H.; Lin, J.; Yang, Z.; Yang, Y.; Xu, X.; Xian, J.; Shao, J.; Zhu, X. Characteristics and health risk assessment of heavy metals exposure via household dust from urban area in Chengdu, China. Sci. Total Environ. 2018, 619–620, 621–629. [Google Scholar] [CrossRef] [PubMed]
- Jiang, Y.; Chao, S.; Liu, J.; Yang, Y.; Chen, Y.; Zhang, A.; Cao, H. Source apportionment and health risk assessment of heavy metals in soil for a township in Jiangsu Province, China. Chemosphere 2017, 168, 1658–1668. [Google Scholar] [CrossRef]
- Timofeev, I.V.; Kosheleva, N.E.; Kasimov, N.S. Health risk assessment based on the contents of potentially toxic elements in urban soils of Darkhan, Mongolia. J. Environ. Manag. 2019, 242, 279–289. [Google Scholar] [CrossRef] [PubMed]
- USEPA. Supplemental Guidance for Developing Soil Screening Levels for Superfund Sites; US Environmental Protection Agency: Washington, DC, USA, 2001.
- USEPA. Supplemental Guidance for Developing Soil Screening Levels for Superfund Sites; US Environmental Protection Agency: Washington, DC, USA, 2002; Volume 106.
- USEPA. Integrated Risk Information System of the US Environmental Protection Agency; US Environmental Protection Agency: Washington, DC, USA, 2012.
- USEPA. Regional Screening Level (RSL) Resident Soil Table (TR=1E-06, HQ=1) May 718 2020 (Corrected); US Environmental Protection Agency: Washington, DC, USA, 2020. Available online: https://support.esdat.net/Environmental%20Standards/us/region_3_6_9/regional%20screening%20level%20(rsl)%20summary%20table%20(tr=1e-06,%20hq=1)%20may%202020%20(corrected).pdf (accessed on 9 October 2020).


| Land Use | Parameter | pH | Sb | Cd | Cr | Pb | As | Ni | Hg |
|---|---|---|---|---|---|---|---|---|---|
| Traffic areas | Minimum Value | 7.87 | 0.47 | 1.85 | 36.32 | 8.16 | 7.40 | 25.7 | 0.02 |
| Maximum Value | 8.20 | 11.14 | 3.24 | 69.73 | 43.15 | 30.90 | 85 | 1.06 | |
| Mean | 8.04 | 4.72 | 2.77 | 59.04 | 26.67 | 20.23 | 52.6 | 0.23 | |
| SD | 0.09 | 3.69 | 0.51 | 9.17 | 9.83 | 6.36 | 16.24 | 0.31 | |
| Residential areas | Minimum Value | 7.37 | 0.33 | 1.01 | 33.89 | 5.11 | 12.90 | 20.50 | 0.06 |
| Maximum Value | 7.76 | 6.24 | 3.11 | 56.93 | 22.89 | 33.75 | 49.1 | 1.20 | |
| Mean | 7.58 | 1.79 | 2.01 | 46.97 | 14.17 | 21.03 | 35.64 | 0.63 | |
| SD | 0.13 | 2.03 | 0.57 | 7.91 | 5.59 | 6.53 | 8.83 | 0.37 | |
| Suburb areas | Minimum Value | 7.36 | 0.32 | 0.56 | 30.35 | 4.33 | 13 | 17.50 | 0.07 |
| Maximum Value | 7.66 | 2.91 | 2.09 | 55.75 | 28.01 | 57 | 46 | 1.43 | |
| Mean | 7.54 | 0.92 | 1.45 | 39.42 | 10.03 | 29.36 | 30.81 | 0.75 | |
| SD | 0.09 | 0.69 | 0.58 | 7.51 | 7.58 | 13.64 | 9.53 | 0.40 |
| HMs | Geo-Accumulation (Igeo) | Contamination Factor (CF) | ||||
|---|---|---|---|---|---|---|
| TA | RA | SA | TA | RA | SA | |
| Pb | 2.49 | 1.74 | 1.2 | 10.49 | 3.98 | 2.1 |
| Cd | 2.46 | 1.96 | 1.42 | 7.73 | 4.11 | 2.91 |
| Cr | 0.37 | 0.037 | −0.22 | 8.4 | 6.1 | 4.39 |
| Sb | 2.14 | 0.76 | 0.21 | 1.97 | 1.57 | 1.32 |
| As | 0.65 | 0.71 | 1.19 | 2.35 | 2.45 | 3.41 |
| Ni | 0.07 | −0.50 | −0.70 | 1.57 | 1.1 | 0.92 |
| Hg | 1.17 | 2.63 | 2.88 | 3.38 | 9.26 | 11.03 |
| HM | Pb | Cd | Cr | Sb | As | Ni | Hg |
|---|---|---|---|---|---|---|---|
| Pb | 1 | 0.884 ** | 0.891 ** | 0.803 ** | −0.142 | 0.703 ** | −0.682 ** |
| Cd | 1 | 0.915 ** | 0.830 ** | −0.019 | 0.705 ** | −0.685 ** | |
| Cr | 1 | 0.837 ** | −0.221 | 0.737 ** | −0.722 ** | ||
| Sb | 1 | −0.072 | 0.509 ** | −0.520 ** | |||
| As | 1 | −0.077 | −0.013 | ||||
| Ni | 1 | −0.921 ** | |||||
| Hg | 1 |
| HMs | Land Type | Adult | Children | ||||||
|---|---|---|---|---|---|---|---|---|---|
| HQing | HQinh | HQdermal | HI | HQing | HQinh | HQdermal | HI | ||
| Sb | TA | 1.62 × 10⁻² | - | - | 1.62 × 10⁻² | 1.51 × 10⁻¹ | - | - | 1.51 × 10⁻¹ |
| RA | 6.13 × 10⁻³ | - | - | 6.13 × 10⁻³ | 5.72 × 10⁻² | - | - | 5.72 × 10⁻² | |
| SA | 3.15 × 10⁻³ | - | - | 3.15 × 10⁻³ | 2.94 × 10⁻² | - | - | 2.94 × 10⁻² | |
| Cd | TA | 3.8 × 10⁻³ | 7.49 × 10⁻⁶ | 1.55 × 10⁻³ | 5.32 × 10⁻³ | 3.54 × 10⁻² | 5.69 × 10⁻⁷ | 9.92 × 10⁻³ | 4.54 × 10⁻² |
| RA | 2.74 × 10⁻³ | 5.44 × 10⁻⁶ | 1.1 × 10⁻³ | 3.86 × 10⁻³ | 2.57 × 10⁻² | 4.13 × 10⁻⁷ | 7.2 × 10⁻³ | 3.29 × 10⁻² | |
| SA | 1.99 × 10⁻³ | 3.92 × 10⁻⁶ | 7.93 × 10⁻⁴ | 2.79 × 10⁻³ | 1.85 × 10⁻² | 2.98 × 10⁻⁷ | 5.2 × 10⁻³ | 2.38 × 10⁻² | |
| Cr | TA | 2.71 × 10⁻² | 0.000319 | 5.38 × 10⁻³ | 3.27 × 10⁻² | 2.52 × 10⁻¹ | 2.42 × 10⁻⁵ | 3.52 × 10⁻² | 2.87 × 10⁻¹ |
| RA | 2.15 × 10⁻² | 0.000254 | 4.28 × 10⁻³ | 2.6 × 10⁻² | 2.01 × 10⁻¹ | 1.93 × 10⁻⁵ | 2.81 × 10⁻² | 2.28 × 10⁻¹ | |
| SA | 1.8 × 10⁻² | 0.000213 | 3.6 × 10⁻³ | 2.18 × 10⁻² | 1.68 × 10⁻¹ | 1.62 × 10⁻⁵ | 2.35 × 10⁻² | 1.92 × 10⁻¹ | |
| Pb | TA | 1.05 × 10⁻² | 1.17 × 10⁻⁶ | 2.78 × 10⁻⁴ | 1.07 × 10⁻² | 9.74 × 10⁻² | 8.89 × 10⁻⁸ | 1.82 × 10⁻³ | 9.93 × 10⁻² |
| RA | 5.55 × 10⁻³ | 6.22 × 10⁻⁷ | 1.48 × 10⁻⁴ | 5.7 × 10⁻³ | 5.18 × 10⁻² | 4.72 × 10⁻⁸ | 9.66 × 10⁻⁴ | 5.27 × 10⁻² | |
| SA | 3.93 × 10⁻³ | 4.4 × 10⁻⁷ | 1.04 × 10⁻⁴ | 4.03 × 10⁻³ | 3.67 × 10⁻² | 3.34 × 10⁻⁸ | 6.84 × 10⁻⁴ | 3.73 × 10⁻² | |
| As | TA | 4.75 × 10⁻² | 4.75 × 10⁻² | 3.96 × 10⁻² | 1.34 × 10⁻¹ | 4.43 × 10⁻¹ | 1.24 × 10⁻¹¹ | 3.18 × 10⁻² | 4.75 × 10⁻¹ |
| RA | 4.92 × 10⁻² | 7.26 × 10⁻¹² | 4.12 × 10⁻² | 9.06 × 10⁻² | 4.61 × 10⁻¹ | 1.29 × 10⁻¹¹ | 3.31 × 10⁻² | 4.94 × 10⁻¹ | |
| SA | 6.89 × 10⁻² | 1.01 × 10⁻¹¹ | 5.75 × 10⁻² | 1.26 × 10⁻¹ | 6.43 × 10⁻¹ | 1.8 × 10⁻¹¹ | 4.61 × 10⁻² | 6.90 × 10⁻¹ | |
| Ni | TA | 1.85 × 10⁻³ | 2.1 × 10⁻¹³ | 7.82 × 10⁻⁵ | 1.93 × 10⁻³ | 1.73 × 10⁻² | 3.72 × 10⁻¹³ | 6.28 × 10⁻⁵ | 1.73 × 10⁻² |
| RA | 1.25 × 10⁻³ | 1.42 × 10⁻¹³ | 5.3 × 10⁻⁵ | 1.31 × 10⁻³ | 1.17 × 10⁻² | 2.52 × 10⁻¹³ | 4.25 × 10⁻⁵ | 1.17 × 10⁻² | |
| SA | 1.08 × 10⁻³ | 1.23 × 10⁻¹³ | 4.58 × 10⁻⁵ | 1.13 × 10⁻³ | 1.01 × 10⁻² | 2.18 × 10⁻¹³ | 3.68 × 10⁻⁵ | 1.02 × 10⁻² | |
| Hg | TA | 5.40 × 10⁻⁴ | 2.78 × 10⁻¹³ | 8.8 × 10⁻⁵ | 6.28 × 10⁻⁴ | 5.04 × 10⁻³ | 4.93 × 10⁻¹⁴ | 7.06 × 10⁻⁵ | 5.11 × 10⁻³ |
| RA | 1.48 × 10⁻³ | 7.62 × 10⁻¹³ | 2.41 × 10⁻⁴ | 1.72 × 10⁻³ | 1.38 × 10⁻² | 1.35 × 10⁻¹² | 1.93 × 10⁻⁴ | 1.40 × 10⁻² | |
| SA | 1.76 × 10⁻³ | 9.07 × 10⁻¹³ | 2.87 × 10⁻⁴ | 2.05 × 10⁻³ | 1.64 × 10⁻² | 1.61 × 10⁻¹² | 2.30 × 10⁻⁴ | 1.67 × 10⁻² | |
| HMs | Land Type | Adult | Children | ||||||
|---|---|---|---|---|---|---|---|---|---|
| CRng | CRinh | CRdermal | TCR | CRng | CRinh | CRdermal | TCR | ||
| Cd | TA | 2.31 × 10⁻⁵ | 2.69 × 10⁻⁹ | 9.24 × 10⁻⁸ | 2.32 × 10⁻⁵ | 2.16 × 10⁻⁴ | 2.05 × 10⁻¹⁰ | 6.05 × 10⁻⁷ | 2.17 × 10⁻⁴ |
| RA | 1.68 × 10⁻⁵ | 1.96 × 10⁻⁹ | 6.7 × 10⁻⁸ | 1.69 × 10⁻⁵ | 1.57 × 10⁻⁴ | 1.49 × 10⁻¹⁰ | 4.39 × 10⁻⁷ | 1.57 × 10⁻⁴ | |
| SA | 1.21 × 10⁻⁵ | 1.41 × 10⁻⁹ | 4.83 × 10⁻⁸ | 1.22 × 10⁻⁵ | 1.13 × 10⁻⁴ | 1.07 × 10⁻¹⁰ | 3.17 × 10⁻⁷ | 1.13 × 10⁻⁴ | |
| Cr | TA | 4.04 × 10⁻⁵ | 3.83 × 10⁻⁷ | 6.45 × 10⁻⁶ | 4.73 × 10⁻⁵ | 3.77 × 10⁻⁴ | 2.91 × 10⁻⁸ | 4.23 × 10⁻⁵ | 4.2 × 10⁻⁴ |
| RA | 3.22 × 10⁻⁵ | 3.05 × 10⁻⁷ | 5.13 × 10⁻⁶ | 3.76 × 10⁻⁵ | 3 × 10⁻⁴ | 2.32 × 10⁻⁸ | 3.36 × 10⁻⁵ | 3.34 × 10⁻⁴ | |
| SA | 2.7 × 10⁻⁵ | 2.56 × 10⁻⁷ | 4.31 × 10⁻⁶ | 3.16 × 10⁻⁵ | 2.52 × 10⁻⁴ | 1.94 × 10⁻⁸ | 2.82 × 10⁻⁵ | 2.8 × 10⁻⁴ | |
| Pb | TA | 3.11 × 10⁻⁷ | 1.73 × 10⁻¹⁰ | 1.24 × 10⁻¹² | 3.11 × 10⁻⁷ | 2.9 × 10⁻⁶ | 1.31 × 10⁻¹¹ | 8.12 × 10⁻¹² | 2.9 × 10⁻⁶ |
| RA | 1.65 × 10⁻⁷ | 9.19 × 10⁻¹¹ | 6.58 × 10⁻¹³ | 1.65 × 10⁻⁷ | 1.54 × 10⁻⁶ | 6.98 × 10⁻¹² | 4.31 × 10⁻¹² | 1.54 × 10⁻⁶ | |
| SA | 1.17 × 10⁻⁷ | 6.5 × 10⁻¹¹ | 4.66 × 10⁻¹³ | 1.17 × 10⁻⁷ | 1.09 × 10⁻⁶ | 4.94 × 10⁻¹² | 3.05 × 10⁻¹² | 1.09 × 10⁻⁶ | |
| As | TA | 7.33 × 10⁻⁶ | 1.08 × 10⁻¹⁴ | 6.12 × 10⁻⁶ | 1.34 × 10⁻⁵ | 1.71 × 10⁻⁵ | 4.78 × 10⁻¹⁵ | 1.23 × 10⁻⁶ | 1.83 × 10⁻⁵ |
| RA | 7.62 × 10⁻⁶ | 1.12 × 10⁻¹⁴ | 6.36 × 10⁻⁶ | 1.4 × 10⁻⁵ | 1.78 × 10⁻⁵ | 6.76 × 10⁻⁶ | 1.28 × 10⁻⁶ | 2.58 × 10⁻⁵ | |
| SA | 1.06 × 10⁻⁵ | 1.56 × 10⁻¹⁴ | 8.88 × 10⁻⁶ | 1.95 × 10⁻⁵ | 2.48 × 10⁻⁵ | 6.94 × 10⁻¹⁵ | 1.78 × 10⁻⁶ | 2.66 × 10⁻⁵ | |
| Ni | TA | 1.16 × 10⁻⁵ | 1.57 × 10⁻¹⁵ | 6.16 × 10⁻⁶ | 1.77 × 10⁻⁵ | 2.7 × 10⁻⁵ | 6.96 × 10⁻¹⁶ | 1.23 × 10⁻⁶ | 2.82 × 10⁻⁵ |
| RA | 7.83 × 10⁻⁶ | 1.06 × 10⁻¹⁵ | 4.17 × 10⁻⁶ | 1.2 × 10⁻⁵ | 1.83 × 10⁻⁵ | 4.71 × 10⁻¹⁶ | 8.37 × 10⁻⁷ | 1.91 × 10⁻⁵ | |
| SA | 6.77 × 10⁻⁶ | 9.19 × 10⁻¹⁵ | 3.61 × 10⁻⁶ | 1.04 × 10⁻⁵ | 1.58 × 10⁻⁵ | 4.08 × 10⁻¹⁶ | 7.23 × 10⁻⁷ | 1.65 × 10⁻⁵ | |
Disclaimer/Publisher’s Note: The statements, opinions and data contained in all publications are solely those of the individual author(s) and contributor(s) and not of MDPI and/or the editor(s). MDPI and/or the editor(s) disclaim responsibility for any injury to people or property resulting from any ideas, methods, instructions or products referred to in the content. |
© 2023 by the authors. Licensee MDPI, Basel, Switzerland. This article is an open access article distributed under the terms and conditions of the Creative Commons Attribution (CC BY) license (https://creativecommons.org/licenses/by/4.0/).
Share and Cite
Rouhani, A.; Makki, M.; Hejcman, M.; Shirzad, R.; Gusiatin, M.Z. Risk Assessment and Spatial Distribution of Heavy Metals with an Emphasis on Antimony (Sb) in Urban Soil in Bojnourd, Iran. Sustainability 2023, 15, 3495. https://doi.org/10.3390/su15043495
Rouhani A, Makki M, Hejcman M, Shirzad R, Gusiatin MZ. Risk Assessment and Spatial Distribution of Heavy Metals with an Emphasis on Antimony (Sb) in Urban Soil in Bojnourd, Iran. Sustainability. 2023; 15(4):3495. https://doi.org/10.3390/su15043495
Chicago/Turabian StyleRouhani, Abdulmannan, Mohsen Makki, Michal Hejcman, Razieh Shirzad, and Mariusz Z. Gusiatin. 2023. "Risk Assessment and Spatial Distribution of Heavy Metals with an Emphasis on Antimony (Sb) in Urban Soil in Bojnourd, Iran" Sustainability 15, no. 4: 3495. https://doi.org/10.3390/su15043495
APA StyleRouhani, A., Makki, M., Hejcman, M., Shirzad, R., & Gusiatin, M. Z. (2023). Risk Assessment and Spatial Distribution of Heavy Metals with an Emphasis on Antimony (Sb) in Urban Soil in Bojnourd, Iran. Sustainability, 15(4), 3495. https://doi.org/10.3390/su15043495