Article

A Patent Bibliometric Analysis of Carbon Capture, Utilization, and Storage (CCUS) Technology

School of Management, University of Science and Technology of China, 96 Jinzhai Road, Hefei 230026, China
*
Author to whom correspondence should be addressed.
Sustainability 2023, 15(4), 3484; https://doi.org/10.3390/su15043484
Submission received: 16 January 2023 / Revised: 6 February 2023 / Accepted: 12 February 2023 / Published: 14 February 2023

Abstract

:
Large amounts of CO2 from human socioeconomic activities threaten environmental sustainability. Moreover, uncontrolled resource use and lack of relevant technology exacerbate this issue. For this reason, carbon capture, utilization, and storage (CCUS) technology has gained worldwide attention. Many scholars have researched CCUS, but few have used CCUS patent bibliometric analysis from a unified perspective. This article aims to provide a conclusive analysis for CCUS researchers and policymakers, as well as summarize the innovation trends, technological distribution, and topic evolution. Based on 11,915 pieces of patent data from the Derwent Innovations Index, we used bibliometric analysis and data mining methods to conduct research on four dimensions: overall trend, geographical distribution, patentees, and patent content. The results of this article are as follows. CCUS has entered a rapid development stage since 2013. Patents are mainly distributed geographically in China, the US, and Japan, especially in heavy industries such as energy and electricity. Large enterprises hold patents with a relatively stable network of cooperators and attach great importance to international patent protection. A total of 12 topics were identified through clustering, and these topics gradually shifted from technicalities to commercialization, and from industrial production to all aspects of people’s daily lives.

1. Introduction

Environmental sustainability, defined as meeting the needs of current and future generations without compromising ecosystem health, is always a significant issue for the public, policymakers, and researchers [1]. In recent decades, human socioeconomic activities have increased, leading to higher levels of carbon dioxide in the atmosphere. Excessive levels of CO2 in the atmosphere pose many problems and threats to environmental sustainability [2]. First, the greenhouse effect of excess CO2 will lead to global warming, bringing threats such as glacier melting, sea level rise, and extreme weather. The Fifth Assessment Report prepared by the United Nations Intergovernmental Panel on Climate Change (IPCC) indicates that global warming is continuing and that the Earth‘s average temperature will increase by 0.3–4.5 °C compared to 1986–2005 until 2100 [3]. Second, oceans absorb more than one-third of human carbon dioxide emissions, and excess CO2 also leads to ocean acidification, threatening the survival of marine life. Studies have shown that the long-term stable ocean pH has dropped by 0.1 units in just 100 years and will continue to drop by 0.3–0.4 units by the end of the century [4]. In addition, increased CO2 levels in the air will also decrease cell pH and lead to bioprotein dysfunction, thus inducing various diseases [5]. In response, the IPCC has launched a series of conventions calling for a reduction in CO2 emissions, and related concepts such as carbon neutrality have emerged. In September 2020, China pledged to reduce its carbon intensity by more than 65% in 2030 compared to 2005 and work toward carbon neutrality by 2060 [6].
Carbon capture, utilization, and storage (CCUS) is one of the most important technologies for addressing carbon emission problems and has received wide attention from countries worldwide [7]. The International Energy Agency (IEA) has concluded that CCUS is vital for carbon neutrality. CCUS aims to separate CO2 from energy or production processes and capture, store, or utilize it [8]. CCUS adds carbon utilization compared to CCS (carbon capture and storage), making it economically beneficial to use the carbon dioxide emitted from one production process in a different production process through relevant technologies. The International Energy Agency (IEA) has concluded that CCUS should account for 15 to 30% to achieve near-zero emissions or carbon neutrality globally [9].
In addition to international organizations, the academic community is also very interested in CCUS technology. In order to understand the current status, research content, methods, and shortcomings of academic research related to CCUS technology, we conducted a literature review according to the flowchart shown in Figure 1. As is shown in Figure 1, the review began with the primary CCUS study content, focusing on research using the bibliometric method. In terms of the data sources, we first reviewed studies using article data, followed by studies using patent data.
Many scholars have researched CCUS, mainly focusing on CCUS technology/device details [10,11,12,13,14], applications [11,15,16,17], or influencing factors [18,19,20,21]. In addition to analyzing CCUS technology-related applications and influencing factors, many scholars have also analyzed CCUS through the bibliometric method. Jiang et al. conducted a bibliometric study on current CCUS research in China, finding that CCUS research in China has become a multidisciplinary study field, and concluded that the progress of CCUS research in China appears to be directly related to the increase in policy support [22]. Tapia et al. analyzed methods related to the CCUS optimization decision model and described the relevant research trends [23]. Osman et al. conducted a bibliometric analysis on CCUS and identified research gaps in the CCUS field, suggesting that future research could focus on new and stable ionic liquids, the pore size and selectivity of metal–organic skeletons, and improving the adsorption capacity of novel solvents [24]. Zhang et al. used the bibliometric method to analyze CCUS research in the past three decades and identified 16 research themes as well as six research hotspots [25]. Nawaz analyzed CCUS articles from 2007 to 2021, including the number of articles from different countries, institutions and publishers, and found that the United States, the United Kingdom, and China have the most literature in this field and that carbon capture and utilization-related research has proliferated in recent years [26]. Zhang et al. used the bibliometric method to analyze the status, evolution, and trend of carbon neutrality [27]. Da Cruz et al. used the bibliometric method to analyze CCUS technology life cycle assessment and relevant evaluations [28].
The above studies analyzed articles in the field of CCUS through the bibliometric method. Meanwhile, some scholars have also conducted CCUS patent bibliometric analysis. Costa analyzed papers and patents on carbon dioxide capture and utilization in the plastics recycling economy and documented the discussion [29]. Maghzian et al. measured data on patents related to carbon capture using a bibliometric method to analyze their commercialization and technology level [30]. Zahedi et al. studied and patented CO2 capture technologies for greenhouses from combined cycle power plants to find the best application technology and proposed corresponding policy recommendations [31]. Zolfaghari et al. studied the technical development of direct air capture (DAC) and concluded that DAC has moved from demonstration to commercialization [32]. Kang et al. screened 27 key technology paths with a dynamic programming algorithm combined with the topic modeling method [33]. Choi et al. investigated hydrogen technology and its difference between countries with patent data [34]. Kang et al. studied negative emission technologies (NETs) with patent data and highlighted 16 subcategories [35]. Miguez et al. performed a patent bibliometric analysis on carbon capture technology and analyzed patent distribution in different countries and companies [36]. Malekli et al. performed bibliometric analysis on combined cycle power plant CCS patent data, classified seven clusters, and found several critical technologies [37]. Cardoso et al. analyzed third-generation bioethanol patent data and provided a patent-based mapping since 1979 [38]. Severo et al. found that microalgae photobioreactor technological trend analysis involving patents is poorly investigated and they provided a patent survey resolving this issue [39]. Sharifzadeh et al. quantified greenhouse gas technology improvement rates based on patent data and the corresponding citation network [40]. Miguez et al. used the cooperative patent classification criteria to analyze biological systems patents for CO2 sequestration and found several leader countries/patentees in the field of patent publication [41].
A review of previous research on CCUS reveals that many scholars have researched CCUS technology details, practical applications, and influencing factors. Some scholars use the bibliometric method to analyze CCUS article data, but relatively few studies revolve around patent analyses [41]. As an important indicator of knowledge, patents are significant in measuring technological development. In addition, existing CCUS patent bibliometric analysis studies mainly focus on a particular industry [29,31,37], a certain country/region [34], or segmented technology areas [30,32,35,36,38,39,41,41]. There is still a need to conduct CCUS patent bibliometric analysis from a unified perspective. With this motivation, this article aims to provide a conclusive analysis for CCUS researchers and policymakers, and to summarize the innovation trends, technological distribution, and topic evolution.
This article analyzes patents in the CCUS field through bibliometric analysis and data mining methods. Figure 2 shows the patent bibliometric analysis flow of this article. We extracted 11,539 patents from the Derwent Innovations Index (DII) database, spanning 1964 to 2022. We then conducted a patent bibliometric analysis covering four dimensions: overall trends, geographical distribution, patentees, and patent content. First, we analyzed the overall patent trends in annual numbers and citations. Second, we conducted research on patent geographical distribution while analyzing several major priority countries. Third, we analyzed patentees, including patentee index statistics, patent disclosure countries, and patentee cooperation networks. Finally, in the patent content part, we analyzed patent topics and their evolution with the knowledge graph method. Furthermore, we conducted detailed analyses of some high-value patents.
This article’s contributions are mainly as follows. First, the CCUS patent bibliometric analysis in this article is conducted from a unified perspective, which is needed to improve in this field. Second, in the analysis process involving countries and patentees, our analysis involves not only the number of patents, but also the patent quality, and the time the patentee entered this field. Third, after identifying several CCUS topics, we analyzed the topic evolution process based on the co-occurrence network and clustering results. Our research results would be valuable and helpful for the public, policymakers, and researchers in the CCUS field. This article is organized as follows. The data and related methods used for the CCUS bibliometric analysis are presented in Section 2. The subsequent sections analyze the overall trend of CCUS patents, the geographical distribution, the patentees, and the patents themselves. Then, we discuss the results in Section 4. The final section concludes the article.

2. Data and Methods

2.1. Data Source

The dataset in this study was obtained from the Derwent Innovations Index (DII), which collects patent information from more than 41 patent offices worldwide and covers patent information filed in more than 100 countries and regions. The database has become an essential data source for scholars conducting patent analysis [42,43,44,45]. Through literature research, we identified the search keywords mainly as CCUS-relevant terms. Specifically, the search strategy was as follows: TS = (“CO2 capture*” or “carbon dioxide fix*” or “capture* carbon” or “capture* carbon dioxide” or “capture* CO2” or “carbon utiliz*” or “carbon dioxide utiliz*” or “carbon dioxide recycl*” or “CO2 recycl*” or “carbon recycl*” or “CO2 utiliz*” or “utiliz* carbon” or “utiliz* carbon dioxide” or “utiliz* CO2” or “carbon storag*” or “carbon dioxide storag*” or “CO2 storag*” or “storag* carbon” or “storag* carbon dioxide” or “storag* CO2” or “carbon dioxide recover*” or “CO2 recover*” or “carbon sequestra*” or “carbon dioxide sequestra*” or “CO2 sequestra*” or “sequestra* carbon” or “sequestra* carbon dioxide” or “sequestra* CO2” or “carbon transport*” or “carbon waste” or “ zero carbon” or “carbon dioxide conver*” or “CCUS”). We analyzed the relevant patents in terms of CCUS technology as a whole and therefore did not separate them. We performed this search in December 2022 and exported the search results, obtaining 11,915 patents. In addition, it should be noted that although the patent citation information is visible on the DII database website page, the exported data do not contain the patent citation record.

2.2. Data Preprocessing

The data preprocessing mainly involved verifying patent dates, patent countries, patentee disambiguation, and patent technology codes.

2.2.1. Patent Dates and Countries

Patents can be applied in one country and then continue to be applied in other countries, which means that there are multiple patent dates and countries’ information in each piece of patent data. This mainly involved the PD and PI fields in the DII dataset. The PD (patent detail) field records the patent disclosure date and country/region of each patent in the patent family, and the PI (patent information) field records the patent priority application information. The patent’s earliest priority application year and country are more reflective of when and where the innovation was first made. Therefore, we used the earliest priority country and patent priority year in PI as the patent application country and year. We used the dates and countries information in PD as the patent disclosure date and disclosure countries.

2.2.2. Patentee Disambiguation

In the patent application process, different divisions of the same organization often use different names, although these names all refer to one patentee. Regarding this situation, for each patent document included in the DII database, the DII database assigns a four-letter patentee code to each patentee based on the patentee’s name. The DII patentee codes are helpful for resolving the problem mentioned above. However, there are two types of patentee codes: standard codes and nonstandard codes. Patentee standard codes include individual codes. They can lead to confusion when the DII patentee code is nonstandard or individual-standard (e.g., J. Zhang and C. Zhang are both given ZHAN-Individual codes). Therefore, in this article, we used the default patentee form of DII (patentee + patentee code) as the patentee form when the patentee code was nonstandard or individual-standard type. In this way, we avoided the confusion issues mentioned above. Note, companies or organizations with one patentee form may indicate a collective term refers to cases of their branches in other regions or similar situations.

2.3. Tools and Software

To perform patent bibliometric analysis with patent data, we relied on software tools. In the analysis process of this article, we used Python to process data, which mainly involved the Pandas (1.4.3), Numpy (1.23.1), and Re (2.2.1) packages. For plotting, Excel was used to draw line graphs, while Ucinet (6.186) and CiteSpace (5.8) [46,47,48] were used to draw pictures related to the network analysis. It is also worth noting that there are other popular data processing and visualization tools. R works just as well as Python and, like Python, has many packages to meet different needs during data processing. Zema et al. used the factoextra R package to perform principal component analysis (PCA) and result visualization [49]. VOSviewer is another popular network visualization tool, and many scholars use VOSviewer to conduct research [50,51]. VOSviewer is better at handling big data than CiteSpace, which performs evolutionary analysis better.

3. Results

3.1. Overall Analysis

Figure 3 illustrates the annual number of CCUS patent applications and its trend. Note that the data for 2021 and 2022 may be missing due to the time required for patent applications, and the numbers of these two years are for reference only [52]. As shown in Figure 3, the trend in the number of CCUS patent applications can be broadly divided into three stages: the initial stage (before 2000), the slow development stage (2001–2012) and the rapid development stage (2013-present). In the initial stage, the number of CCUS patent applications was tiny, averaging only 10 per year. Since 2001, CCUS technology has entered a slow growth stage, with the number of related patents increasing yearly. During this stage, the average annual number of patents exceeded 200, and the number of patents in 2012 alone already exceeded the total number of patents in the initial stage. From 2013 onwards, CCUS technology entered a stage of rapid development, and the number of related patent applications began to explode, with the growth rate of patent applications gradually increasing. Excluding the patents applied for but not approved in 2021 and 2022, the average annual number of applications exceeded 800. In terms of the number of patent citations, the number of patent citations peaked between 2008 and 2010, and patent accumulation during the slow development period laid a solid foundation for the CCUS technology explosion in recent years.

3.2. Geographical Analysis

The level of CCUS technology development in different countries can be determined from their patent application data. Table 1 shows patent statistical data for the ten countries/regions (“countries” is used to refer to countries and regions in subsequent sections of this article) with the highest number of patent applications. As shown in Table 1, the countries/regions with the highest number of CCUS patent applications were China, the United States, Japan, South Korea, and the European Patent Office. Among them, the number of patents from China, the United States, and Japan accounted for 85.78% of the total number of patents (of which China accounted for 61.56%). This situation implies a high patent concentration in the CCUS technology field. Regarding patent citations, the US’s total citations (10,685) and average citations (6.14) are higher than those of the other two countries. In addition, the H-index combines the output quantity and quality; an evaluated unit’s H-index is h if it has h output with h citations for each output [53,54]. The US and Japan lead in the H-index, reaching 49 and 25, respectively, while China is slightly behind with 25. In terms of the start year of patent application, the US and Japan started earlier, with relevant patent application records in 1971, while China had a CCUS patent application record in 1993. Figure 4a shows the patent trend of major priority countries. In 2010, low carbon became a hot topic at the Chinese National People’s Congress and the Chinese Political Consultative Conference (NPC and CPPCC) and was written for the first time in the Premier’s “Government Work Report”. With the encouragement of the Chinese government, the number of patents in China began to explode in approximately 2010, and now China is already far ahead of other countries in terms of the number of patents it holds. Figure 4b,d shows the patent citations and H-index trend of major priority countries, with the US and Japan leading before 2012. China has caught up since 2010 but has yet to reach the appropriate level compared to its number of patents. In general, China’s CCUS technology started late and developed rapidly; although it has become one of the main countries in terms of the number of CCUS patents, there is still room to improve patent quality.

3.3. Patentee Analysis

3.3.1. Patentee Statistics

In this section, we confirm the number of patentees’ patents and citations and rank them according to their total number of patents. Table 2 shows the top 20 patentees of this rank. As shown in Table 2, the top 20 patentees are mainly from China (10), Japan (5), and the United States (3), and they are all institutions rather than individuals. Most of these large patentees of corporate nature are involved in heavy industries such as energy and electricity. Mitsubishi Group was one of the earliest patentees entering the CCUS field (AYS 1982); its influence is very significant, as it has the highest number of patents, citations, and leads the H-index (TA 164; TC 1191; H 17). As a large commercial organization, Mitsubishi Group CCUS patents mainly involve CO2 recovery in heavy industries, such as steel manufacturing, fuel production, and power production. Among the top patentees, China Huaneng Group, State Grid Corporation of China, and Xi’an Jiaotong University are the three patentees that engaged in the CCUS technology field after 2010. These patentees are very prolific and have an excellent rank now. Kansai Electric Power Company (KANT-C), which engaged in the CCUS field in 1991, currently has influence. KANT-C is second only to Mitsubishi Group in terms of citations and H-index position (TC 589; H 14) and has the highest average number of citations (AC 12.02). Its patent with the highest citations is a recovering apparatus, as is the second one. It is worth noting that among the top 20 patentees, all of them are large enterprises or large research institutions except Changsha Zichen Technology Development Corporation. This young company was the latest to engage in this field (AYS 2017) and has the smallest company size (no more than 50 employees [55]), but its performance is imposing (TP 38).

3.3.2. Patent Disclosure Analysis

After applying for a patent in the first country, the patent applicant is legally entitled to priority for a statutory period; i.e., subsequent applications still have the application date of the first patent application as the application date. In terms of patent analysis, the patent priority country is usually considered the country where the technology is developed and applied. The disclosure countries of a patent indicate the countries where the patent later applied. Disclosure countries of patents indicate patent distribution in different countries/regions, and the patentee attaches importance to different regional markets.
Table 3 shows the patent disclosure of the five top patentees with the largest number of patents in different countries/regions. Mitsubishi Group and Baker Hughes INTEQ, the two largest patentees in the CCUS field, attach great importance to patent protection in the global market. Their patents are usually disclosed in many countries, and they willingly apply for patents through the World Intellectual Property Organization. Mitsubishi Group attaches more importance to patent protection in its own country, and European and American markets. On the other hand, China Huaneng Group and China Petroleum and Chemical Corporation pay most of their attention to their home markets; most of their patents are only disclosed in their homeland. Toshiba Corporation has placed more emphasis on market and patent protection in some countries, mainly Japan, the United States, and China.

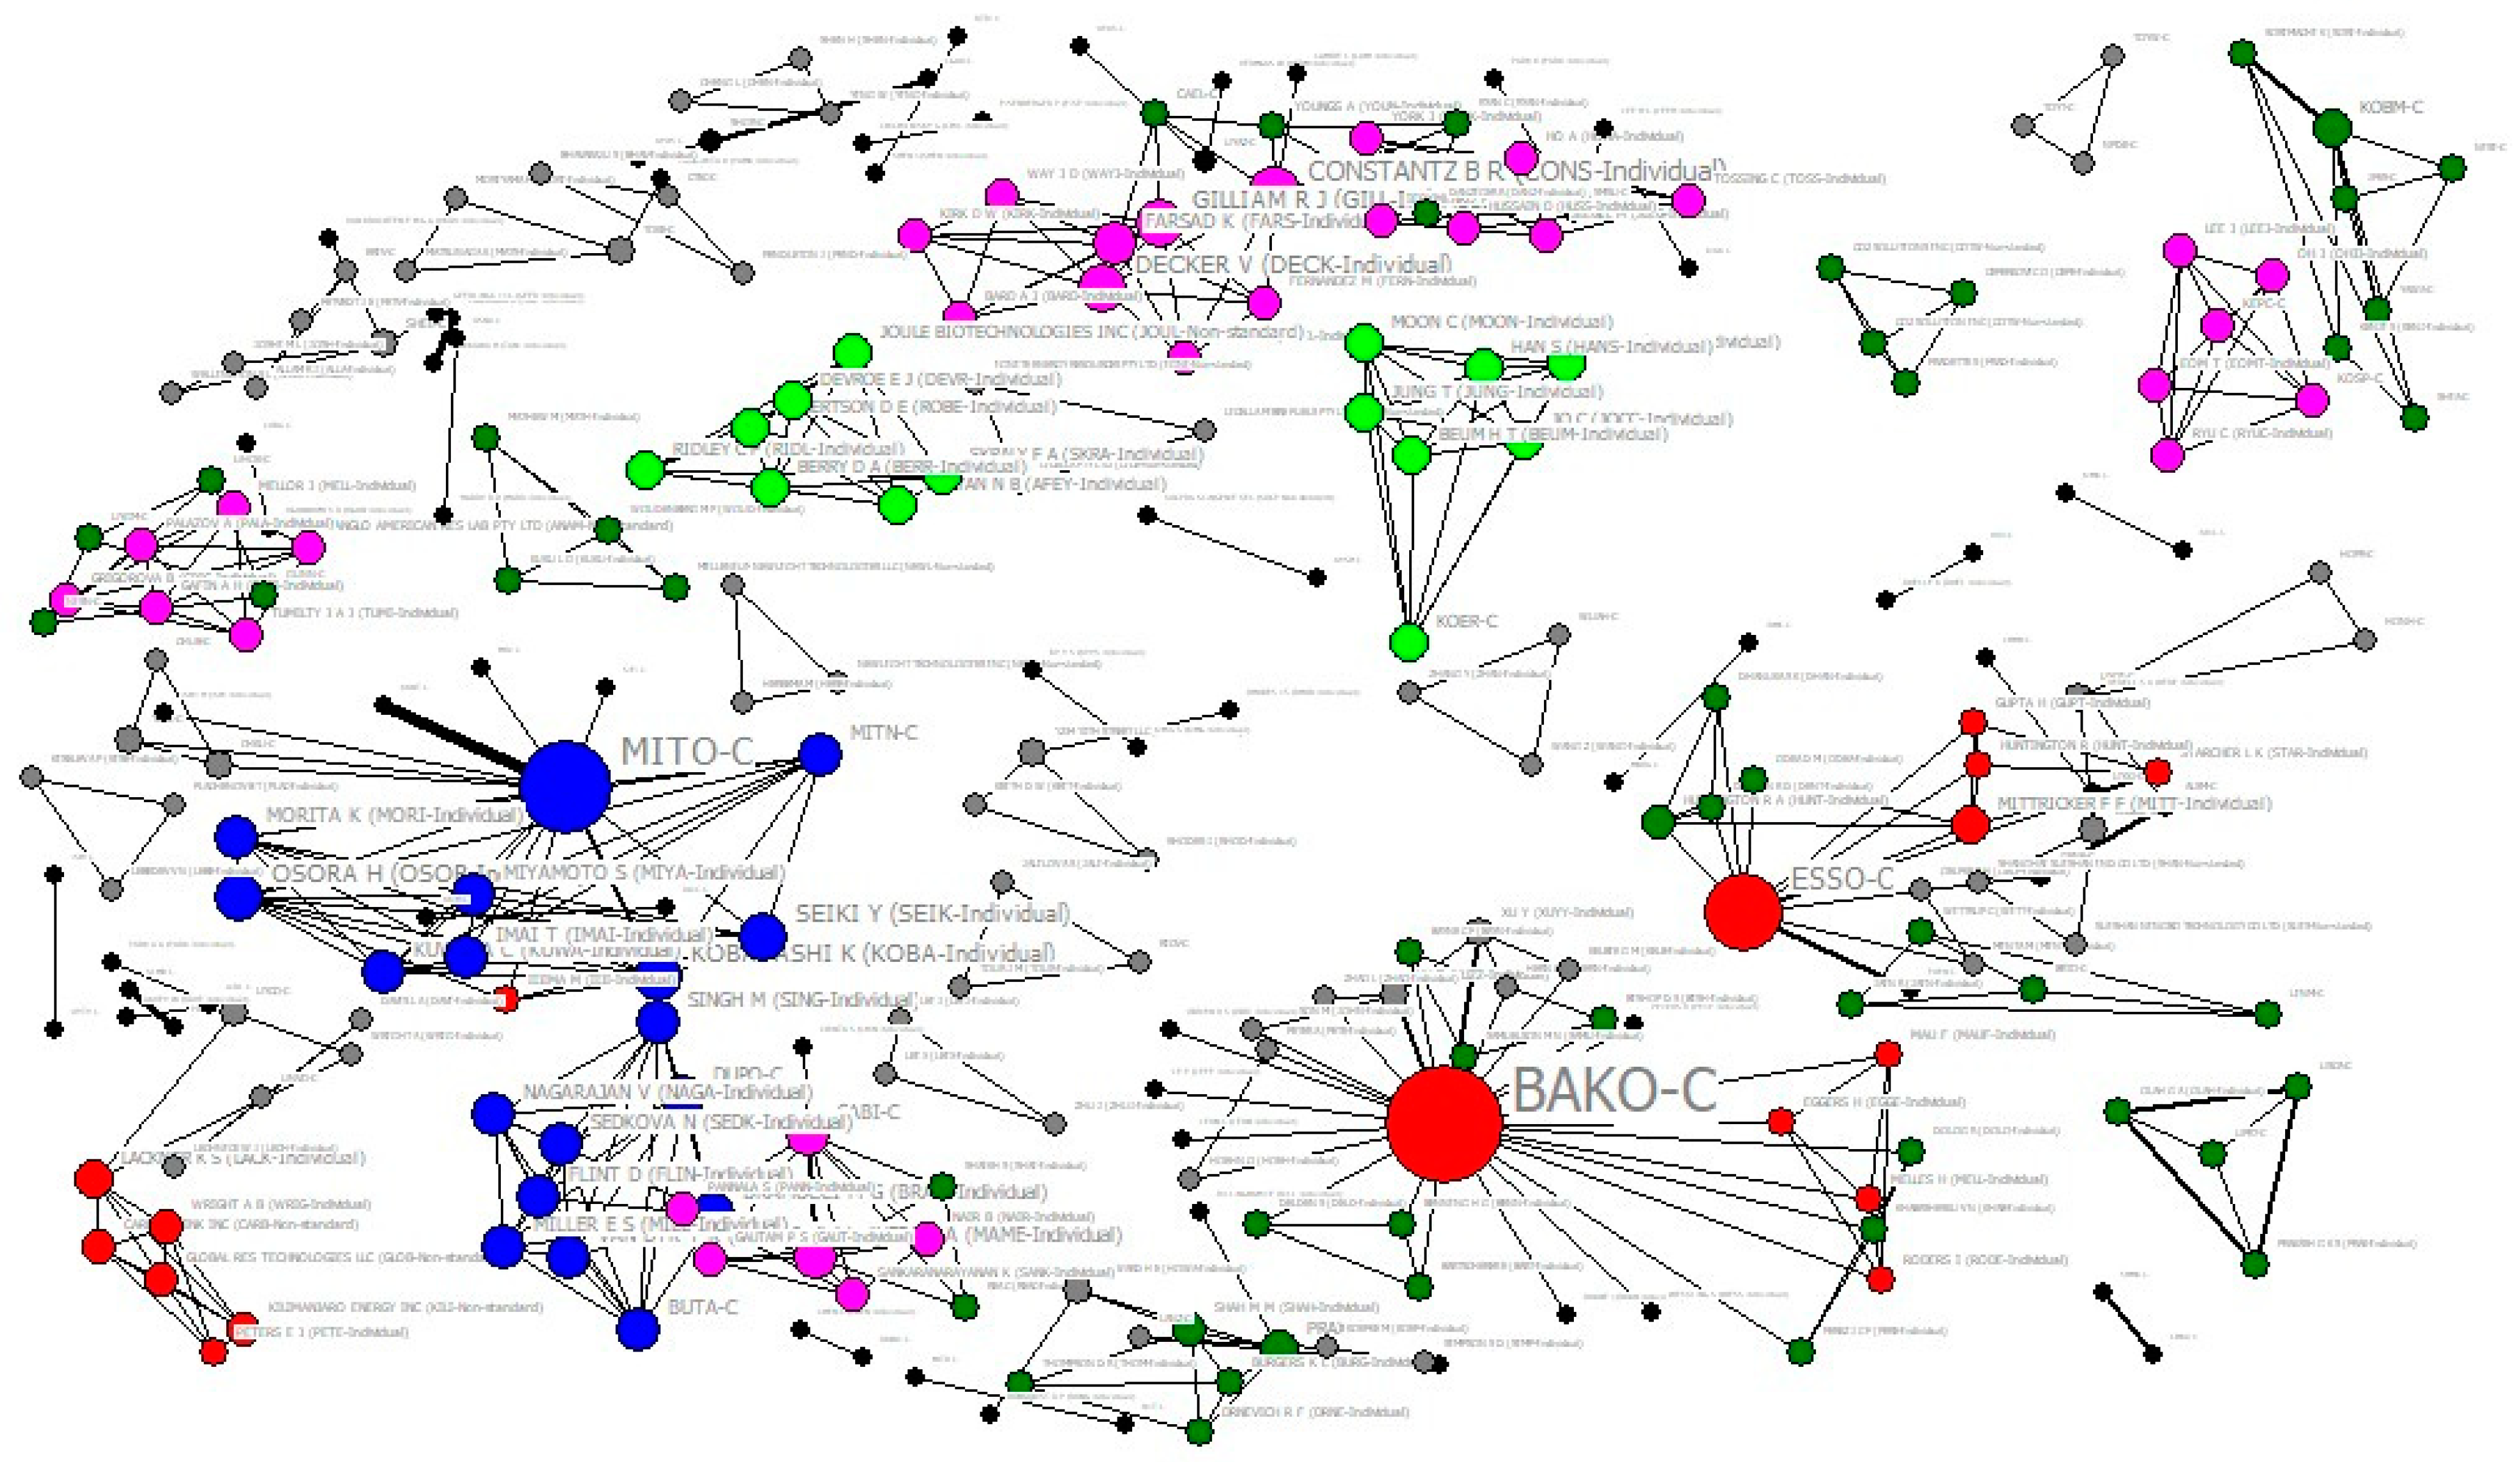
3.3.3. Patentee Cooperation Network Analysis

We also analyzed and visualized the cooperative relationships among the patentees. In the resulting cooperation network, patentees are treated as network nodes, and the number of times patentees cooperate is taken as the cooperation intensity. For observation purposes, we only show nodes representing a total number of cooperation times greater than 5. We used Python to construct the cooperation relationships between patentees and the Ucinet tool to visualize the cooperation relationships. Figure 5 shows the visualization result of the cooperation network. The node size indicates the number of patentees cooperating with that patentee; i.e., the node’s degree of centrality. The line width between nodes indicates the cooperation strength between nodes; i.e., the time of cooperation. Moreover, we used the k-core algorithm [56] to cluster the cooperative network subnetwork structures and distinguish them according to different colors to more intuitively partition different cooperative groups.
As shown in Figure 5, the current CCUS patentee cooperation network can be divided into several groups; these groups usually have different network characteristics. Some groups have a relatively robust network center, indicating a significantly stronger leadership role. For example, there are three groups centered on large companies such as BAKO-C (Baker Hughes INTEQ), ESSO-C (Exxon Corporation), and MITO-C (Mitsubishi Group). Some cooperative groups also consist of individual patentees, such as the blue group in the upper left corner, the green group in the lower part of the figure, and the purple group. The network center is often not prominent in cooperative groups where patentees are individuals, and the group members can connect more directly without going through the network center. Some patentees have many patents but do not have solid cooperative relationships with other patent owners, such as CHHN-C (China Huaneng Group) and SNPC-C (China Petroleum and Chemical Corporation). From a general perspective, many collaborative groups currently exist in the CCUS field, but overall, there is no single strong center or leader the field.

3.4. Content Analysis

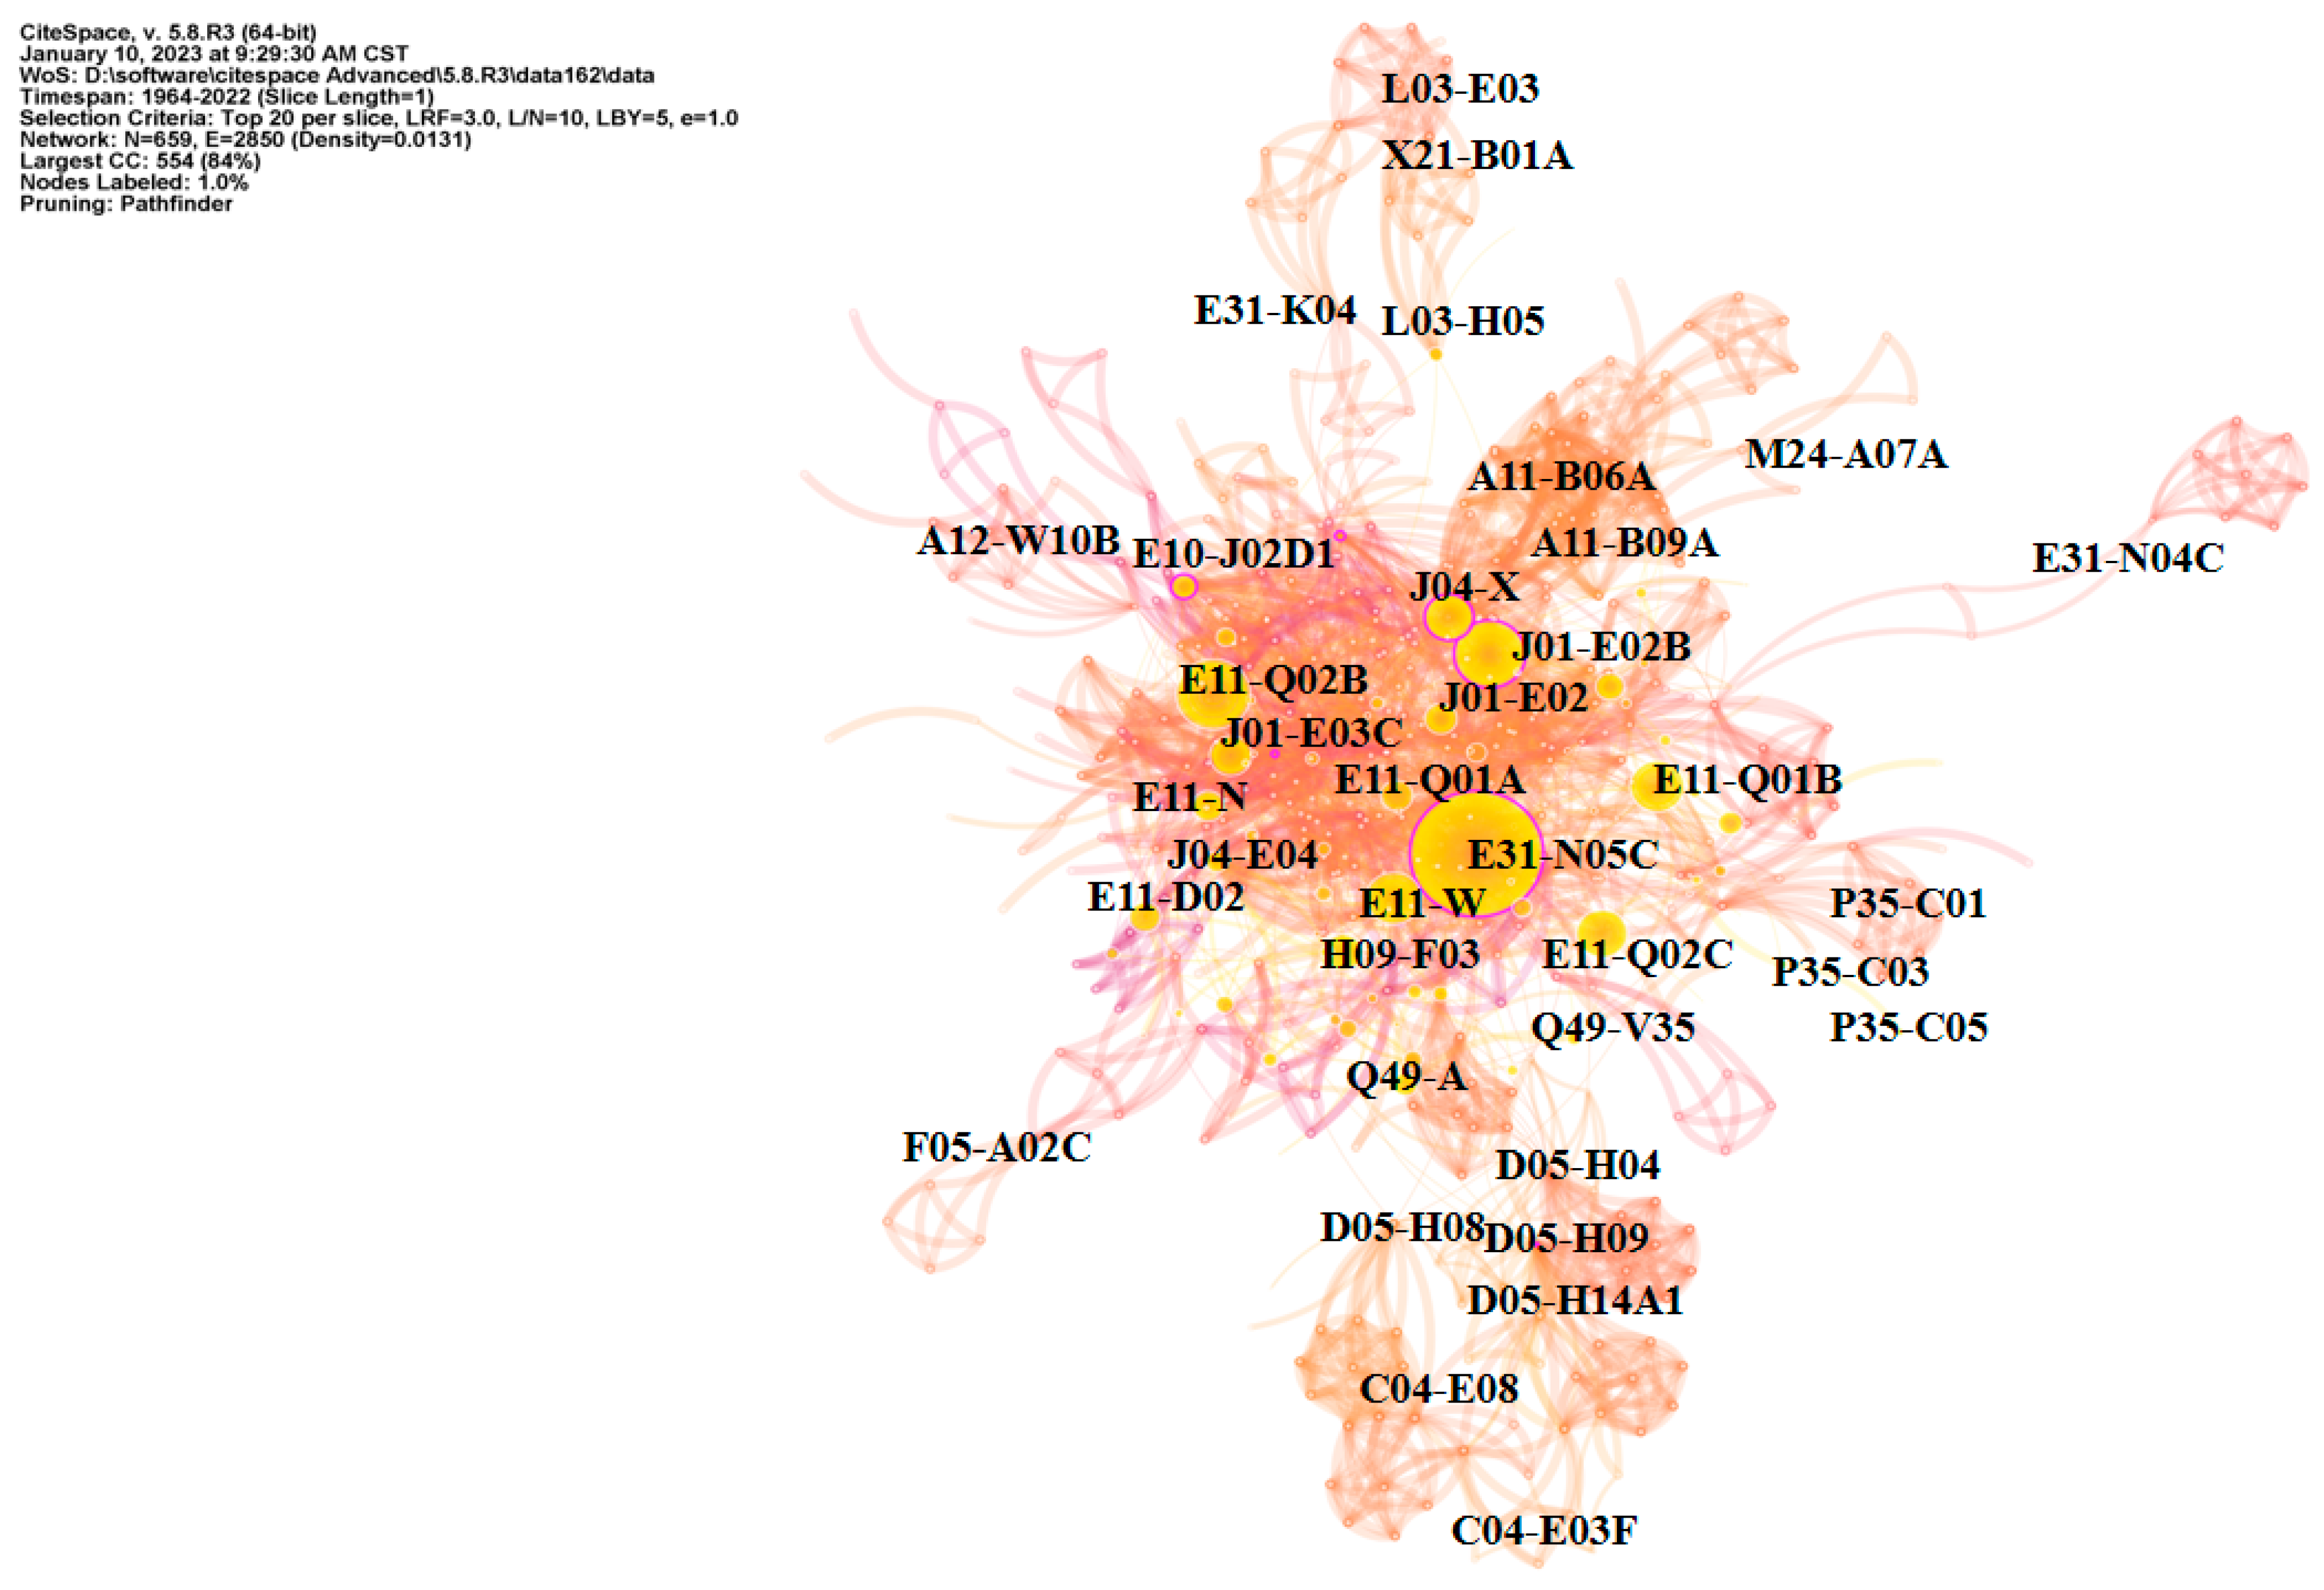
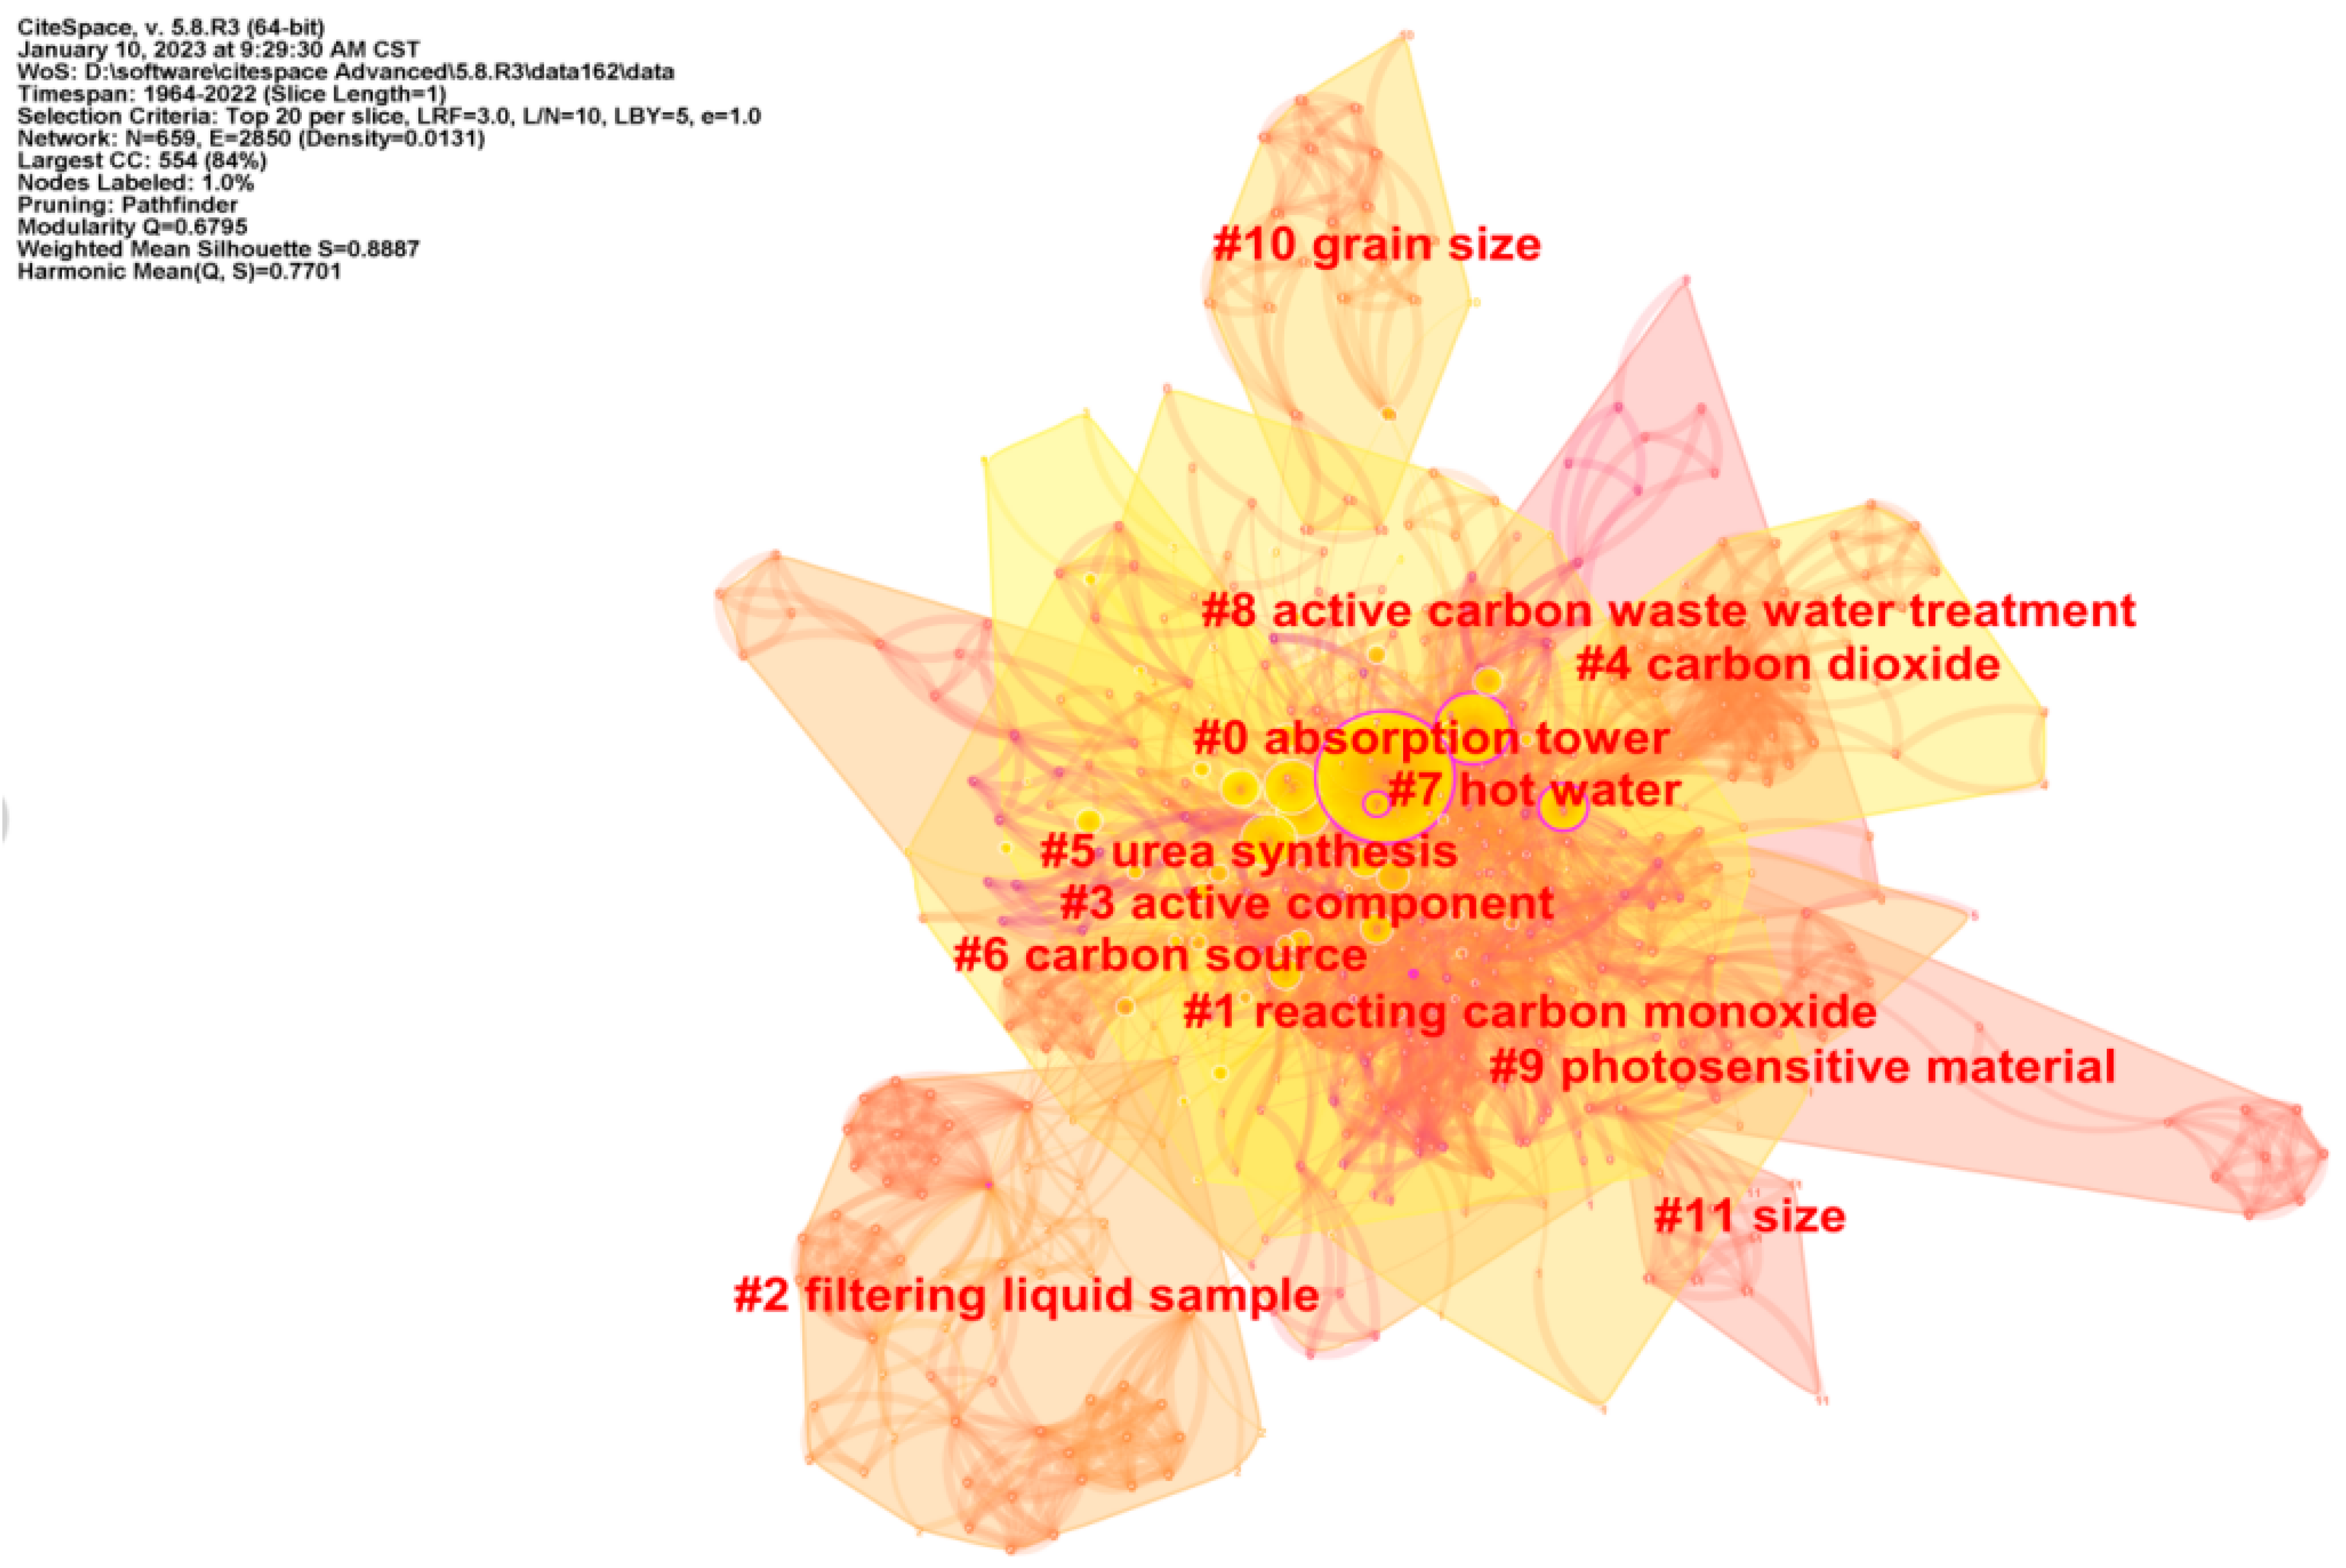
3.4.1. Topic Analysis

Compared with IPC classification codes, DII manual codes can reflect patent innovation better and more efficiently [57,58]. Therefore, we used DII manual codes to perform CCUS topic analysis in this article. In terms of tools, we used CiteSpace to visualize the manual code co-occurrence graph. Figure 6 shows the visualization result, and the details of the relevant parameters are in the upper left corner of Figure 6. The node size represents the manual code occurrence times, and the line between nodes represents the co-occurrence relationship between nodes.
As shown in Figure 6, DII manual codes are mainly concentrated in Domain E and Domain J, which correspond to the chemdoc and chemical engineering domains, respectively. In addition, Domain E (chemdoc) connects with Domain H (petroleum), Domain Q (mechanical), and Domain P (general). In contrast, Domain Q (mechanical) connects with Domain D (food, fermentation, disinfectants, detergents) and Domain C (agdoc). Moreover, Domain J (chemical engineering) connects to Domain A (plasdoc) and domain M (metallurgy). The connected relationships mentioned above indicate that CCUS technologies are mainly centered on chemical and chemical-related technologies;, CCUS also requires some support from mechanical, fermentation, and agronomic-related technologies.
In considering the CCUS technology types, we mainly used two metrics. First, the co-occurrence count indicates the code appearance time, which is a measure of technology ubiquity. Second, ‘betweenness’ centrality indicates the node’s importance in the network, which is a measure of technology criticality. To comprehensively refer to these two metrics, we filtered the DII codes with co-occurrence time ranked in the top 30 and betweenness centrality ranked in the top 30. We obtained 12 DII manual codes in this way and present them in the order of the sum of the two metric ranks. The results are shown in Table 4.
The manual code with the highest co-occurrence times in Table 4 is E31-N05C, meaning CO2, which is the subject of CCUS treatment. The manual code with the highest betweenness centrality is J04-X, a related treatment. The manual code with the second highest co-occurrence times is J01-E02B. It has 950 co-occurrences, indicating that solid-based waste gas absorption treatment is currently a more common waste gas treatment method in the CCUS technology field. In reality, solid-based adsorbents include activated carbon, synthetic zeolite, alumina, silica gel, and ion exchange resin. In addition, the manual code with the second highest betweenness centrality is E10-J02D1 (0.14), which means methane is a more critical current methane-related technology in the field of CCUS. First, as a significant high-value product of CO2 reduction, methane is easy to transport and helps to alleviate the dependence on traditional energy sources [59,60,61]. Second, the dry reforming reaction of CO2 and methane can produce hydrogen and carbon monoxide to obtain high-value-added chemical raw materials [62].
Based on the DII manual code co-occurrence network constructed above, we clustered code nodes using CiteSpace [63]. Moreover, we named the clusters using the log-likelihood ratio algorithm. Figure 7 shows the clustering result. As shown in Figure 7, modularity Q equalled 0.6795 and was greater than 0.3, which means a good clustering effect. Figure 7 shows that the DII manual codes network can be divided into several different modules. Different modules in Figure 7 represent different topics, and the module color represents the time of theme appearance; the darker the color is, the earlier the appearance time is. As seen in Figure 7, clustering identifies 12 different topics, and Table 5 shows the topic details. Table 5 shows that the largest category is #0 with the name of absorption tower, which contains 99 nodes. The second largest one is #1, named reacting carbon monoxide, which contains 85 nodes. We obtained the translation of these topics through the clustering modules and their keywords. The CCUS patent topics are mainly composed of the following parts: CO2 absorption and regeneration towers (#0) and the active substances in them (#3), biofuel preparation related to microbial fermentation (#6), and relevant technologies involving microorganisms (#2), the utilization of CO2 in high-value-added chemical feedstocks (#5, #1) or materials (#9) preparation, equipment or materials for CO2 separation, transport, or storage (#8, #4), materials or structure related to CO2 batteries (#10), equipment (#7) or methods (#11) for auxiliary production based on CO2.

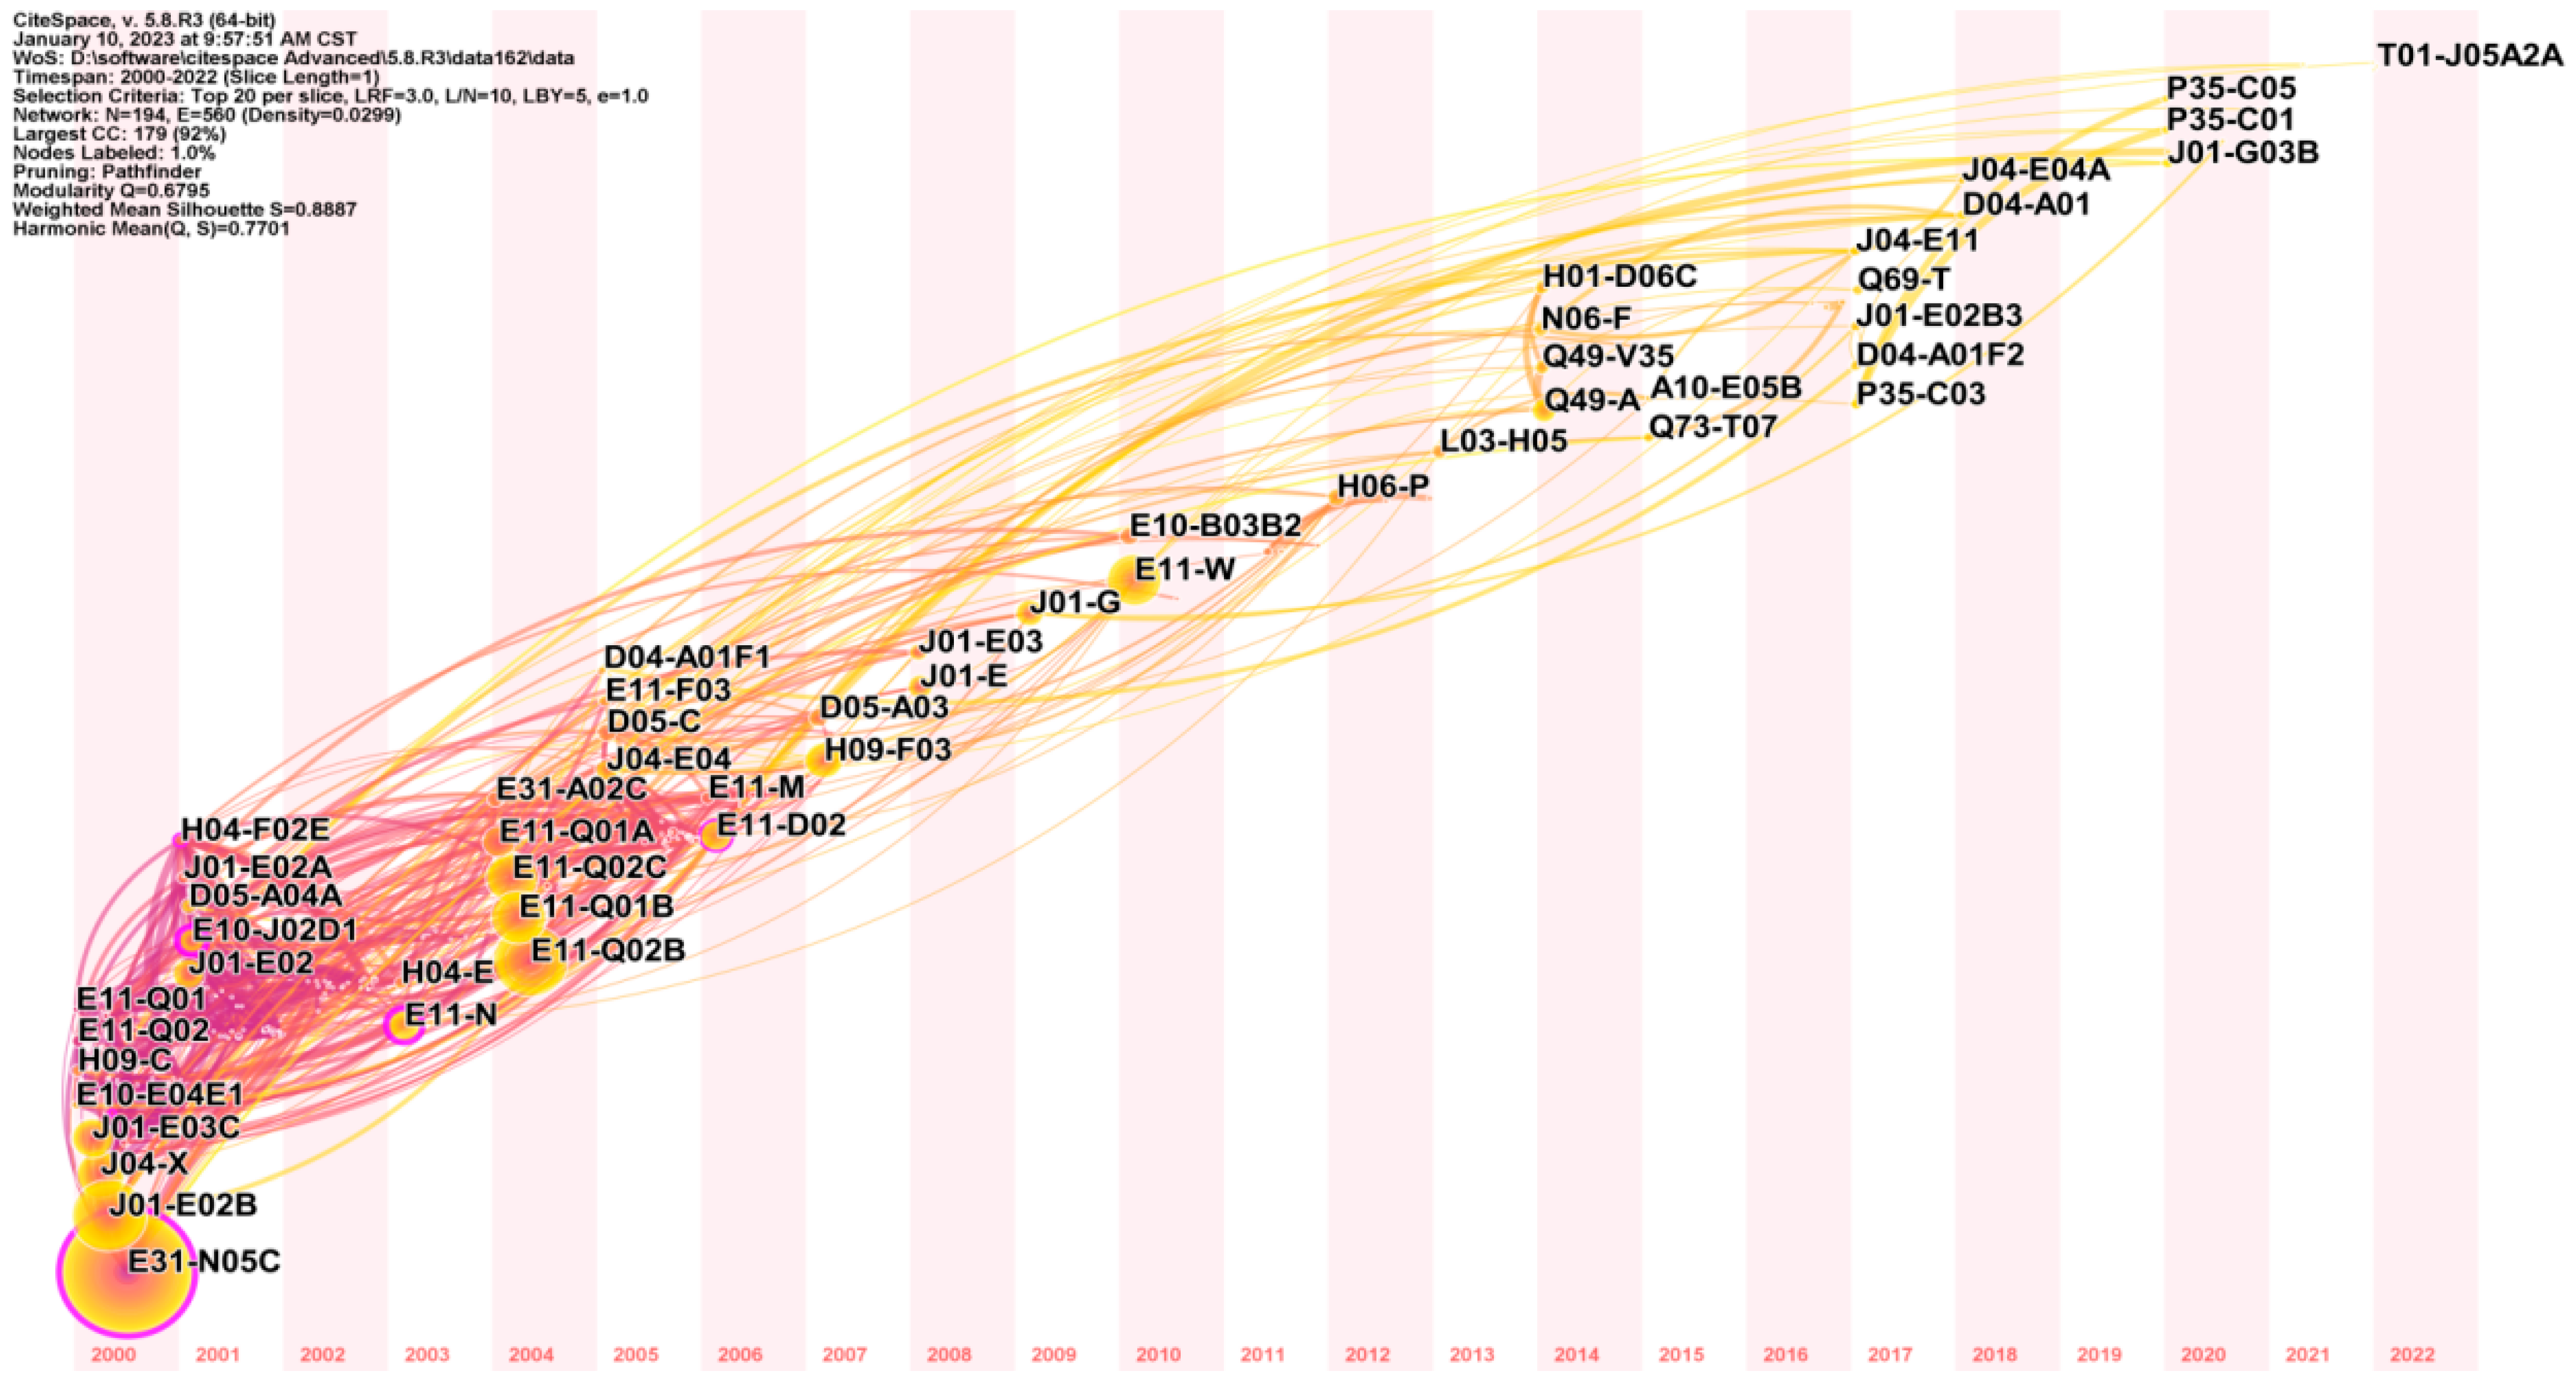
3.4.2. Patent Topic Evolution Analysis

To further analyze the evolution among the topics in the CCUS technology domain, we analyzed the topic evolution paths from 2000–2022 based on the DII manual code co-occurrence network and constructed a time-zone distribution map using CiteSpace [64]. In the time zone distribution diagram, the nodes (DII manual codes) are located according to the year they first appeared. The lines between each node represent the inheritance relationship between nodes, and the time-zone distribution diagram is shown in Figure 8. Table 6 shows DII manual codes and their translation. Combining Figure 8 and Table 6, we know that during 2000–2004, CCUS focused on various wastewater/gas purification methods. At the same time, some chemicals that can be produced from carbon dioxide were starting to come into view, such as methanol and methane. In 2005–2010, the development of separation and catalytic/fermentation technologies made it possible for people to manipulate some carbon chains, such as alkylation, arylation, and carbon atom acylation. People started to expect the use of CO2 to produce some high-value-added chemicals. CCUS technology was not only limited to industry but was also beginning to make its mark in municipal and agricultural waste treatment. After 2010, CCUS started to become involved in many aspects of production and daily life. In 2017–2020, convenient and practical CCUS devices and systems gained attention. In 2021–2022, as the level of CCUS practicality increased, business models appeared as keywords in the time-zone diagram, and CCUS started to develop toward commercialization. The time-zone map shows how CCUS has evolved over the past 20 years. CCUS not only realizes the transformation of carbon dioxide from waste to treasure but also realizes its diffusion from use in industry to being part of people’s daily lives.

3.4.3. Topic Analysis of High-Value Patents

In this subsection, we evaluate patent quality at the market level and technical level. Moreover, we identify several high-value patents and perform analysis based on the patent quality evaluation results. The patent quality evaluation index used in this article mainly includes two aspects: first, the market value and influence of the patent, including the number of citations of the patent and the number of patents in the patent family. The patent citation indicates others’ recognition and the patent’s influence. In contrast, the number of patents in the patent family indicates the number of patent applications in different countries or regions, representing the patent’s market value. Second, the evaluation indexes relate to the technology level of the patent itself, including the number of other patents cited by the patent, the number of other nonpatents cited by the patent, and the number of DII manual codes for the patent. The number of other patents/nonpatents cited by the patent represents the technological innovation foundation of the patent; the number of DII manual codes represents the technological breadth to which the patent refers. Based on these indicators, we assigned weights to these indicators with the entropy weighting method [65,66] and evaluated the patent quality using the TOPSIS [67,68] method. We ranked patents according to the evaluation result and identified the top-ranked patents as high-value core patents.
Table 7 shows information about the top 20 high-value core patents. Since a patent is actually a patent family involving several patent numbers applied in many countries/regions, we used one patent number in the patent family to represent the patent. As Table 7 shows, the priority country for high-value patents is primarily the United States (17 out of 20); some patents from New Zealand, Greece, and Australia are also on the list. China and Japan have many patents, but none appear on the list. Several of the highest-value patents are held by energy-related institutions. High-value patents involve not only enterprises or academic institutions but also individuals. For example, Eisenberger P., Comrie D.C., and Wright A.B. In terms of time, mature patents do not always mean high value. Seven out of the top 10 patents have a priority date after 2010. The highest-quality patent is US2014260310-A1; it relates to fuel cells and could increase power output with the same carbon capture efficiency. Patents ranked 2–8 all concern objects or equipment related to carbon storage or capture. Carbon capture and storage technologies have moved toward practicality and marketability, but patents related to carbon utilization still need further development.

4. Discussion

As a result of the economic activities of humans in recent decades, a large amount of carbon dioxide has been released into the air. Excess CO2 in the atmosphere has many consequences, such as global warming and ocean acidification, which will seriously affect environmental sustainability. Since 1992, the IPCC has initiated a series of conventions to reduce CO2 emissions, and related concepts such as carbon neutrality have emerged. As a critical technology to reduce carbon emissions and achieve carbon neutrality, CCUS has received widespread attention from the international community. In the academic world, many researchers have studied CCUS, mainly focusing on the CCUS technology details or relevant influencing factors in the CUSS application process. Meanwhile, some scholars have carried out a bibliometric analysis of CCUS but relatively few studies refer to CCUS patent bibliometric analysis. In addition, most CCUS patent bibliometric studies are limited to a specific segmented technology field or sector rather than a more unified perspective. In this article, we conducted a patent bibliometric analysis related to CCUS technology from a unified perspective. We provided a conclusive analysis for CCUS researchers and policymakers, as well as summarizing the innovation trends, technological distribution, and topic evolution.
In this article, we have analyzed not only the patent quantitative trends and distribution, but also focused on the quality of patents. We found that the number trend of CCUS patents can be divided into three main stages; CCUS entered the rapid development stage in 2013, with the annual growth rate of patent applications increasing yearly. Geographically, the US and Japan were in the lead before 2007. Since then, China has become the largest patent country ranked by the number of patents held, which is more than four times that of the second placed United States. This could be the result of the strong support coming from the Chinese government. There are more than 40 CCUS pilot projects in China with a total sequestration capacity of 3 million tons. However, due to the enormous investment in CCUS projects, the progress of these projects is still plodding [69]. This means that the development of CCUS technology needs further policy incentives or higher economic benefits from technological breakthroughs in carbon utilization. In addition, the United States still leads in patent quality even though China has become the largest CCUS patent country: the earliest priority country for high-value patents is overwhelmingly the United States. There is still room for Chinese patent quality improvement. This means that U.S. and Japanese policymakers should make more efforts to promote CCUS technology in their countries, while Chinese policymakers should focus more on the patent quality rather than just quantity.
From the perspective of the patentee, large enterprises in heavy industries such as energy and electricity hold many patents. In East Asia, in addition to companies, several academic research institutions have also made important contributions to CCUS patents, such as Xi’an Jiaotong University, Zhejiang University, and Southeast University, Korea Energy Research Institute. These large organizations pay much attention to international patent protection and have stable cooperation relationships. There is still no strong leader in the CCUS field worldwide. The analysis of patentees could provide information for corporate investigators in the process of competitor investigation and investors.
In terms of CCUS patent content, we identified several CCUS patent themes by clustering based on the DII manual codes and their co-occurrence networks. Furthermore, we analyzed the theme evolution process by constructing a time-zone distribution map. We found 12 patent topics by clustering DII manual codes and found that CCUS not only realizes the transformation of carbon dioxide from waste to treasure but also realizes its diffusion from use in industry to being part of people’s daily life. In addition, we conducted an analysis on several high-value patents. Patents with the highest quality are almost all associated with carbon capture and storage; there is still a need for high-value carbon utilization patents now. To promote the further development of CCUS, relevant researchers could make more efforts on carbon utilization technology, and policymakers should increase the appropriate policy incentives. At the same time, policymakers should strengthen carbon market construction and improve the corresponding laws and regulations to prepare for the coming wave of commercialization in the CCUS field.

5. Conclusions

We have provided a conclusive analysis for researchers, corporate investigators, and policymakers in the field of CCUS, as well as summarized the innovation trends, technological distribution, and topic evolution. The results show that CCUS entered the rapid development stage in 2013, with the annual growth rate of patent applications increasing yearly. China is gradually overtaking the United States and Japan to become the largest country in terms of CCUS patents. However, the United States still leads in patent quality, while China still has room for improvement. Large companies, especially in industries such as energy and electricity, hold many patents with a relatively stable network of cooperators. We identified 12 patent topics by clustering DII manual codes and found that CCUS not only realizes the transformation of carbon dioxide from waste to treasure but also realizes its diffusion from use in industry to being part of people’s daily life. In summary, these results provide valuable information and reference for policymakers, corporate investigators, investors, and researchers.
This article still has some limitations. First, this article only analyzes patentees but does not analyze the patent transfer among patentees. A patent is an essential innovation output; its transfer relationship often reflects the transfer of related technology, which is important for patentee analysis. In addition, limited by the data we obtained, this article does not consider the actual costs used for patent production and the actual revenue patents generate when conducting patent value assessment, which may have some influence on the patent value assessment process. Moreover, when analyzing patent topics and evolution in this article, no actual project examples were provided for patent topics and the latest hotspots. Finally, the patent data used in this article are from a specific database (Derwent Innovations Index), and not everyone has access.

Author Contributions

Conceptualization, Y.Z. and Y.W.; methodology, Y.Z. and Y.W.; software, Y.Z.; validation, Y.W.; formal analysis, Y.Z.; investigation, Y.Z. and Y.W.; resources, Y.Z. and Y.W.; data curation, Y.Z., Y.X., and Y.W.; writing—original draft preparation, Y.Z.; writing—review and editing, Y.Z., Y.X., Y.W., and B.Z.; supervision, Y.X., Y.W., B.Z., X.H.; project administration, Y.X., X.H., and Y.W.; funding acquisition, Y.X. and X.H. All authors have read and agreed to the published version of the manuscript.

Funding

This research was supported by the Fundamental Research Funds for the Central Universities (No. WK2040000046) and National Natural Science Foundation of China (Grant No. GG9990001041).

Institutional Review Board Statement

Not applicable.

Informed Consent Statement

Not applicable.

Data Availability Statement

All data generated or analyzed during this study are included in this published article.

Conflicts of Interest

The authors declare no conflict of interest.

References

  1. John, M. Environmental Sustainability: A Definition for Environmental Professionals. J. Environ. Sustain. 2011, 1, 2. [Google Scholar]
  2. Alsarhan, L.M.; Alayyar, A.S.; Alqahtani, N.B.; Khdary, N.H. Circular Carbon Economy (CCE): A Way to Invest CO2 and Protect the Environment, a Review. Sustainability 2021, 13, 11625. [Google Scholar] [CrossRef]
  3. Grunig, M.; Mazzi, D.; Calanca, P.; Karger, D.; Pellissier, L. Crop and forest pest metawebs shift increased linkage and suitability overlap under climate change. Commun. Biol. 2020, 3, 233. [Google Scholar] [CrossRef]
  4. Sabine, C.L.; Feely, R.A.; Gruber, N.; Key, R.M.; Lee, K.; Bullister, J.L.; Wanninkhof, R.; Wong, C.S.; Wallace, D.W.R.; Tilbrook, B. The oceanic sink for anthropogenic CO2. Science 2004, 305, 367–371. [Google Scholar] [CrossRef]
  5. Zhang, Y.; Chu, Z.; Song, D. Review of the Law Popularizing Education on Administrative Compulsion in Response to Major Epidemic Situations in China. Sustainability 2022, 14, 6853. [Google Scholar] [CrossRef]
  6. Climate Ambition Summit 2020. Available online: https://www.climateambitionsummit2020.org/index.php#watch (accessed on 2 February 2023).
  7. IEA. CCUs in Clean Energy Transitions; IEA: Paris, France, 2019. [Google Scholar]
  8. Bajpai, S.; Shreyash, N.; Singh, S.; Memon, A.R.; Sonker, M.; Tiwary, S.K.; Biswas, S. Opportunities, challenges and the way ahead for carbon capture, utilization and sequestration (CCUS) by the hydrocarbon industry: Towards a sustainable future. Energy Rep. 2022, 8, 15595–15616. [Google Scholar] [CrossRef]
  9. IEA. CCUS in the Transition to Net-Zero Emissions. Available online: https://www.iea.org/reports/ccus-in-clean-energy-transitions/ccus-in-the-transition-to-net-zero-emissions (accessed on 2 February 2023).
  10. Yang, Y.C.; Tao, H.S.; Yang, J.H.; Shang, Q.H.; Cao, S.G. Research on CO2 quality pipeline transportation based on Yanchang Oilfield CCUS. Matec Web Conf. 2017, 100, 02004. [Google Scholar] [CrossRef]
  11. Zhang, S.; Zhuang, Y.; Liu, L.L.; Zhang, L.; Du, J. Optimization-based approach for CO2 utilization in carbon capture, utilization and storage supply chain. Comput. Chem. Eng. 2020, 139, 106885. [Google Scholar] [CrossRef]
  12. Kim, I.; Yoo, Y.; Son, J.; Park, J.; Huh, I.S.; Kang, D. Two-step mineral carbonation using seawater-based industrial wastewater: An eco-friendly carbon capture, utilization, and storage process. J. Mater. Cycles Waste Manag. 2020, 22, 333–347. [Google Scholar] [CrossRef]
  13. Hussin, F.; Aroua, M.K. Recent trends in the development of adsorption technologies for carbon dioxide capture: A brief literature and patent reviews (2014–2018). J. Clean. Prod. 2020, 253, 119707. [Google Scholar] [CrossRef]
  14. Hanifa, M.; Agarwal, R.; Sharma, U.; Thapliyal, P.C.; Singh, L.P. A review on CO2 capture and sequestration in the construction industry: Emerging approaches and commercialised technologies. J. CO2 Util. 2023, 67, 102292. [Google Scholar] [CrossRef]
  15. Theeyattuparampil, V.V.; Vidican, G.; Al-Saleh, Y. Challenges and opportunities for the emerging carbon capture, utilisation and storage innovation system in the United Arab Emirates. Int. J. Innov. Learn. 2014, 13, 284–307. [Google Scholar] [CrossRef]
  16. Budzianowski, W.M. Implementing carbon capture, utilisation and storage in the circular economy. Int. J. Glob. Warm. 2017, 12, 272–296. [Google Scholar] [CrossRef]
  17. Zhang, Z.; Wang, T.; Blunt, M.J.; Anthony, E.J.; Park, A.H.A.; Hughes, R.W.; Webley, P.A.; Yan, J. Advances in research on carbon capture, utilization and storage. Appl. Energy 2020, 278, 115627. [Google Scholar] [CrossRef]
  18. Zhang, W.W.; Dai, C.Y.; Luo, X.M.; Ou, X.M. Policy incentives in carbon capture utilization and storage (CCUS) investment based on real options analysis. Clean Technol. Environ. Policy 2021, 23, 1311–1326. [Google Scholar] [CrossRef]
  19. Rong, J.; Peng, B.; Liu, Q.; Jia, J.H. Influence of carbon market on carbon capture, utilization and storage industrialization development. Thermal Power Generation 2021, 50, 43–46. [Google Scholar]
  20. Song, D.D.; Jiang, T.; Rao, C.P. Review of Policy Framework for the Development of Carbon Capture, Utilization and Storage in China. International. J. Environ. Res. Public Health 2022, 19, 16853. [Google Scholar] [CrossRef]
  21. Bae, J.; Chung, Y.; Lee, J.; Seo, H. Knowledge spillover efficiency of carbon capture, utilization, and storage technology: A comparison among countries. J. Clean. Prod. 2020, 246, 119003. [Google Scholar] [CrossRef]
  22. Jiang, K.; Ashworth, P. The development of Carbon Capture Utilization and Storage (CCUS) research in China: A bibliometric perspective. Renew. Sustain. Energy Rev. 2021, 138, 110521. [Google Scholar] [CrossRef]
  23. Tapia, J.F.D.; Lee, J.Y.; Ooi, R.E.; Foo, D.C.; Tan, R.R. A review of optimization and decision-making models for the planning of CO2 capture, utilization and storage (CCUS) systems. Sustain. Prod. Consum. 2018, 13, 1–15. [Google Scholar] [CrossRef]
  24. Osman, A.I.; Hefny, M.; Maksoud, M.I.A.A.; Elgarahy, A.M.; Rooney, D.W. Recent advances in carbon capture storage and utilisation technologies: A review. Environ. Chem. Lett. 2021, 19, 797–849. [Google Scholar] [CrossRef]
  25. Zhang, H.J.; Li, D.; Gu, X.; Chen, N. Three decades of topic evolution, hot spot mining and prospect in CCUS Studies based on CitNetExplorer. Chin. J. Popul. Resour. Environ. 2022, 20, 91–104. [Google Scholar] [CrossRef]
  26. Nawaz, M.; Suleman, H.; Maulud, A.S. Carbon Capture and Utilization: A Bibliometric Analysis from 2007–2021. Energies 2022, 15, 6611. [Google Scholar] [CrossRef]
  27. Zhang, Z.; Hu, G.W.; Mu, X.Z.; Kong, L. From low carbon to carbon neutrality: A bibliometric analysis of the status, evolution and development trend. J. Environ. Manag. 2022, 322, 116087. [Google Scholar] [CrossRef] [PubMed]
  28. Da Cruz, T.T.; Balestieri, J.A.P.; Silva, J.M.D.; Vilanova, M.R.N.; Oliveira, O.J.; Avila, I. Life cycle assessment of carbon capture and storage/utilization: From current state to future research directions and opportunities. Int. J. Greenh. Gas Control. 2021, 108, 103309. [Google Scholar] [CrossRef]
  29. Costa, L.P.D.M.; de Miranda, D.M.V.; de Oliveira, A.C.C.; Falcon, L.; Pimenta, M.S.S.; Bessa, I.G.; Wouters, S.J.; Alndrade, M.; Pinto, J. Capture and Reuse of Carbon Dioxide (CO2) for a Plastics Circular Economy: A Review. Processes 2021, 9, 759. [Google Scholar] [CrossRef]
  30. Maghzian, A.; Aslani, A.; Zahedi, R. Review on the direct air CO2 capture by microalgae: Bibliographic mapping. Energy Rep. 2022, 8, 3337–3349. [Google Scholar] [CrossRef]
  31. Zahedi, R.; Aslani, A.; Seraji, M.A.N.; Zolfaghari, Z. Advanced bibliometric analysis on the coupling of energetic dark greenhouse with natural gas combined cycle power plant for CO2 capture. Korean J. Chem. Eng. 2022, 39, 11. [Google Scholar] [CrossRef]
  32. Zolfaghari, Z.; Aslani, A.; Moshari, A.; Malekli, M. Direct air capture from demonstration to commercialization stage: A bibliometric analysis. Int. J. Energy Res. 2021, 46, 383–396. [Google Scholar] [CrossRef]
  33. Kang, J.N.; Wei, Y.M.; Liu, L.C.; Wang, J.W. Observing technology reserves of carbon capture and storage via patent data: Paving the way for carbon neutral. Technol. Forecast. Soc. Change 2021, 171, 120933. [Google Scholar] [CrossRef]
  34. Choi, H.; Woo, J. Investigating emerging hydrogen technology topics and comparing national level technological focus: Patent analysis using a structural topic model. Appl. Energy 2022, 313, 118898. [Google Scholar] [CrossRef]
  35. Kang, J.N.; Zhang, Y.L.; Chen, W.M. Delivering negative emissions innovation on the right track: A patent analysis. Renew. Sustain. Energy Rev. 2022, 158, 112169. [Google Scholar] [CrossRef]
  36. Miguez, J.L.; Porteiro, J.; Perez-Orozco, R.; Patino, D.; Rodriguez, S. Evolution of CO2 capture technology between 2007 and 2017 through the study of patent activity. Appl. Energy 2018, 211, 1282–1296. [Google Scholar] [CrossRef]
  37. Malekli, M.; Aslani, A.; Zolfaghari, Z.; Zahedi, R.; Moshari, A. Advanced bibliometric analysis on the development of natural gas combined cycle power plant with CO2 capture and storage technology. Sustain. Energy Technol. Assess. 2022, 52, 102339. [Google Scholar] [CrossRef]
  38. Cardoso, L.O.; Procópio, D.P.; Borrego, B.B.; Gracioso, L.H.; Stevani, C.V.; Freire, R.S.; do Nascimento, C.A.; Perpetuo, E.A. Overview of CO2 Bioconversion into Third-Generation (3G) Bioethanol-a Patent-Based Scenario. BioEnergy Res. 2022. [Google Scholar] [CrossRef]
  39. Severo, I.A.; dos Santos, A.M.; Depra, M.C.; Barin, J.S.; Jacob-Lopes, E. Microalgae photobioreactors integrated into combustion processes: A patent-based analysis to map technological trends. Algal Res. Biomass Biofuels Bioprod. 2021, 60, 102529. [Google Scholar] [CrossRef]
  40. Sharifzadeh, M.; Triulzi, G.; Magee, C.L. Quantification of technological progress in greenhouse gas (GHG) capture and mitigation using patent data. Energy Environ. Sci. 2019, 12, 2789–2805. [Google Scholar] [CrossRef]
  41. Miguez, J.L.; Porteiro, J.; Perez-Orozco, R.; Patino, D.; Gomez, M.A. Biological systems for CCS: Patent review as a criterion for technological development. Appl. Energy 2020, 257, 114032. [Google Scholar] [CrossRef]
  42. Yang, X.; Yu, X. Preventing Patent Risks in Artificial Intelligence Industry for Sustainable Development: A Multi-Level Network Analysis. Sustainability 2020, 12, 8667. [Google Scholar] [CrossRef]
  43. Zhang, G.Y.; Tang, C.Y.; Qi, Y. Alliance Network Diversity and Innovation Ambidexterity: The Differential Roles of Industrial Diversity, Geographical Diversity, and Functional Diversity. Sustainability 2020, 12, 1041. [Google Scholar] [CrossRef]
  44. Jin, L.L.; Sun, X.Z.; Ren, H.Q.; Huang, H. Hotspots and trends of biological water treatment based on bibliometric review and patents analysis. J. Environ. Sci. 2023, 125, 774–785. [Google Scholar] [CrossRef] [PubMed]
  45. Ye, Q.; Umer, Q.; Zhou, R.T.; Asmi, A.; Asmi, F. How publications and patents are contributing to the development of municipal solid waste management: Viewing the UN Sustainable Development Goals as ground zero. J. Environ. Manag. 2022, 325, 116496. [Google Scholar] [CrossRef]
  46. Pan, X.; Xiao, Z.T.; Guo, X.; Chen, Y. Research on foreign anti-terrorism intelligence early warning based on visual measurement. Adv. Intell. Syst. Comput. 2021, 12, 326–337. [Google Scholar]
  47. Dong, Y.Q.; Dong, Z.J. Bibliometric Analysis of Game Theory on Energy and Natural Resource. Sustainability 2023, 15, 1278. [Google Scholar] [CrossRef]
  48. Yang, K.H.; Ai, C.T. Visualising the Knowledge Domain of Reverse Logistics and Sustainability Performance: Scientometric Mapping Based on VOSviewer and CiteSpace. Sustainability 2023, 15, 1105. [Google Scholar] [CrossRef]
  49. Zema, T.; Sulich, A.; Grzesiak, S. Charging Stations and Electromobility Development: A Cross-Country Comparative Analysis. Energies 2023, 16, 32. [Google Scholar] [CrossRef]
  50. Sulich, A.; Sołoducho-Pelc, L. Changes in Energy Sector Strategies: A Literature Review. Energies 2022, 15, 7068. [Google Scholar] [CrossRef]
  51. Van Eck, N.J.; Waltman, L. Software survey: VOSviewer, a computer program for bibliometric mapping. Scientometrics 2010, 84, 523–538. [Google Scholar] [CrossRef]
  52. Ziegler, C.; Sinigaglia, T.; Martins, M.E.S.; Souza, A.M. Technological Advances to Reduce Apis mellifera Mortality: A Bibliometric Analysis. Sustainability 2021, 13, 8305. [Google Scholar] [CrossRef]
  53. Marion, T.; Welborn, M.; Della Porta, A.; Schoch, J.; Konda, S. Publication Productivity Using H-Index to Evaluate Academic Success Among Fellowship-Trained Mohs Surgeons. Dermatol. Surg. 2022, 49, 25–28. [Google Scholar] [CrossRef]
  54. Jones, B.M.; Rowley, J.P.; Sindhu, K.K.; Lehrer, E.J.; Hsieh, K.; Nehlsen, A.D.; Green, S.; Goodman, K.A. Gender Differences in the Research Productivity of Radiation Oncology Resident Graduates in the United States: 2015 to 2019. Adv. Radiat. Oncol. 2023, 8, 101135. [Google Scholar] [CrossRef] [PubMed]
  55. Changsha Zichen Technology Development Corporation Website. Available online: http://cszckj.com.cn/intro/1.html (accessed on 2 February 2023).
  56. Pittel, B.; Spencer, J.; Wormald, N. Sudden emergence of a giant k-core in a random graph. J. Comb. Theory Ser. B 1996, 67, 111–151. [Google Scholar] [CrossRef]
  57. Zhao, Q.; Shen, X.L.; Kun, D. Comparative analysis on technologies between Chinese and American large-sized oil companies based on patentometrics. J. Scientometr. Res. 2014, 3, 68–74. [Google Scholar]
  58. Wang, X.W.; Xu, S.M.; Peng, L.; Hu, Z.G. Structural Analysis of Technology Network Based on Patent Co-classification Analysis: 1971–2010. J. China Soc. Sci. Tech. Inf. 2013, 32, 198–205. [Google Scholar]
  59. Alves, M.; Grignard, B.; Mereau, R.; Jerome, C.; Tassaing, T.; Detrembleur, C. Organocatalyzed coupling of carbon dioxide with epoxides for the synthesis of cyclic carbonates: Catalyst design and mechanistic studies. Catal. Sci. Technol. 2017, 7, 2651–2684. [Google Scholar] [CrossRef]
  60. Lan, D.H.; Fan, N.; Wang, Y.; Gao, X.; Zhang, P. Recent advances in metal-free catalysts for the synthesis of cyclic carbonates from CO2 and epoxides. Chin. J. Catal. 2016, 37, 826–845. [Google Scholar] [CrossRef]
  61. Liu, H.L.; Zhu, Y.T.; Ma, J.M.; Zhang, Z.C.; Hu, W.P. Recent advances in atomic-level engineering of nanostructured catalysts for electrochemical CO2 reduction. Adv. Funct. Mater. 2020, 30, 1910534. [Google Scholar] [CrossRef]
  62. Liu, Y.; Chen, Y.; Gao, Z.R.; Zhang, X.; Zhang, L.J.; Wang, M.; Chen, B.; Diao, Y.; Li, Y.; Xiao, D.; et al. Embedding high loading and uniform Ni nanoparticles into silicalite-1 zeolite for dry reforming of methane. Appl. Catal. B Environ. 2022, 307, 121202. [Google Scholar] [CrossRef]
  63. Niazi, M.; Hussain, A. Agent-based computing from multi-agent systems to agent-based models: A visual survey. Scientometrics 2011, 89, 479–499. [Google Scholar] [CrossRef]
  64. Bicheng, D.; Adnan, N.; Harji, M.B.; Ravindran, L. Evolution and hotspots of peer instruction: A visualized analysis using CiteSpace. Educ. Inf. Technol. 2022. [Google Scholar] [CrossRef]
  65. Jin, Y.L.; Xu, Y.; Li, R.; Zhao, C.; Yuan, Z.H. Comprehensive Evaluation of China’s Input–Output Sector Status Based on the Entropy Weight-Social Network Analysis Method. Sustainability 2022, 14, 14588. [Google Scholar] [CrossRef]
  66. Liu, H.L.; Zhu, C.X.; Cao, X.; Hsu, Y. The Sustainability Evaluation of Masks Based on the Integrated Rank Sum Ratio and Entropy Weight Method. Sustainability 2022, 14, 5706. [Google Scholar] [CrossRef]
  67. Gao, Y.X.; Dong, X.F.; Han, F.; Li, Z.Y. An Optimization Model for a Desert Railway Route Scheme Based on Interval Number and TOPSIS. Appl. Sci. 2022, 12, 10728. [Google Scholar] [CrossRef]
  68. Fan, R.L.; Zhang, H.L.; Gao, Y. The global cooperation in asteroid mining based on AHP, entropy and TOPSIS. Appl. Math. Comput. 2023, 437, 127535. [Google Scholar] [CrossRef]
  69. Liu, G.Z.; Cai, B.F.; Li, Q.; Zhang, X.; Ouyang, T. China’s pathways of CO2 capture, utilization and storage under carbon neutrality vision 2060. Carbon Manag. 2022, 13, 435–449. [Google Scholar] [CrossRef]
Figure 1. Overall flowchart of the literature review.
Sustainability 15 03484 g001
Figure 2. Patent bibliometric analysis flowchart of this article.
Sustainability 15 03484 g002
Figure 3. Annual trend in the number of patents.
Sustainability 15 03484 g003
Figure 4. (a) TA trend of major priority countries. (b) TC trend of major priority countries. (c) AC trend of major priority countries. (d) H trend of major priority countries.
Sustainability 15 03484 g004
Figure 5. Patentee cooperation network visualization.
Sustainability 15 03484 g005
Figure 6. DII manual code co-occurrence matrix visualization.
Sustainability 15 03484 g006
Figure 7. DII manual code clustering result.
Sustainability 15 03484 g007
Figure 8. DII manual code time-zone distribution map.
Sustainability 15 03484 g008
Table 1. The top 10 priority countries by the number of patents.
CountriesTA (%)TCACHAYS
China7102 (61.56%)98521.39221993
USA1739 (15.08%)106856.14491971
Japan1056 (9.15%)35233.34251971
South Korea562 (4.87%)7761.38121986
EPO173 (1.50%)10255.92161999
Germany125 (1.08%)6194.9511964
India123 (1.07%)460.3741999
UK123 (1.07%)4523.67121975
Australia85 (0.74%)4645.46102001
France61 (0.53%)4106.72101984
TA (%) the total number of patents and percentage; TC total citations; AC average citations; H H-index; AYS the start year of patent application; EPO European Patent Office.
Table 2. The top 20 patentees by the number of patents.
PatenteePatentee NameCountryTA (%)TCACHAYS
MITO-CMitsubishi GroupJapan164 (1.08%)11917.26171982
BAKO-CBaker Hughes INTEQUSA160 (1.05%)3722.33102008
CHHN-CChina Huaneng GroupChina120 (0.79%)1321.1072012
SNPC-CChina Petroleum and Chemical CorporationChina105 (0.69%)1671.5971999
TOKE-CToshiba CorporationJapan75 (0.49%)3815.08121980
SGCC-CState Grid Corporation of ChinaChina64 (0.42%)691.0852014
ESSO-CExxon CorporationUSA57 (0.37%)3426.00101983
UYXJ-CXi’an Jiaotong UniversityChina53 (0.35%)911.7262011
ISHI-CIshikawajima-Harima Heavy IndustriesJapan50 (0.33%)2334.6681989
UYZH-CZhejiang UniversityChina50 (0.33%)851.7052007
KANT-CKansai Electric Power CompanyJapan49 (0.32%)58912.02141991
GENE-CGeneral Electric CompanyUSA46 (0.30%)2635.7272005
UYSE-CSoutheast UniversityChina45 (0.30%)1733.8472007
HITA-CHitachi LimitedJapan42 (0.28%)1082.5771986
SAOI-CSaudi Arabian Oil CompanyKingdom of Saudi Arabia41 (0.27%)3508.54112005
CHAN-NonstandardChangsha Zichen Technology
Development Co., Ltd.
China38 (0.25%)370.9742017
UYMB-CChina University of Mining and
Technology
China38 (0.25%)320.8442010
CNPC-CChina National Petroleum CorporationChina36 (0.24%)471.3142010
UYQI-CTsinghua UniversityChina36 (0.24%)1072.9772005
KOER-CKorea Energy Research InstituteRepublic of Korea35 (0.23%)551.5752004
TA (%) the total number of patents and percentage; TC total citations; AC average citations; H H-index; AYS the start year of patent application; CHAN-Nonstandard Changsha Zichen Technology Dev Co Ltd.
Table 3. Patent disclosure countries of major patentees.
PatenteePatentee NameDisclosure Country and RegionTDTCACDYS
MITO-CMitsubishi GroupJapan14811697.901990
USA11410749.421994
EPO103105210.211989
Canada897908.881993
WIPO882923.322003
Australia877208.281993
Russia3342512.882004
USA1593682.312009
BAKO-CBaker Hughes INTEQWIPO1103082.802009
UK461312.852012
Brazil45881.962016
Norway451282.842012
Canada401744.352011
CHHN-CChina Huaneng GroupChina1201321.102013
WIPO221.002021
SNPC-CChina Petroleum and Chemical CorporationChina1051671.592001
WIPO2178.502010
USA2157.502012
TOKE-CToshiba CorporationJapan743815.151982
USA302026.731984
China191075.632011
Australia171126.592010
EPO161388.631998
TD the total number of patent application; TC the total citations; AC average citation; H H-index; DYS the start year of patent disclosure in this country/region; EPO European Patent Office; WIPO World Intellectual Property Organization.
Table 4. Major DII manual codes in co-occurrence network.
DII Manual CodeCountCentralityCounts RankCentrality RankTranslation
E31-N05C18530.1314Carbon dioxide
J01-E02B9500.1126Treatment of exhaust gases with solid adsorbents
J04-X3010.1871Plasma processes, Langmuir–Brogit processes, noncatalytic chemistry, miniaturized reactors, gas generators, and other chemical methods
E11-N2420.188Electrochemical processes and apparatus
E10-J02D11280.14162Methane
J01-E022290.09119Treatment of exhaust gases (general)
E11-Q01910.13235Separation, extraction, recovery, purification processes and apparatus
E11-Q01B6040.03429Decontamination by physical means
D05-A04A980.051915Fermentation of organic waste, municipal waste or sludge
L03-H05790.052516Vehicle related
E11-Q02760.083011Removal, wastewater treatment processes and apparatus
J01-E03770.052817Gas separation (general)
Counts co-occurrence count; Centrality betweenness centrality.
Table 5. DII manual code clustering topic terms.
Cluster IDSizeSilhouetteTop Terms (LLR)
#0990.76Absorption tower; recovering carbon dioxide; regeneration tower; waste gas; carbon dioxide recovery apparatus
#1850.822Reacting carbon monoxide; fuel cell; using catalyst containing; air line; catalyst composition
#2600.961Filtering liquid sample; color-forming reaction; detecting bacteria; Gram-negative bacteria; growth rate
#3560.885Absorption tower; active component; recovering carbon dioxide; regeneration tower; cabinet body
#4500.957Carbon dioxide; first channel; supporting column; active carbon; side wall
#5470.952Urea synthesis; deionized water; weak exchanger; gas channel; diesel exhaust gas
#6390.888Carbon dioxide; carbon source; producing biofuel; or oil; composite liquid fuel
#7350.936Hot water; carbon dioxide; rubber MFR; cyclone storage hopper; returning carbon
#8260.957Active carbon wastewater treatment; overflow pipe; catalytic conversion; technical hydrogen; two-phase separation
#9240.926Photosensitive material; charge-generating layer containing; carbon transporting layer containing; carbon transport layer containing; amorphous silicon
#10230.994Carbon dioxide; grain size; electrolyte sec; foamed metal; carbon powder
#11100.995Size; selective gel; subterranean formation; permeability profile control; using combination
Table 6. DII manual code translation in the time-zone distribution map.
YearDII Manual CodeTranslation
2000E31-N05C; J01-E02B; J04-X; J01-E03C; E10-E04E1; H09-C; E11-Q02; E11-Q01Carbon dioxide; treatment/separation of gases by solid sorbents; production of gases such as methanol; wastewater treatment; separation extraction recovery purification processes and equipment
2001J01-E02; E10-J02D1; D05-A04A; J01-E02A; H04-F02E; D05-H02Methane; organic waste; sludge fermentation; culture media; waste gas treatment by wet process; preparation of catalysts for petroleum processes.
2003E11-N; H04-EElectrochemical processes and equipment; other petroleum processes
2004E11-Q02B; E11-Q01B; E11-Q02C; E11-Q01A; E31-A02CIndustrial wastewater treatment; physical purification; chemical purification
2005J04-E04; D05-C; E11-F03; D04-A01F1Catalysts; preparation of chemicals by fermentation; alkylation; arylation; carbon atom acylation; carbon chain condensation, extension and reforming
2006E11-D02; E11-MHydrogenation; fermentation process and equipment
2007H09-F03; D05-A03Municipal and agricultural waste treatment; fermentation plants
2008J01-E; J01-E03Gas separation and treatment
2009J01-GSeparation of dispersed particles from gases and vapors
2010E10-B03B2; N07-JAmino alcohols; catalysts for reactions of inorganic products
2012H06-PFuel preparation
2013L03-H05Carriers
2014Q49-A; Q49-V35; N06-FMining and quarrying equipment; fluids, slurries; catalyst support
2015Q73-T07; A10-E05BTreatment and removal of combustion products; chemical modification by carbonization
2017P35-C03; D04-A01F2; J01-E02B3; Q69-T; J04-E11Nozzles, hoses, pumps and delivery systems; activated carbon handling; activated carbon; structural details and accessories for gas/liquid tanks; catalyst production
2018D04-A01; J04-E04AWater purification; redox catalyst
2020J01-G03B; P35-C01; P35-C05Regeneration/cleaning of filters specifically designed for exhaust gases; fire suppression equipment and methods; fire protection equipment and methods
2022T01-J05A2ABusiness model
Table 7. The top 20 high-value patents identified by the TOPSIS method.
Representative
Patent Number
Priority CountryPatentee NameYearTCRPRNPDCSFPatent TopicCCUS
Component
US2014260310-A1USAExxon Corporation2013134241161208Molten carbonate fuel cellCarbon capture/utilization
US2012276356-A1USABaker Hughes INTEQ201136693444418Composite downhole articleCarbon storage
US2013300066-A1USABaker Hughes INTEQ2012297384241118Metallic sealCarbon storage
US2009294366-A1USAGlobal Resource Technologies2005866163061127Carbon dioxide sorbentCarbon capture
US2013047784-A1USABaker Hughes INTEQ201166983611015Powder metal compactCarbon storage
US2014134736-A1USAUniversity of California Regents20111325439617Biological compound sulfate-reducing
system
Carbon storage
US2011296872-A1USAEisenberger P.201056688189742CO2 capture structureCarbon capture
NZ560757-ANew ZealandLanzaTech New Zealand Limited200765464173468Carbon capture bioreactorCarbon capture
WO2017197167-A1USAWilliam Marsh Rice University201691424151CO2 reduction equipmentCarbon utilization
WO2013034750-A2UKImperial Innovations Limited201127273614937Synthetic method of polycarbonateCarbon utilization
US2009200032-A1USAForet Plasma Labs LLC200726580211346Fossil fuel recovery deviceCarbon storage/utilization
US2009232861-A1USAGlobal Resource Technologies2008115313031013Method of removing CO2 from fluidCarbon capture
WO2006074945-A2GreeceAlkmy LTD200516388315112Production method of concrete aggregateCarbon utilization
US2010068109-A1USAComrie D.C.2006874631011346Method of removing CO2 from fluidCarbon capture
US2017043333-A1USACarbon Sink LLC2006243529742Materials that capture carbon dioxide from the ambient airCarbon capture
AU2006303828-A1AustraliaCalix Ltd200528154317315Calcination/ carbonization cycle treatment systemCarbon capture/utilization
US2012304858-A1USAGlobal Resource Technologies200739385262819Method of removing CO2 from fluidCarbon capture
US6148602-AUSANorthern Resources Energy Corporation199817918124Carbon dioxide waste gas separation deviceCarbon capture
US2010063902-A1USAConstantz B.R.20086051519328Carbon dioxide sequesterCarbon storage
US2012279397-A1USAWright A.B.2006439927482An apparatus comprises solid capture material exposed to ambient airCarbon capture/storage
TC the total citations; RP the reference number of patents; RNP the reference number of nonpatents; DC the number of DII manual codes; SF the number of patents in the same patent family.
Disclaimer/Publisher’s Note: The statements, opinions and data contained in all publications are solely those of the individual author(s) and contributor(s) and not of MDPI and/or the editor(s). MDPI and/or the editor(s) disclaim responsibility for any injury to people or property resulting from any ideas, methods, instructions or products referred to in the content.

