Article

Numerical Study on the Influence of Block Physical Characteristics on Landslide Migration Using Three-Dimensional Discontinuous Deformation Analysis

1
Lanzhou Institute of Seismology, China Earthquake Administration, Lanzhou 730000, China
2
National Forest Germplasm Resource Bank of Desert Plants in Minqin Desert Control Station of Gansu Province, Gansu Desert Control Research Institute, Lanzhou 733000, China
3
Postdoctoral Research Workstation, Gansu Desert Control Research Institute, Lanzhou 730070, China
4
State Key Laboratory Breeding Base of Desertification and Aeolian Sand Disaster Combating, Gansu Desert Control Research Institute, Lanzhou 730070, China
*
Author to whom correspondence should be addressed.
Sustainability 2023, 15(4), 3463; https://doi.org/10.3390/su15043463
Submission received: 14 January 2023 / Revised: 9 February 2023 / Accepted: 9 February 2023 / Published: 14 February 2023

Abstract

:
The physical characteristics of blocks have an important impact on the migration and deposition in landslides, so the damage of landslides to the surrounding environment often has great uncertainty. To explore how the physical properties of blocks affect the landslide movement, we used Compaq Visual Fortran software with a DDA program to simulate the movement of a block landslide in our study. The velocity and location changes of two types of blocks (triangular and square blocks) were simulated by comparison. The contents of the simulation included the following points: (1) the influence of block density and weight on migration, (2) the influence of the elastic-slip characteristics and spring penalty coefficient on velocity, and (3) interaction between block vertices and the sliding surface. The results showed how the shape and physical properties of the blocks affect the migration of those blocks. Although the triangular blocks appeared to be more stable than the square blocks, they only exhibited greater stability on the gentle slope. The weight and elastic modulus of the blocks could improve the velocity and destructive force, whereas the spring penalty coefficient between the blocks and the contact surface had an obscure effect on the velocity. However, the changes of the above three parameters all led to non-linear changes of velocity. The simulation results indicated that the blocks with different numbers of edges and surfaces had complex trajectories because of contact frequency and mobility. The results show that the physical properties of the blocks could be one of the factors that could ultimately change the displacement of landslides.

1. Introduction

A landslide is caused by the movement of a large amount of rock, debris, or soil moving along a slope with water, and it is characterized by long-runout displacement and high velocity with absence of control [1,2,3,4,5,6]. Massive landslides have been caused by earthquakes and geological orogeny in Qinghai, Sichuan, and Tibet, China [7,8,9,10,11]. Rock-dominated landslides have accounted for a considerable proportion of these events, often blocking traffic and rivers, and even costing many lives [12,13,14,15,16].
The rock motion is generally regarded as a combination of four basic forms: free fall, collision, bounce, rolling, and sliding. It can record the whole path from the start to the final position of rocks, and motivation process is the key content to study the rock landslides. Through the movement track, the space position can be determined, such as jumping height and lateral displacement. Then the rock movement track and deposition range can be used to determine the location of safety distance and protection facilities.
The behavior of a block system is remarkably dominated by geometric features, spatial distribution, size, orientation, and mechanical properties [17]. Asterius used field tests to research the sensitivity of influencing factors in movement characteristics of rock blocks [18]. Okura studied the relationship between the movement distance, deposit area center, and volume of rock blocks [19]. Spadari used a high-definition camera to analyze how the randomness of different impact positions of rock blocks led to large changes in block movement [20]. Chau used gypsum material to investigate the effect of the slope angle on the rock collision recovery coefficient and rotational energy [21]. Manzella has carried out a study on the energy dissipation caused by the movement of single rock blocks [22]. Many studies have shown that the transmission of momentum and kinetic energy caused by collisions of blocks will lead to greater uncertainty of the stationary or sedimentary positions [16,23,24].
Generally speaking, although the field tests use advanced equipment to simulate and obtain the velocity and trajectory of rock movement in some certain specific shapes, and has high reliability, it is difficult to analyze its impact on rock migration by changing the physical characteristics of rocks due to the long period of field test, high test costs, heavy manual work, and other reasons. The study on the influence of rock characteristics on landslide movement not only can improve the simulation accuracy of numerical simulation on individual landslides, but also provide a good basis for the study of regional landslide vulnerability evaluation, especially in mountainous areas with large differences in surface lithology, where the surface lithology can easily be divided into different rock forms and has different elasticity and other attribute characteristics [25,26,27,28,29,30], and these characteristics will make different surface lithologies have different contributions to the migration distance and range of landslide.
Discontinuous deformation analysis (DDA) regards a landslide as a collection of a large number of blocks distributed on a continuous surface, which not only can simulate the movement of a large number of blocks, but also track the trajectories of individual blocks [31,32,33,34,35]. The two-dimensional discontinuous deformation analysis (2D DDA), introduced by Shi in the early 1990s has rapidly developed and been used in many block-related studies [24,35,36]. After the 2D DDA model was used to successfully simulate landslide motion [33,37,38,39,40], the three-dimensional (3D DDA) model was also developed and used gradually in practical problems [32,34,41,42,43,44]. The continuous development of the 3D DDA method also facilitates the analysis of block characteristics in landslide movement. Based on this, the 3D DDA numerical analysis method was selected in our study, and the objectives were (1) to analyze the displacement and sedimentation of different types of blocks with different physical properties (triangular blocks and square blocks); (2) to quantify the impact of variations of relevant parameters for the block migration; and (3) to evaluate the random influence of different physical characteristics of blocks attribute to landslide migration. Through these analyses, the influencing factors of block migration could be further revealed by the variations of contact points and object parameters. The results of this study would provide a reference for landslide mechanism and hazard risk assessments.

2. Theory and Methods

2.1. DDA Method

The motion and deformation of the block described in the DDA model are composed of rigid body displacement, rotation, positive strain, and shear strain. In the discontinuous deformation analysis, the displacement of each block is taken as an unknown variable, and the block system is formed by the contact and geometric constraints between the blocks. The deformation of each block is calculated according to the relative displacement of the centroid of each block. The block elements are controlled by discontinuous surfaces. During the process of block movement, the contact or separation between block elements will occur, and the conditions of non-insertion and tension between block elements need to be satisfied at the same time [45]. Each block has 12 unknown variables, including translation, rotation, normal strain, and shear strain [46]. In this study, we used the following governing equations for the fluid phase under a fully Lagrangian framework to simulate the landslide velocity:
u v w = T i x , y , z D i
where  T i x , y , z  can be expressed as follows:
T i x , y , z = 1000 Z Y X 000 Z / 2 Y / 2 010 Z 0 X 0 Y 0 Z / 20 X / 2 001 Y X 000 Z Y / 2 X / 20
D T = u c v c w c r x r y r z ε x ε y ε z γ y z γ z x γ x y
where  X = x x c Y = y y c , and  Z = z z c .
The coordinates  x c , y c , z c  represent the centroids of the blocks. The vectors represent the displacements and deformations of the blocks. Each block has 12 displacement variables. Among them,  D i  and  F i  are matrices of 12  ×  1, and  k i j  is a matrix of 12  ×  12. Only by minimizing the total energy of the overall equilibrium equation can a unique solution be obtained. At this time, the form of the overall equilibrium equation can be expressed as follows:
k 11       k 12           k 1 n k 21       k 22           k 2 n     k n 1       k n 2           k n n D 1 D 2 D n = F 1 F 2   F n
Among the 12 unknown variables for each three dimensional block,  D n  indicates the variable vector of the block center associated with the displacements and deformations,  F i  is the conversion external force matrix,  k i i  depends on block material and spatial geometry, and  k i j  (i   j) is defined by the contact between blocks i and j. The block set in this study is an incompressible rigid body.
For the case of only one block, the equilibrium equation for each time step can be derived by minimizing the total potential energy [47].
E u = 0 ,   E   v = 0 ,   E w = 0
Equation (5) represents the equilibrium of all loads and contact forces acting on block i in three directions.
E r x = 0 ,   E   r y = 0 ,   E r z = 0  
Equation (6) represents the moment equilibrium of all loads and contact forces acting on the block i. Calculations are the same for  ε  and  γ .
The total potential energy is expressed as follows:
2 E d r i d s j = 0 ,         r , s = 1 ,       , 12
where d represents the deformation of the block, and all of Equation (7) forms a submatrix of 12  ×  12, which is submatrix of Equation (4). The composition of Equation (4) is a symmetric matrix.
E 0 d r i = 0 ,   r ,   s = 1 ,   ,   12
where E is the elastic strain energy in Equation (8). We can firstly calculate the elastic stress on a single block. The total potential energy is generated by initial stress, point load, volume load, specified displacement, and inertial force [48]. Then each potential energy is calculated by obtaining the derivative of the displacement variable, so that the load corresponding to each submatrix can be obtained, which is the submatrix in the global equation. All of Equation (8) forms a submatrix of 12  ×  1, which is the submatrix  F i  in Equation (4).

2.2. Contact Detection Scheme

The contact modes of 3D blocks can be classified into six types, including all the contact conditions for edges, faces, and vertices. The types of 3D contacts between polyhedral blocks, i.e., vertex-to-vertex (V-V), vertex-to-edge (V-E), vertex-to-face (V-F), cross edge-to-edge (E-E), parallel edge-to-edge (E-E), edge-to-face (E-F), and face-to-face (F-F), are more than the two-dimensional simulation analysis. Moreover, there exist infinite pairs for the E-E, E-F, and F-F contact types. Contact detection is usually performed in two stages, namely search and contact detection. First, adjacent search methods are available. Next, a pair of contact particles obtained from the search method is checked to search for possible contact points, and then the force between them is calculated.

2.3. Method of Determining Contact Points

To avoid searching for all vertices and edges, the nearest vertices of two particles are calculated, and the search continues between all faces. This search method follows the method of Jiang [49] and Nezami [50]. First, we need to find the distance between the two vertices within the tolerance range (the tolerance is twice the maximum displacement in each time step) for this model, and then we calculate the projection of vertices obtained from all possessive contact points. If the point is within a given polygon, then this point is regarded as a contact point. Then the detection is over. If the point is outside the polygon, the search needs to be further continued and performed until the nearest point of the adjacent surface is found. If the nearest point exists, we will re-judge the projection of the vertex obtained from the possessive contact point.

2.4. Judgment of Block Contact

According to the position of projection, we can judge the possible contact type. For example, if three or more points are within the tolerance range, the face-to-face contact type is applicable. If two points from the same edge are within the tolerance range, the edge-to-edge contact type is applicable. If only one vertex is within the tolerance range, the vertex-to-face contact type is applicable. By combining the closest geometric elements on the two blocks and comparing the distance between the closest point pairs, the type of contact between the two blocks and the closest point pair, the position of the point pair and the direction of contact can be determined.
When a point-to-face contact occurs, the normal spring with a stiffness of P is introduced into the formulation to return the point to the surface along the shortest distance. When using the augmented Lagrangian method, the normal contact force at the contact points can be accurately calculated by iteratively calculating the Lagrange multipliers [51]. When the case of edge-to-face or point-to-face appears in the judgment type, the effects of contact can be represented by applying two rigid contact springs in the normal and tangent directions.
There are three possible contact states for each contact:
When the vertical component of contact force is stretched, the expression is as follows:
F n = p d n 0  
In this case, no locking and no rigid springs are applied, and the state is open.
When the vertical component of the contact force is pressure and the shear component force is large enough, the contact point will relatively slide [52]. The expression is as follows:
F n F s t a n φ + c l  
where  F s  is shear force,  φ  is friction angle,  F n  is normal force, C is residual force, and c and l are the length and viscous force of the contact surface, respectively.
At this time, a rigid spring perpendicular to the surface needs to be applied to allow the contact points to slide with each other, and a friction force is applied in the sliding direction. The friction force is determined by the normal contact force in the previous iteration.
When the vertical component of the contact force is pressure and the shear component force is less than Coulomb’s friction, the contact point will be locked. The expression is as follows:
F n F s t a n φ + c l  

2.5. Calculation of Normal Force

When point-to-face contact occurs, we introduce the parameter  P n  to return the normal force at the shortest distance to obtain the normal force. Moreover, we use the augmented Lagrangian method [51] to calculate the updated data of the normal forces. The updated formula can be written as follows:
λ λ k n + 1 = λ k n + P n d n  
The penalty coefficient does not change much. In it,  d n  is the shortest distance from point to face. We suppose that  P 1  is the vertex of block before the displacement increment.
d n =   n · P 1 P 2  
P 1 P 2 = x 1 x 2 y 1 y 2 z 1 z 2 + u 1 v 1 w 1 · D i u 1 v 1 w 1 · D i  
where  n  is the unit vector point out of the block.
Through the iteration of normal force, the potential energy of the normal spring is given by the following equation:
E n = λ k n d n + 1 2 P n   d n 2  
The above equation consists of two parts. The first term is the strain energy caused by Lagrange multiplier, and the second term is the strain energy caused by penalty factor. By deriving the equation of minimum strain energy, we can get their contributions to the block system.
Through expanding the right side of Equation (15) and minimizing  E n  by taking derivatives, four submatrices are obtained in the global equilibrium equation. The derivatives of  E n  from a 12 × 12 submatrix are added to the submatrix  K i i  in Equation (4). Moreover,  K j j  and  K j i  in Equation (4) are obtained by the similar method.
k t d i = 2 E d t i d d i   t d = 1 ,   2 ,   12  
The derivative of  E n  at value 0 is as follows:
f r i = E n 0 d r i       r = 1 ,   2 ,   , 12  
f r i = E n 0 d r i   i = 1 ,   2 ,   , 12
Both of them constitute two submatrices of 12  ×  1, which are added to [ F i ] and [ F j ].
( λ n k n + P n · G ) H i F i  
( λ n k n + P n · G ) Q i F j  
The final interaction of normal force of the block i and j can be obtained by the iterative method.

2.6. Calculation of Shear Force

Suppose the point  P 0  represents the projection of  P 1  on the contact surface, and the point  P  represents the new position after the displacement increment. So, the motivation of shear direction can be expressed as follows:
d s = P 0 P 1 2 d n 2  
The potential energy of shear force can be expressed by the following equation:
s c = 1 2 P s d s 2  
By combining Equation (15), we derive Equations (23) and (24):
F i = P s T i T x 1 x 0 y 1 y 0 z 1 z 0 + P s G H i T  
F j = P s T j T x 1 x 0 y 1 y 0 z 1 z 0 + P s G Q j T  

2.7. Calculation of Frictional Force

It can be seen from Equation (15) that the frictional force is calculated from the normal contact compressive force of the previous step.
L   = P 0 P 1 P 0 P 1 , n ^ n ^  
f = F · d L L  
where d can be represented as follows:
d = T i x 1 ,   y 1 ,   z 1 · D i T j x 0 ,   y 0 ,   z 0 · D j  
where  F i  can be represented as follows:
F i = F 1 L T i x 1 ,   y 1 ,   z 1 T L T
F j = F 1 L T j x 1 ,   y 1 ,   z 1 T L T
Both of them are added to the global force vector. Then we obtain the sliding force of the interaction between the two blocks.

2.8. Calculation of Block Rotation

Since the motivation of the block mainly includes sliding and rotation, the block itself is regarded as a rigid body with no deformation. The displacement of the block can be expressed as follows:
u = u 0 + x x 0 c o s r 0 1 y y 0 s i n r 0 v = v 0 + x x 0 s i n r 0 y y 0 c o s r 0 1  
when the angle of rotation is very small, Equation (30) can be changed into a linear displacement function:
u = u 0 y y 0 r 0 v = v 0 + x x 0 r 0  
The application of Equation (30) can improve the computational efficiency, but it may cause some errors. Therefore, we use Equation (30) to prove the result of Equation (31) in some interval iterations, which not only ensures the efficiency but also reduces the errors.

3. Terrain Settings

We took a field landslide as a typical case to check the model and then simulate and analyze the changes of block movement and sedimentary area caused by the differences in the characteristics of different blocks. The landslide disaster occurred in Xinmo Village, Mao County, in 24 June 2017. The disaster killed 10 people, and 73 people went missing. The maximum fall of the landslide was about 1400 m, the sliding distance was about 2500 m, and the width of the upper landslide was about 400 m. The landslide body consisted of a large number of rock blocks. Under the action of gravity, a large number of falling rock blocks in the lower part of the landslide still had a great speed when they reached the flat or even depressed area, and they caused great destruction and uncertainty [40]. The sweep range of actual blocks was defined as the final deposit range of landslide in this study. The terrain and contact types are shown in Figure 1.
Figure 1a shows the terrain mesh and contact modes used in this study. The whole mesh was divided into 600 terrain units and 12,160 edges. Each vertex had a definite Z value to determine the coordinates. The slope and orientation could be calculated based on the 3D coordinates of each point.
The contact mode of a block on the terrain is displayed in Figure 1b. The model selected the closest contact point or edge according to height difference. In the sag state of the depression, it was very difficult for this to occur in the case of E-E or E-F. The model simulated the trajectory and velocity of each block in the form of a square and a triangle. The density of each block was 2000 kg/m3, the size of the square particles was 8 m3, the volume of triangular particles was 7.77 m3, and the volumes of the two shapes were 320 m3 and 310.8 m3, respectively.

4. Validation of Parameters

To ensure that the simulation results were in accord with the actual situation, the movement time and deposition-range data of the Xinmo landslide were used to calibrate and the model parameters. The Compaq Visual Fortran software with DDA program was used to run the result. The obtained vertex coordinates were graphed in MATLAB software. In terms of the effect of the step size on the contact displacement, a smaller step size is associated with smaller contact displacement. We used the movement time to calibrate the friction angle and viscous force parameters. We used a theoretical value and an analog value to correct the friction angle. The formula used is as follows:
s = 1 2 a t 2 = 1 2 g s i n α g c o s α t a n Φ t 2  
The average slope of the simulated landslide was 26.56°. According to the landslide-vibration records near the Xinmo landslide [53], the entire landslide lasted 121 s from the start to scattered accumulation. The main sliding process lasted nearly 60 s, and the running distance of the landslide was approximately 2236 m; according to Formula (32), the value of the friction angle was obtained as 24.89°. So, the friction angle was set as 25° in this study.
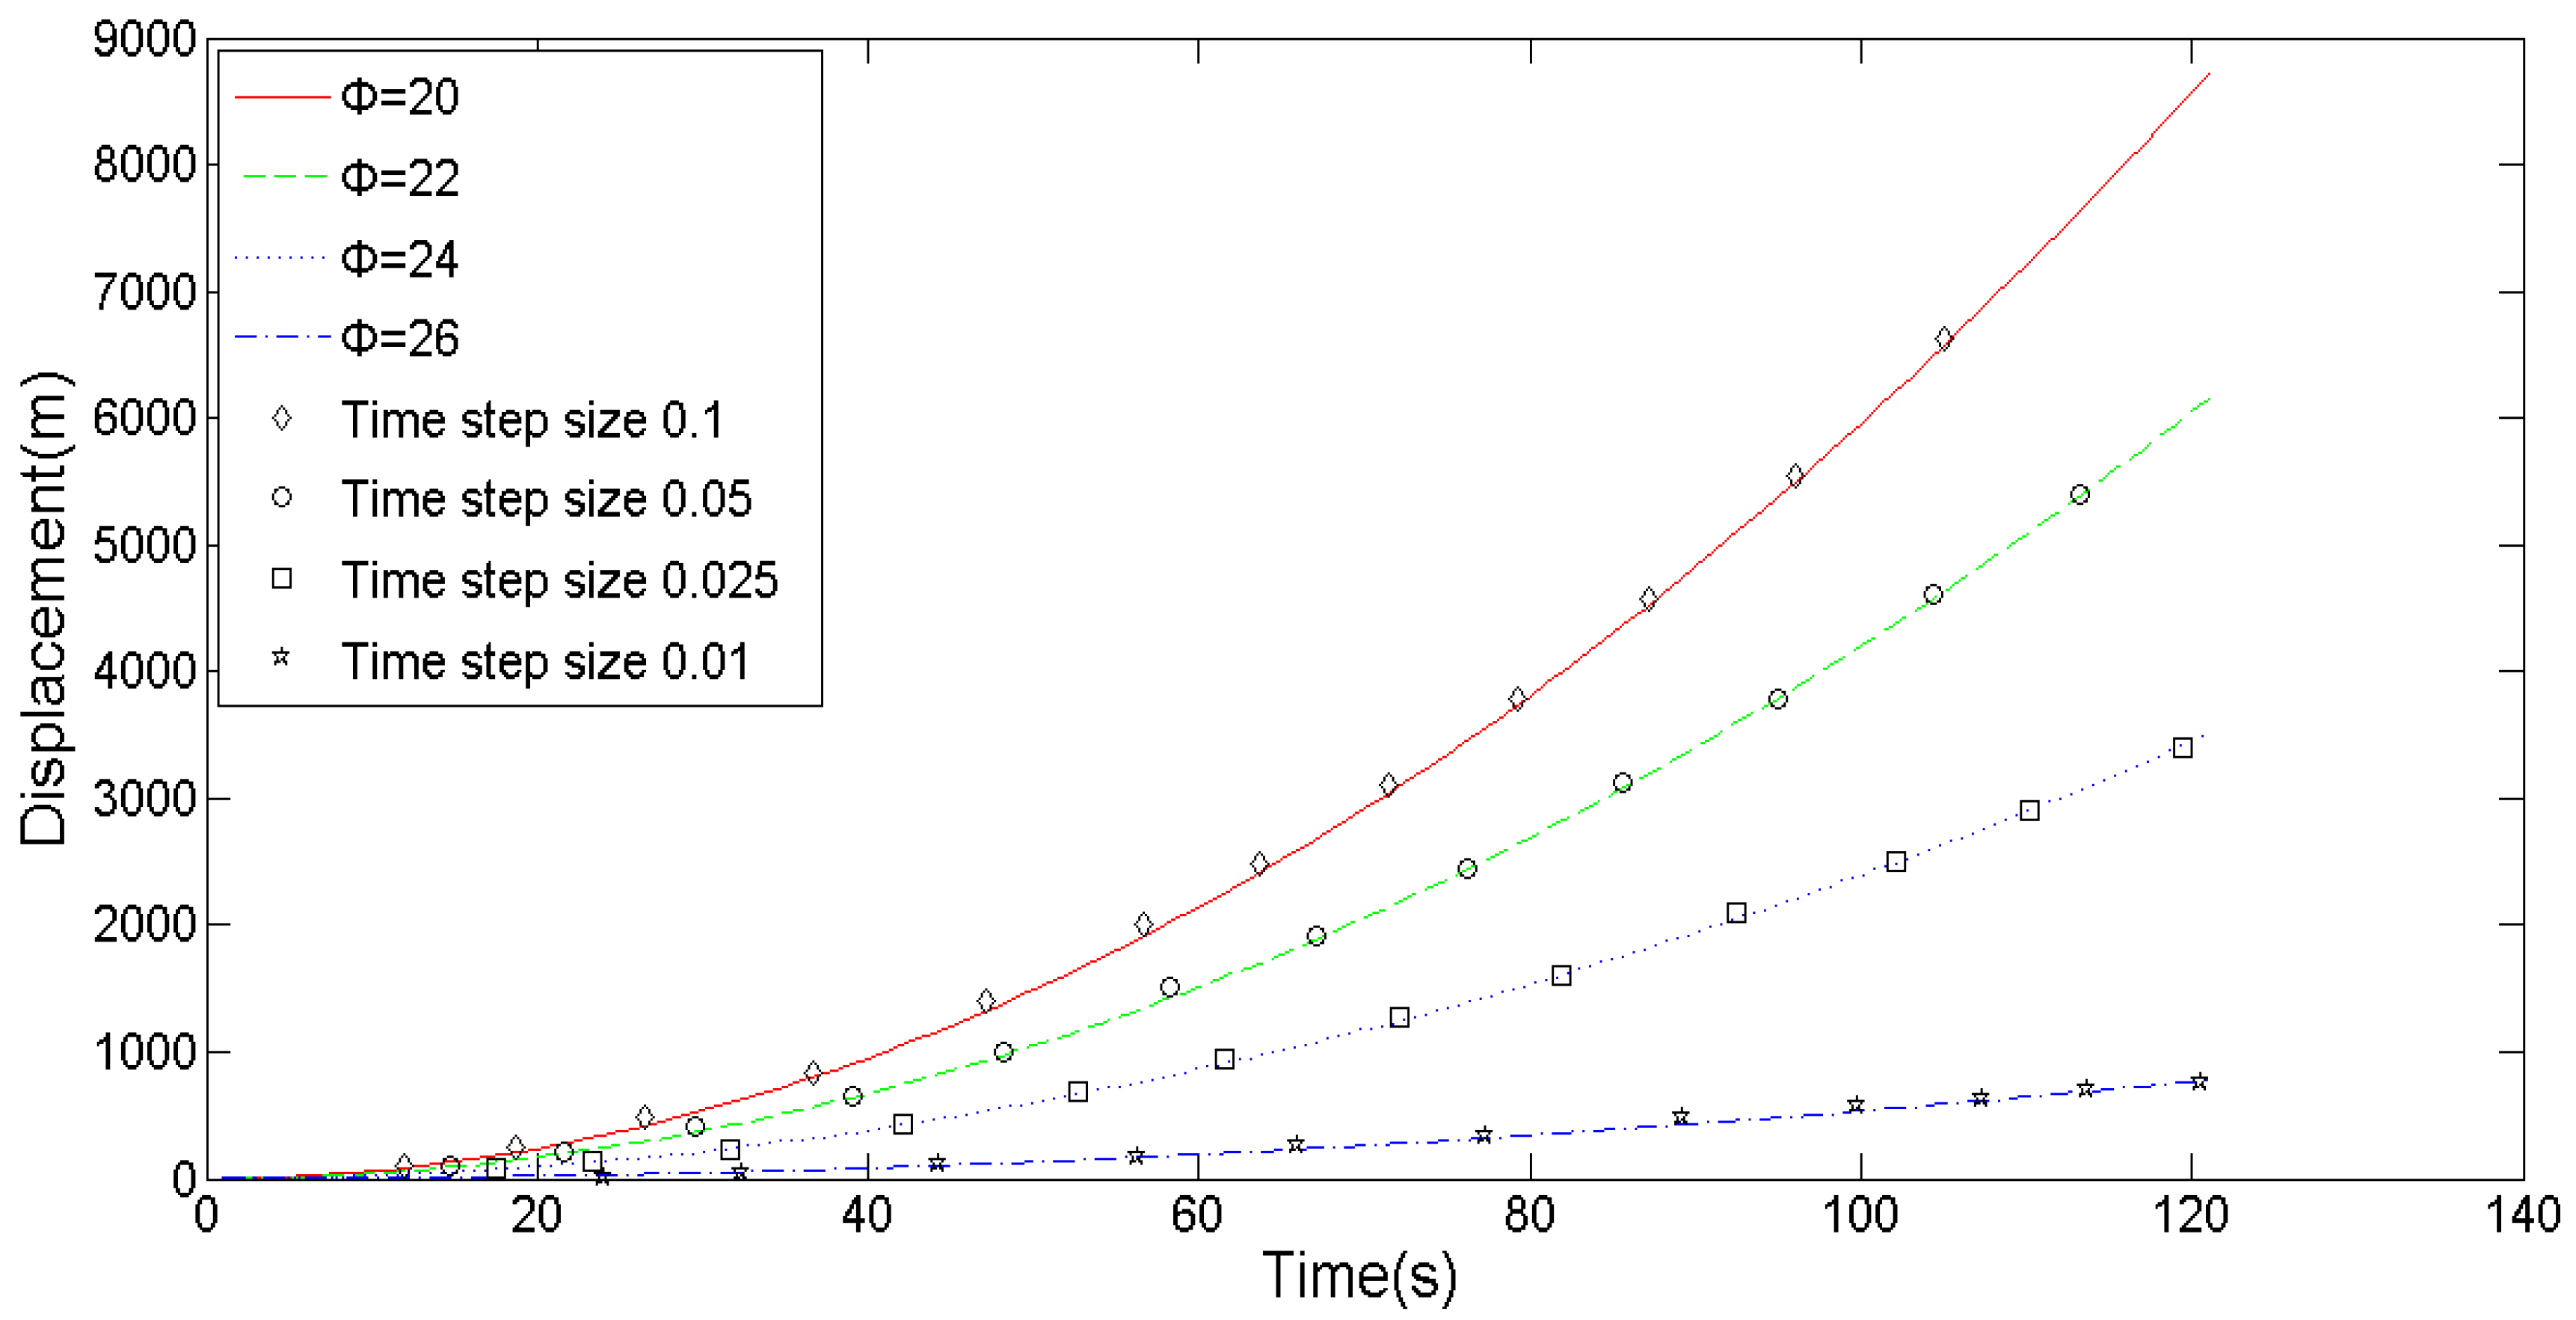
Four friction angle values were studied, 20°, 22°, 24°, and 26° (Figure 2), and the total displacement amounts were calculated up to 121 s. With the 20° friction angle, the block displacement during the studied time period was very large compared with the other cases. This trend would remain the same for different time intervals with the actual time-step sizes used in the numerical model, which are typically in the range of 0.01–0.1 s. However, this had no obvious effect on the accuracy of the analytical solution.
To increase simulation accuracy, the maximum displacement in a time step was limited by the upper limit of the time interval used in each time step, which prevented excessive displacement.
We simulated the effects of different elastic moduli and penalty coefficients or spring stiffness on the simulation results. The calculation results showed that when the elastic modulus was between 1 and 20 GPa, the iteration time step was 0.01–0.1 s, and the spring stiffness was between 1 and 1000 N/m; the single block displacement obtained by the DDA simulation was consistent with the theoretical results, and the relative error between the numerical solution and the analytical solution was within 2%. The displacement of the block decreased with the increase of the cohesive force. In this study, we set the viscosity as 0 between the blocks and the landslide surface.

5. Results and Discussion

5.1. Results of Analysis

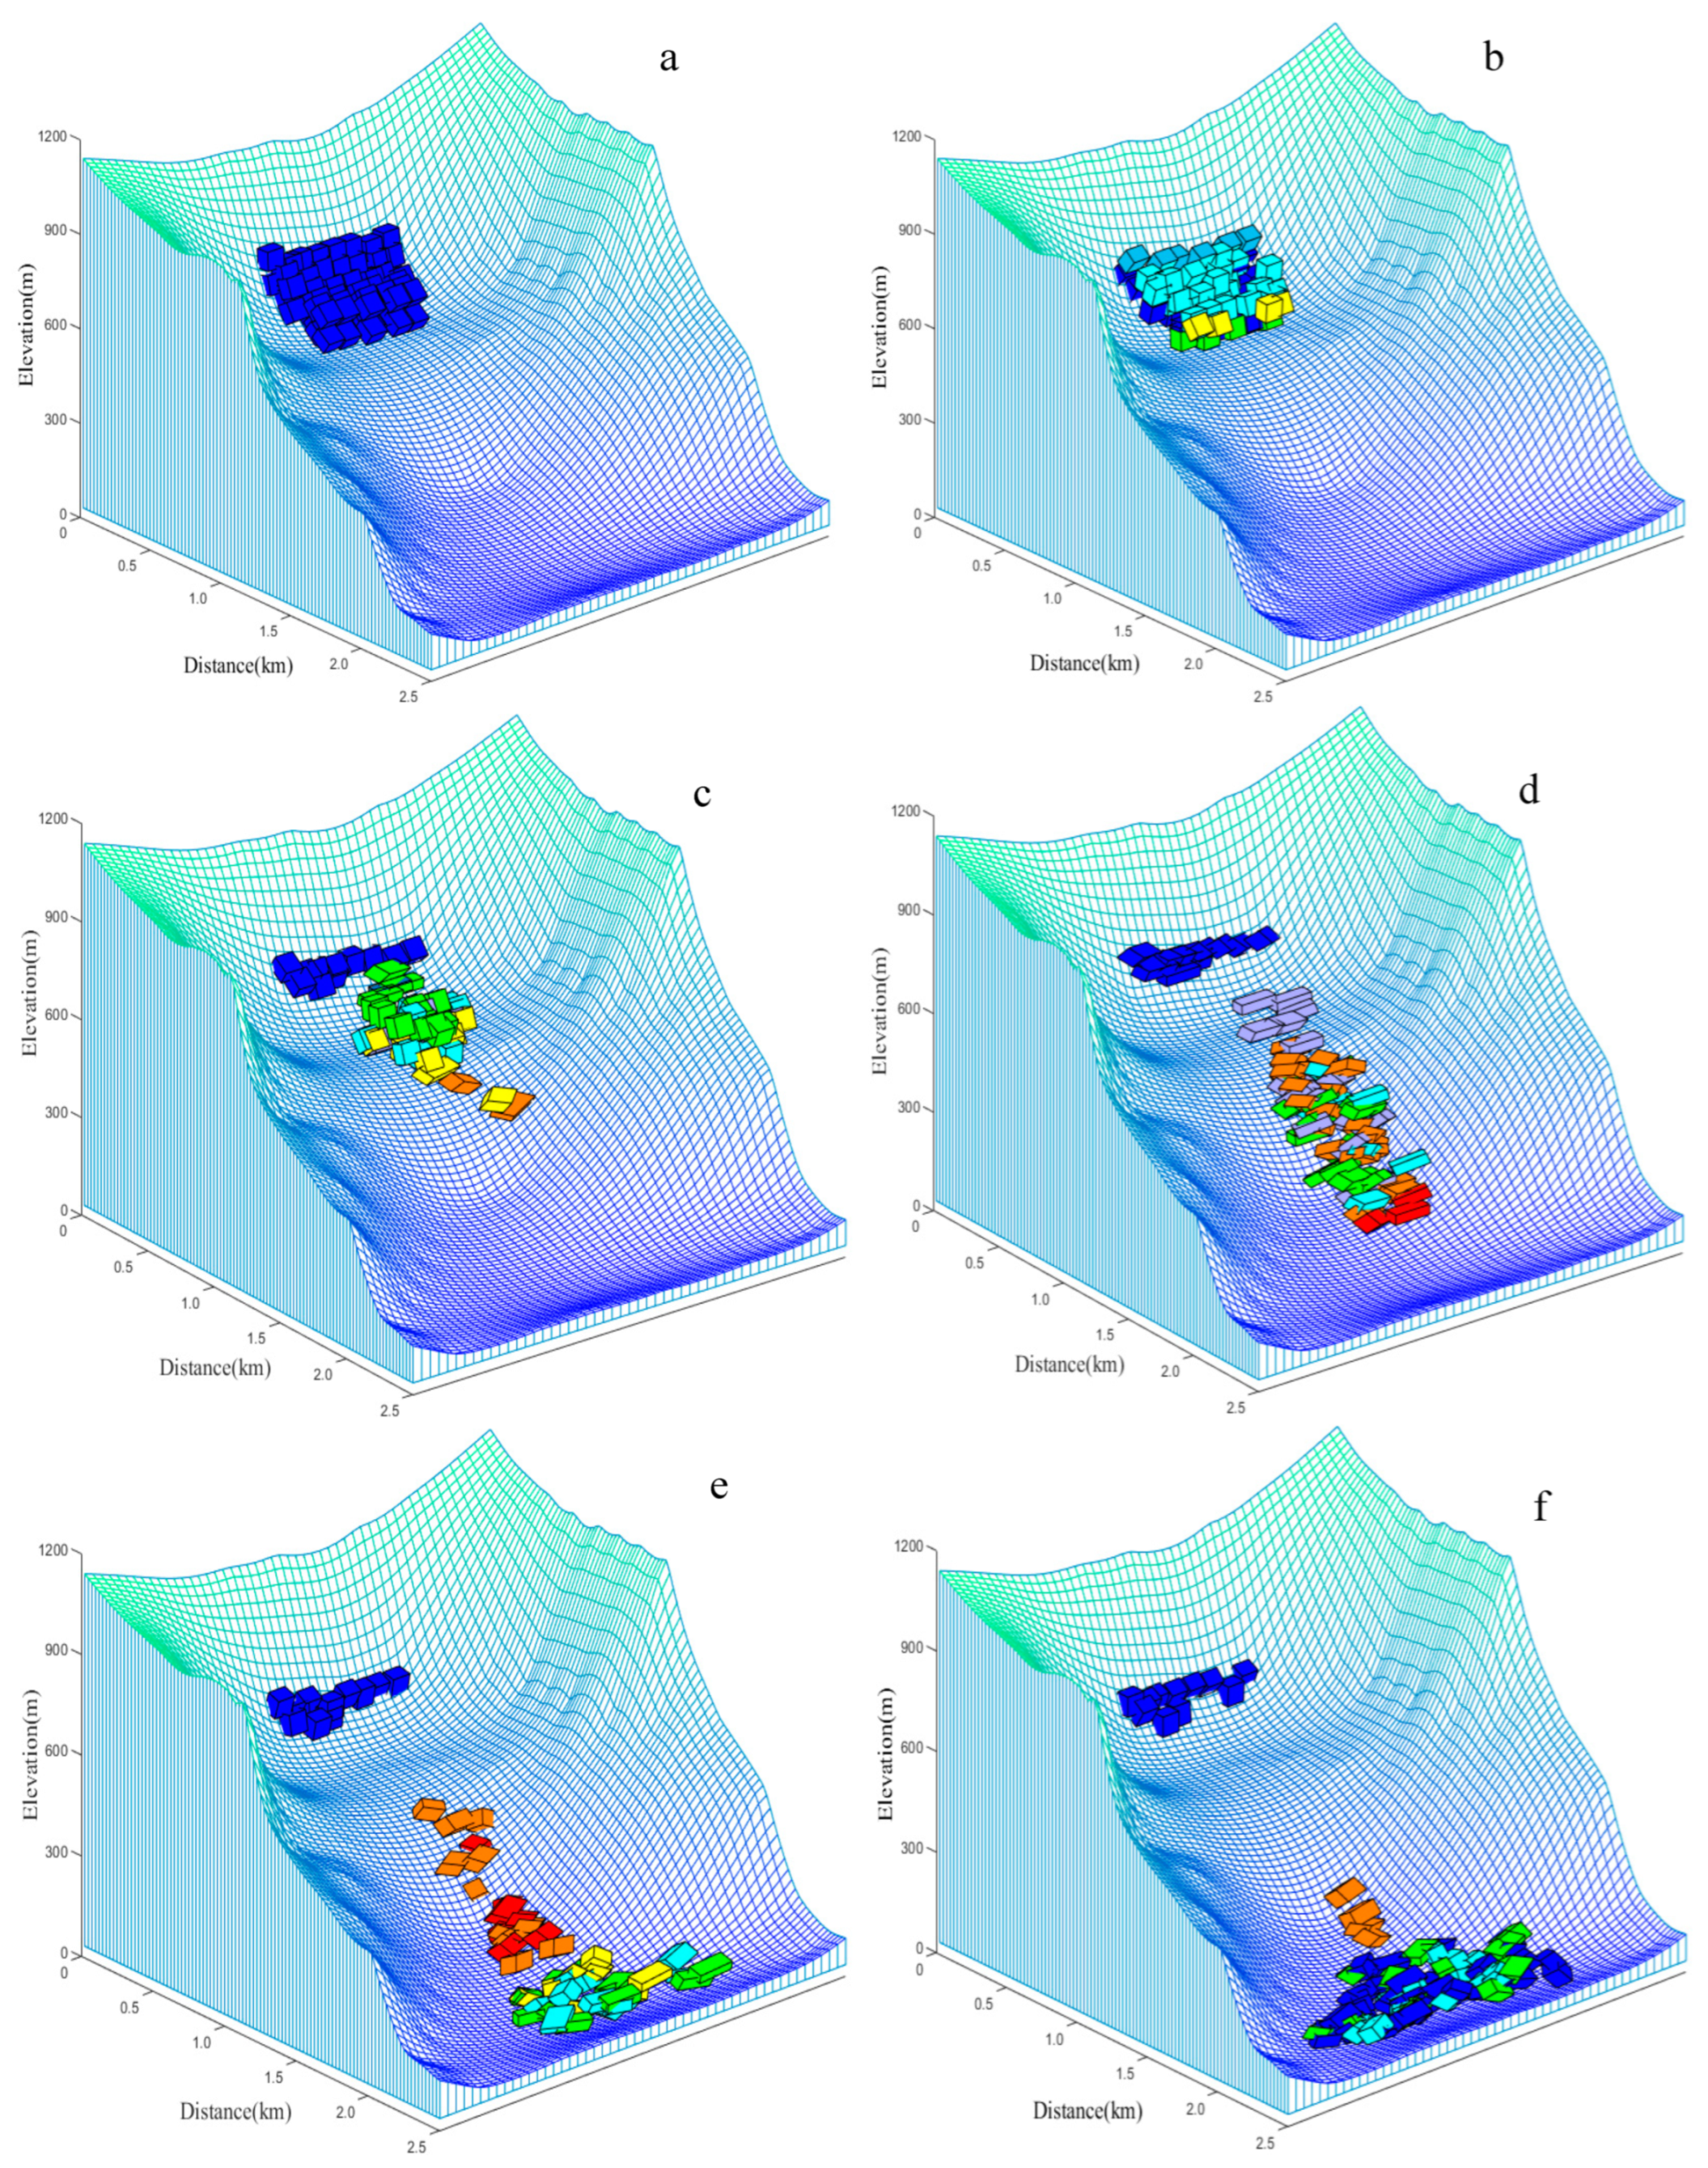
Figure 3 presents an example of a landslide simulation of square block motion on the 3D topography. The time series of each stage was 0 s, 5 s, 20 s, 30 s, 45 s, and 60 s, respectively. Figure 3a shows the positions of 40 square blocks stacked on the slope at the beginning. The state before sliding is displayed in Figure 3a, and the block velocities at 5 s after the start of the movement are demonstrated in Figure 3b. It could be seen that the blocks began to move under the action of oblique downward gravity. The blocks at the front end moved faster than those at the back end. The reason was that the back-end blocks temporarily stagnated owing to the blocking effect of the front-end blocks. In addition, the faster acceleration of the blocks on both sides was related to the smaller friction resistance caused by the steeper position of the blocks. The motion state of the blocks at 20 s is indicated in Figure 3c. The velocity of individual blocks at the front end became faster, and then the blocking effect of the front-end blocks on the back-end blocks decreased gradually. Thus, the whole body of blocks began to accelerate, and the blocks at the back end were concentrated in the middle because of the topographic effect. Figure 3d shows that most of the blocks were in the steep slope state, and the blocks in this stage increased the kinetic energy conversion frequency of the interaction between blocks.
Most of the sliding blocks reached the gentle position at the bottom of landslide in Figure 3e. The velocity of blocks in the sag location decreased greatly, but most of the blocks did not reach or come close to the static state. The maximum velocity here was nearly 31 m/s. The velocity of the blocks on the steep slope was close to the maximum potential energy conversion speed and was greater, reaching a maximum velocity of 56 m/s.
The velocity of most of blocks was close to static at the time step shown in Figure 3f. The early deposited blocks acted as great obstacles to the later blocks, so the later blocks rushed to the both sides, filling the low-lying positions of the entire recessed area. It was worth noting that some individual blocks within the deposition zone had higher velocities, including not only some blocks in the upper layer, but also some blocks in the lower layer, which seemed to be inconsistent with the actual situation. In fact, this was due to the momentum transfer caused by the collision between the rear blocks and the interior blocks, which made individual some blocks possess a certain velocity at current moments. However, it was difficult for individual blocks to move farther because of the obstruction of other blocks.
Figure 4 presents an example of a landslide simulation of triangular block motion on the 3D topography. Figure 4a shows a state of accumulation before sliding, the block trajectory 5 s after the start of the movement is demonstrated in Figure 4b. Compared with the square blocks, the distribution of the velocity was quite different, and mixed velocity distributions appeared on the surface of the whole body of blocks. This situation was mainly caused by the inconsistent contact form between triangular blocks, as well as the joint action of surface friction and penalty coefficients. The main contact form between triangular blocks was vertex-to-face contact, and this contact form obviously increased the abnormal change of regional acceleration. Figure 4c exhibits the velocity distribution before the blocks entered steep slope. The acceleration of the front triangular blocks was lower than that of square blocks, and the phenomenon of local velocity deceleration was related to the sliding friction on the landslide caused by the strong stability of the triangle. Figure 3d shows the accelerated stage of the blocks. Compared with the square blocks, the bounce height of the triangular blocks is lower. Therefore, there are fewer blocks with a speed of more than 36 m/s.
The influence of block shape on velocity decreased on the landslide surface with a large angle. At the lower part of the steep slope, the triangular blocks still had a relatively high velocity close to 48 m/s. Figure 4e indicates that most of the blocks were deposited in the depression position, and the velocity tended to be stable. A few individual red blocks might have been related to the fact that they rarely consumed contact potential energy with other blocks in motion. Compared with the downstream velocity distribution of the square blocks in Figure 4e, the velocity deceleration of the triangular blocks was faster. The migration of triangular blocks seemed to be faster than that of square blocks, although some square blocks remained on the steep slope at 45 s. Most of the triangular blocks remain stationary at the gentle slope, indicating that the block movement was mainly in a sliding state. Because the blocks with more edges and angles had more contact with the sliding surface, the higher the penalty coefficient, the greater the energy loss of the blocks. Figure 4f confirms that most of the triangular blocks decelerated faster in the downstream flat zone, and their mosaic shape structure led to static status being reached faster.
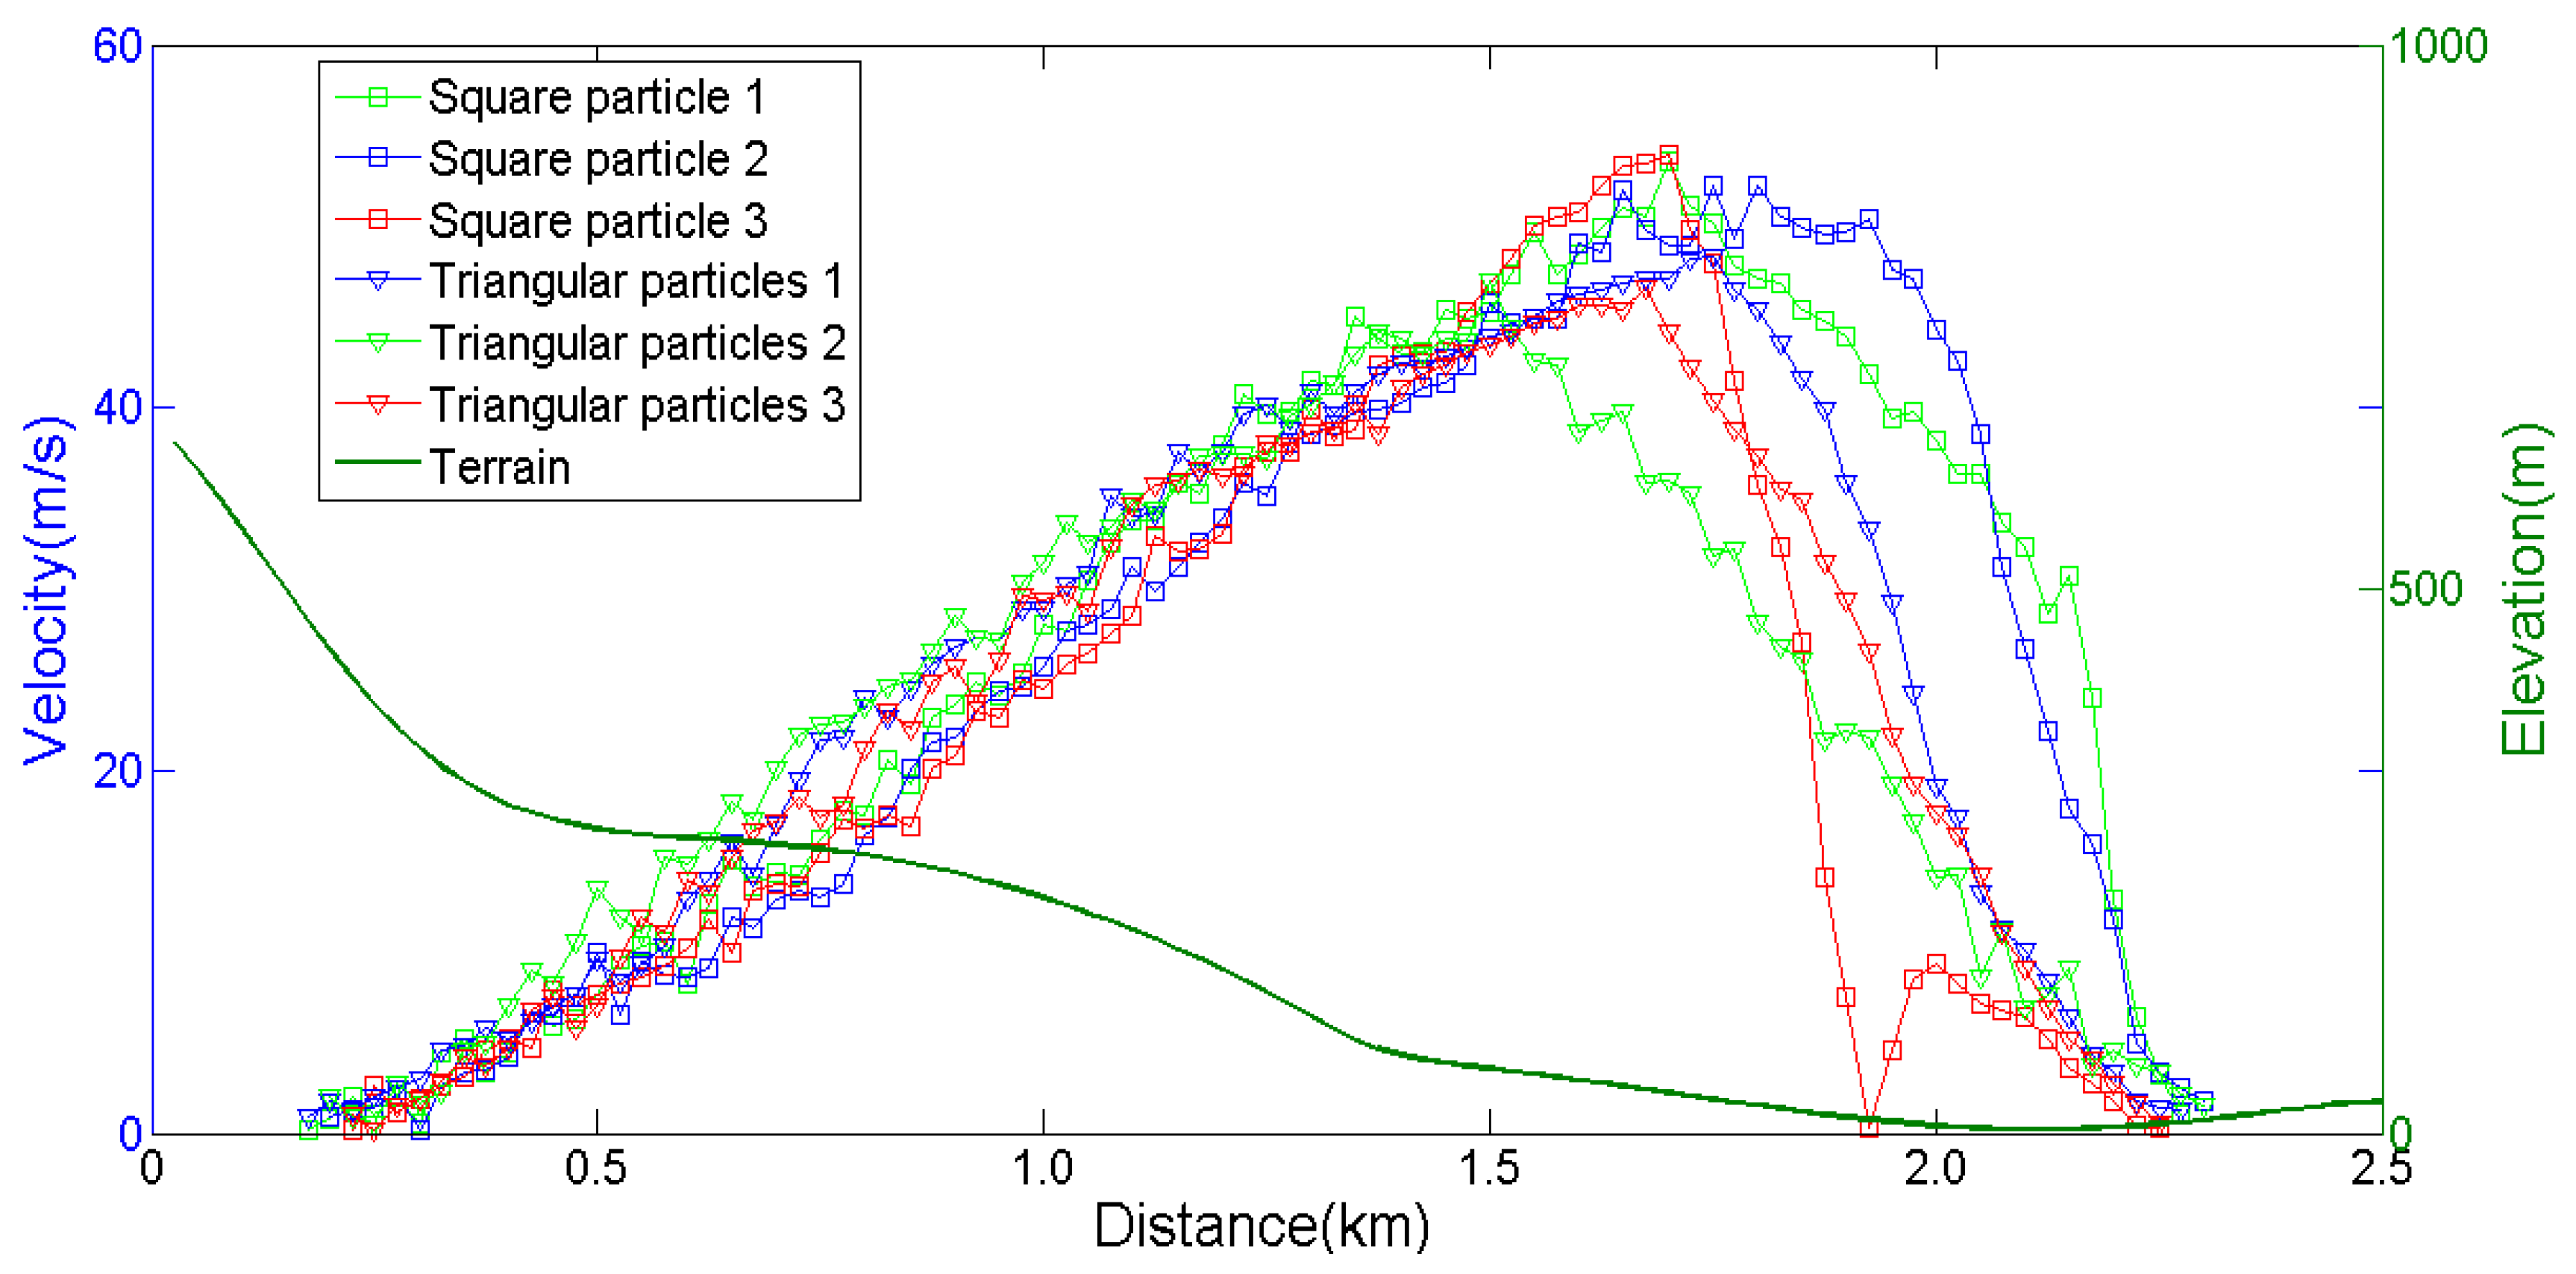
To compare the differences of velocity variations of individual blocks between the two simulations, we selected three blocks from each of the two simulations (Figure 5). The vertices of the six blocks ultimately approached the static state. The starting positions of the selected vertices were similar to those of the sedimentary location. The same starting vertex was not selected because of different trajectories and velocity distributions, which also showed the uncertainty of the migration of the landslide in the block medium [54,55].
From the comparison results, we found that there was no obvious difference in the velocity between the triangular and square block sat the beginning of the stage. Although the velocity fluctuation and acceleration of individual triangular blocks were larger than those of square blocks, the velocity difference between them was small before the 0.6 km position. Because the sliding friction had a greater influence on the blocks and led to a greater energy loss, the velocity of the two types of blocks began to differ obviously after 1.5 km. When the blocks approached the gentle slope at 1.6 km, the deceleration effect of the triangular blocks was more obvious than that of the square blocks. This situation revealed that when blocks reached flat terrain, sliding had become the main mode of motion for the triangular blocks, whereas rolling was still the main mode of motion for the square blocks, thus indicating that the block shape and contact surface both had a great influence on the speed and distance of the landslide blocks. Figure 5 shows that individual square blocks stagnated (red square line in Figure 5) and then began to move again. The standard deviation of velocity and displacement of the square block was 15.3% and 7.2%, respectively, while that of the triangular block was 11.3% and 6.4% respectively, suggesting that the spatial variation of the velocity of the square block was larger than that of the triangle block during the progress of movement, the range of the sedimentary area was also larger, and the risk to the downstream was higher. This also shows that the shape of the rock landslide really plays an important role in migration.

5.2. Sensitivity Analysis of Parameter

To analyze the influence of the physical characteristics on the velocity and deposition, we simulated the average velocity variation by changing major three parameters, namely the density of the blocks, the penalty coefficient, and the elasticity modulus.
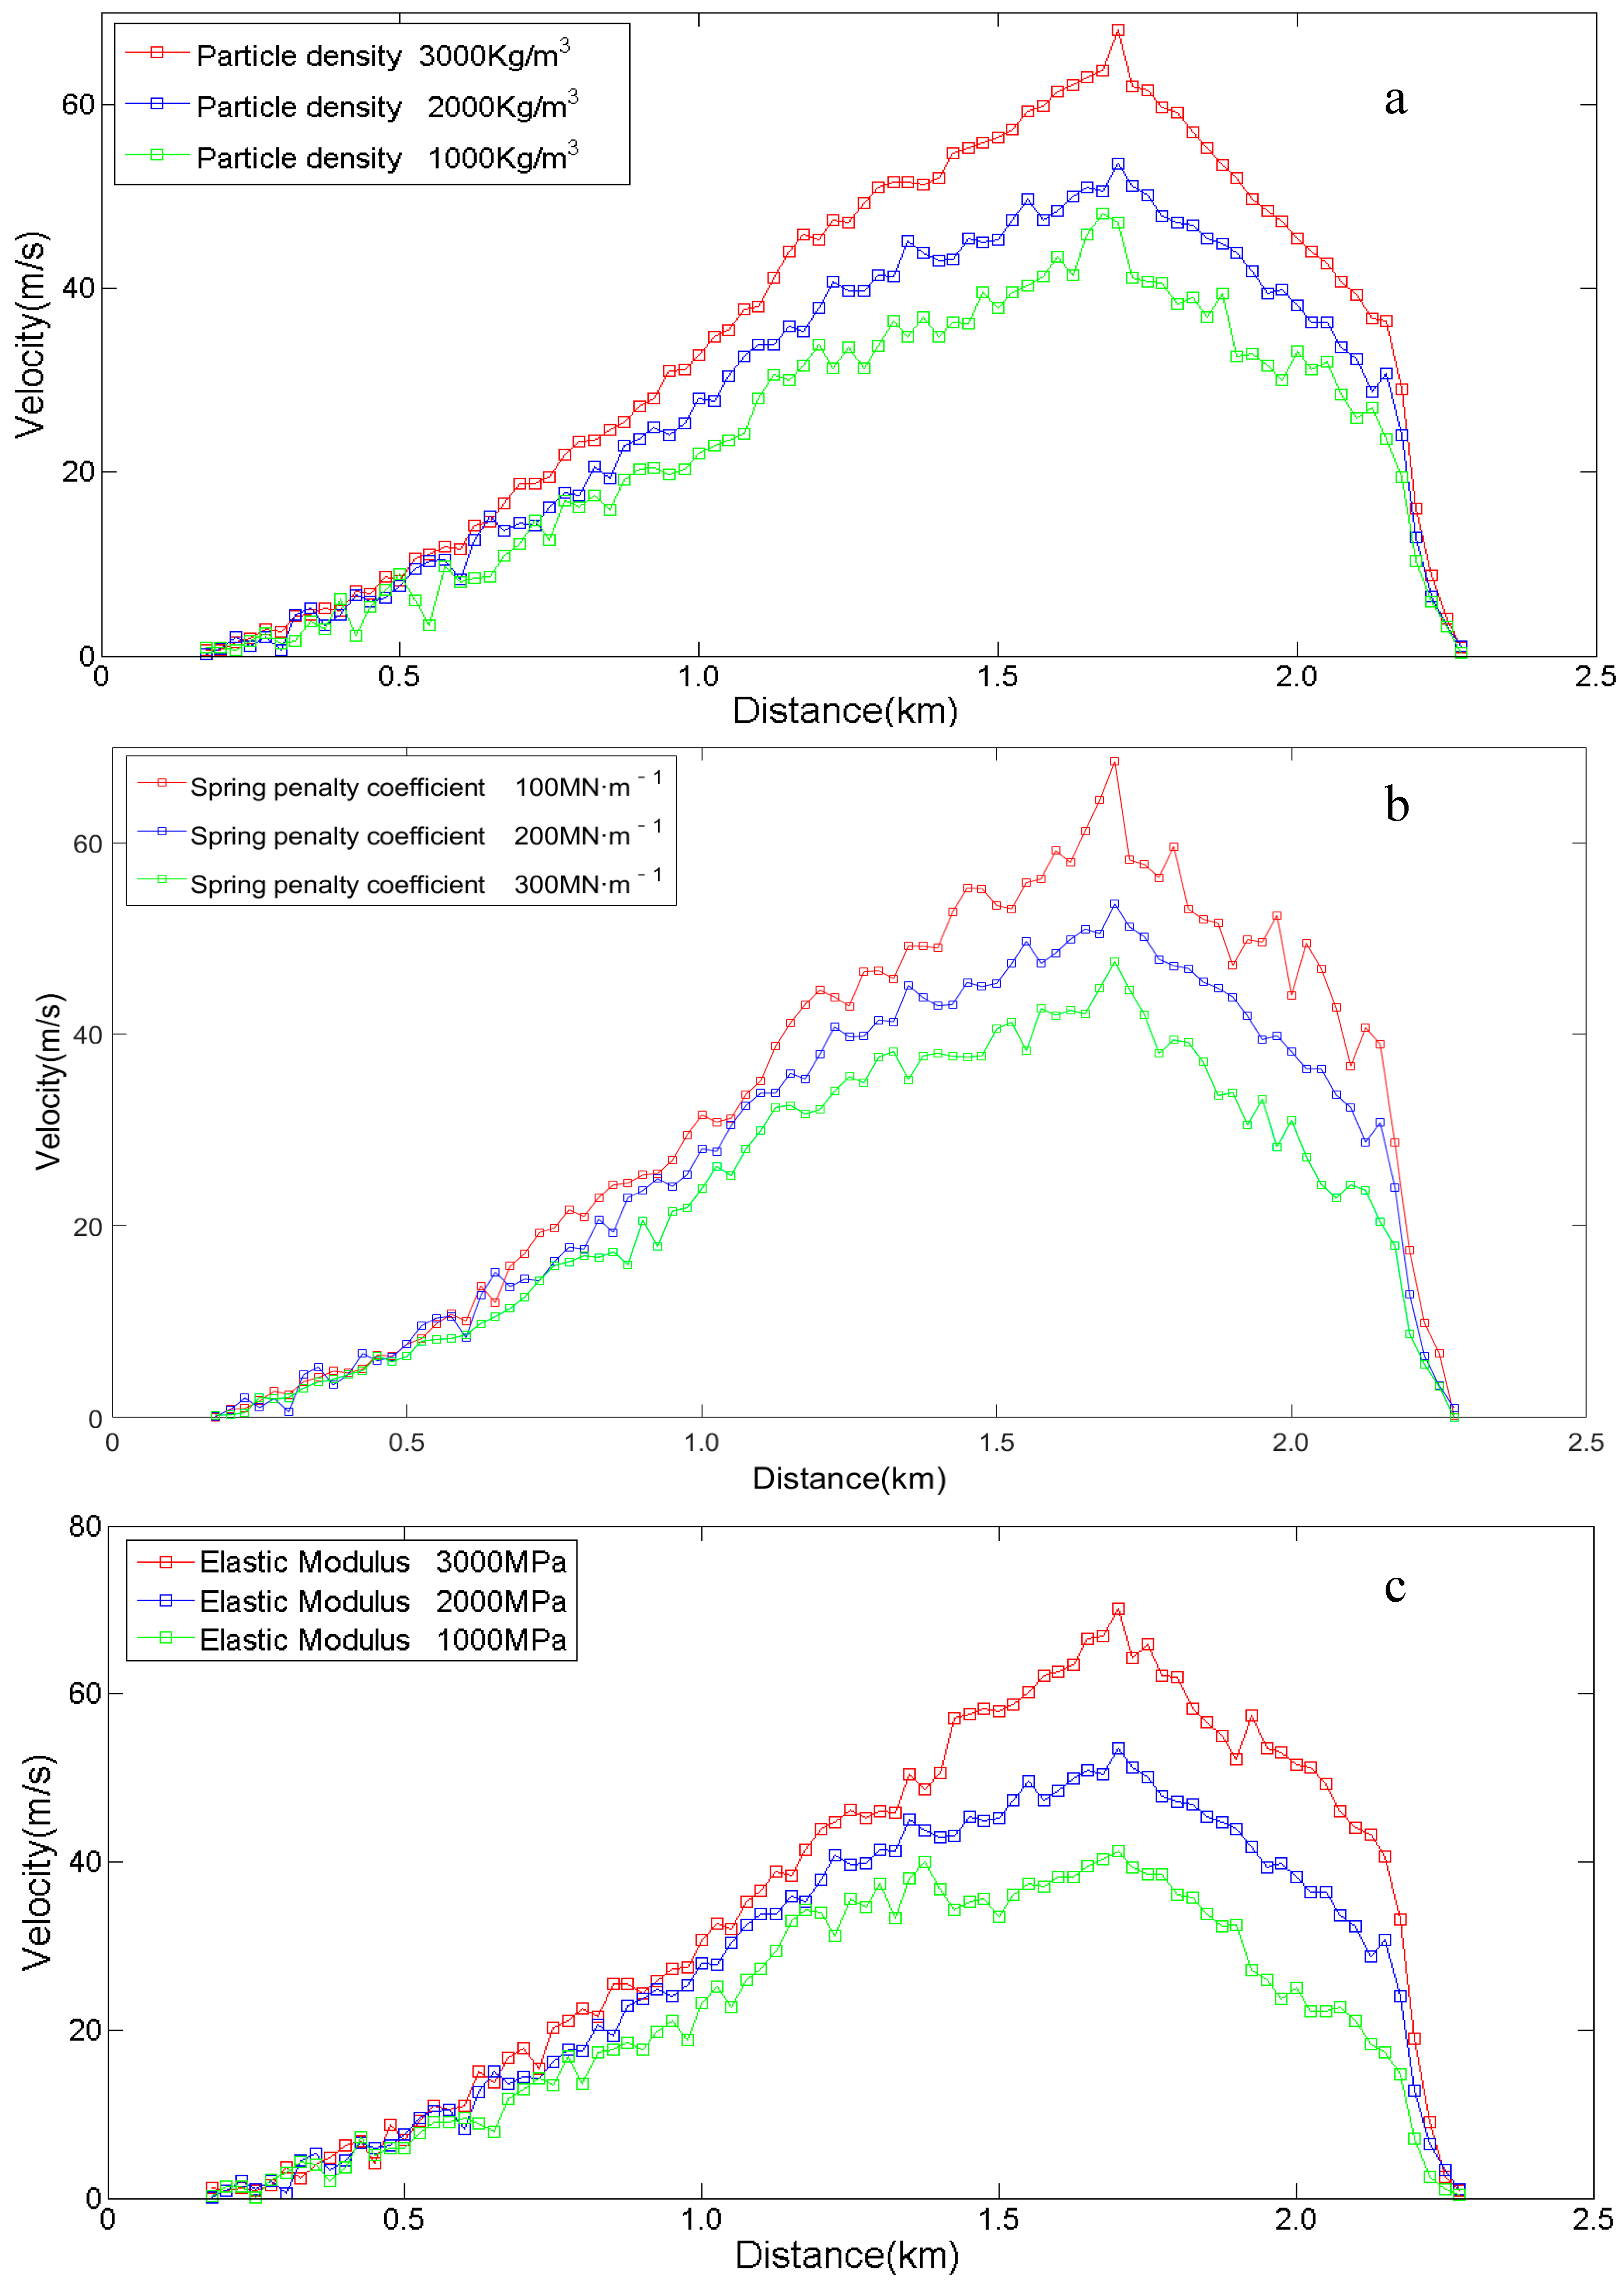
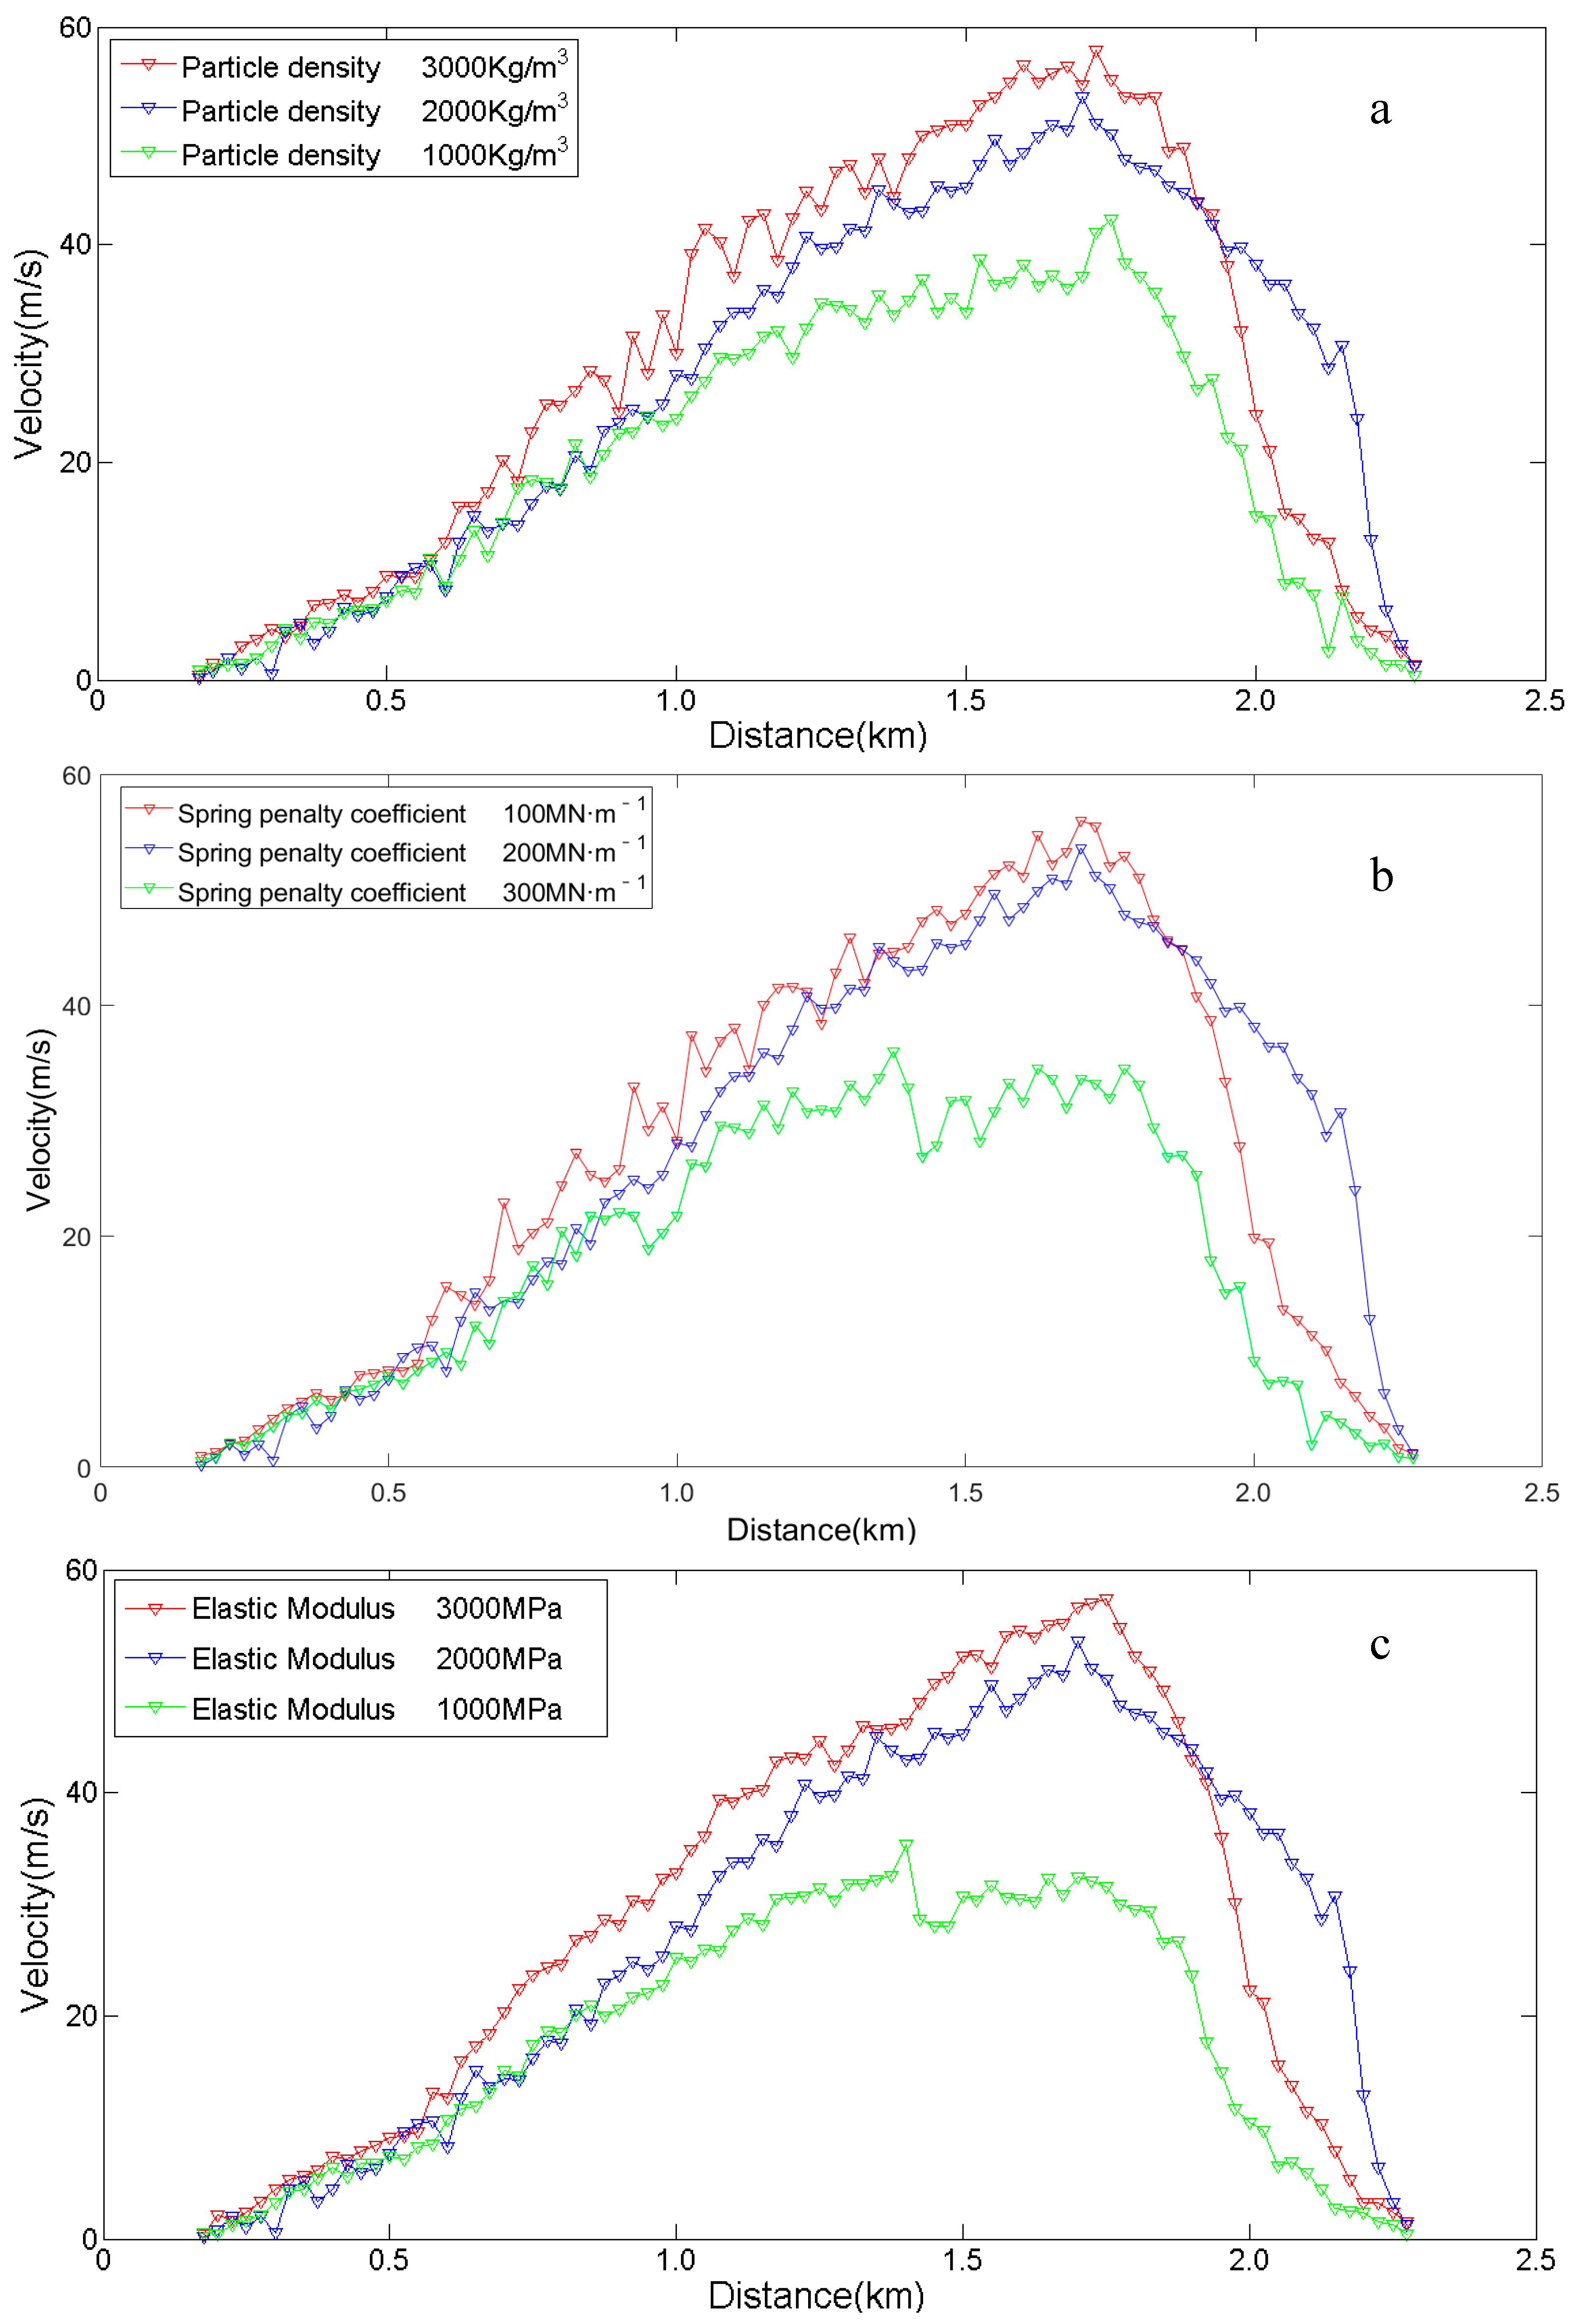
Figure 6a shows the average velocity variations of square blocks under the conditions of changes in these three parameters, respectively. We changed one parameter at a time to test the influence on velocity, while the other parameters remained unchanged. A greater block density was associated with a greater average velocity. Because the model was set as a non-inlaid sliding surface, the proportion of potential energy reduction changed in addition to the energy loss caused by sliding and collision. More kinetic energy could be converted, resulting in an increase of the maximum velocity. The variation could also prolong the time of blocks bouncing off the ground because of the increase of kinetic energy, thereby reducing the energy loss caused by frictional resistance.
Figure 6b reveals the effect of the penalty coefficient on the velocity results and indicates the degree of energy loss caused by square block contact. A larger penalty coefficient was associated with greater friction loss between blocks, leading to a lower average velocity, which also increased the rolling of the blocks. That was because the increase of the penalty coefficient resulted in a more rapid energy loss and reduction of velocity of the triangular blocks in the gentle landslide position. Compared with 300 MN·m−1, the average velocity increments of 200 MN·m−1 and 100 MN·m−1 in the model were 18.9% and 7.6%, respectively.
Figure 6c simulated the effect of the elastic modulus on block motion. We found that the change of the elastic modulus had the greatest effect on velocity. More potential energy conversion could be achieved in the blocks with a high elastic modulus, thus indicating that the movement of the elastic blocks on the hard landslide body posed a greater threat to the facilities downstream. Compared with 1000 MPa, the average velocity increments of 3000 MPa and 2000 MPa in the model were 31.8% and 13.4%, respectively.
It can be seen from Figure 7a, that, unlike the square block, the overall movement velocity of triangular blocks changes abruptly with the terrain, so they are easier to deposit and stagnate at the gentle slope. In addition, the variation of penalty coefficient in Figure 7b has no significant effect on motivation of triangular block, which indicates that the rolling frequency of the triangular blocks with less edges and higher stability will fluctuate easily with the terrain, and that the gentle slope is not high, so the penalty coefficient has little effect on the migration of the triangular block under current terrain. In Figure 7c, the impact of the change of elastic modulus on the motivation of triangular block is also similar to that of the change of penalty coefficient, which shows that the triangular block is more prone to slide rather than roll on the gentle slope. The acceleration effect of elastic modulus change of the triangular blocks was also obvious, which also indicated that the longer the block left the slope, the smaller the hindrance effect. Therefore, multiple contacts and a long contact time between block and slope were associated with the best deceleration mode.
The sensitivity analysis showed that the influence of different parameters on the velocity was nonlinear. The block shapes with closer and continuous vertices remained stable in the aspect of migration and energy maintenance. Because the blocks with high vertex density showed an enhanced rotational speed, it was equivalent to providing an extra acceleration process at each incidence of contact friction. In addition, the shape of the block greatly affected its movement rate and deposition location. The penalty coefficient and elastic modulus mainly exerted the reaction force based on the number of contact vertices and weight of the blocks [56]. Therefore, their influence on migration and velocity might have been affected by the block scale.
In general, the triangular blocks in Figure 7 show a similar trend with square blocks, but their speed decreases faster in the gentle position downstream of the landslide. Compared with 1000 kg/m3, the average velocity increments of 2000 kg/m3 and 3000 kg/m3 in the model were 24.5% and 11.3% (Figure 7a), respectively. Figure 7b,c display that the triangular blocks show the characteristic of faster deceleration in the gentle region, indicating that the large friction in the gentle region leads to the triangular blocks reaching the static state quickly.

5.3. Comparison between Simulation and Measurements

To analyze the effects of different blocks and physical properties on the sedimentary range, we compared the simulation results with the measured landslide range. The measured landslide-range data came from a study by Zhang [57]. To fit the real deposit location, the parameters set in the original model could just match the actual deposit location. The parameter settings are in good agreement with the measured deposit range. These parameters can be used as a measurement standard. When other parameters change, the role of a certain medium parameter in the rock landslide can be judged according to whether it promotes the landslide movement.
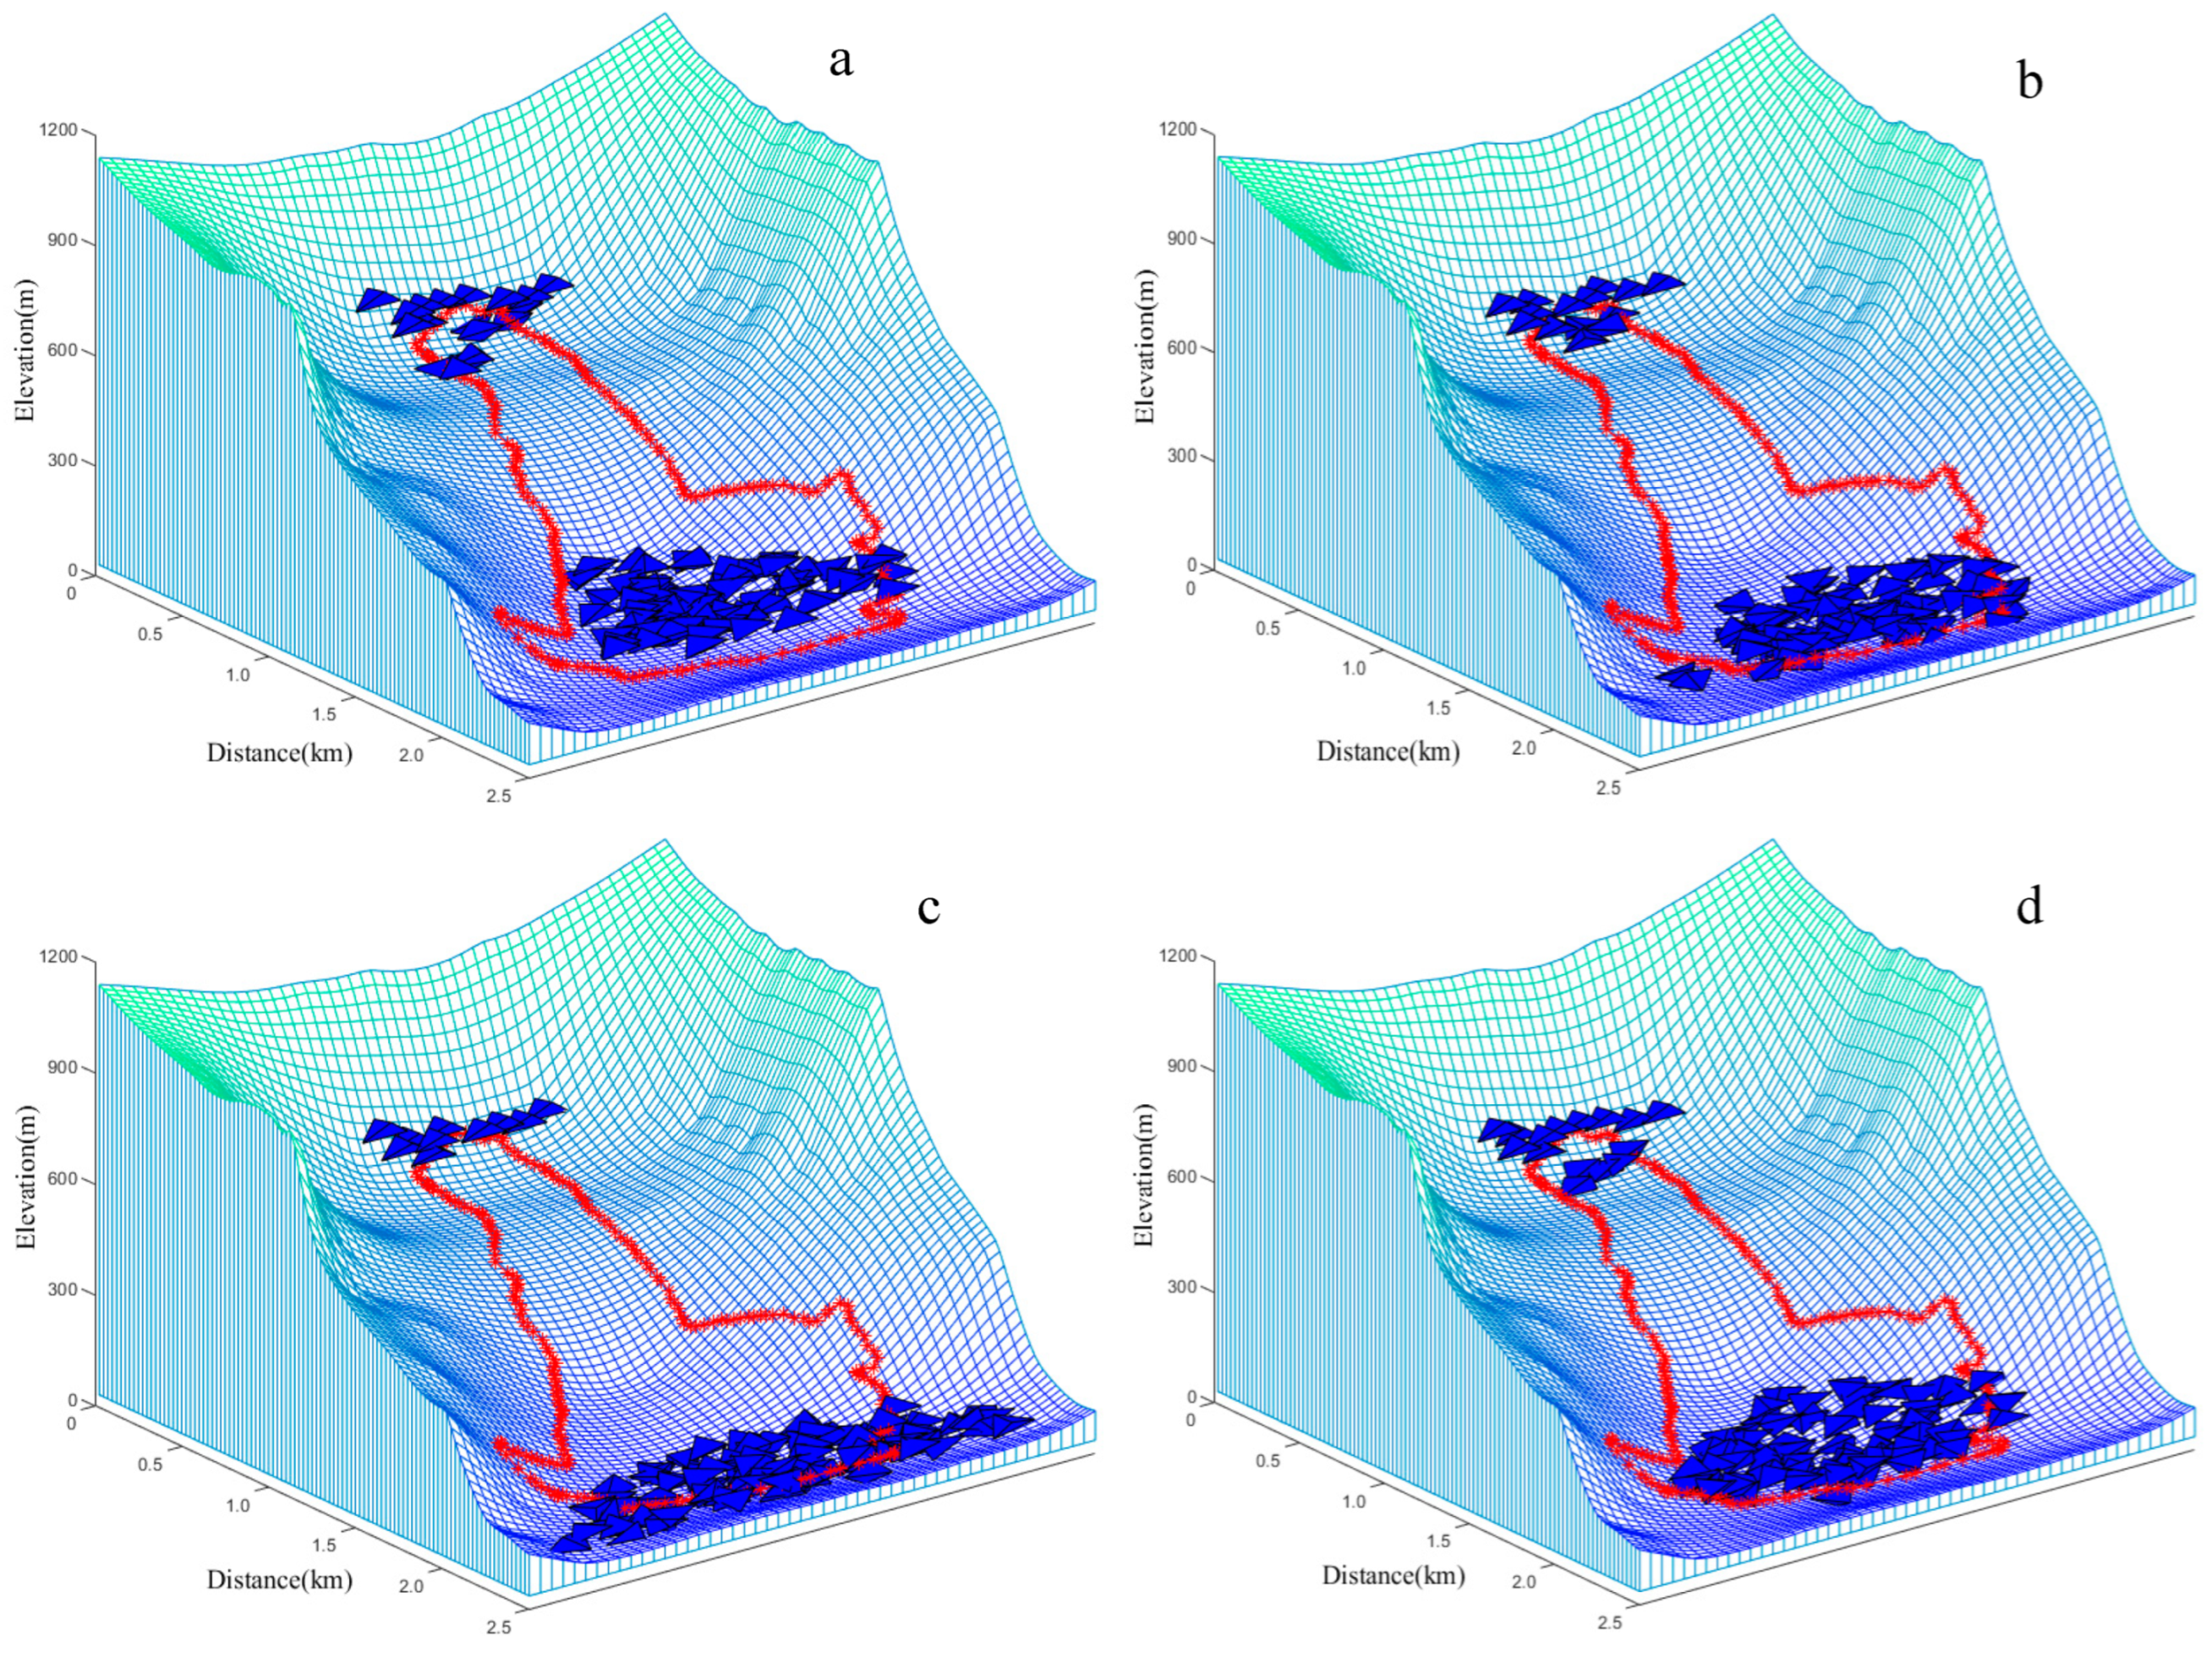
Figure 8 reveals a comparison of the final deposition area of the square blocks with the different parameter setting. Figure 8a is the deposition range of the standard parameter, which is consistent with the actual deposition range. Figure 8b–d show the variation of the block deposition range caused by different parameters. It can be seen from Figure 8d that the elastic modulus can increase the ejection probability. At the same time, the distribution of individual blocks caused by ejection might be relatively discrete. Although an increase in the elastic modulus could significantly increase the displacement of the blocks, the effective value of the spring penalty coefficient mainly appeared under the condition of contact impact. Therefore, a larger penalty coefficient was associated with a smaller migration distance of the blocks and with a more concentrated block distribution.
The red dotted line in Figure 8 represents the measured landslide range. Although the results shown in Figure 8b,d exceeded the measured landslide range, most of the blocks still fell within the measured range; therefore, our simulation results were basically consistent with the measured results. From this point of view, the terrain distribution also dominated the sedimentary range of the block and material flows.
In addition, the blocks in Figure 8b,d present a relatively long migration and deposition distance, and the blocks in Figure 8b have a high penalty coefficient, which makes the blocks not easy to slide, but easier to roll, so that the blocks are more prone to move in a long distance on the steep surface. Figure 8d shows that the blocks have the longest migration distance and the largest velocity among all the results, thus indicating that a high elastic coefficient is a significant factor to promote the long migration of landslide blocks.
Figure 9 shows a comparison of the final deposition area of the triangular blocks with the difference parameter setting. Figure 9a is the deposition location with a standard parameter. Its deposition is slightly smaller than the actual deposition range. Compared with the square blocks, the variations of the block weight, penalty coefficient, and elastic modulus have a small increment compared with the original deposition position (Figure 9b–d), thus indicating that no matter which parameter is changed, the triangle blocks do not exceed the measured deposition range. The above results suggested that the changes of parameters did not cause significant displacement changes for the triangular blocks, but the terrain played a greater role in the migration of them.
The results of the overall simulation showed that the mechanism of the landslide migration was obviously affected by some physical characteristics of the blocks, but we only analyzed some influences on block migration caused by the variation of physical characteristics. It could be inferred from the simulation results that the rock lithology, the landslide scale, and the topography basically determined the movement range of landslide.

5.4. Implications of Sensitivity Analysis on the Landslide Migration Mechanism

Most related studies have pointed out that the landslide drop and the size of the landslide are the main reasons for differences in landslide migration distance [58,59,60]. Our study showed that the physical properties of the landslide medium tend to produce difference travel distances.
In fact, the scale of landslides and physical properties of the sliding medium have significant effects on landslide migration, and these mainly manifest in the total mass, the slope, and the shear stress on the landslide surface. The sensitivity analysis showed that changes in the mass, elastic modulus, and spring penalty coefficient had different effects on the motion of the sliding body. The density of the block represents the mass of the block, which directly determines the gravity component of the landslide. The famous Daguangbao landslide with immense mass caused a large range of movement and coverage [61].
The elastic modulus represents the elasticity of the landslide surface. When the block interacts with high-speed projectiles and collides with the landslide surface in a very short time, the large elastic modulus increases the acceleration time of the block, resulting in increased kinetic energy, the block’s ejection, and the long-range movement being increased further, which further enhances the risk of the landslide downstream. The Xinmo landslide was caused by the action of earthquakes. The shaking caused by seismic waves is equivalent to an increase in the elastic modulus of the landslide surface [54], which increases the displacement of the landslide. The elastic modulus is similar to this additional effect.
The spring penalty coefficient represents the frictional resistance between the block and the landslide surface. It can also be roughly understood as the viscosity between the blocks. The greater the spring force, the greater the energy consumed in the block’s movement, which is the reason why viscous and loose medium tends to produce landslides with short distances compared to bulk medium. However, on the steep landslide surface, the larger penalty coefficient is more likely to cause the blocks to roll, thus causing long-distance movement of them.
The simulation showed that the shape of the block greatly determines the displacement and range of the landslide movement. The maximum speed of a simulated square block was about 60 m/s, whereas for a simulated triangular block, the maximum speed was about 44 m/s. At the same time, when the front edge of the square block landslide was deposited at the bottom, because square blocks do not easily mosaic with each other, it is easier for the rear blocks to cross the front edge and cause a long deposition displacement. Triangular blocks steady more easily and block subsequent blocks, and the movement mode is slow and creeping.

6. Conclusions

In this study, the DDA method was used to simulate the motion process of blocks with two types of shapes on 3D topography. The influencing factors of velocity and displacement of the block landslides were discussed comprehensively. The different complex contact modes between blocks were considered in the model. We found that the weight, the modulus of elasticity, and the spring penalty coefficient of the blocks had different effects on the migration of blocks with different shapes. The larger the weight of the block is, the farther the migration distance is. Moreover, the spring penalty coefficient has different effects according to the number of contact points of the blocks. The lower the number of contact points, the smaller the negative impact of the penalty coefficient on the migration. In addition, the modulus of elastic can promote the migration of various shapes of blocks. Moreover, the blocks with closer and continuous vertices were stable in terms of migration and energy conservation. However, because the number of vertices and edges determined energy loss, it could also affect the contact frequency. The blocks with different shapes improved spatial heterogeneity and increased the difficulty of prediction. Therefore, the prediction and analysis of landslide disasters should be further considered for extreme events based on the DDA method with 3D topography, as we performed in our study; that is, the maximum sedimentary area and spread range of blocks with complex shapes on complex terrain should be determined to prevent the occurrences of landslides. Therefore, blocks with different shapes under the same parameters had different mechanisms of motion.

Author Contributions

Z.W. debugged the model and performed the numerical analysis; H.Z. revised the manuscript and provided a comparison scheme of model parameters. All authors have read and agreed to the published version of the manuscript.

Funding

This study was supported by four subjects, the Science for Earthquake Resilience of China Earthquake Administration (XH20059); the Project of Gansu Natural Science Foundation (22JR5RA824); the National Natural Science Foundation of China (No. 41761006); the Basic Scientific research Foundation of China Earthquake Administration (2020IESLZ04); the Key Project of Gansu Natural Science Foundation (20JR5RA097).

Institutional Review Board Statement

Not applicable.

Informed Consent Statement

Not applicable.

Data Availability Statement

Not applicable.

Acknowledgments

The authors kindly thank the Lanzhou Geotechnical and Seismological Research Institute for preparing the research site and experimental conditions.

Conflicts of Interest

The authors declare no conflict of interest.

References

  1. Cruden, D.M. A simple definition of a landslide. Bull. Int. Assoc. Eng. Geol. 1991, 43, 27–29. [Google Scholar] [CrossRef]
  2. Revellino, P.; Guadagno, F.M.; Hungr, O. Morphological methods and dynamic modelling in landslide hazard assessment of the Campania Apennine carbonate slope. Landslides 2008, 5, 59–70. [Google Scholar] [CrossRef]
  3. Zhuang, J.; Peng, J.; Wang, G.; Javed, I.; Wang, Y.; Li, W. Distribution and characteristics of landslide in Loess Plateau: Acasestudy in Shaanxi province. Eng. Geol. 2018, 236, 89–96. [Google Scholar] [CrossRef]
  4. Xin, P.; Liu, Z.; Wu, S.-R.; Liang, C.; Lin, C. Rotational–translational landslides in the neogene basins at the northeast margin of the Tibetan Plateau. Eng. Geol. 2018, 244, 107–115. [Google Scholar] [CrossRef]
  5. Song, Z.-C.; Zhao, L.-H.; Li, L.; Zhang, Y.; Tang, G. Distinct Element Modelling of a Landslide Triggered by the 5.12 Wenchuan Earthquake: A Case Study. Geotech. Geol. Eng. 2018, 36, 2533–2551. [Google Scholar] [CrossRef]
  6. Peres, D.J.; Cancelliere, A. Modeling impacts of climate change on return period of landslide triggering. J. Hydrol. 2018, 567, 420–434. [Google Scholar] [CrossRef]
  7. Guo, X.; Lai, Z.; Sun, Z.; Li, X.; Yang, T. Luminescence dating of Suozi landslide in the Upper Yellow River of the Qinghai-Tibetan Plateau, China. Quat. Int. 2014, 349, 159–166. [Google Scholar] [CrossRef]
  8. Fan, X.; Zhan, W.; Dong, X.; van Westen, C.; Xu, Q.; Dai, L.; Yang, Q.; Huang, R.; Havenith, H.-B. Analyzing successive landslide dam formation by different triggering mechanisms: The case of the Tangjiawan landslide, Sichuan, China. Eng. Geol. 2018, 243, 128–144. [Google Scholar] [CrossRef]
  9. Niu, R.; Wu, X.; Yao, D.; Ling, P.; Li, A.; Peng, J. Susceptibility Assessment of Landslides Triggered by the Lushan Earthquake, April 20, 2013, China. IEEE J. Sel. Top. Appl. Earth Obs. Remote Sens. 2017, 7, 3979–3992. [Google Scholar] [CrossRef]
  10. Li, X. Simulation of the sliding process of Donghekou landslide triggered by the Wenchuan earthquake using a distinct element method. Environ. Earth Sci. 2012, 65, 1049–1054. [Google Scholar] [CrossRef]
  11. Li, X.; Wu, Y.; He, S.; Su, L. Application of the material point method to simulate the post-failure runout processes of the Wangjiayan landslide. Eng. Geol. 2016, 212, 1–9. [Google Scholar] [CrossRef]
  12. Zhuang, J.; Peng, J.; Xu, C.; Li, Z.; Densmore, A.; Milledge, D.; Iqbal, J.; Cui, Y. Distribution and characteristics of loess landslides triggered by the 1920 Haiyuan Earthquake, Northwest of China. Geomorphology 2018, 314, 1–12. [Google Scholar] [CrossRef]
  13. Zhang, Y.S.; Yang, Z.H.; Guo, C.B.; Wang, T.; Wang, D.H.; Guo-Liang, D.U. Predicting landslide scenes under potential earthquake scenarios in the Xianshuihe fault zone, Southwest China. J. Mt. Sci. 2017, 14, 1262–1278. [Google Scholar] [CrossRef]
  14. Yin, Y.; Li, B.; Wang, W. Dynamic analysis of the stabilized Wangjiayan landslide in the Wenchuan Ms 8.0 earthquake and aftershocks. Landslides 2015, 12, 537–547. [Google Scholar] [CrossRef]
  15. Yavari-Ramshe, S.; Ataie-Ashtiani, B. Numerical modeling of subaerial and submarine landslide-generated tsunami waves—Recent advances and future challenges. Landslides 2016, 13, 1325–1368. [Google Scholar] [CrossRef]
  16. Wang, W.; Chen, G.; Zhang, Y.; Zheng, L.; Zhang, H. Dynamic simulation of landslide dam behavior considering kinematic characteristics using a coupled DDA-SPH method. Eng. Anal. Bound. Elements 2017, 80, 172–183. [Google Scholar] [CrossRef]
  17. Zhang, H.; Liu, S.-G.; Zheng, L.; Zhong, G.-H.; Lou, S.; Wu, Y.-Q.; Han, Z. Extensions of edge-to-edge contact model in three-dimensional discontinuous deformation analysis for friction analysis. Comput. Geotech. 2016, 71, 261–275. [Google Scholar] [CrossRef]
  18. Asteriou, P.; Saroglou, H.; Tsiambaos, G. Geotechnical and kinematic parameters affecting the coefficients of restitution for rock fall analysis. Int. J. Rock Mech. Min. Sci. 2012, 54, 103–113. [Google Scholar] [CrossRef]
  19. Kawanami, S.A. The effects of rockfall volume on runout distance. Eng. Geol. 2000, 58, 109–124. [Google Scholar]
  20. Spadari, M.; Giacomini, A.; Buzzi, O.; Fityus, S.; Giani, G.P. In situ rockfall testing in New South Wales, Australia. Int. J. Rock Mech. Min. Sci. 2012, 49, 84–93. [Google Scholar] [CrossRef]
  21. Chau, K.T.; Wong, R.H.C.; Wu, J.J. Coefficient of restitution and rotational motions of rockfall impacts. Int. J. Rock Mech. Min. Sci. 2002, 39, 69–77. [Google Scholar] [CrossRef]
  22. Manzella, I.; Labiouse, V. Flow experiments with gravel and blocks at small scale to investigate parameters and mechanisms involved in rock avalanches. Eng. Geol. 2009, 109, 146–158. [Google Scholar] [CrossRef]
  23. Haddad, F.; Chikouche, A.; Laour, M. Simulation of the opti-physical parameters of selectives surfaces of absorber by the FDTD method. «applied to solar water heater». Energy Procedia 2011, 6, 413–421. [Google Scholar] [CrossRef]
  24. Fan, H.; He, S. An Angle-Based Method Dealing with Vertex–Vertex Contact in the Two-Dimensional Discontinuous Deformation Analysis (DDA). Rock Mech. Rock Eng. 2015, 48, 2031–2043. [Google Scholar] [CrossRef]
  25. Thomas, A.V.; Saha, S.; Danumah, J.H.; Raveendran, S.; Prasad, M.K.; Ajin, R.S.; Kuriakose, S.L. Landslide Susceptibility Zonation of Idukki District Using GIS in the Aftermath of 2018 Kerala Floods and Landslides: A Comparison of AHP and Frequency Ratio Methods. J. Geovis. Spat. Anal. 2021, 5, 1–27. [Google Scholar] [CrossRef]
  26. Bickel, V.T.; Manconi, A. Decadal Surface Changes and Displacements in Switzerland. J. Geovis. Spat. Anal. 2022, 6, 1–9. [Google Scholar] [CrossRef]
  27. Pancholi, V.; Bhatt, N.; Singh, P.; Chopra, S. Multi-criteria approach using GIS for macro-level seismic hazard assessment of Kachchh Rift Basin, Gujarat, western India—First step towards earthquake disaster mitigation. J. Earth Syst. Sci. 2021, 131, 1–20. [Google Scholar] [CrossRef]
  28. Fang, H.; Shao, Y.; Xie, C.; Tian, B.; Zhu, Y.; Guo, Y.; Yang, Q.; Yang, Y. Using Persistent Scatterer Interferometry for Post-Earthquake Landslide Susceptibility Mapping in Jiuzhaigou. Appl. Sci. 2022, 12, 9228. [Google Scholar] [CrossRef]
  29. Desalegn, H.; Mulu, A.; Damtew, B. Landslide susceptibility evaluation in the Chemoga watershed, upper Blue Nile, Ethiopia. Nat. Hazards 2022, 113, 1391–1417. [Google Scholar] [CrossRef]
  30. Zhao, Z.; Liu, Z.Y.; Xu, C. Slope unit-based landslide susceptibility mapping using certainty factor (CF), support vector machine (SVM), random forest (RF), CF-SVM and CF-RF models. Front. Earth Sci. 2021, 9, 589630. [Google Scholar] [CrossRef]
  31. Yang, Q.; Cai, F.; Su, Z.; Ugai, K.; Xu, L.; Huang, R.; Xu, Q. Numerical Simulation of Granular Flows in a Large Flume Using Discontinuous Deformation Analysis. Rock Mech. Rock Eng. 2014, 47, 2299–2306. [Google Scholar] [CrossRef]
  32. Wang, L.; Jiao, Y.; Huang, G.; Zheng, F.; Zhao, Z.; Tan, F. Improvement of contact calculation in spherical discontinuous deformation analysis. Sci. China Technol. Sci. 2017, 60, 765–771. [Google Scholar] [CrossRef]
  33. Ning, Y.-J.; An, X.-M.; Lü, Q.; Ma, G.-W. Modeling rock failure using the numerical manifold method followed by the discontinuous deformation analysis. Acta Mech. Sin. 2012, 28, 760–773. [Google Scholar] [CrossRef]
  34. Liu, J.; Nan, Z.; Yi, P. Validation and application of three-dimensional discontinuous deformation analysis with tetrahedron finite element meshed block. Acta Mech. Sin. 2012, 28, 1602–1616. [Google Scholar] [CrossRef]
  35. Shi, G.H. Discontinuous deformation analysis: A new numerical model for the statics and dynamics of deformable block structures. Eng. Comput. 1992, 9, 157–168. [Google Scholar] [CrossRef]
  36. Shi, G.H. Block System Modeling by Discontinuous Deformation Analysis; Computational Mechanics Publications: Southampton, UK, 1993. [Google Scholar]
  37. Wu, J.H. Applying discontinuous deformation analysis to assess the constrained area of the unstable Chiu-fen-erh-shan landslide slope. Int. J. Numer. Anal. Methods Geomech. 2007, 31, 649–660. [Google Scholar] [CrossRef]
  38. Wu, J.H. Seismic landslide simulations in discontinuous deformation analysis. Comput. Geotech. 2010, 37, 594–601. [Google Scholar] [CrossRef]
  39. Ma, G.; Matsuyama, H.; Nishiyama, S.; Ohnishi, Y. Practical studies on rockfall simulation by DDA. J. Rock Mech. Geotech. Eng. 2011, 3, 57–63. [Google Scholar] [CrossRef]
  40. Chen, K.T.; Wu, J.H. Simulating the failure process of the Xinmo landslide using discontinuous deformation analysis. Eng. Geol. 2018, 239, 269–281. [Google Scholar] [CrossRef]
  41. Zhang, H.; Liu, S.G.; Han, Z.; Zheng, L.; Zhang, Y.B.; Wu, Y.Q.; Li, Y.G.; Wang, W. A new algorithm to identify contact types between arbitrarily shaped polyhedral blocks for three-dimensional discontinuous deformation analysis. Comput. Geotech. 2016, 80, 1–15. [Google Scholar] [CrossRef]
  42. Nie, W.; Zhao, Z.Y.; Ning, Y.J.; Sun, J.P. Development of Rock Bolt Elements in Two-Dimensional Discontinuous Deformation Analysis. Rock Mech. Rock Eng. 2014, 47, 2157–2170. [Google Scholar] [CrossRef]
  43. Wang, W.; Zhang, H.; Zheng, L.; Zhang, Y.-B.; Wu, Y.-Q.; Liu, S.-G. A new approach for modeling landslide movement over 3D topography using 3D discontinuous deformation analysis. Comput. Geotech. 2017, 81, 87–97. [Google Scholar] [CrossRef]
  44. Zhang, H.; Chen, G.; Zheng, L.; Han, Z.; Zhang, Y.; Wu, Y.; Liu, S. Detection of contacts between three-dimensional polyhedral blocks for discontinuous deformation analysis. Int. J. Rock Mech. Min. Sci. 2015, 78, 57–73. [Google Scholar] [CrossRef]
  45. Peng, X.; Yu, P.; Chen, G.; Xia, M.; Zhang, Y. Development of a Coupled DDA–SPH Method and its Application to Dynamic Simulation of Landslides Involving Solid–Fluid Interaction. Rock Mech. Rock Eng. 2019, 53, 113–131. [Google Scholar] [CrossRef]
  46. Hwang, J.Y.; Ohnishi, Y.; Wu, J. Numerical analysis of discontinuous rock masses using three-dimensional discontinuous deformation analysis (3D DDA). KSCE J. Civ. Eng. 2004, 8, 491–496. [Google Scholar] [CrossRef]
  47. Grayeli, R.; Hatami, K. Implementation of the finite element method in the three-dimensional discontinuous deformation analysis (3D-DDA). Int. J. Numer. Anal. Methods Géoméch. 2010, 32, 1883–1902. [Google Scholar] [CrossRef]
  48. Zhu, H.; Wu, W.; Chen, J.; Ma, G.; Liu, X.; Zhuang, X. Integration of three dimensional discontinuous deformation analysis (DDA) with binocular photogrammetry for stability analysis of tunnels in blocky rockmass. Tunn. Undergr. Space Technol. 2016, 51, 30–40. [Google Scholar] [CrossRef]
  49. Jiang, Q.H.; Yeung, M.R. A model of point-to-face contact for three-dimensional discontinuous deformation analysis. Rock Mech. Rock Eng. 2004, 37, 95–116. [Google Scholar] [CrossRef]
  50. Nezami, E.G.; Hashash, Y.M.A.; Zhao, D.; Ghaboussi, J. Shortest link method for contact detection in discrete element method. Int. J. Numer. Anal. Methods Geomech. 2010, 30, 783–801. [Google Scholar] [CrossRef]
  51. Beyabanaki, S.A.R.; Mikola, R.G.; Biabanaki, S.O.R.; Mohammadi, S. New point-to-face contact algorithm for 3-D contact problems using the augmented Lagrangian method in 3-D DDA. Geomech. Geoengin. 2009, 4, 221–236. [Google Scholar] [CrossRef]
  52. Ran, Q.; Hong, Y.; Li, W.; Gao, J. A modelling study of rainfall-induced shallow landslide mechanisms under different rainfall characteristics. J. Hydrol. 2018, 563, 790–801. [Google Scholar] [CrossRef]
  53. Yueping, Y.; Wenpei, W.; Nan, Z.; Jingkai, Y.; Yunjie, W.; Longwei, Y. Long runout geological disaster initiated by the ridge-top rockslide in a strong earthquake area: A case study of the Xinmo landslide in Maoxian County, Sichuan Province. Geol. China 2017, 44, 827–841. [Google Scholar]
  54. Zhang, Y.; Wang, J.; Xu, Q.; Chen, G.; Zhao, J.X.; Zheng, L.; Han, Z.; Yu, P. DDA validation of the mobility of earthquake-induced landslides. Eng. Geol. 2015, 194, 38–51. [Google Scholar] [CrossRef]
  55. Kamai, R.; Hatzor, Y.H. Numerical analysis of block stone displacements in ancient masonry structures: A new method to estimate historic ground motions. Int. J. Numer. Anal. Methods Géoméch. 2008, 32, 1321–1340. [Google Scholar] [CrossRef]
  56. Wu, J.-H. The elastic distortion problem with large rotation in discontinuous deformation analysis. Comput. Geotech. 2015, 69, 352–364. [Google Scholar] [CrossRef]
  57. Tao, Z.; Zhihua, Y.; Yongshuang, Z.; Liang, C.; Ruian, W. An analysis of the entrainment of the Xinmo high-position landslide in Maoxian county, Sichuan. Hydrogeol. Eng. Geol. 2019, 46, 138–145. [Google Scholar]
  58. Yang, B.; Yin, K.; Lacasse, S.; Liu, Z. Time series analysis and long short-term memory neural network to predict landslide displacement. Landslides 2019, 16, 677–694. [Google Scholar] [CrossRef]
  59. Juliev, M.; Mergili, M.; Mondal, I.; Nurtaev, B.; Pulatov, A.; Hübl, J. Comparative analysis of statistical methods for landslide susceptibility mapping in the Bostanlik District, Uzbekistan. Sci. Total Environ. 2019, 653, 801–814. [Google Scholar] [CrossRef]
  60. Palis, E.; Lebourg, T.; Tric, E.; Malet, J.-P.; Vidal, M. Long-term monitoring of a large deep-seated landslide (La Clapiere, South-East French Alps): Initial study. Landslides 2017, 14, 155–170. [Google Scholar] [CrossRef]
  61. Song, Y.; Huang, D.; Cen, D. Numerical modelling of the 2008 Wenchuan earthquake-triggered Daguangbao landslide using a velocity and displacement dependent friction law. Eng. Geol. 2016, 215, 50–68. [Google Scholar] [CrossRef]
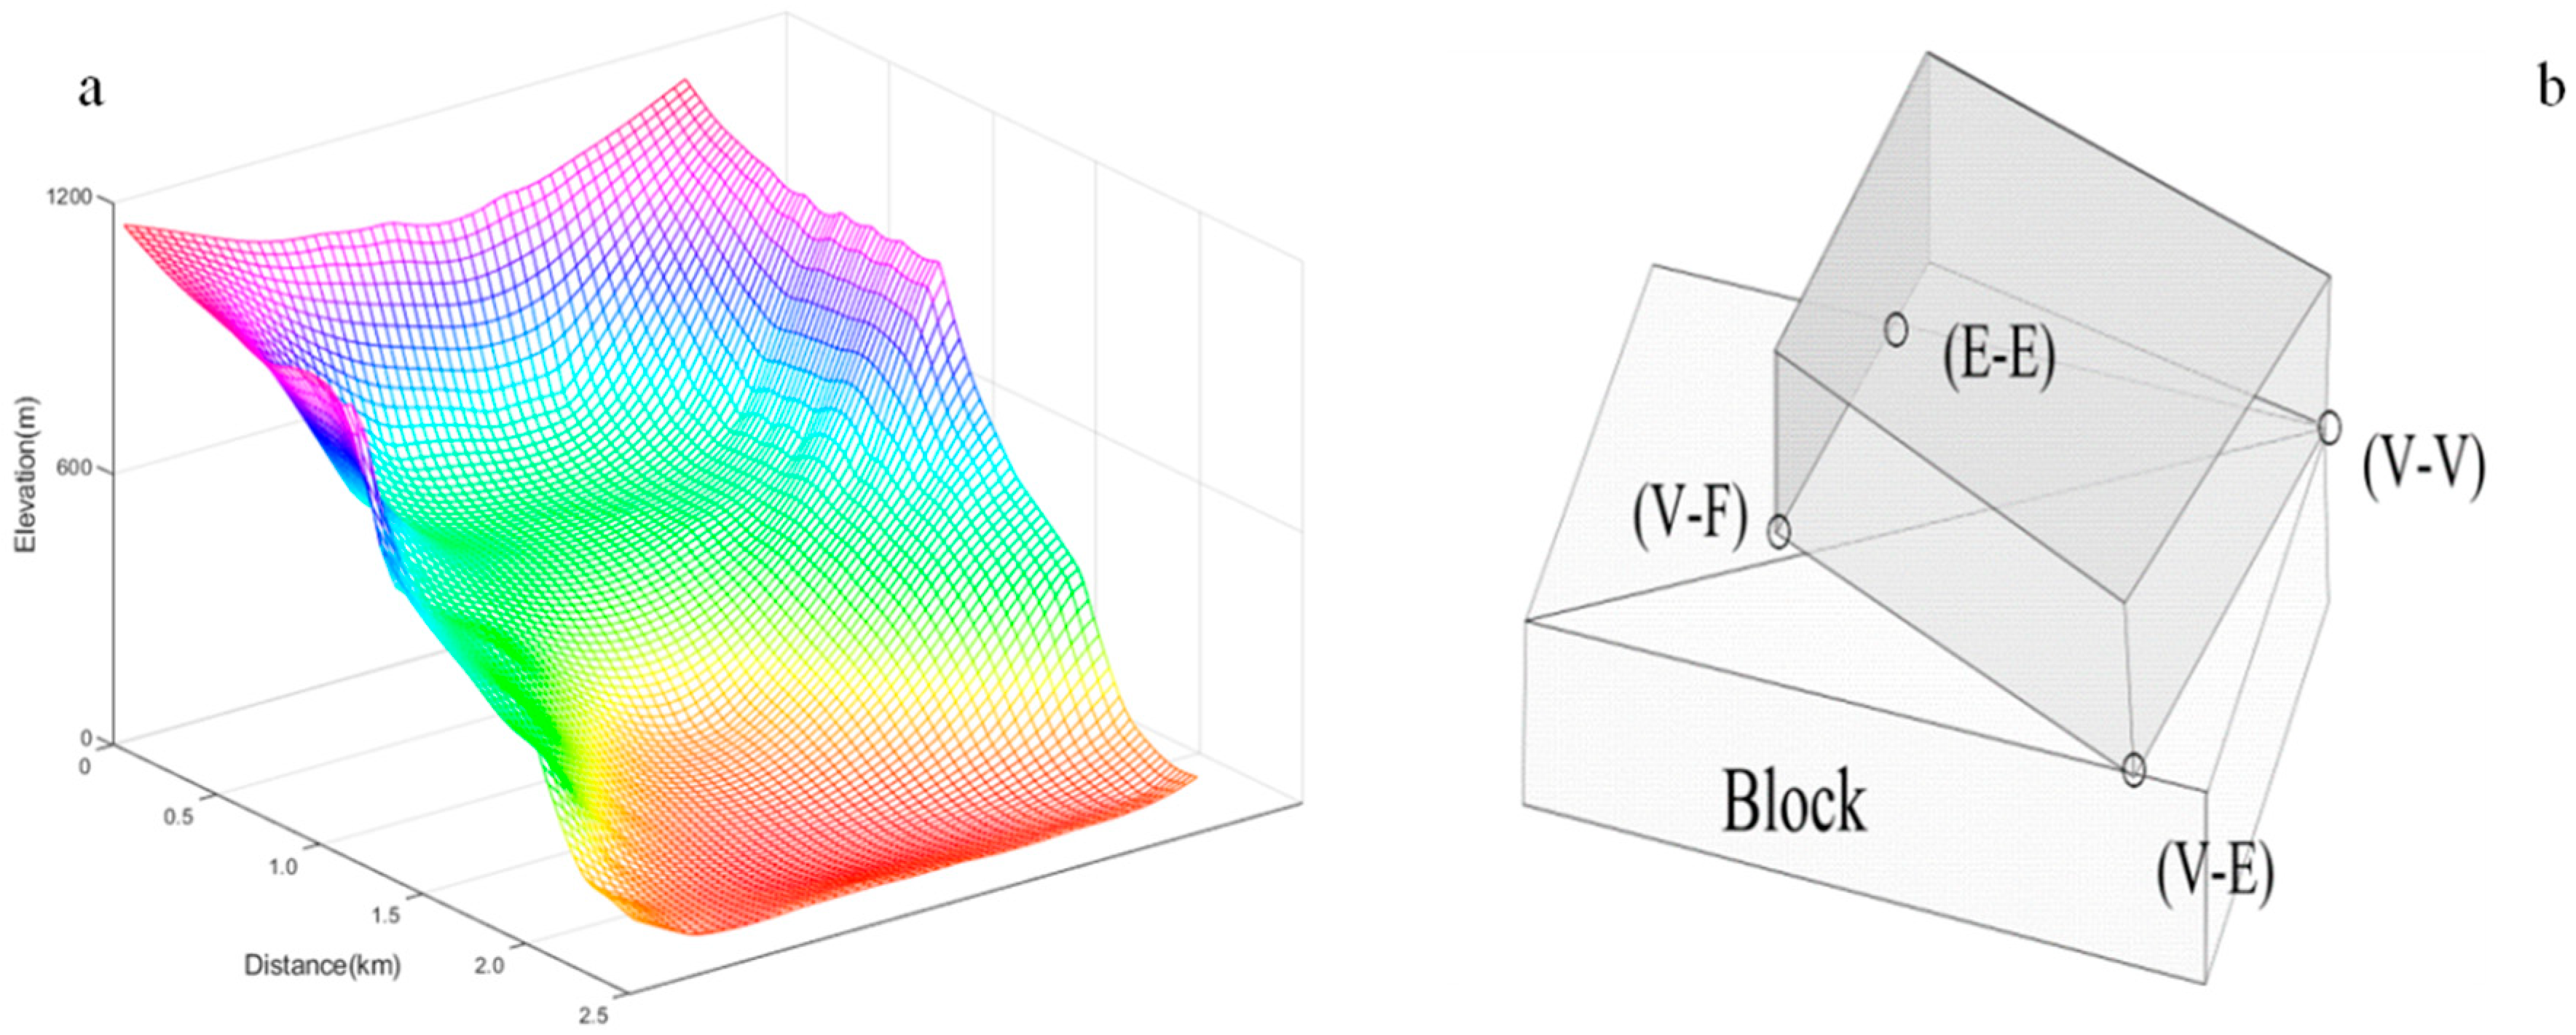
Figure 1. The 3D topography (a) and contact diagrams of blocks (b) used in this study.
Sustainability 15 03463 g001
Figure 2. Comparison between analytical solutions (solid line) and DDA results.
Sustainability 15 03463 g002
Figure 3. Simulation sequence of square block landslide motion on 3D topography: (a) t = 0 s, (b) t = 5.0 s, (c) t = 15.0 s, (d) t = 30.0 s, (e) t = 45.0 s, and (f) t = 60.0 s.
Sustainability 15 03463 g003
Figure 4. Simulation sequence of the triangular block landslide motion on 3D topography: (a) t = 0 s, (b) t = 5.0 s, (c) t = 20.0 s, (d) t = 30.0 s, (e) t = 45.0 s, and (f) t = 60.0 s.
Sustainability 15 03463 g004
Figure 5. Velocity comparison between three selected triangular blocks and three selected square blocks.
Sustainability 15 03463 g005
Figure 6. Velocity sensitivity analysis of square blocks under parameter control.
Sustainability 15 03463 g006
Figure 7. Velocity sensitivity analysis of triangular blocks under parameter control.
Sustainability 15 03463 g007
Figure 8. Comparison between simulation deposition results (square block) obtained from different parameters and actual results. The physical characteristics of several simulation results included the particle density (P), spring penalty coefficient (S), and elastic modulus (E). The parameters’ values used in the four figures were P (2000 kg/m3), S (200 MN/M), and E (2000 MPa) (a); P (3000 kg/m3), S (100 MN/M), and E (2000 MPa) (b); P (2000 kg/m3), S (300 MN/M1), E (2000 MPa) (c); P (2000 Kg/m3), S (200 MN/M), and E (3000 MPa) (d).
Sustainability 15 03463 g008
Figure 9. Comparison between simulation deposition results (triangular blocks) obtained from different parameters and actual results. The physical characteristics of several simulation results were particle density (P), spring penalty coefficient (S), and elastic modulus (E). The parameters’ values used in the four figures were P (2000 kg/m3), S (200 MN/M), and E (2000 MPa) (a); P (3000 kg/m3), S (100 MN/M), and E (2000 MPa) (b); P (2000 kg/m3), S (200 MN/M1), and E (3000 MPa) (c); and P (2000 kg/m3), S (300 MN/M), and E (2000 MPa) (d).
Sustainability 15 03463 g009
Disclaimer/Publisher’s Note: The statements, opinions and data contained in all publications are solely those of the individual author(s) and contributor(s) and not of MDPI and/or the editor(s). MDPI and/or the editor(s) disclaim responsibility for any injury to people or property resulting from any ideas, methods, instructions or products referred to in the content.