
Investigation of the Corrosion Characteristics and Corrosion Inhibitor Action on J55 Steel in Produced Water


Abstract
:1. Introduction
2. Materials and Methods
2.1. Materials
2.2. Methods
2.2.1. Test Method Regarding Corrosion Characteristics
- (1)
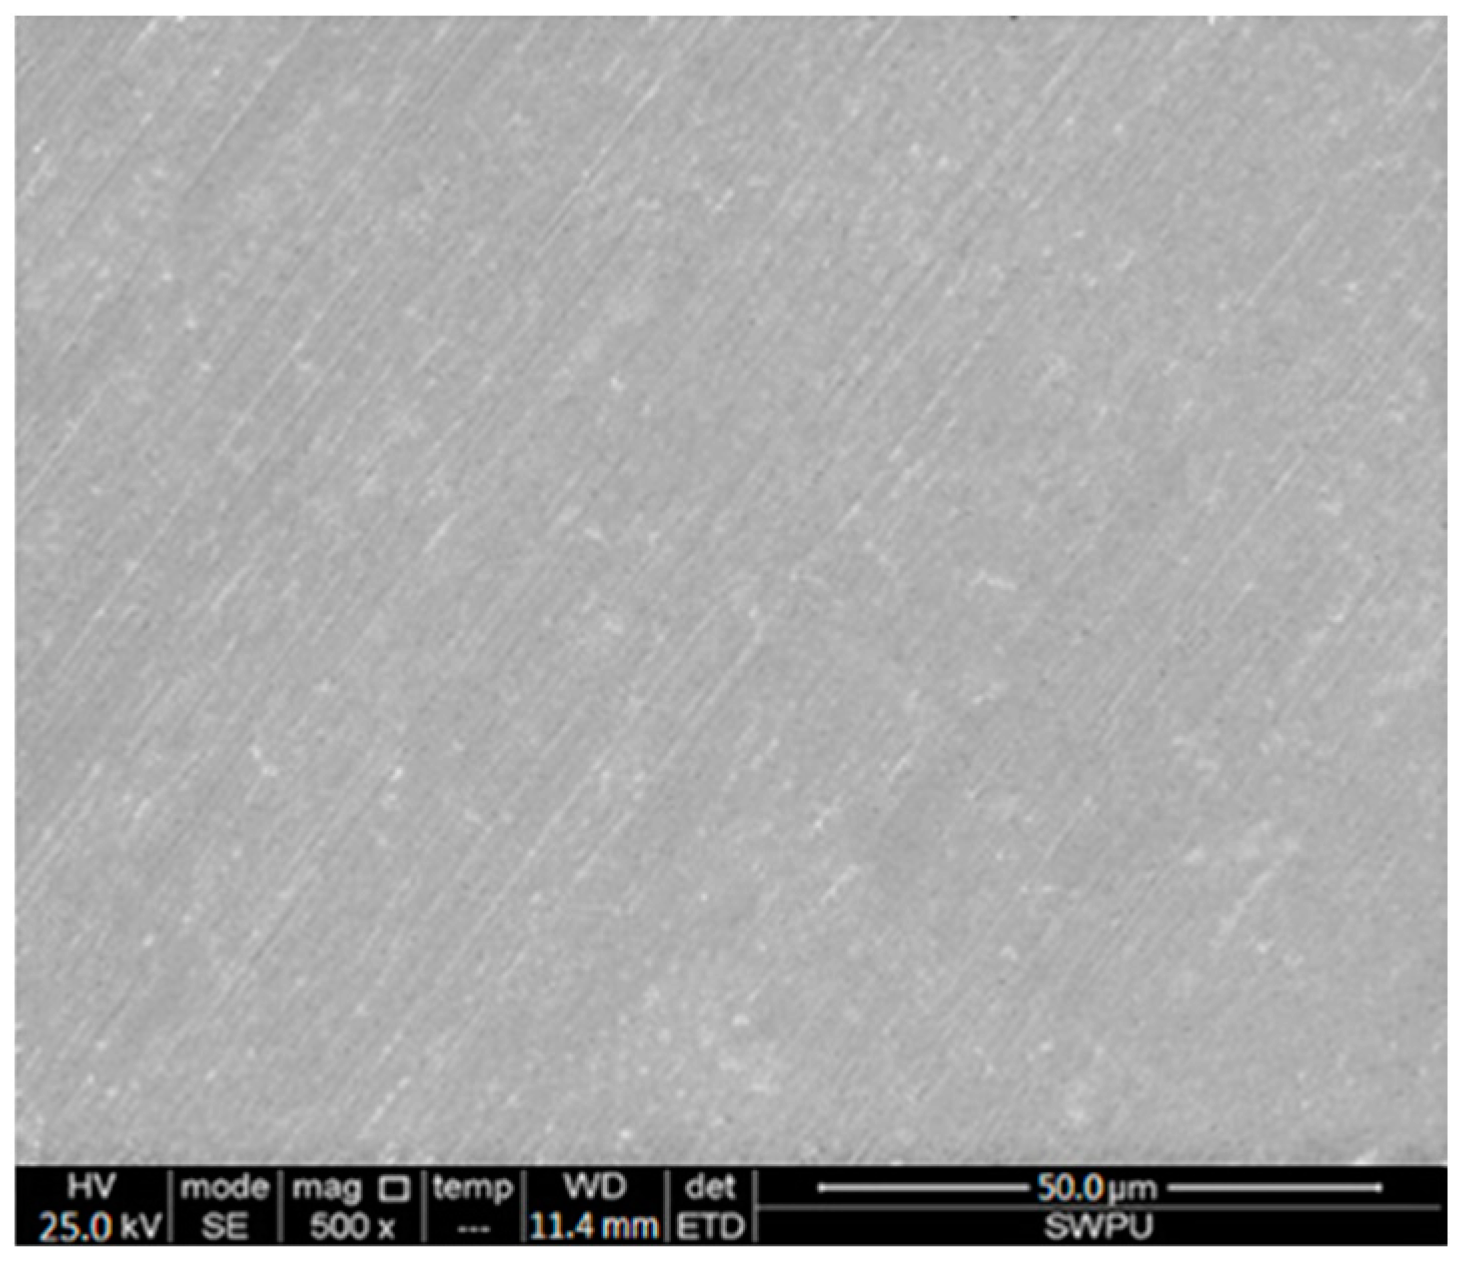
- Material preparation: Steel samples of J55 and N80 were used as the materials of the oil casing and tubing pipes, respectively, and were polished using 400#, 800#, 1200# and 2000# sandpaper successively. The polished test pieces were put in a beaker filled with acetone and then wiped with absorbent cotton to remove impurities. The test pieces were immersed in absolute ethanol for 5 min and put on filter paper. Finally, the test pieces were kept in a drying oven for 24 h and weighed by an electronic balance with an accuracy of 1/10,000 g. The surfaces of the J55 steel were flat before corrosion took place, as shown in Figure 1.
- (2)
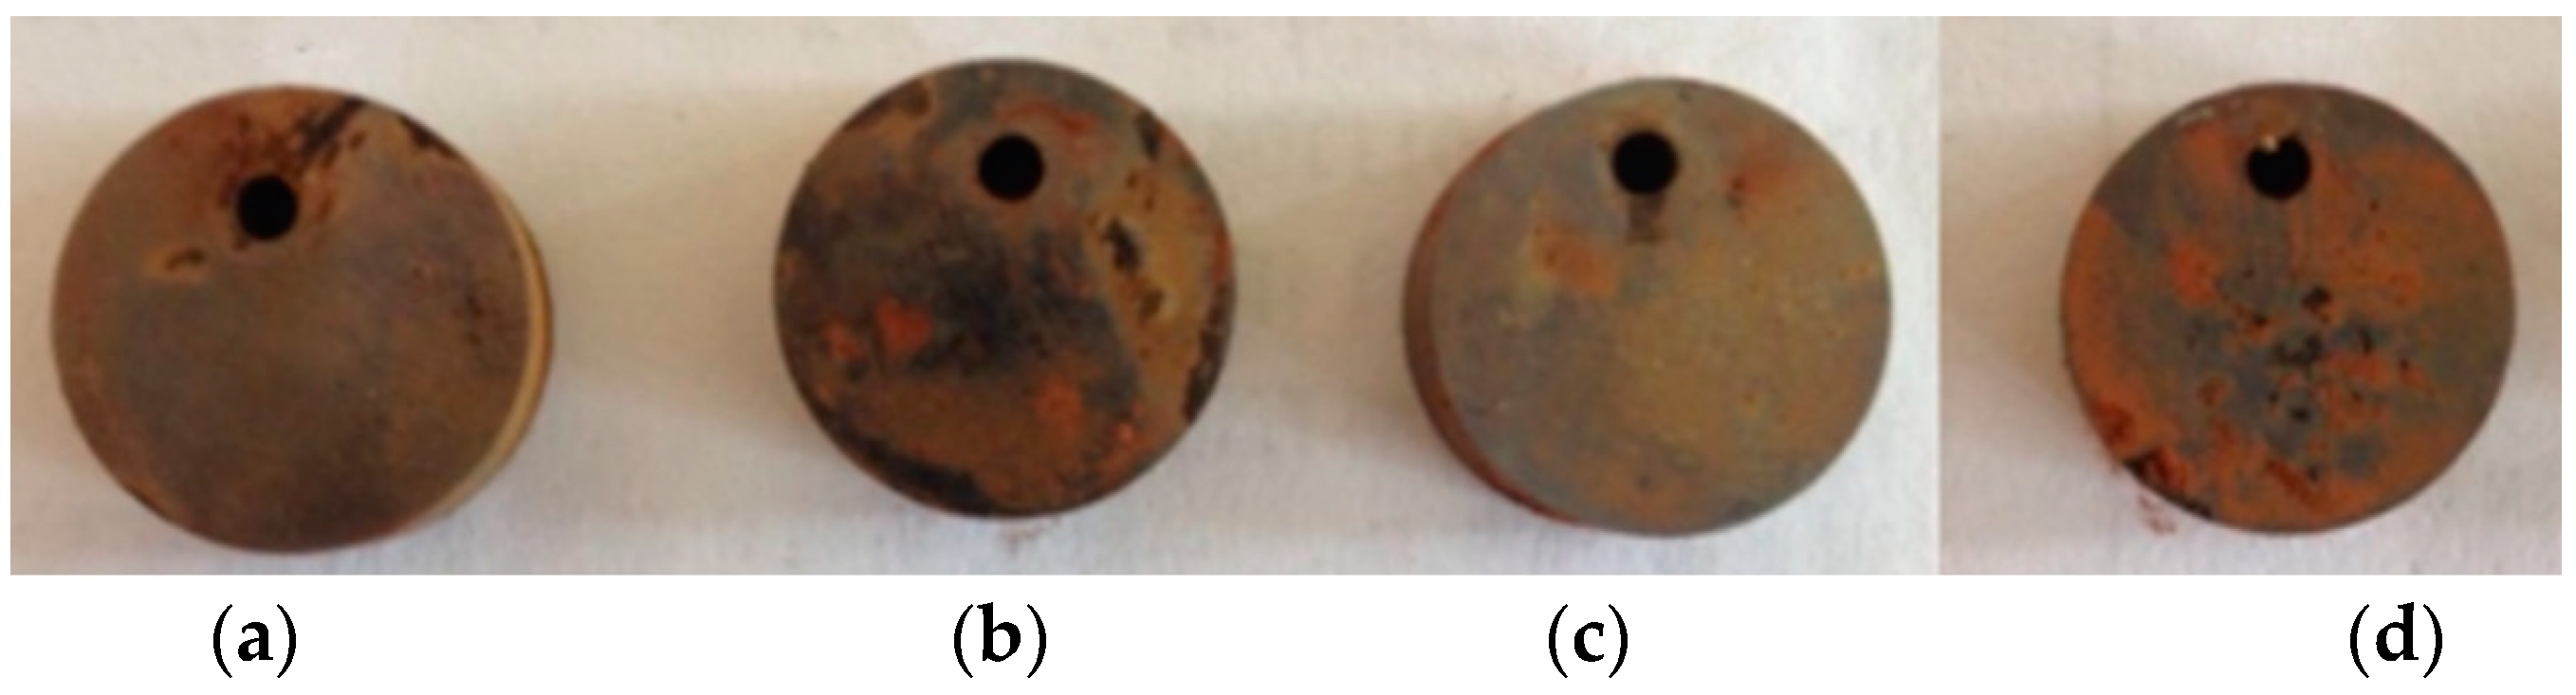
- The corrosion products of a J55 casing in the Xingzichuan oil production plant were analyzed. The method of combining Quanta 450 environmental scanning electron microscope and X-ray energy spectrum analyzer (MX2) was used to analyze the surface morphology of test pieces before and after the indoor weight loss test and the composition of the corrosion products. The main components of the corrosion products were determined according to the experimental results to determine the cause of the J55 casing corrosion in the Xingzichuan oil production plant. A J55 casing taken from the Wangjiawan block of the Xingzichuan oil production plant due to corrosion failure was processed into test pieces, which were put into separate water samples of H132, W214-5, X124 and H128 blocks, with a temperature of 60 °C and static corrosion of 72 h.
- (3)
- Weight loss method: First, the test pieces were hung in wide-mouth bottles filled with corrosive media and kept in a constant-temperature water bath. Second, the test pieces were removed after the corrosion test, and the surfaces of the pieces were recorded using an HD camera. Third, the surfaces of the pieces were washed and wiped with filter paper, and then the test pieces were put in acetone and absolute ethanol to remove oil and water successively. Finally, the cleaning liquid (3.36% HCl and 0.5% HMTA) was used to clean the test pieces for 3–5 min and immersed in absolute ethanol for 5 min to remove the water. The test pieces were put on filter papers for air drying and weighing after 12 h.
- (4)
- Data processing: the average corrosion rate was calculated using Equation (1) [38]:where Vcorr is the average corrosion rate of a test piece, mm/a; m0 and m1 are the masses of a test piece before and after the test, respectively, g; S is the area of a test piece, cm2; ρ is the density of a test piece, g/cm3; t is the test time, h; and 8.76 × 10⁴ is the coefficient that converts corrosion quality into corrosion depth.
2.2.2. Corrosion Inhibitor Evaluation
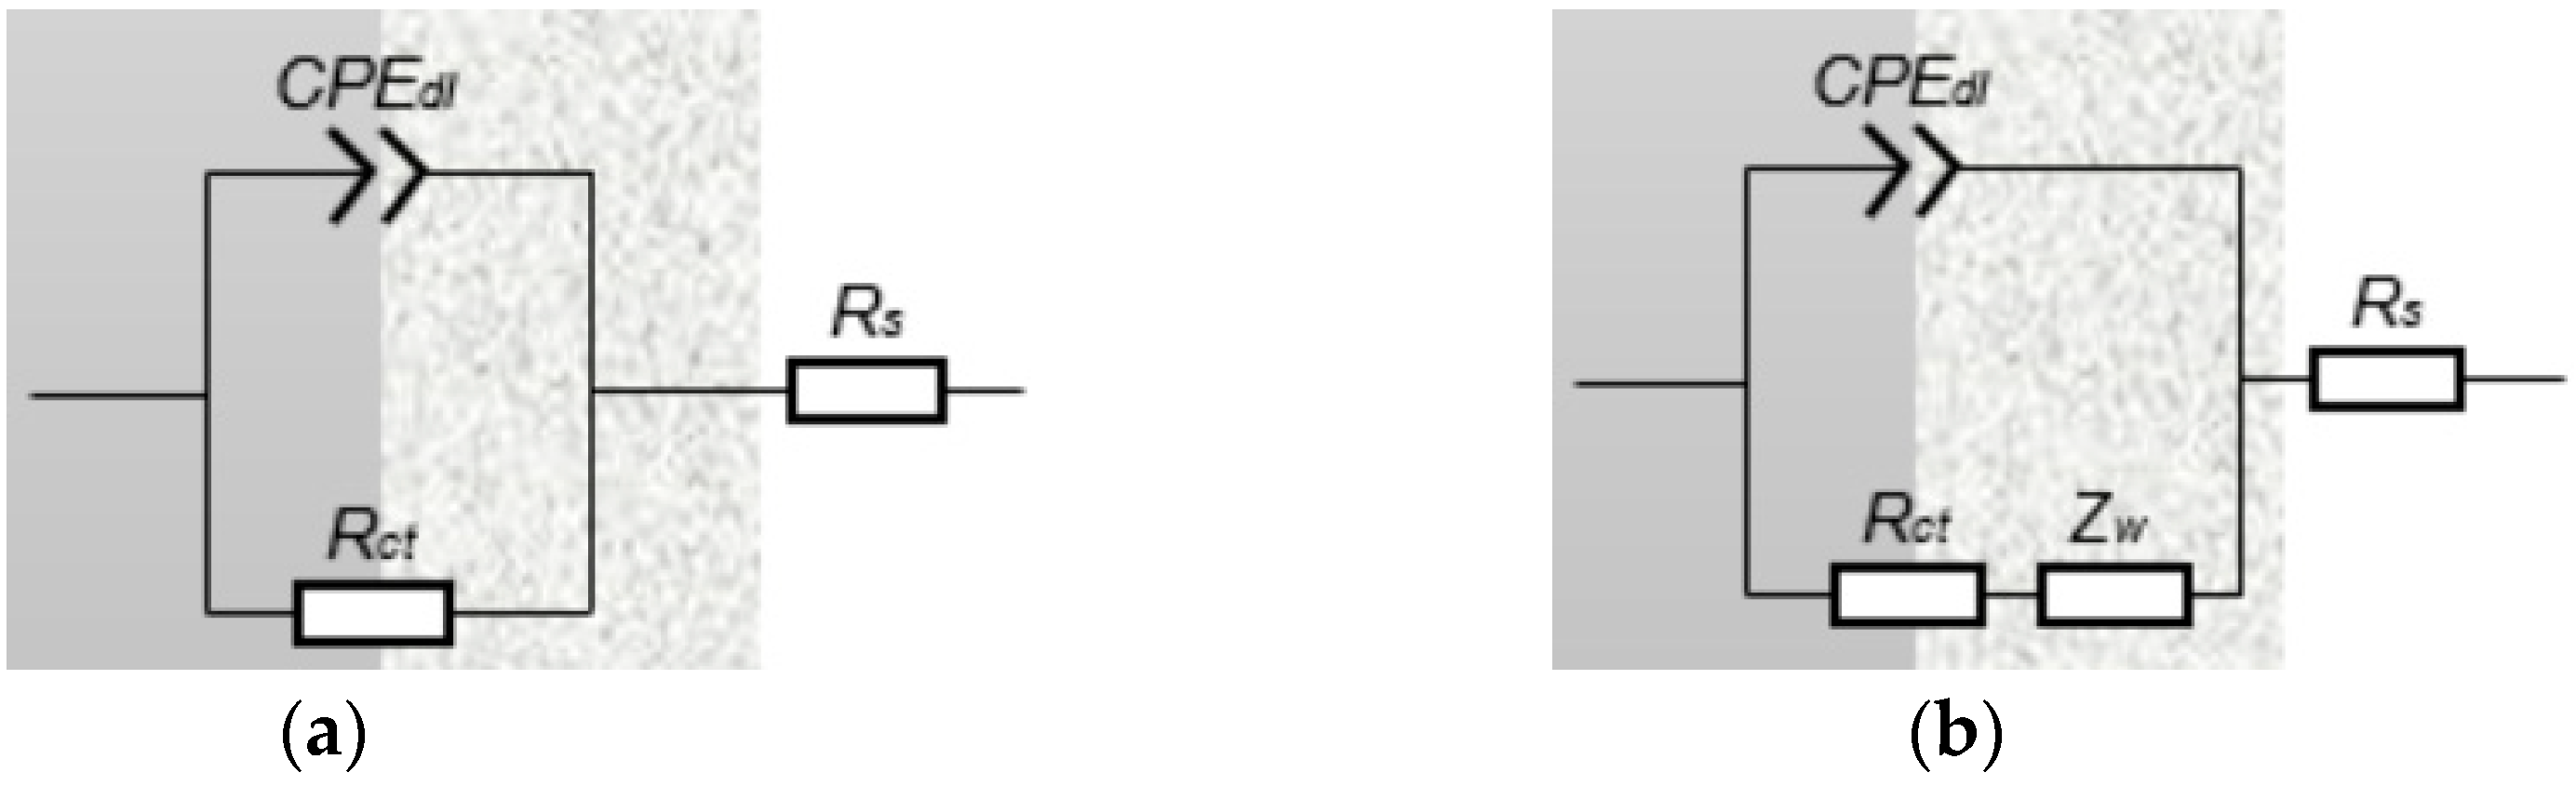
2.3. Electrochemical Measurements
3. Results and Discussion
3.1. Factors That Affected the Corrosion
3.2. Effects of Different Factors on the Corrosion Rate
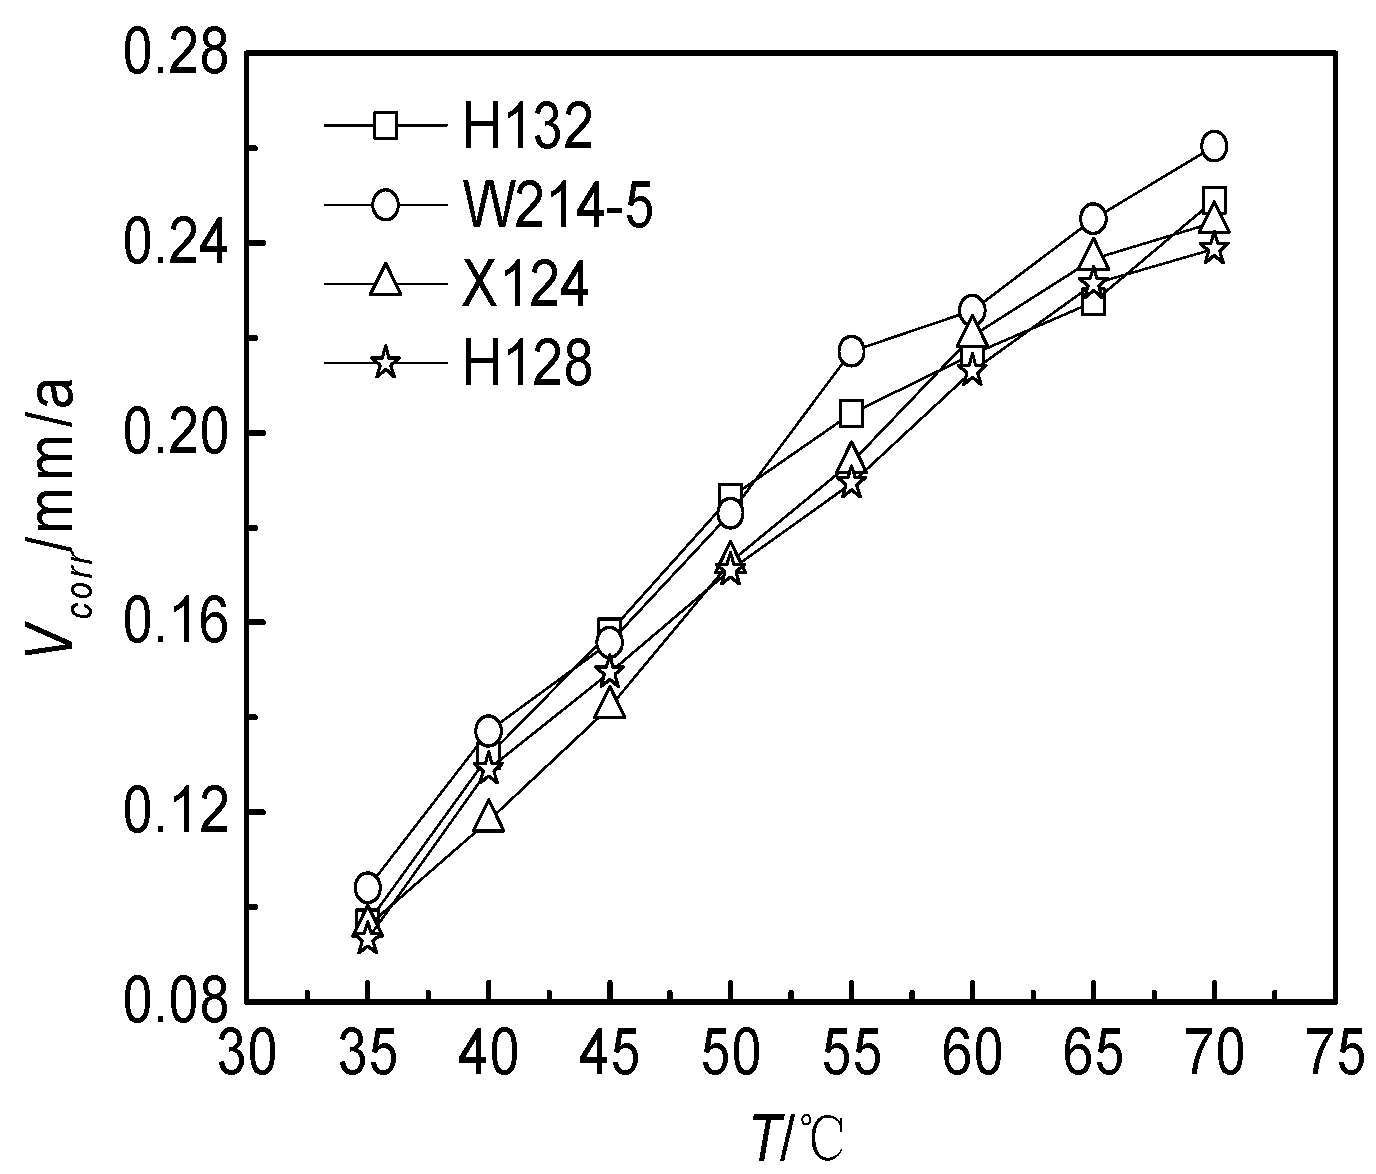
3.2.1. Effect of the Temperature
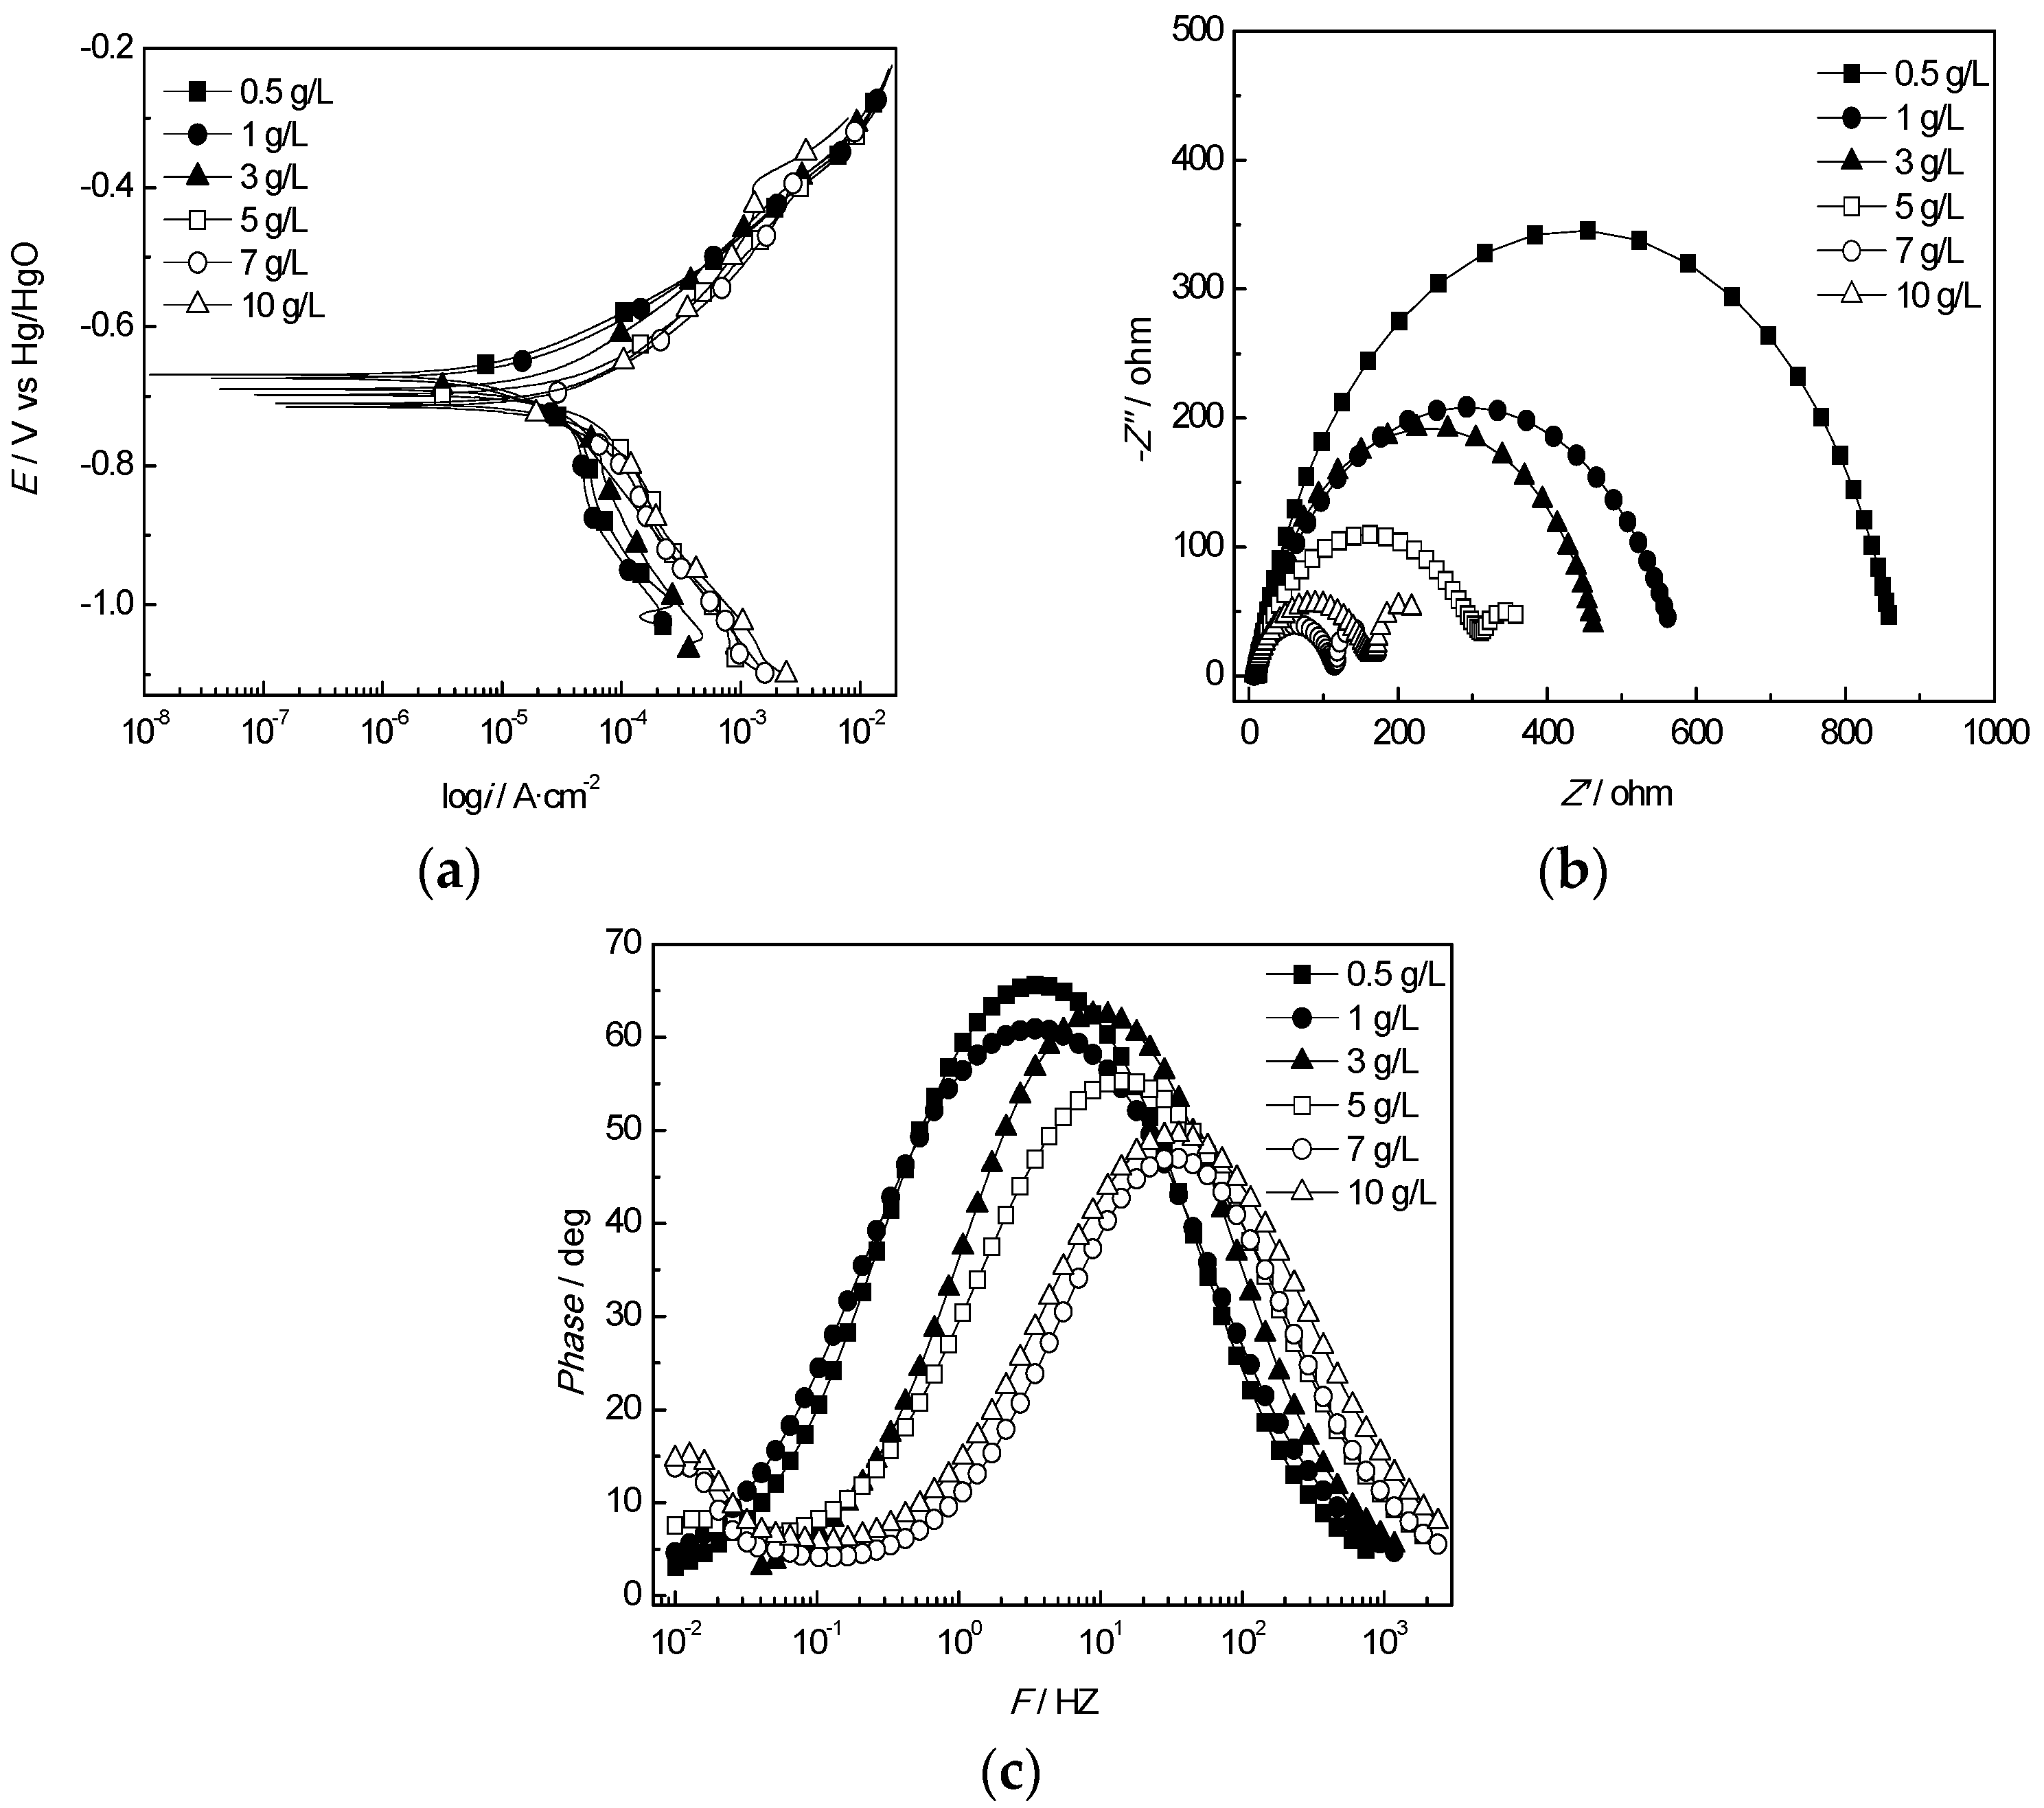
3.2.2. Effect of the Cl− Concentration
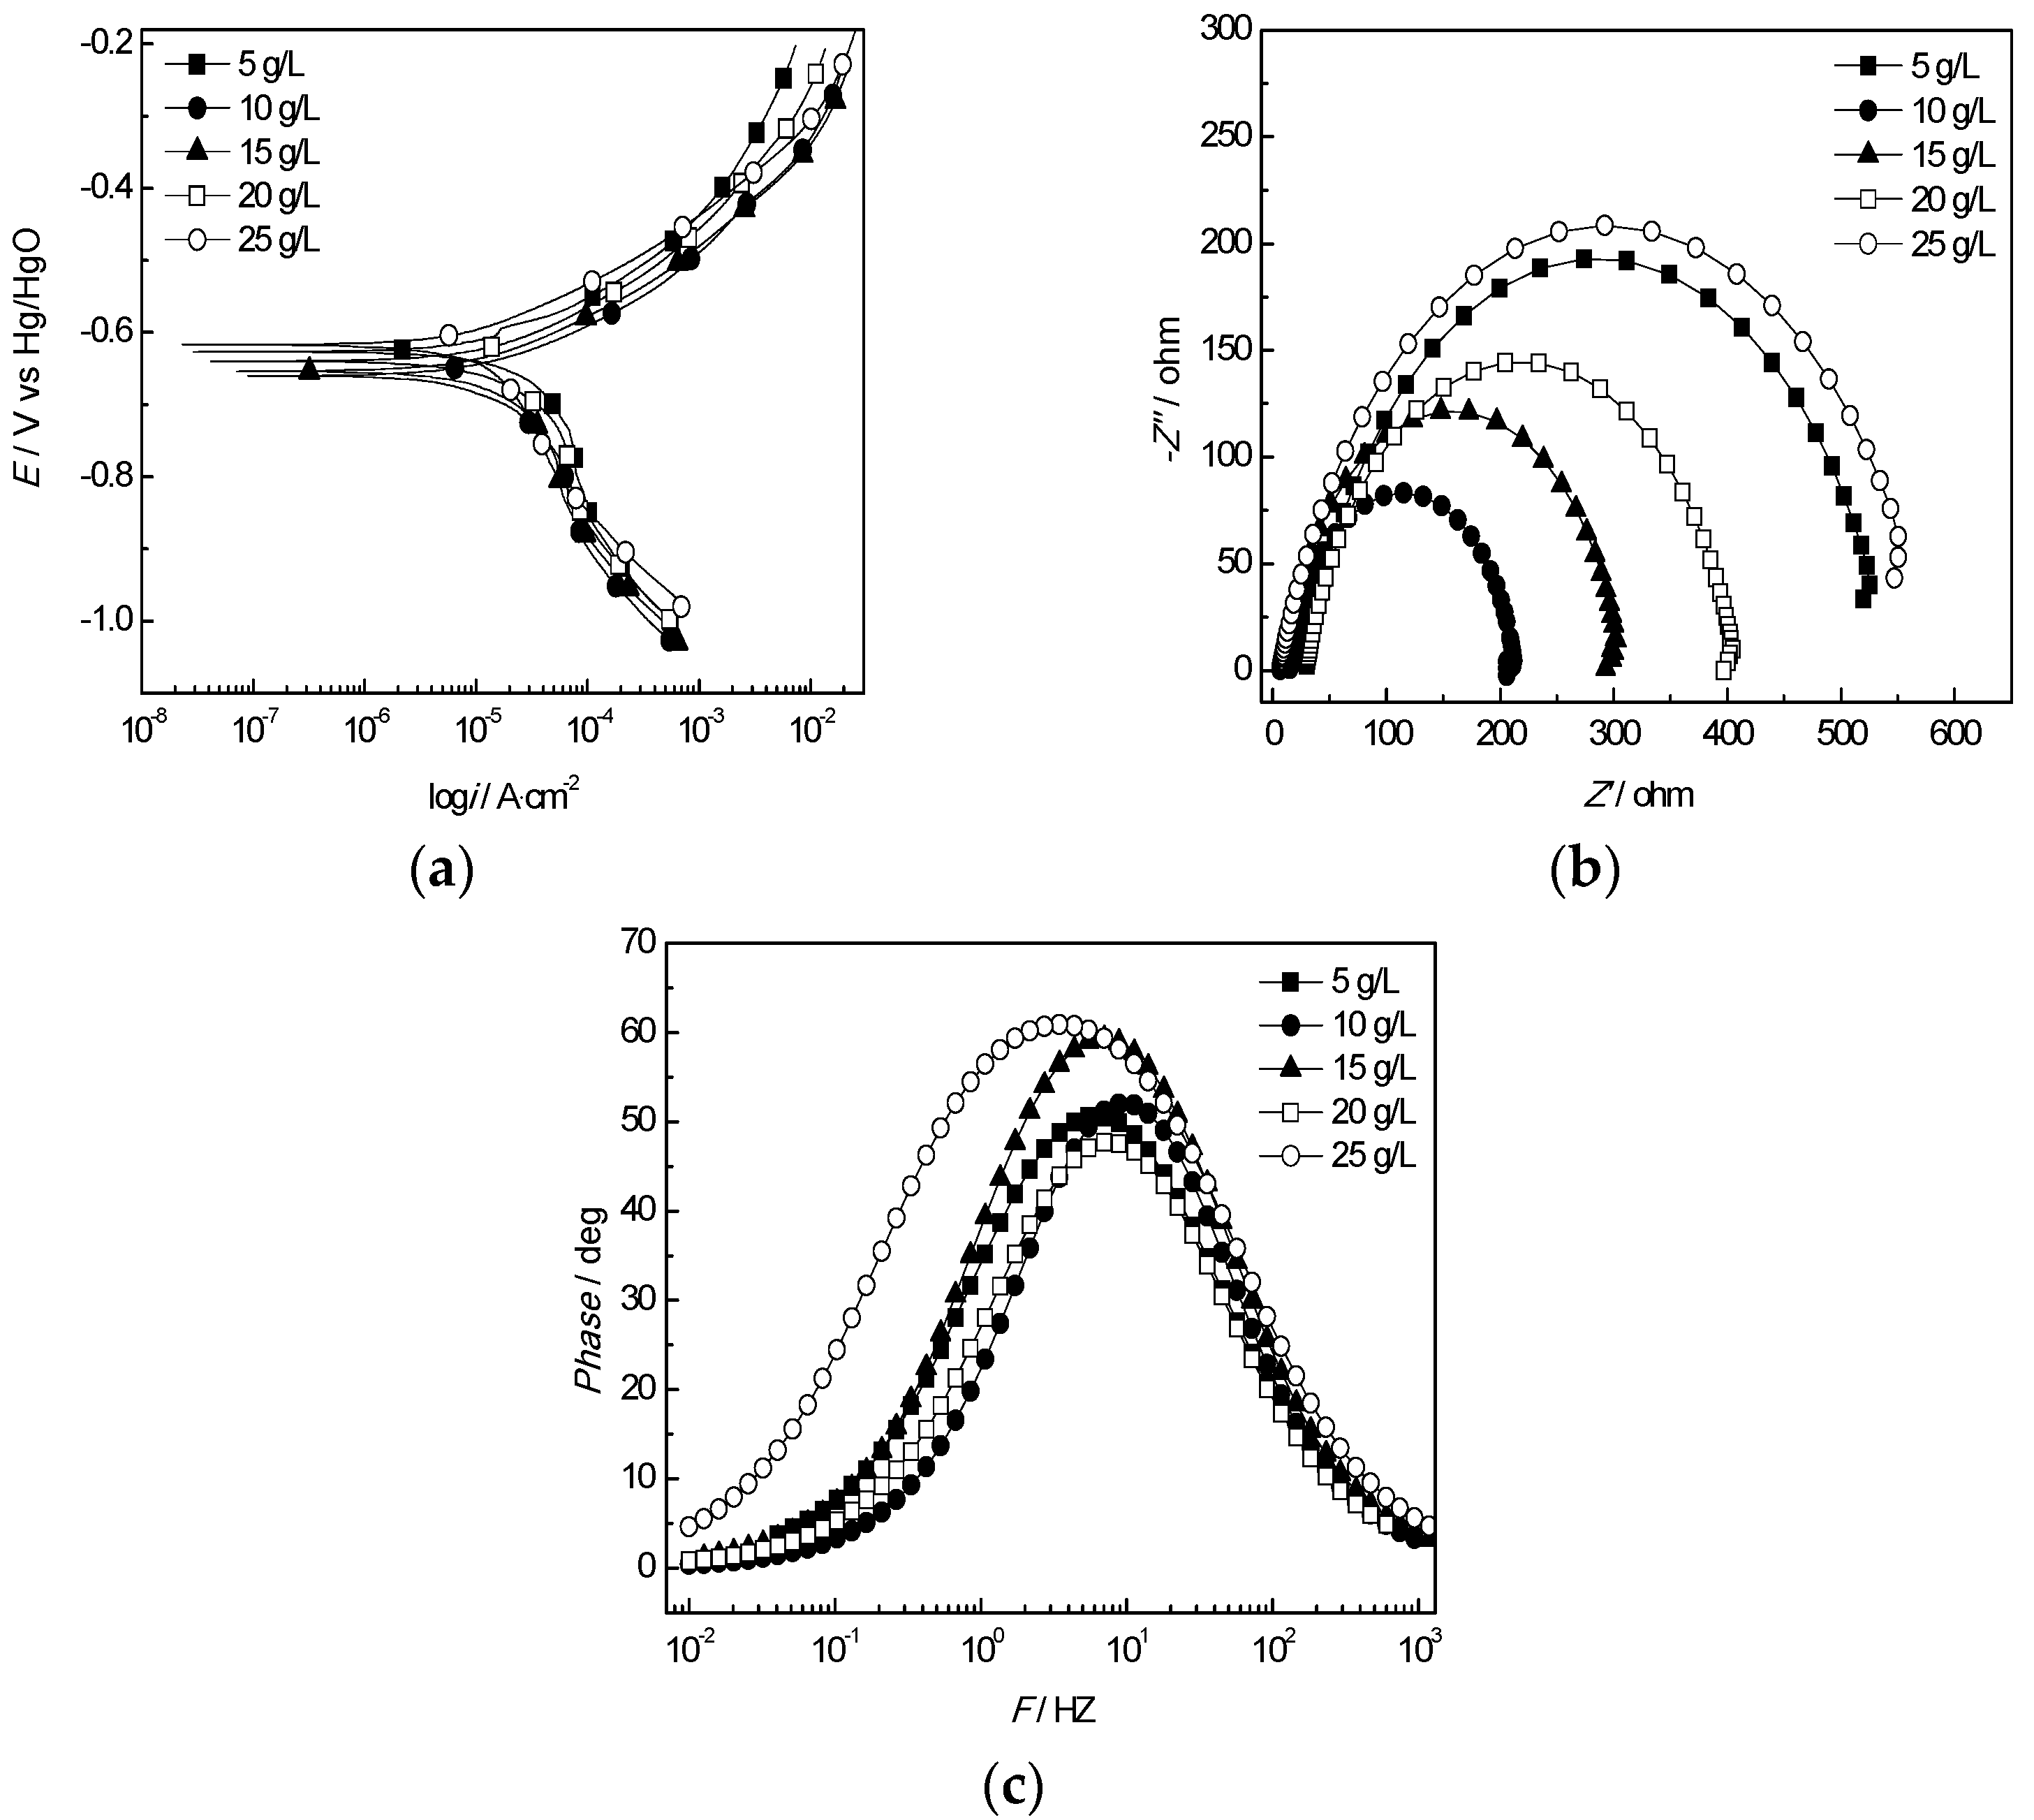
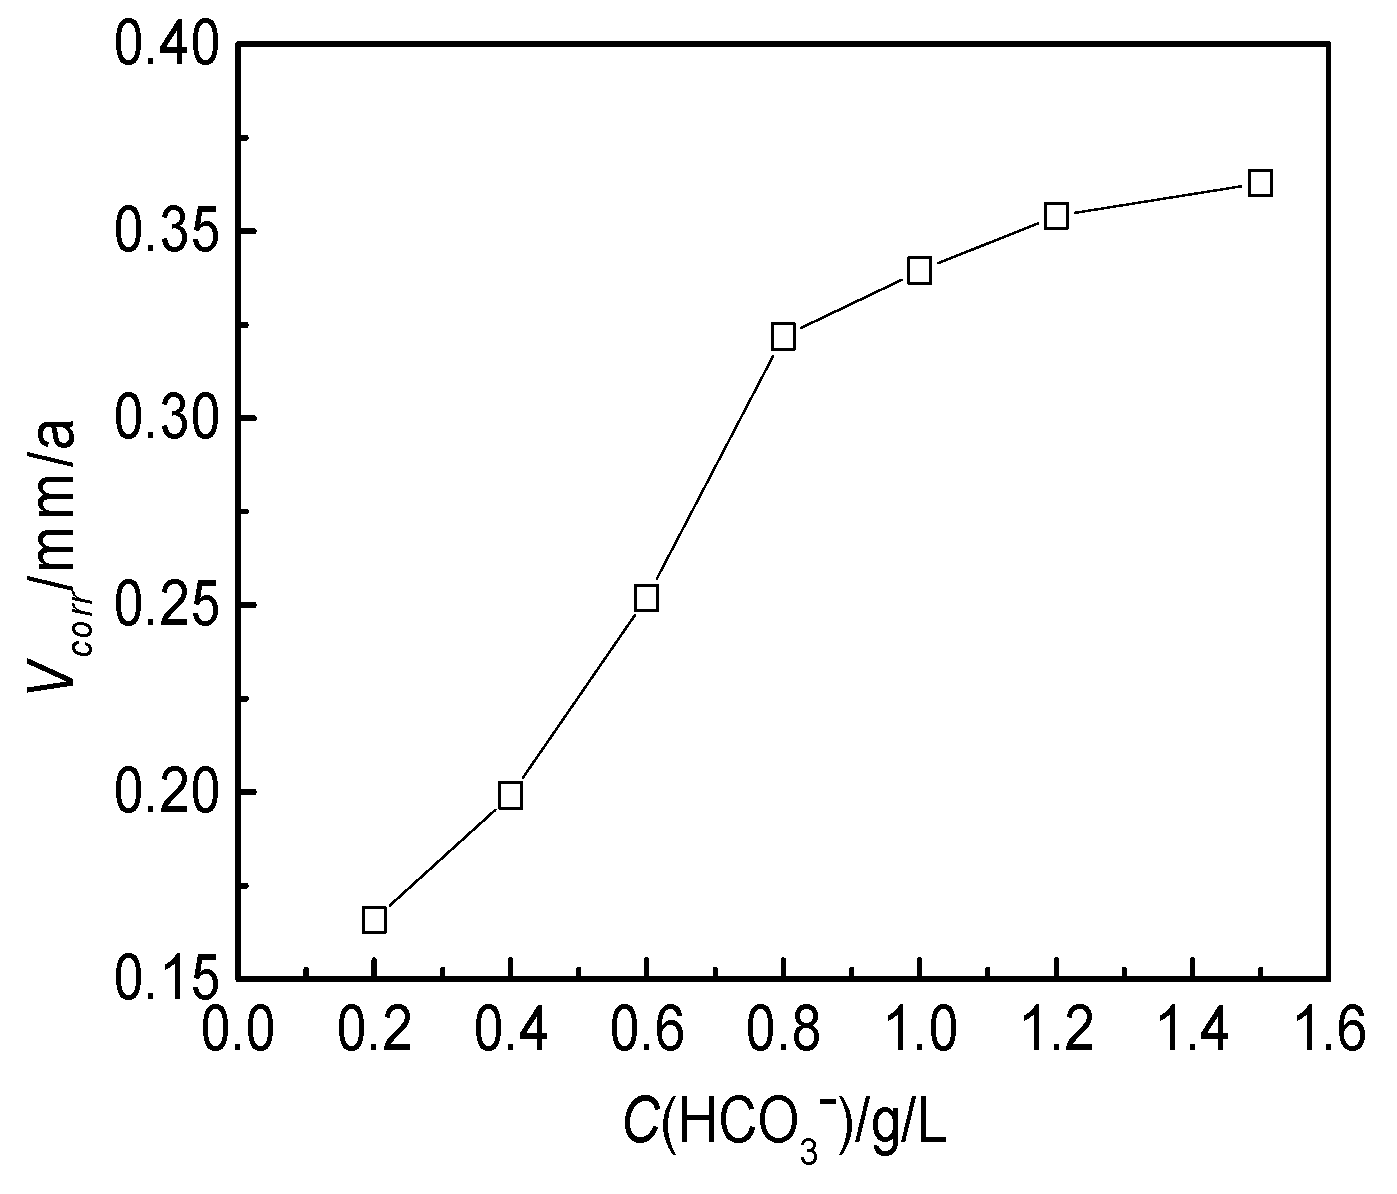
3.2.3. Effect of the HCO3− Concentration
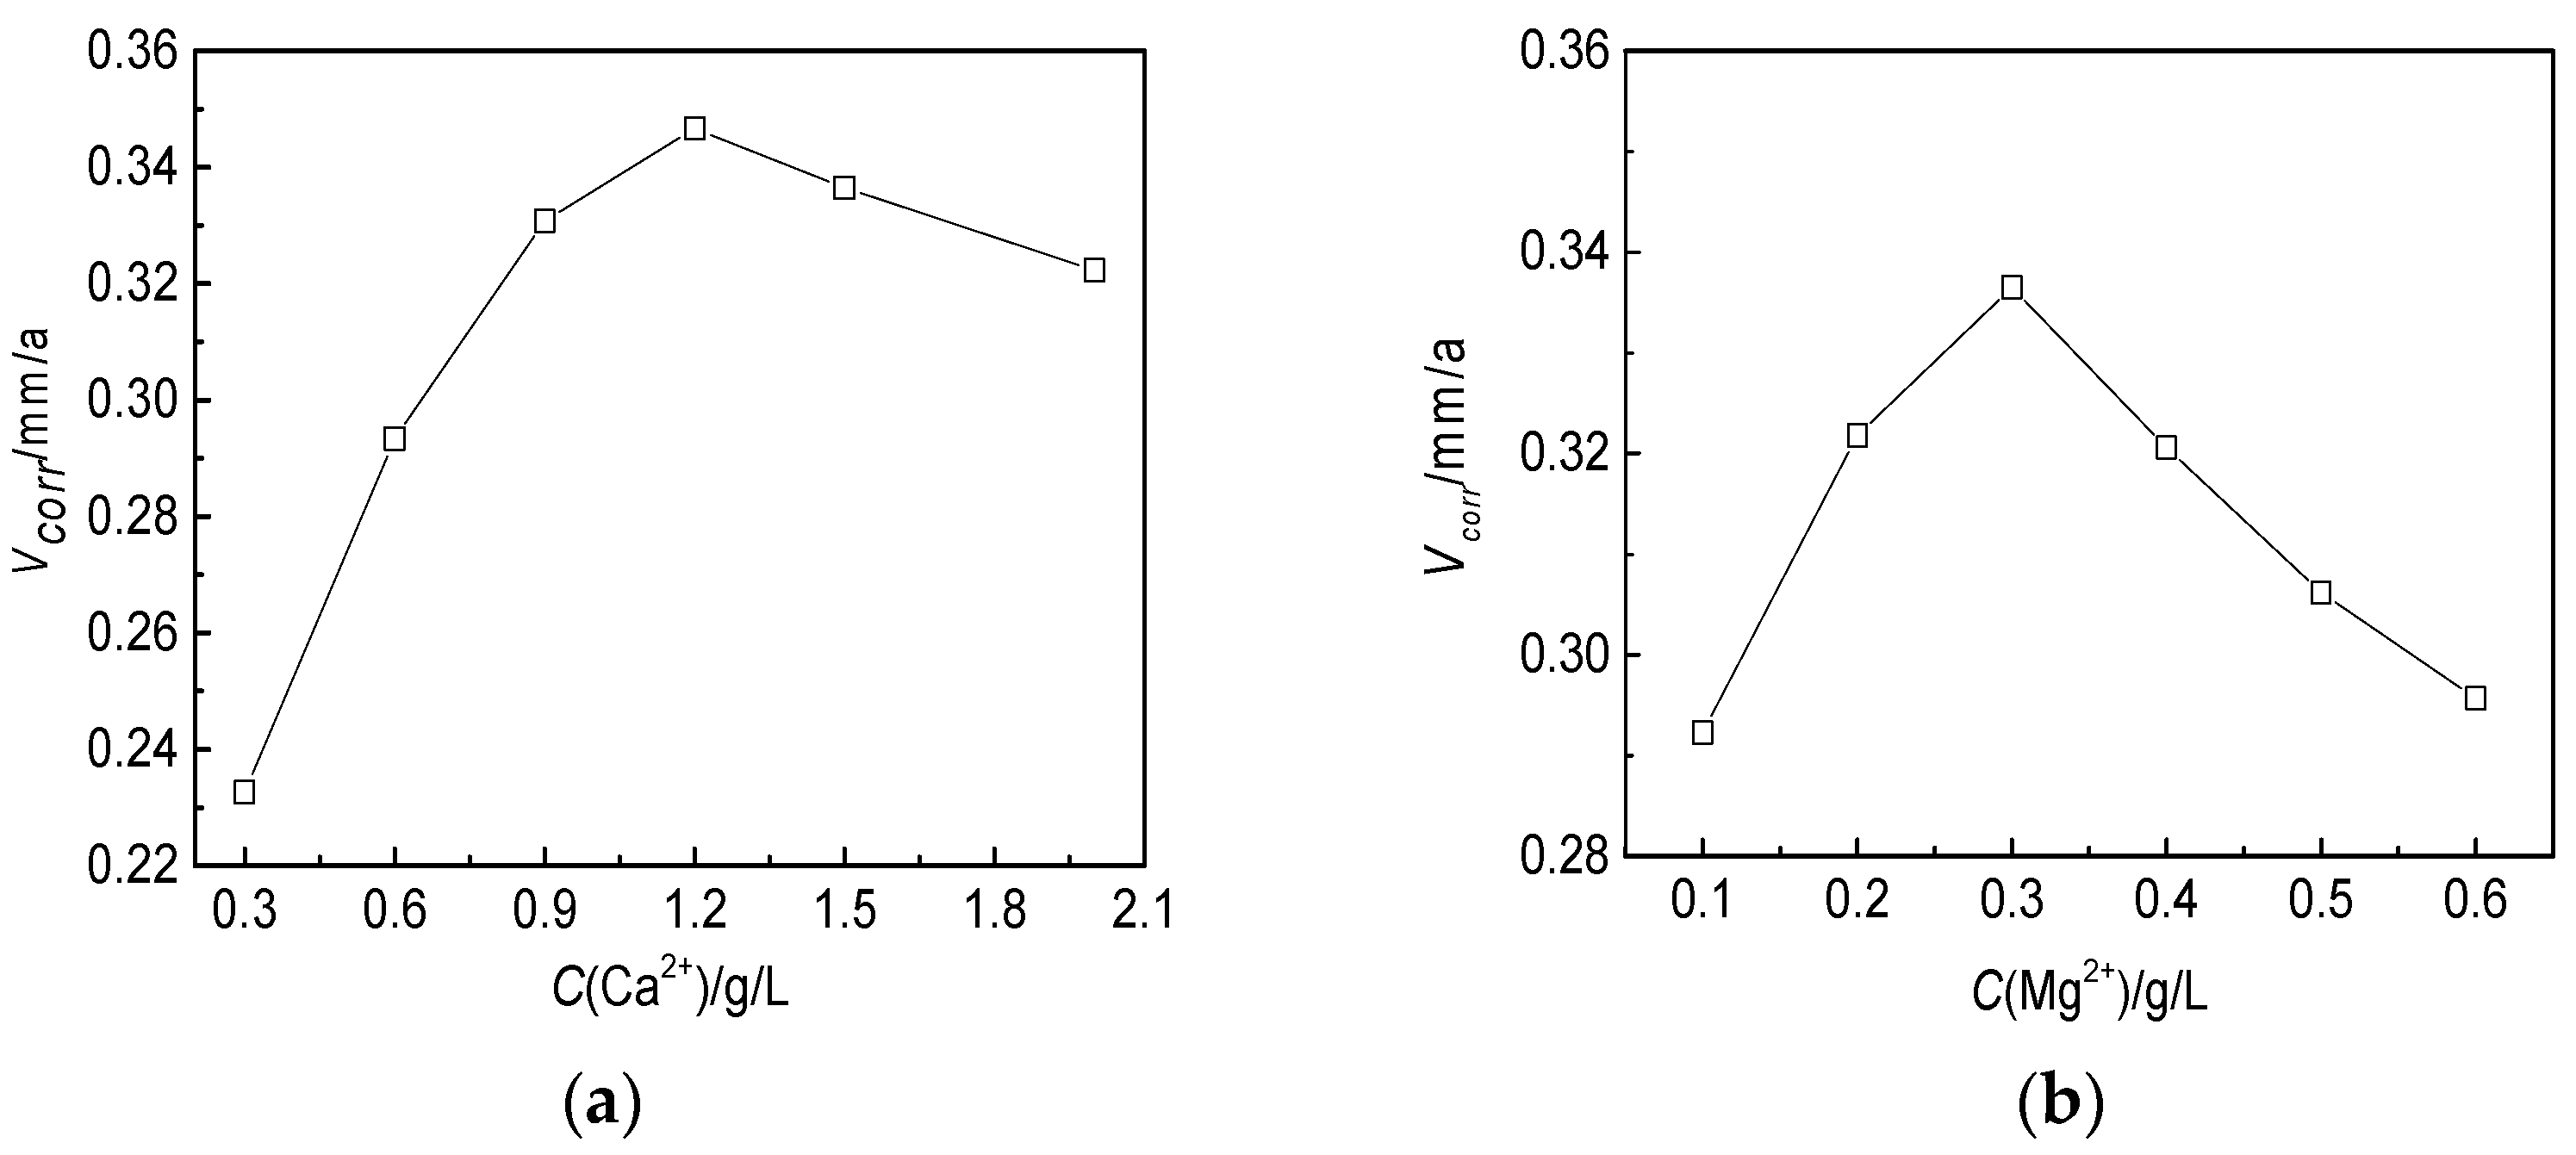
3.2.4. Effects of the Ca2+ and Mg2+ Concentrations
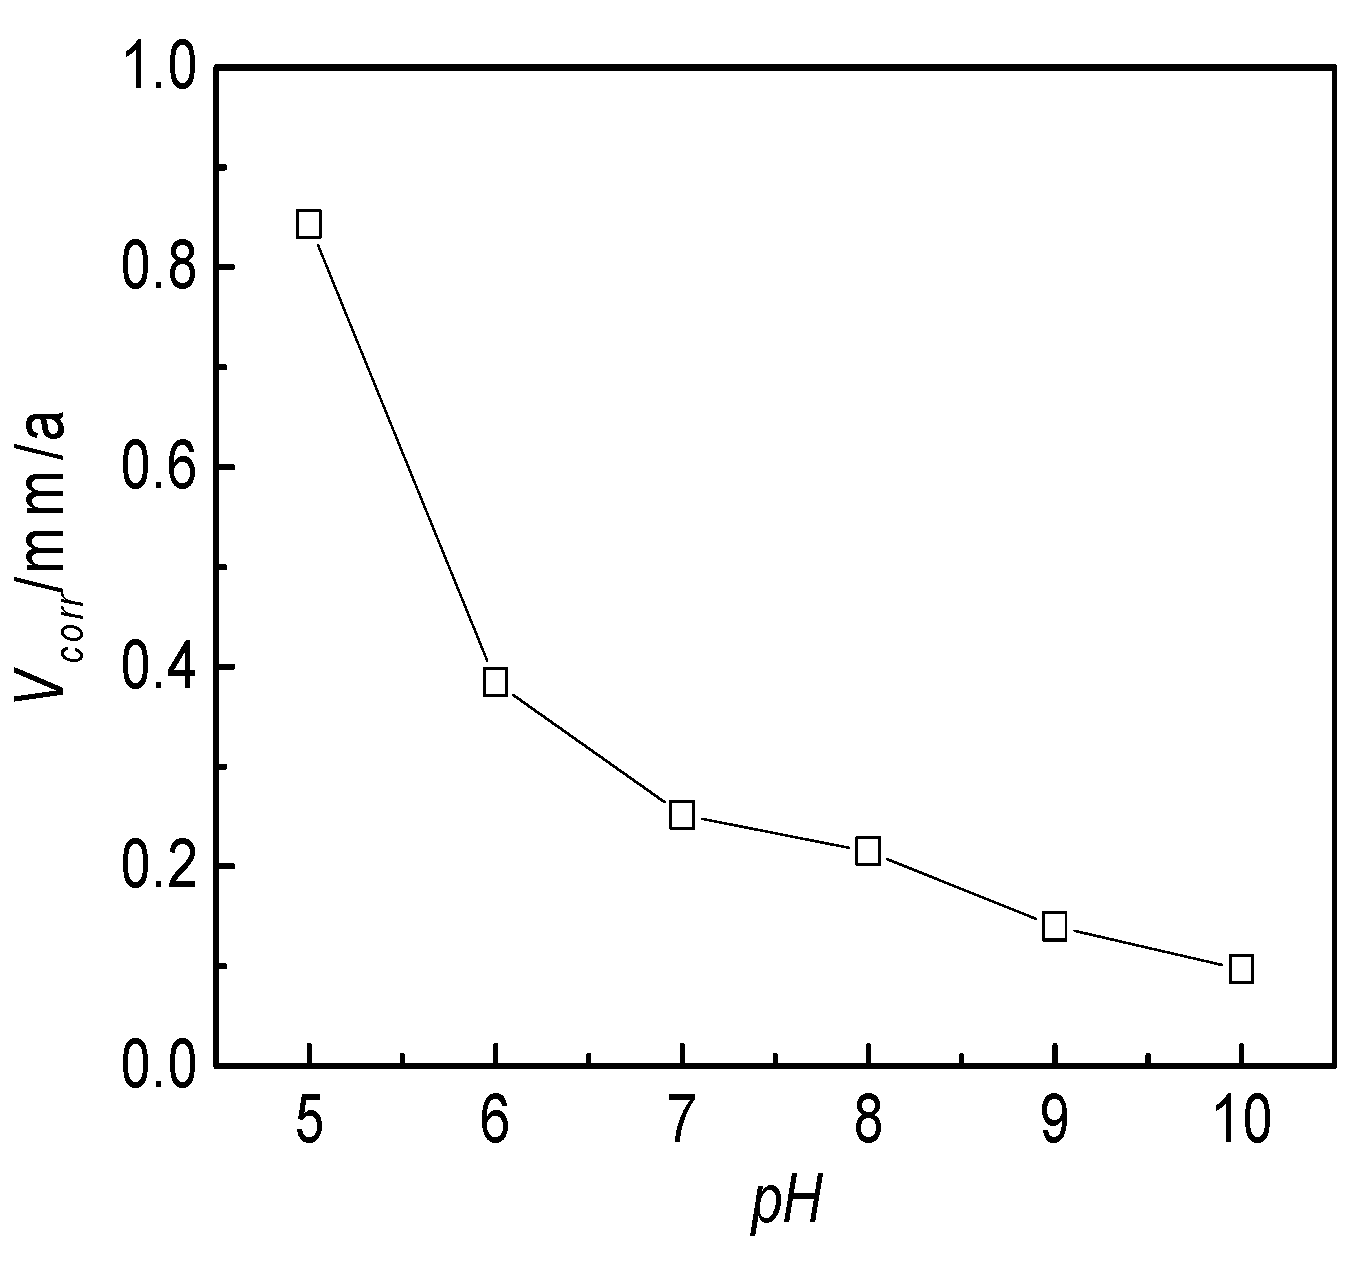
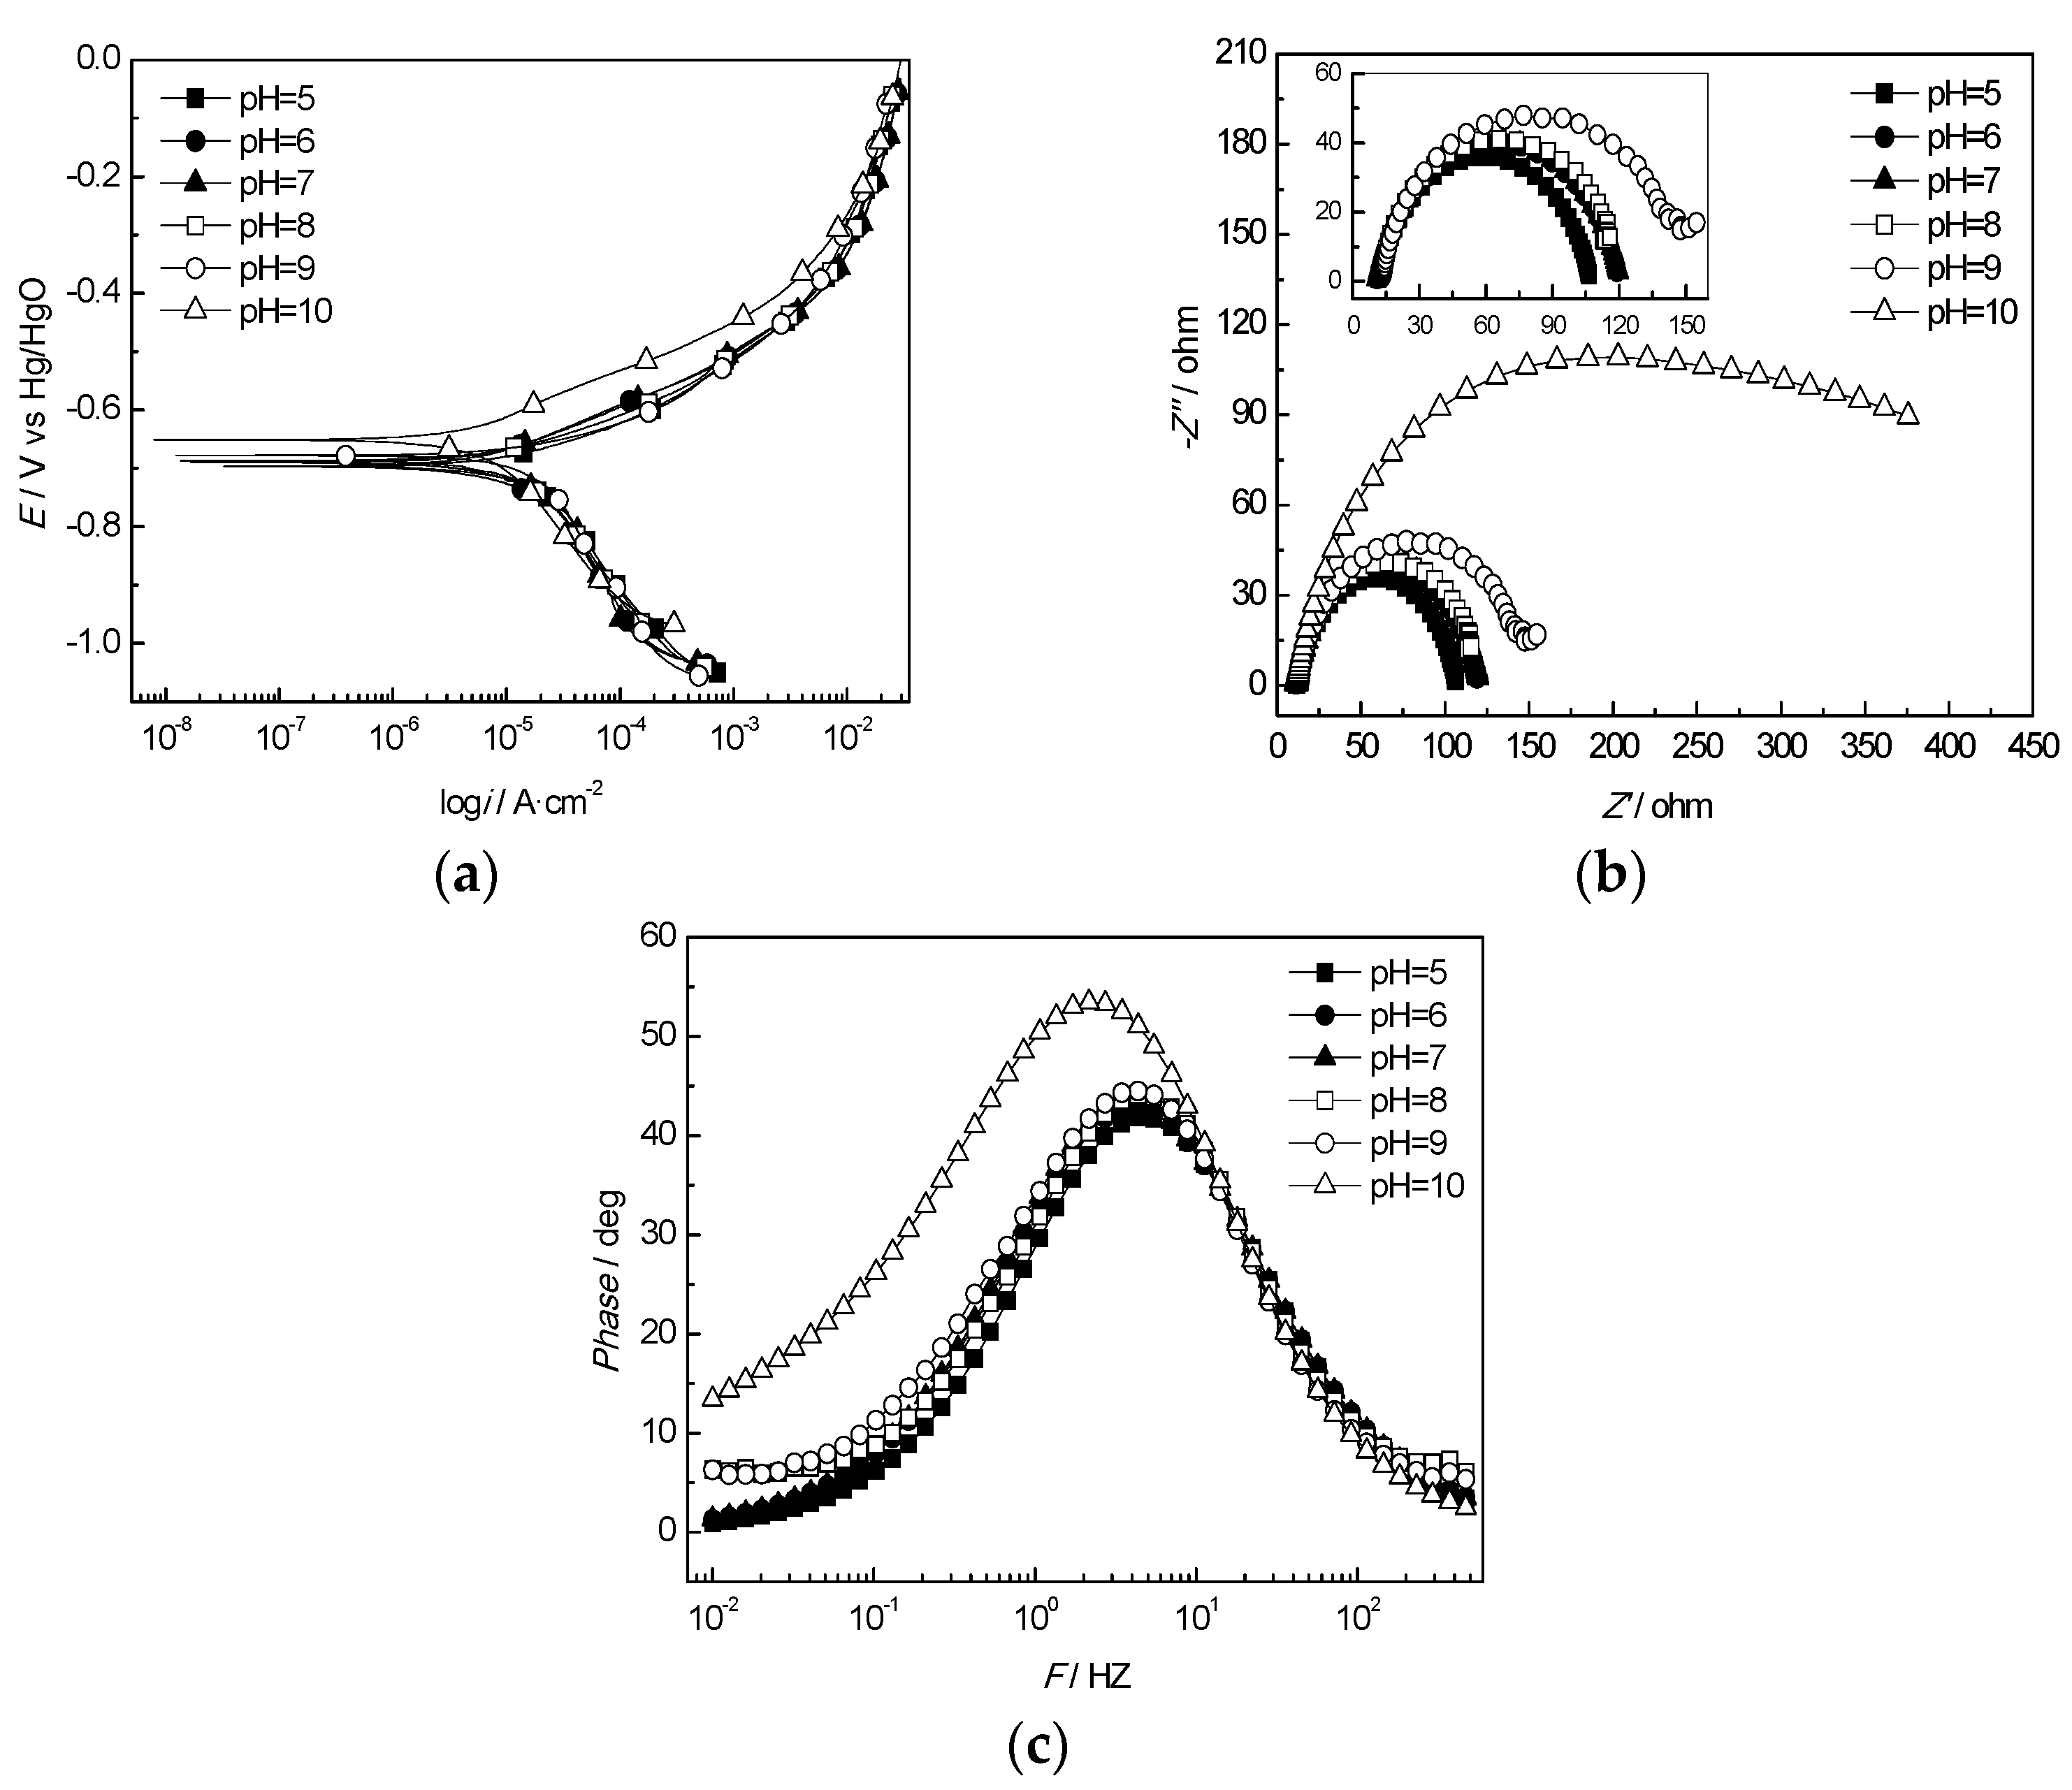
3.2.5. Effect of the pH Value
3.3. Evaluation of the Corrosion Inhibitor Effects
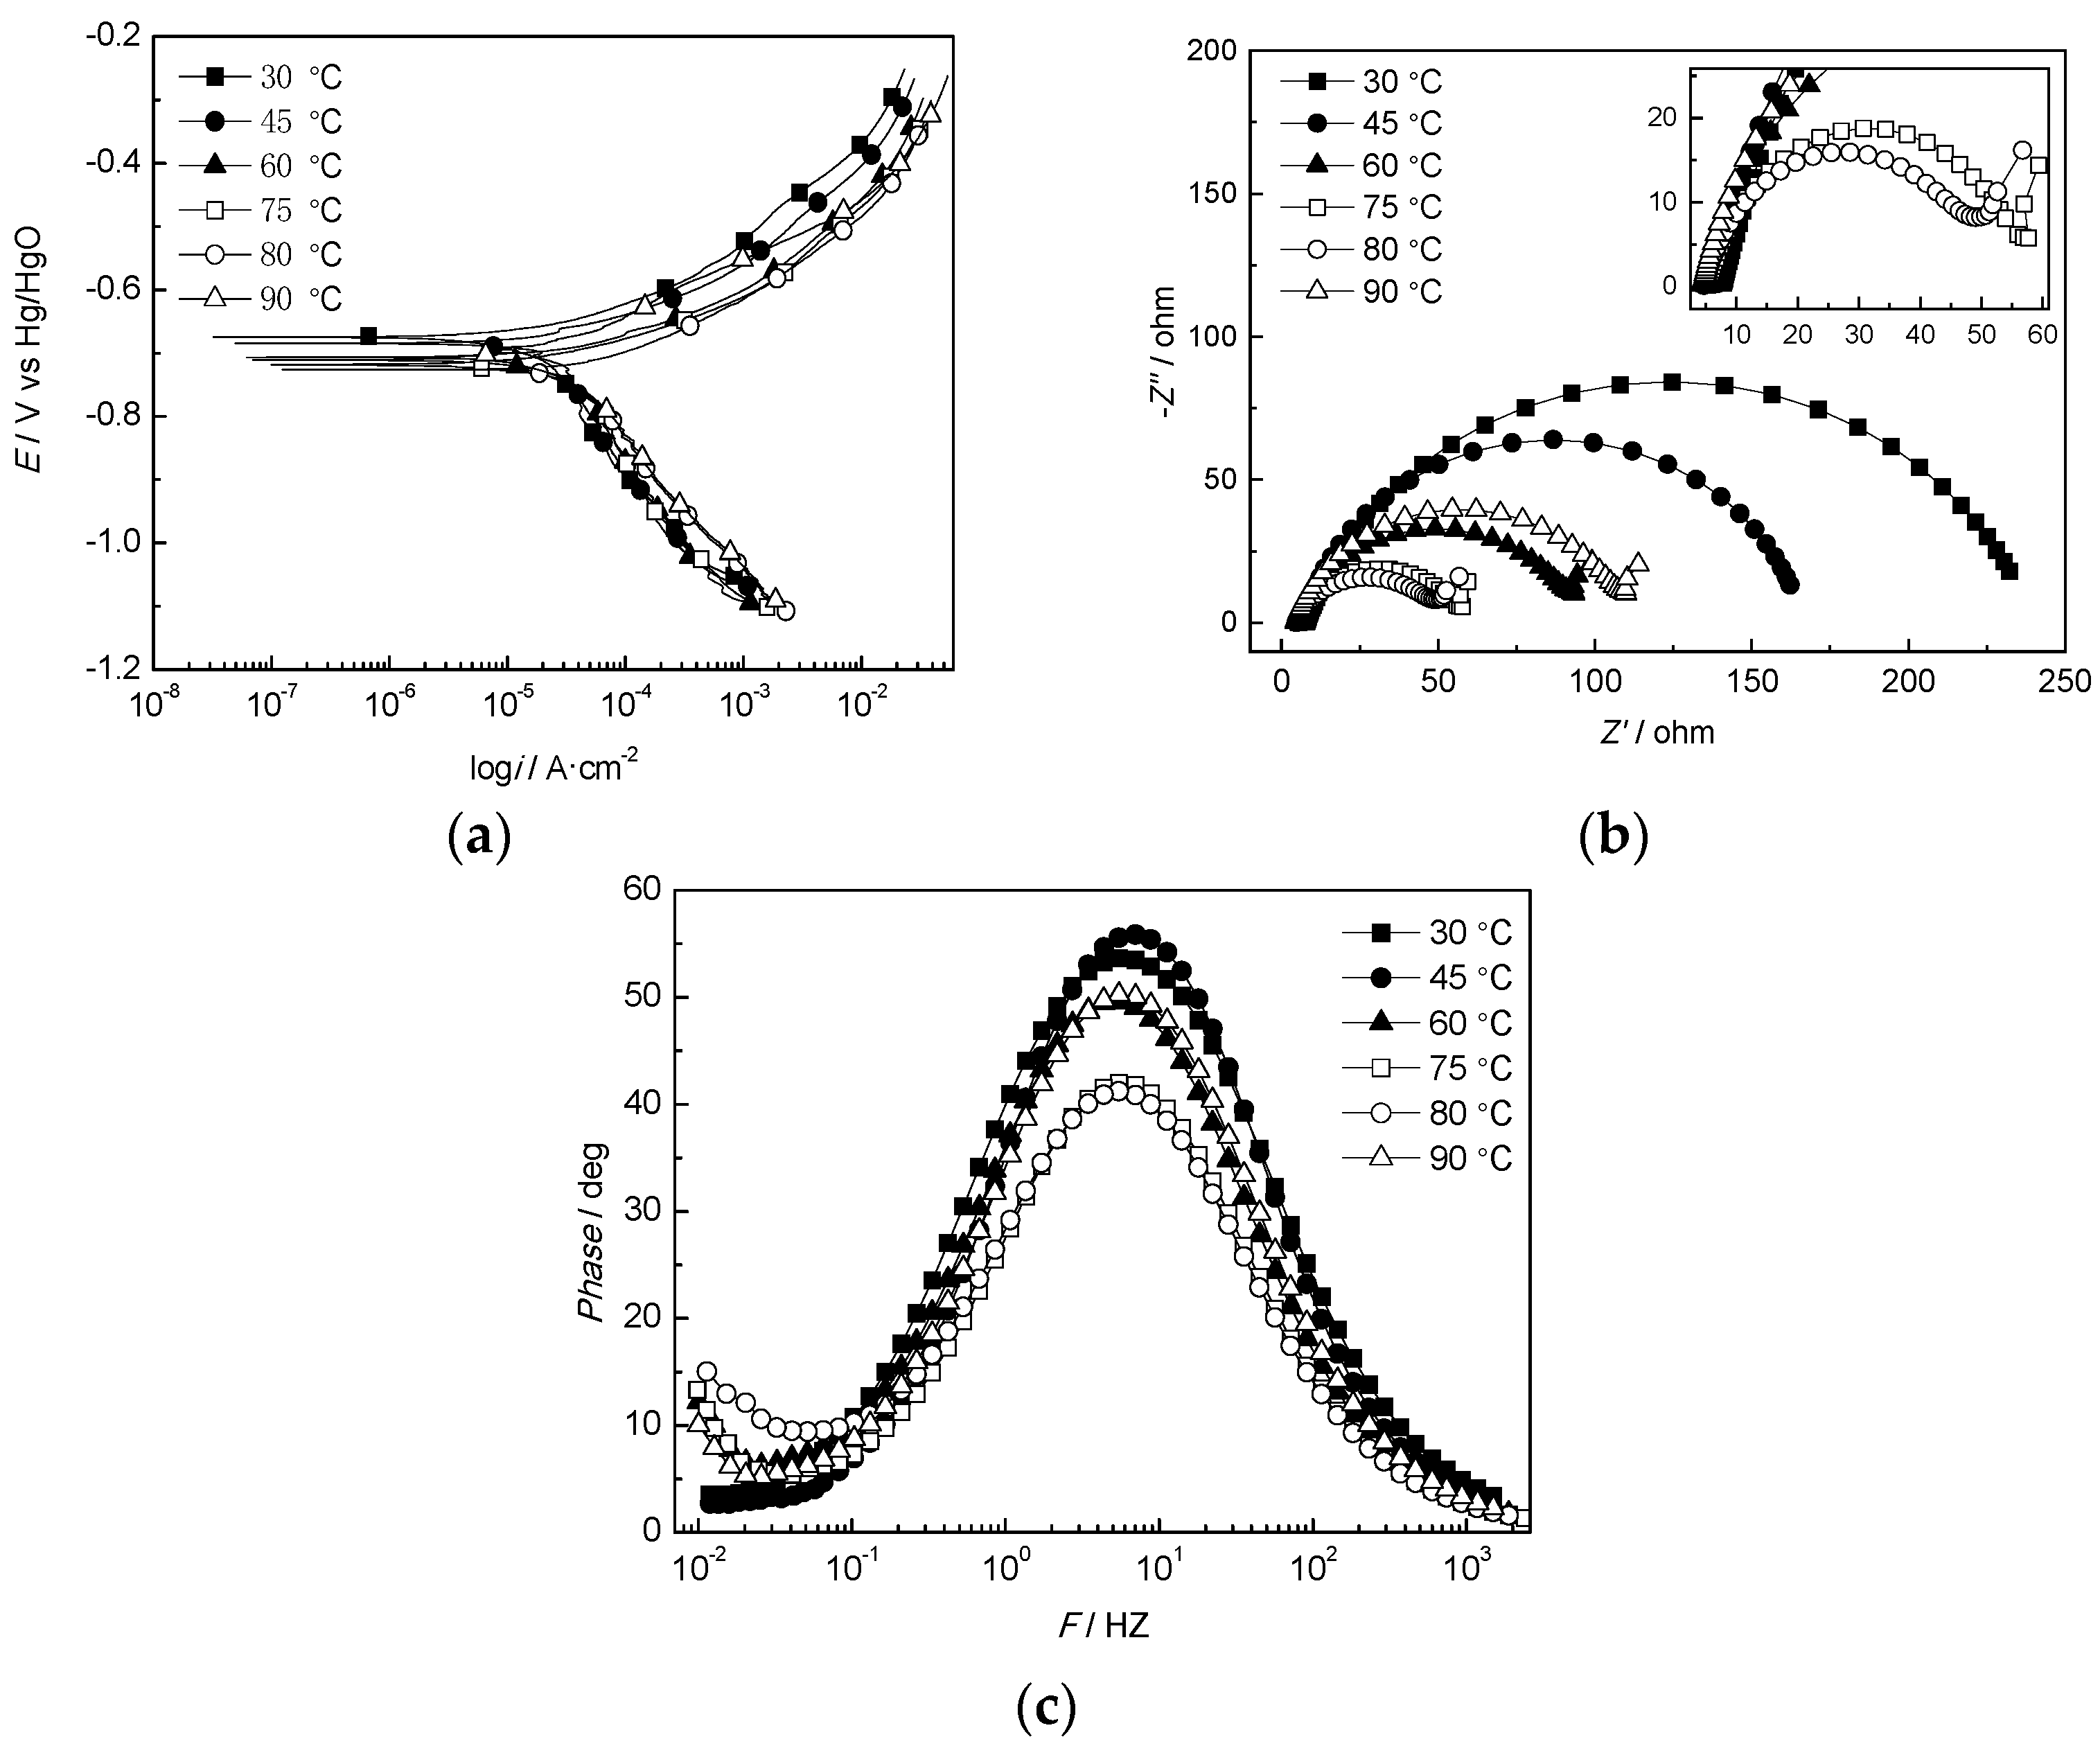
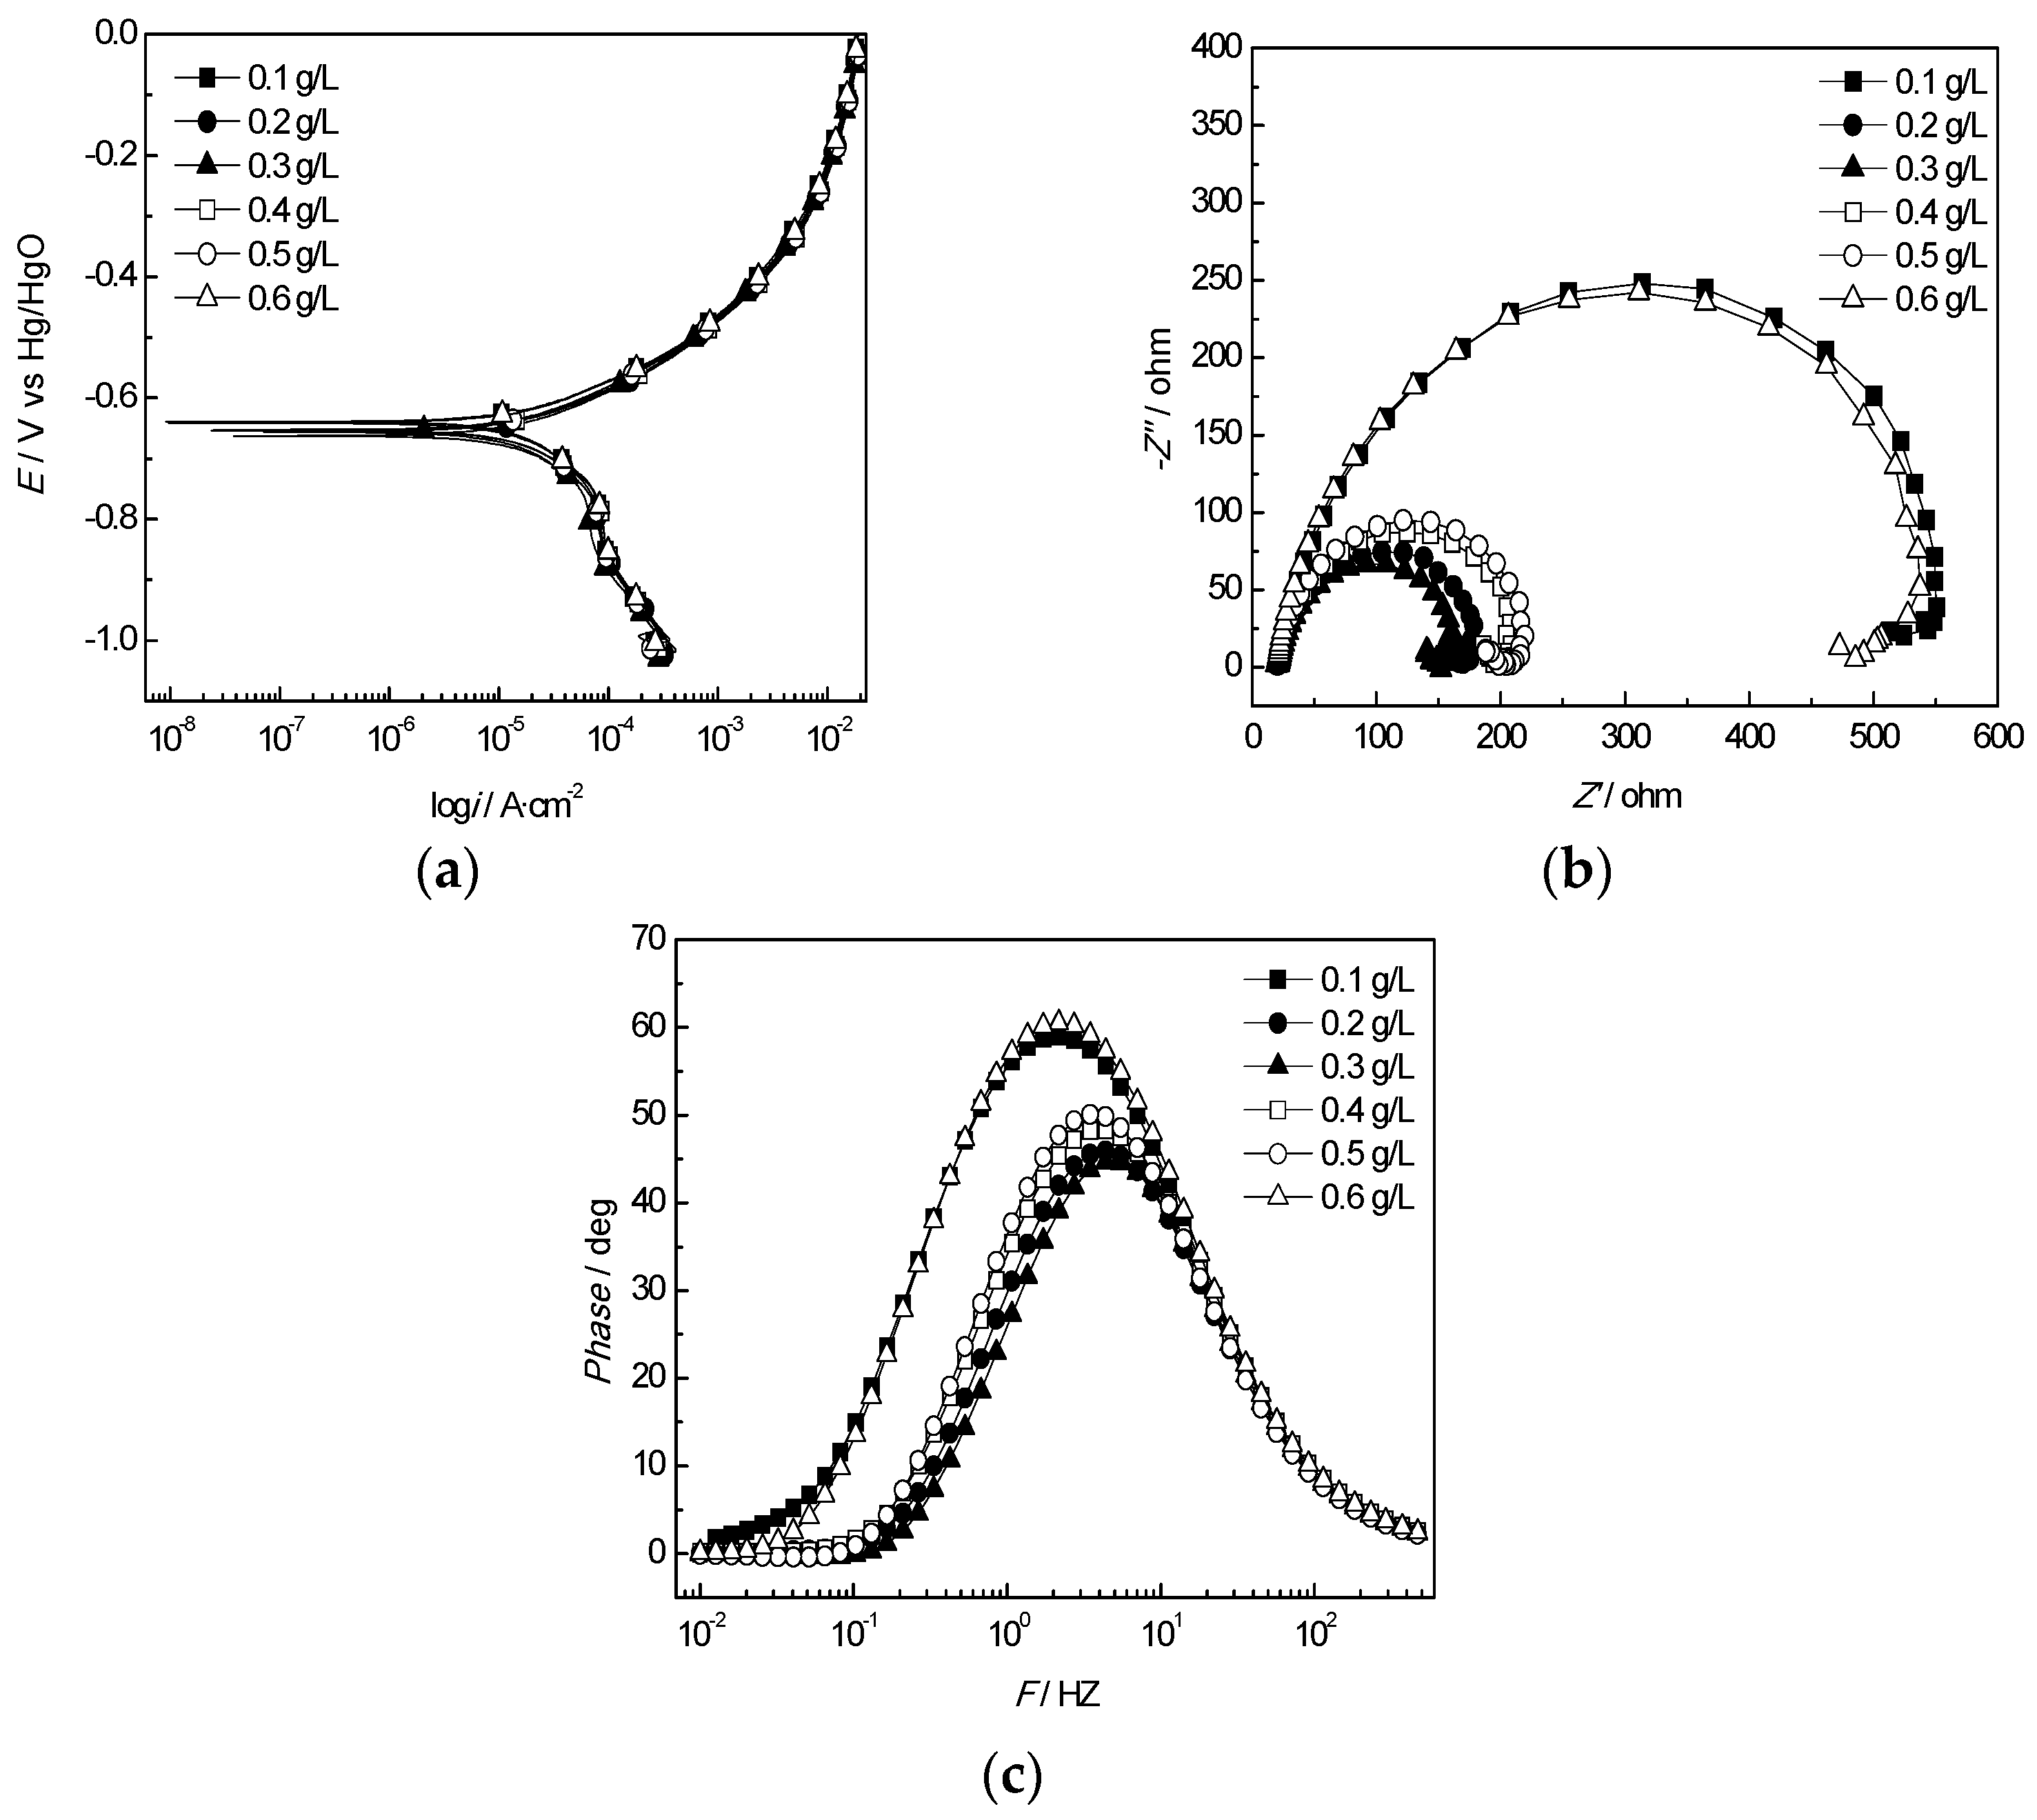
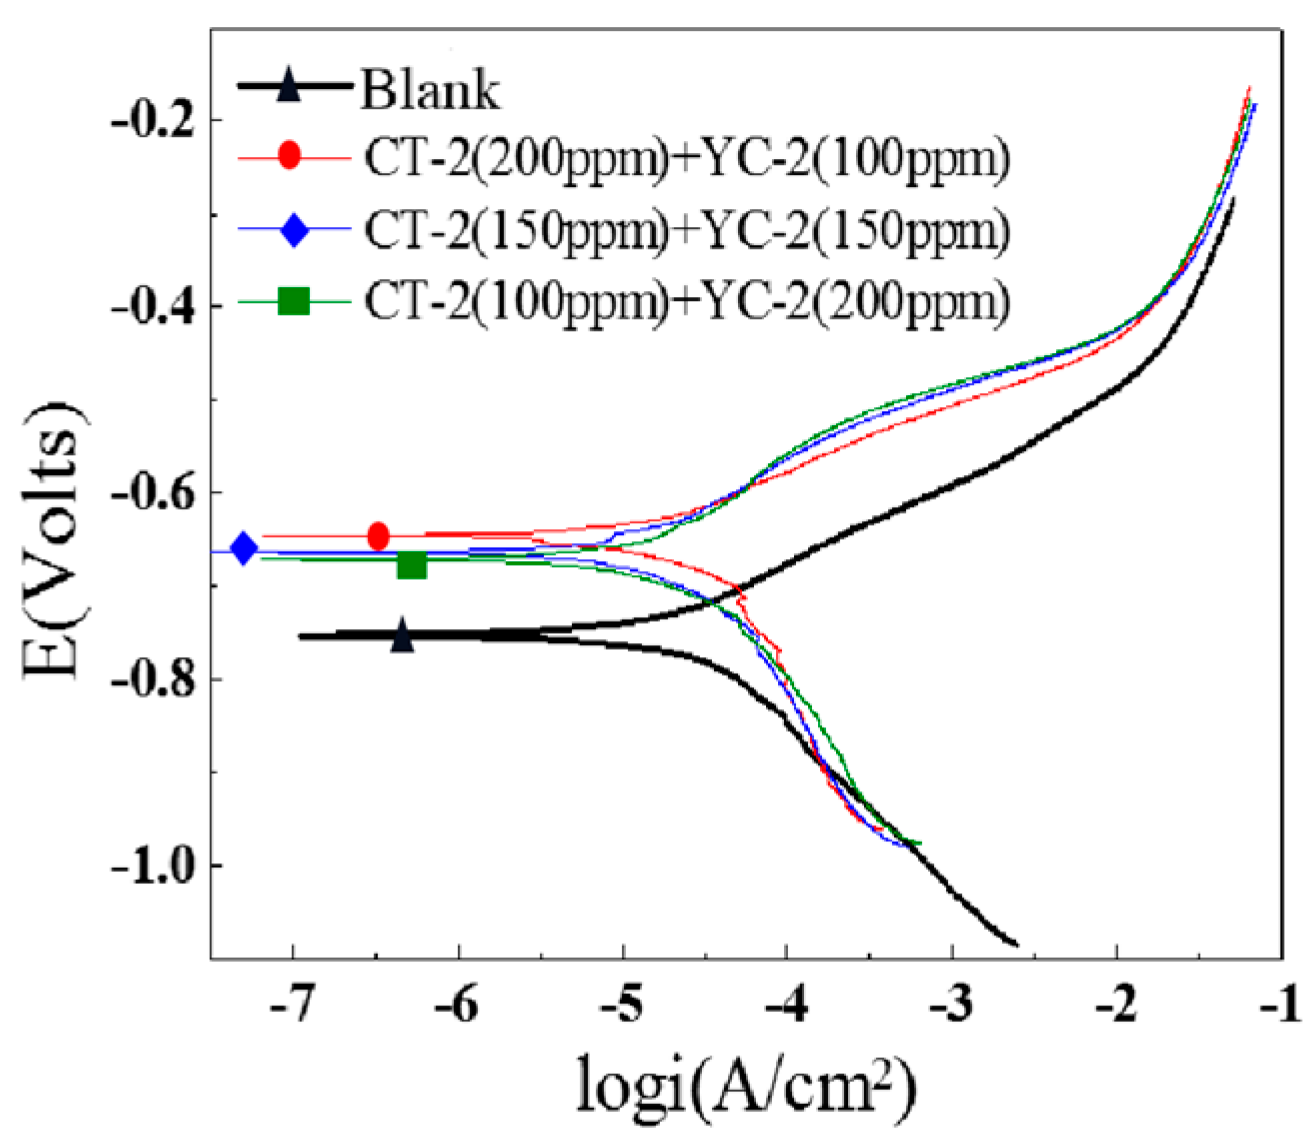
3.3.1. Polarization Curves
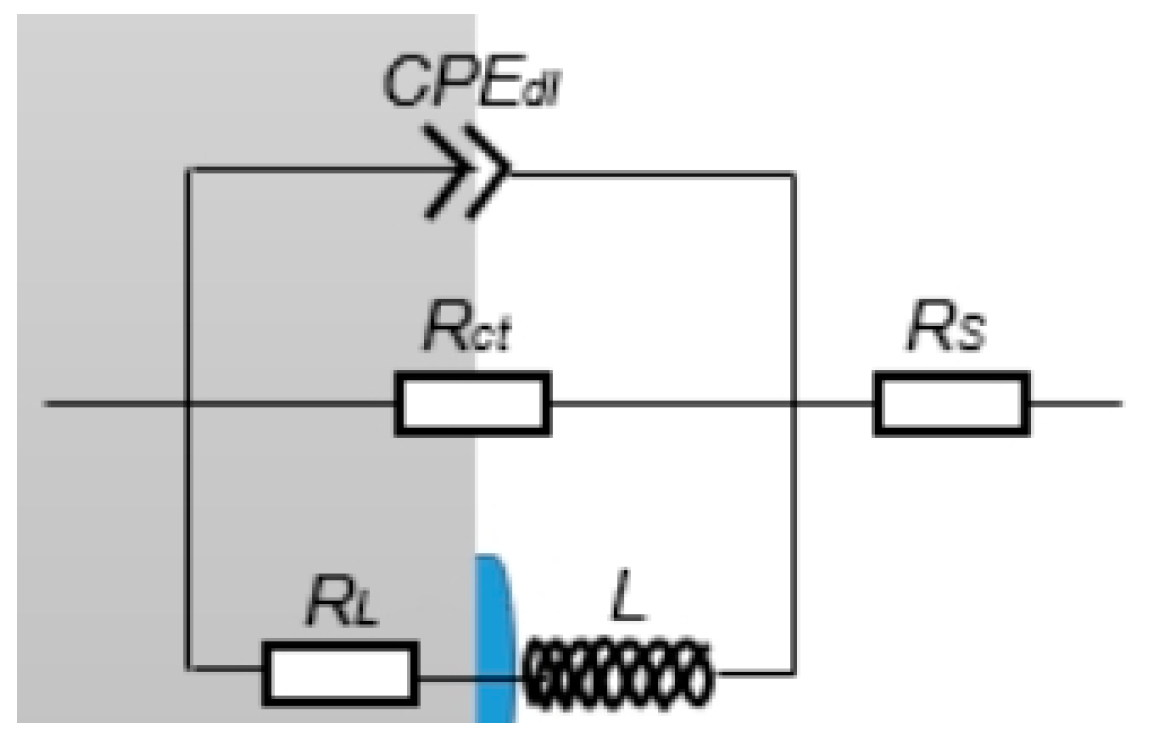
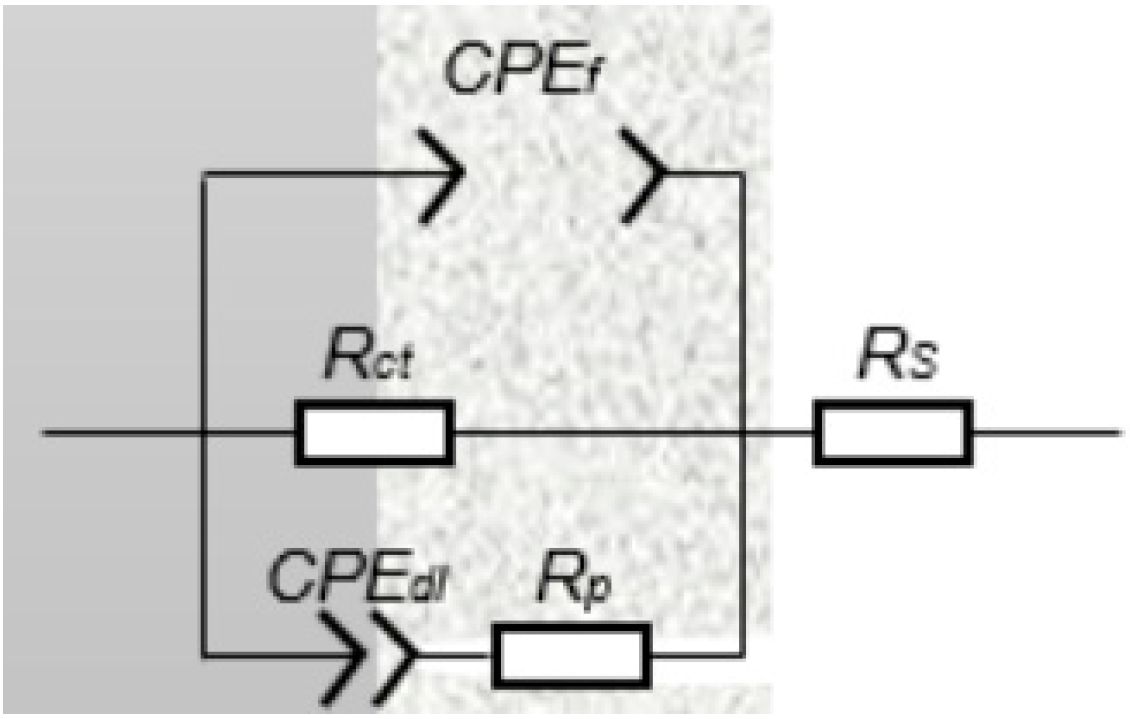
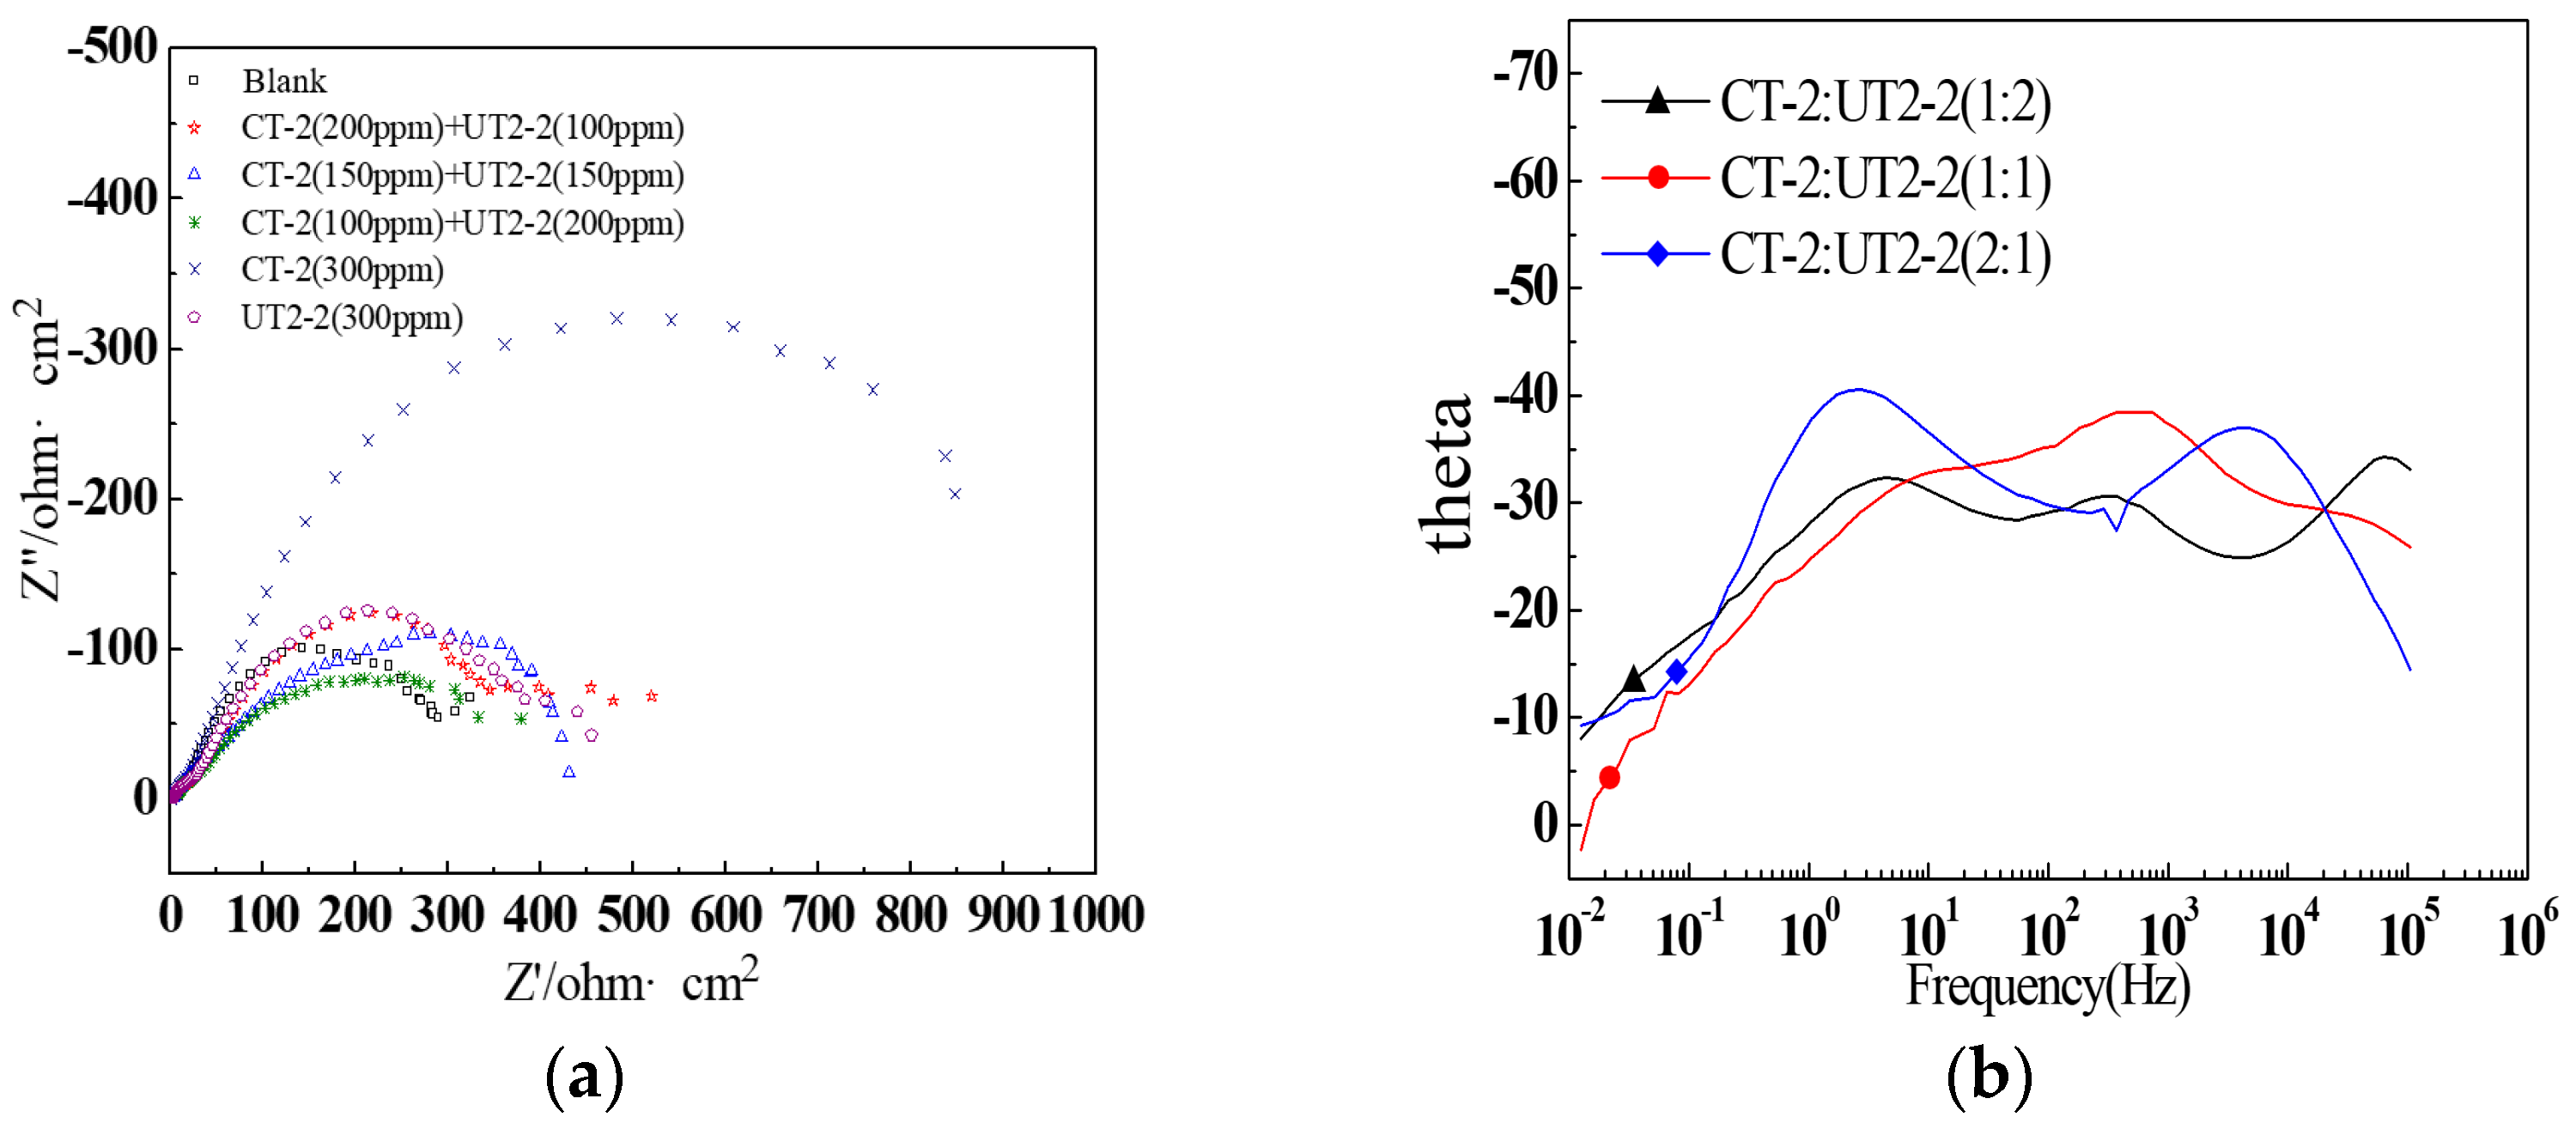
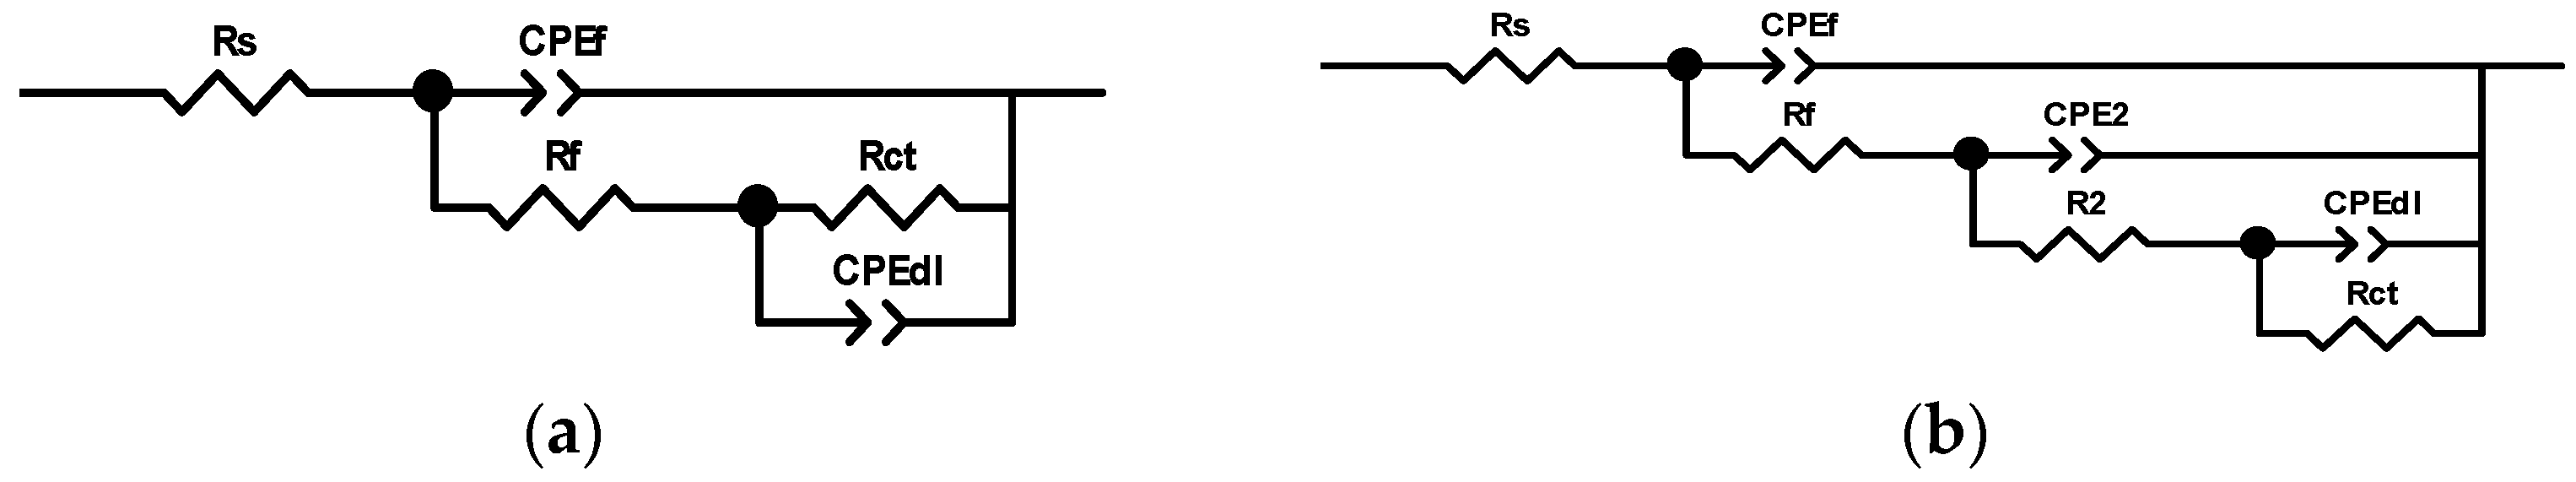
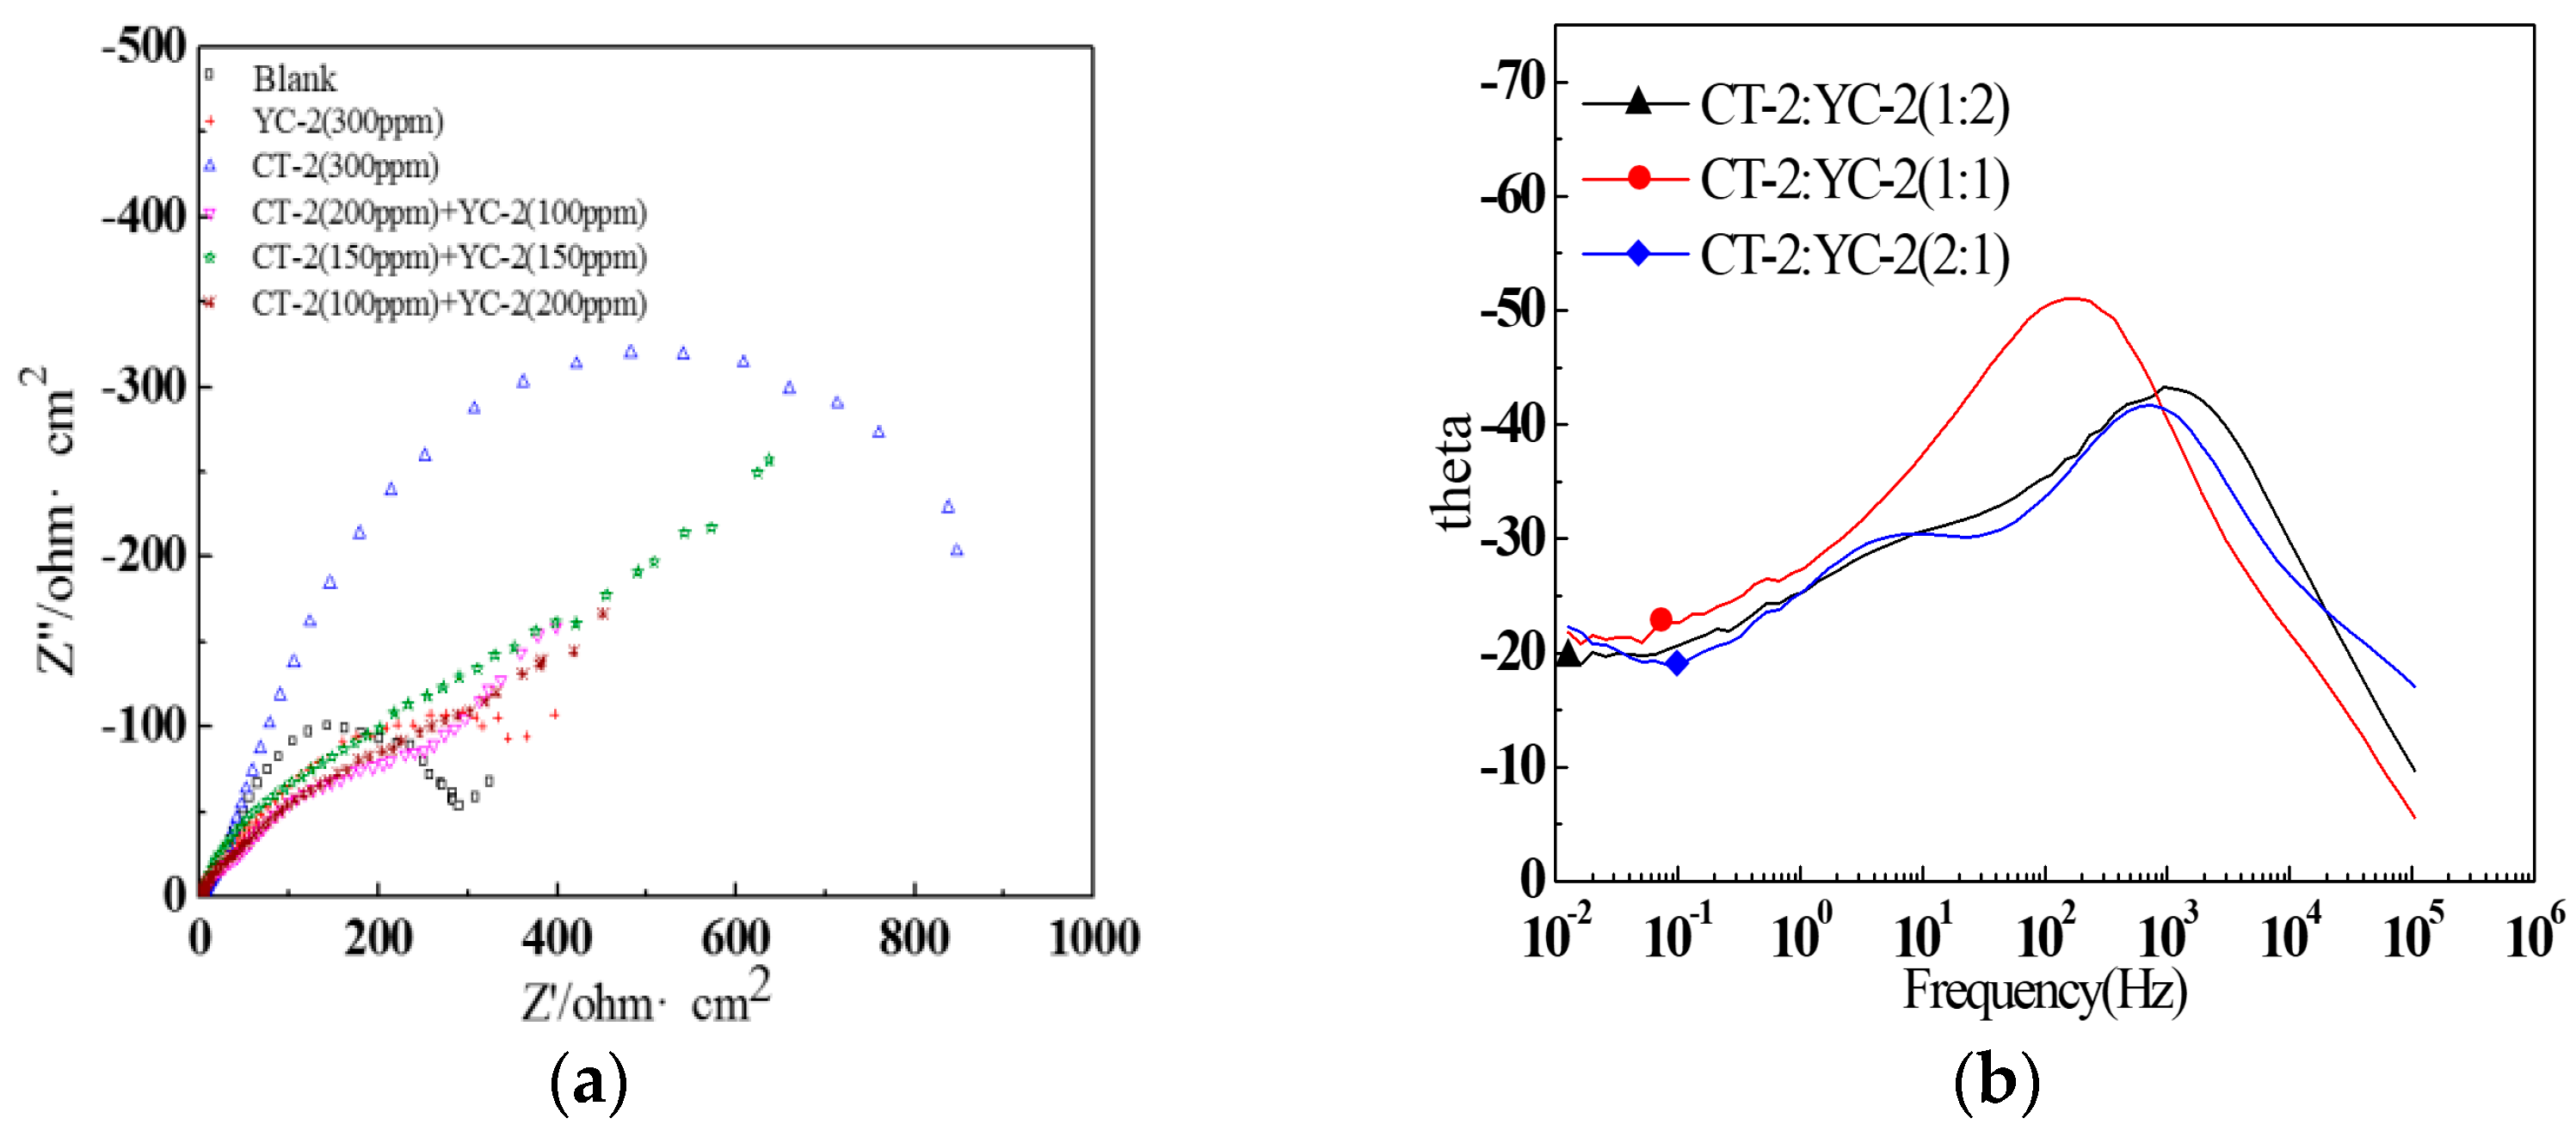
3.3.2. EIS Measurement
3.3.3. Comparison of the Inhibition Effect of UT2-2 for J55, N80 and Grade D
4. Conclusions
- (1)
- The morphology and element analysis of corrosion products of the J55 steel were carried out using a scanning electron microscope. The corrosion product film was loose and there were elements such as C, O and Ca2+. After combining the characteristics of the produced water, the main corrosion factors that affected the J55 steel were pH, HCO3−, Cl−, Ca2+ and Mg2+.
- (2)
- Based on the electrochemical experiment, the effects of temperature, Clˉ, HCO3−, Ca2+, Mg2+ and pH on the corrosion of the J55 steel were studied. Under experimental conditions, the corrosion rate slowed with increasing pH value when the temperature increased from 35 °C to 70 °C. The corrosion rate also increased first and then decreased with increasing Cl−, Ca2+ and Mg2+ ion concentrations, which notably affected the distribution of corrosion pits on the surfaces of the steel.
- (3)
- The inhibition effects of different inhibitors on the J55 steel were evaluated through corrosion experiments, and the inhibitor UT2-2 with the optimal comprehensive performance was screened. The distributions of corrosion pits on the surfaces of the downhole carbon steel were notably affected by the ion concentrations in the produced water. Three types of inhibitors, namely, CT-2, UT2-2 and YC-2, were evaluated. Furthermore, a concentration ratio of 1:1 for CT-2 and UT2-2 showed a prominent film-forming performance. In particular, the corrosion inhibition efficiencies of the three kinds of carbon steel were remarkable and exceeded 84% when the UT2-2 concentration reached 0.18 g/L.
Author Contributions
Funding
Institutional Review Board Statement
Informed Consent Statement
Data Availability Statement
Conflicts of Interest
References
- Deyab, M.A.; Abd El-Rehim, S.S. Effect of succinic acid on carbon steel corrosion in produced water of crude oil. J. Taiwan Inst. Chem. Eng. 2014, 45, 1065–1072. [Google Scholar] [CrossRef]
- Deyab, M.A.; Eddahaoui, K.; Essehli, R.; Rhadfi, T.; Benmokhtar, S.; Mele, G. Experimental evaluation of new inorganic phosphites as corrosion inhibitors for carbon steel in saline water from oil source wells. Desalination 2016, 383, 38–45. [Google Scholar] [CrossRef]
- Li, J.; Sun, C.; Shuang, S.; Roostaei, M.; Fattahpour, V.; Mahmoudi, M.; Zeng, H.; Luo, J. Investigation on the flow-induced corrosion and degradation behavior of underground J55 pipe in a water production well in the Athabasca oil sands reservoir. J. Petrol. Sci. Eng. 2019, 182, 106325. [Google Scholar] [CrossRef]
- Zhu, S.D.; Wei, J.F.; Cai, R.; Bai, Z.Q.; Zhou, G.S. Failure analysis of P110 tubing string in the ultra-deep oil well. Eng. Fail. Anal. 2011, 18, 950–962. [Google Scholar] [CrossRef]
- Cirimello, P.G.; Otegui, J.L.; Carfi, G.; Morris, W. Failure and integrity analysis of casings used for oil well drilling. Eng. Fail. Anal. 2017, 75, 1–14. [Google Scholar] [CrossRef]
- El-Askalany, A.H.; Mostafa, S.I.; Shalabi, K.; Eid, A.M.; Shaaban, S. Novel tetrazole-based symmetrical diselenides as corrosion inhibitors for N80 carbon steel in 1 M HCl solutions: Experimental and theoretical studies. J. Mol. Liq. 2016, 223, 497–508. [Google Scholar] [CrossRef]
- Ituen, E.B.; James, A.O.; Akaranta, O. Fluvoxamine-based corrosion inhibitors for J55 steel in aggressive oil and gas well treatment fluids. Egy. J. Pet. 2017, 26, 745–756. [Google Scholar] [CrossRef]
- Hegazy, M.A.; El-Etre, A.Y.; El-Shafaie, M.; Berry, K.M. Novel cationic surfactants for corrosion inhibition of carbon steel pipelines in oil and gas wells applications. J. Mol. Liq. 2016, 214, 347–356. [Google Scholar] [CrossRef]
- Obot, I.B.; Onyeachu, I.B.; Umoren, S.A.; Quraishi, M.A.; Sorour, A.A.; Chen, T.; Aljeaban, N.; Wang, Q. High temperature sweet corrosion and inhibition in the oil and gas industry: Progress, challenges and future perspectives. J. Petrol. Sci. Eng. 2020, 185, 106469. [Google Scholar] [CrossRef]
- Abd El-Lateef, H.M.; Abu-Dief, A.M.; Mohamed, M.A.A. Corrosion inhibition of carbon steel pipelines by some novel Schiff base compounds during acidizing treatment of oil wells studied by electrochemical and quantum chemical methods. J. Mol. Struct. 2017, 1130, 522–542. [Google Scholar] [CrossRef]
- Ammar, S.; Iling, A.W.M.; Ramesh, K.; Ramesh, S. Development of fully organic coating system modified with epoxidized soybean oil with superior corrosion protection performance. Prog. Org. Coat. 2020, 140, 105523. [Google Scholar] [CrossRef]
- Shi, Z.; Ouyang, Y.; Qiu, R.; Hu, S.; Zhang, Y.; Chen, M.; Wang, P. Bioinspired superhydrophobic and oil-infused nanostructured surface for Cu corrosion inhibition: A comparison study. Prog. Org. Coat. 2019, 131, 49–59. [Google Scholar] [CrossRef]
- Wongpanya, P.; Saramas, Y.; Chumkratoke, C.; Wannakomol, A. Erosion–corrosion behaviors of 1045 and J55 steels in crude oil. J. Petrol. Sci. Eng. 2020, 189, 106965. [Google Scholar] [CrossRef]
- Zhang, H.; Lan, H.; Lin, N. A numerical simulation of water distribution associated with internal corrosion induced by water wetting in upward inclined oil pipes. J. Petrol. Sci. Eng. 2019, 173, 351–361. [Google Scholar] [CrossRef]
- Askari, M.; Aliofkhazraei, M.; Ghaffari, S.; Hajizadeh, A. Film former corrosion inhibitors for oil and gas pipelines-A technical review. J Nat. Gas Sci. Eng. 2018, 58, 92–114. [Google Scholar] [CrossRef]
- Farelas, F.; Galicia, M.; Brown, B.; Nesic, S.; Castaneda, H. Evolution of dissolution processes at the interface of carbon steel corroding in a CO2 environment studied by EIS. Corros. Sci. 2010, 52, 509–517. [Google Scholar] [CrossRef]
- Chen, Y.; Wang, X.H.; Li, J.; Lu, J.L.; Wang, F.S. Long-term anticorrosion behaviour of polyaniline on mild steel. Corros. Sci. 2007, 49, 3052–3063. [Google Scholar] [CrossRef]
- Lukács, Z.; Molnár, F.; Kovács, I.; Horváth, I.W.; Hancsók, J.; Kristóf, T. Corrosion testing and evaluation of gas oil desulfurization reactor structure material in the presence of fatty acids. Eng. Fail. Anal. 2020, 107, 104221. [Google Scholar] [CrossRef]
- Feng, Q.; Yan, B.; Chen, P.; Shirazi, S.A. Failure analysis and simulation model of pinhole corrosion of the refined oil pipeline. Eng. Fail. Anal. 2019, 106, 104177. [Google Scholar] [CrossRef]
- Fadhil, A.A.; Khadom, A.A.; Fu, C.; Liu, H.; Mahood, H.B.; Mahmoudd, A.K.; . Khalafe, M.Z.; Karimb, A.M.A. Ceramics coating materials for corrosion control of crude oil distillation column: Experimental and theoretical studies. Corros. Sci. 2020, 162, 108220. [Google Scholar] [CrossRef]
- Smith, P.; Roy, S.; Swailes, D.; Maxwell, S.; Page, D.; Lawson, J. A model for the corrosion of steel subjected to synthetic produced water containing sulfate, chloride and hydrogen sulfide. Chem. Eng. Sci. 2011, 66, 5775–5790. [Google Scholar] [CrossRef]
- Hou, B.S.; Zhang, Q.H.; Lia, Y.Y.; Zhu, G.Y.; Liu, H.F.; Zhang, G.A. A pyrimidine derivative as a high efficiency inhibitor for the corrosion of carbon steel in oilfield produced water under supercritical CO2 conditions. Corros. Sci. 2020, 164, 108334. [Google Scholar] [CrossRef]
- Liu, H.; Gu, T.; Lv, Y.; Asif, M.; Xiong, F.; Zhang, G.; Liu, H. Corrosion inhibition and anti-bacterial efficacy of benzalkonium chloride in artificial CO2-saturated oilfield produced water. Corros. Sci. 2017, 117, 24–34. [Google Scholar] [CrossRef]
- Liu, H.; Gu, T.; Zhang, G.; Liu, H.; Cheng, Y.F. Corrosion of X80 pipeline steel under sulfate-reducing bacterium biofilms in simulated CO2-saturated oilfield produced water with carbon source starvation. Corros. Sci. 2018, 136, 47–59. [Google Scholar] [CrossRef]
- Liu, T.; Cheng, Y.F.; Sharma, M.; Voordouw, G. Effect of fluid flow on biofilm formation and microbiologically influenced corrosion of pipelines in oilfield produced water. J. Pet. Sci. Eng. 2017, 156, 451–459. [Google Scholar] [CrossRef]
- McMahon, P.B.; Kulongoski, J.T.; Vengosh, A.; Cozzarelli, I.M.; Landon, M.K.; Kharaka, Y.K.; Gillespie, J.M.; Davis, T.A. Regional patterns in the geochemistry of oil-field water, southern San Joaquin Valley, California, USA. Appl. Geochem. 2018, 98, 127–140. [Google Scholar] [CrossRef]
- Benamora, A.; Talkhana, A.G.; Nasser, M.; Hussein, I.; Okonkwo, P.C. Effect of temperature and fluid speed on the corrosion behavior of carbon steel pipeline in Qatari oilfield produced water. J. Electroanal. Chem. 2018, 808, 218–227. [Google Scholar] [CrossRef]
- Zhang, Q.H.; Hou, B.S.; Xu, N.; Xiong, W.; Liu, H.F.; Zhang, G.A. Effective inhibition on the corrosion of X65 carbon steel in the oilfield produced water by two Schiff bases. J. Mol. Liq. 2019, 285, 223–236. [Google Scholar] [CrossRef]
- Liu, Y.; Zhang, B.; Zhang, Y.; Ma, L.; Yang, P. Electrochemical polarization study on crude oil pipeline corrosion by the produced water with high salinity. Eng. Fail. Anal. 2016, 60, 307–315. [Google Scholar] [CrossRef]
- Liu, Y.; Zhang, Y.; Yuan, J. Influence of produced water with high salinity and corrosion inhibitors on the corrosion of water injection pipe in Tuha oil field. Eng. Fail. Anal. 2014, 45, 225–233. [Google Scholar] [CrossRef]
- Zhang, Q.H.; Hou, B.S.; Zhang, G.A. Inhibitive and adsorption behavior of thiadiazole derivatives on carbon steel corrosion in CO2-saturated oilfield produced water: Effect of substituent group on efficiency. J. Colloid. Interf. Sci. 2020, 572, 91–106. [Google Scholar] [CrossRef] [PubMed]
- Tavares, S.S.M.; Pardal, J.M.; Mainier, F.B.; da Igreja, H.R.; Barbosa, E.S.; Rodrigues, C.R.; Barbosa, C.; Pardal, J.P. Investigation of the failure in a pipe of produced water from an oil separator due to internal localized corrosion. Eng. Fail. Anal. 2016, 61, 100–107. [Google Scholar] [CrossRef]
- Velázquez, J.C.; Cruz-Ramirez, J.C.; Valor, A.; Venegas, V.; Caleyo, F.; Hallen, J.M. Modeling localized corrosion of pipeline steels in oilfield produced water environments. Eng. Fail. Anal. 2017, 79, 216–231. [Google Scholar] [CrossRef]
- Deyab, M.A.; Bali, B.E.; Essehli, R.; Ouarsal, R.; Lachkar, M.; Fuess, H. NaNi(H2PO3)3·H2O as a novel corrosion inhibitor for X70-steel in saline produced water. J Mol. Liq. 2016, 216, 636–640. [Google Scholar] [CrossRef]
- Nezhad, A.H.N.; Davoodi, A.; Zahrani, E.M.; Arefinia, R. The effects of an inorganic corrosion inhibitor on the electrochemical behavior of superhydrophobic micro-nano structured Ni films in 3.5% NaCl solution. Surf. Coat. Tech. 2020, 395, 125946. [Google Scholar] [CrossRef]
- Liao, K.; Zhou, F.; Song, X.; Wang, Y.; Zhao, S.; Liang, J.; Chen, L.; He, G. Synergistic effect of O2 and H2S on the corrosion behavior of N80 steel in a simulated high-pressure flue gas injection system. J. Mater. Eng. Perform. 2020, 29, 155–166. [Google Scholar] [CrossRef]
- Tang, Z.; Hong, S.; Xiao, W.; Taylor, J. Characteristics of iron corrosion scales established under blending of ground, surface, and saline waters and their impacts on iron release in the pipe distribution system. Corros. Sci. 2006, 48, 322–342. [Google Scholar] [CrossRef]
- Qin, M.; Liao, K.; He, G.; Huang, Y.; Wang, M.; Zhang, S. Main control factors and prediction model of flow-accelerated CO2/H2S synergistic corrosion for X65 steel. Process Saf. Environ. Prot. 2022, 160, 749–762. [Google Scholar] [CrossRef]
- Zhu, Y.; Xu, Y.; Wang, M.; Wang, X.; Liu, G.; Huang, Y. Understanding the influences of temperature and microstructure on localized corrosion of subsea pipeline weldment using an integrated multi-electrode array. Ocean Eng. 2019, 189, 106351. [Google Scholar] [CrossRef]
- Zhao, S.; Liao, K.; Zhou, F.; Leng, J.; Huang, Q.; He, G. Effect of Temperature on the corrosion behavior of L245NS steel in a CO2/H2S/O2 multi-component thermal fluid collection and transportation system. Arabian J. Sci. Eng. 2022, 47, 11223–11237. [Google Scholar] [CrossRef]
- Stoulil, J.; Kaňok, J.; Kouřil, M.; Parschová, H.; Novák, P. Influence of temperature on corrosion rate and porosity of corrosion products of carbon steel in anoxic bentonite environment. J. Nucl. Mater. 2013, 443, 20–25. [Google Scholar] [CrossRef]
- Azghandi, M.V.; Davoodi, A.; Farzi, G.A.; Kosari, A. Water-base acrylic terpolymer as a corrosion inhibitor for SAE1018 in simulated sour petroleum solution in stagnant and hydrodynamic conditions. Corros. Sci. 2012, 64, 44–54. [Google Scholar] [CrossRef]
- Ma, H.; Chen, S.; Yin, B.; Zhao, S.; Liu, X. Impedance spectroscopic study of corrosion inhibition of copper by surfactants in the acidic solutions. Corros. Sci. 2003, 45, 867–882. [Google Scholar] [CrossRef]
- Zhang, N.; Zeng, D.; Xiao, G.; Shang, J.; Liu, Y.; Long, D.; He, Q.; Singh, A. Effect of Cl− accumulation on corrosion behavior of steels in H2S/CO2 methyldiethanolamine (MDEA) gas sweetening aqueous solution. J. Nat. Gas Sci. Eng. 2016, 30, 444–454. [Google Scholar] [CrossRef]
- Qin, M.; Liao, K.; He, G.; Zou, Q.; Zhao, S.; Zhang, S. Corrosion mechanism of X65 steel exposed to H2S/CO2 brine and H2S/CO2 vapor corrosion environments. J. Nat. Gas Sci. Eng. 2022, 106, 104774. [Google Scholar] [CrossRef]
- Zhao, W.; Zou, Y.; Matsuda, K.; Zou, Z. Characterization of the effect of hydrogen sulfide on the corrosion of X80 pipeline steel in saline solution. Corros. Sci. 2016, 102, 455–468. [Google Scholar] [CrossRef]
- Deng, K.; Lin, Y.; Ning, H.; Liu, W.; Singh, A. Influences of temperature and pressure on CO2 solubility in saline solutions in simulated oil and gas well environments. Appl. Geochem. 2018, 99, 22–30. [Google Scholar] [CrossRef]
- Vatankhah, G.; Drogowska, M.; Menard, H.; Brossard, L. Electrodissolution of iron in sodium sulfate and sodium bicarbonate solutions at pH8. J. Appl. Electrochem. 1998, 28, 173–183. [Google Scholar] [CrossRef]
- Kytopoulos, V.N.; Altzoumailis, A.; Panagopoulos, C.; Riga, C. Investigation of certain mechanical and magnetic properties of a stressed low-carbon steel after corrosion in NaCl-water solution. Procedia Struct. Integr. 2020, 26, 113–119. [Google Scholar] [CrossRef]
- Wright, R.F.; Brand, E.R.; Ziomek-Moroz, M.; Tylczak, J.H.; Ohodnicki, P.R. Effect of HCO3− on electrochemical kinetics of carbon steel corrosion in CO2-saturated brines. Electrochim. Acta 2018, 290, 626–638. [Google Scholar] [CrossRef]
- Cheng, Q.; Tao, B.; Song, L.; Zhang, W.; Liu, X.; Li, W.; Hou, B.; Liu, Q. Corrosion behaviour of Q235B carbon steel in sediment water from crude oil. Corros. Sci. 2016, 111, 61–71. [Google Scholar] [CrossRef]
- Guo, W.; Xu, L.; Xu, B.; Yang, Y.; Sun, Z.; Liu, S. A modified composite film electrode of polyoxometalate/carbon nanotubes and its electrocatalytic reduction. J. Appl. Electrochem. 2009, 39, 647–652. [Google Scholar] [CrossRef]
- Dahmani, K.; Galai, M.; Elhasnaoui, A.; Temmar, B.; El Hessni, A.; Cherkaoui, M. Corrosion resistance of electrochemical copper coating realized in the presence of essential oils. Der PharmaChemica 2015, 7, 566–572. [Google Scholar]
- Dkhireche, N.; Galai, M.; El Kacimi, Y.; Rbaa, M.; Ouakki, M.; Lakhrissi, B.; Touhami, M.E. New quinoline derivatives as sulfuric acid inhibitor’s for mild steel. Anal. Bioanal. Electrochem. 2018, 10, 111–135. [Google Scholar]
- Ouakki, M.; Galai, M.; Benzekri, Z.; Aribou, Z.; Ech-Chihbi, E.; Guo, L.; Dahmani, K.; Nouneh, K.; Briche, S.; Boukhris, S.; et al. A detailed investigation on the corrosion inhibition effect of by newly synthesized pyran derivative on mild steel in 1.0 M HCl: Experimental, surface morphological (SEM-EDS, DRX& AFM) and computational analysis (DFT & MD simulation). J. Mol. Liq. 2021, 344, 117777. [Google Scholar]
- Ouass, A.; Galai, M.; Ouakki, M.; Ech-Chihbi, E.; Kadiri, L.; Hsissou, R.; Essaadaoui, Y.; Berisha, A.; Cherkaoui, M.; Lebkiri, A.; et al. Poly (sodium acrylate) and Poly (acrylic acid sodium) as an eco-friendly corrosion inhibitor of mild steel in normal hydrochloric acid: Experimental, spectroscopic and theoretical approach. J. Appl. Electrochem. 2021, 51, 1009–1032. [Google Scholar] [CrossRef]
- Singh, A.; Ansari, K.R.; Lin, Y.; Quraishi, M.A.; Lgaz, H.; Chung, I.M. Corrosion inhibition performance of imidazolidine derivatives for J55 pipeline steel in acidic oilfield formation water: Electrochemical, surface and theoretical studies. J. Taiwan Inst. Chem. Eng. 2019, 95, 341–356. [Google Scholar] [CrossRef]


| Well | pH | Ion Concentration (g/L) | Salinity (g/L) | Water Cut (%) | ||||||
|---|---|---|---|---|---|---|---|---|---|---|
| CO32− | HCO3− | Cl− | SO42− | Ca2+ | Mg2+ | Na+, K+ | ||||
| H132 | 8.53 | 0.166 | 0.795 | 16.221 | 0.004 | 0.071 | 0.169 | 9.463 | 26.545 | 98 |
| W214-5 | 7.71 | 0 | 0.200 | 16.486 | 0.011 | 0.504 | 0.178 | 8.322 | 25.764 | 81 |
| X124 | 8.50 | 0.136 | 0.134 | 15.891 | 0.043 | 0.101 | 0.169 | 9.313 | 27.029 | 85 |
| H128 | 6.30 | 0 | 0.157 | 32.107 | 0.600 | 10.130 | 0.165 | 6.534 | 50.385 | 82 |
| X275 | 7.01 | 0 | 0.194 | 17.501 | 0.220 | 0.714 | 0.208 | 8.869 | 27.642 | 93 |
| Steel | Elemental Content (%) | ||||||||||
|---|---|---|---|---|---|---|---|---|---|---|---|
| C | Si | Mn | P | S | Cr | Ni | Cu | Nb | Mo | Fe | |
| J55 | 0.23 | 0.18 | 0.17 | 0.005 | 0.001 | 0.015 | 0.009 | 0.008 | 0.027 | <0.02 | The rest |
| N80 | 0.32 | 0.28 | 1.85 | 0.015 | 0.009 | 0.049 | 0.180 | 0.048 | 0.043 | <0.02 | The rest |
| grade D | 0.25 | 0.32 | 1.50 | 0.008 | 0.024 | 1.030 | 0.150 | 0.018 | 0.034 | 0.18 | The rest |
| Corrosion Inhibitor | Main Component | Provider |
|---|---|---|
| UT2-2 | Macromolecular organic amine compounds | Chengdu Fuji Technology Co. Ltd. (Chengdu, China) |
| KLYS-A | Oleic imidazoline | Dongying Keling Chemical Co. Ltd. (Dongying, China) |
| KLDS-A | Bicyclic imidazoline | |
| CRS2-4 | Hydroxyimidazoline | Shayang Keruoxing Chemical Co. Ltd. (Shenyang, China) |
| CT-2 | Imidazoline quaternary ammonium salt | |
| ODD | Heptadecenylamine ethylimidazoline quaternary ammonium salt | Qinhuangdao Shengli Chemical Co. Ltd. (Qinhuangdao, China) |
| ODM | Heptadecenylamine ethylimidazoline | |
| KHS-1 | Imidazoline | Shengli Chemical Co. Ltd. (Binzhou City, China) |
| YC-2 | Imidazolinamide | |
| CT2-7 | Organic amines | Hubei Xingyinhe Chemical Co. Ltd. (Wuhan, China) |
| Name | Elements | C | O | K | Na | Si | S | Cl | Ca | Mn | Fe | Ni |
|---|---|---|---|---|---|---|---|---|---|---|---|---|
| H132 | wt% | 15.28 | 22.09 | — | 0.52 | 3.17 | 3.43 | 0.61 | 0.42 | 0.29 | 45.73 | 0.24 |
| at% | 29.36 | 38.82 | — | 0.63 | 2.36 | 2.14 | 0.43 | 0.33 | 0.12 | 21.07 | 0.11 | |
| W214-5 | wt% | 14.76 | 21.93 | — | 0.64 | 2.08 | 3.35 | 0.65 | 0.32 | 0.27 | 46.22 | 0.19 |
| at% | 28.47 | 38.69 | — | 0.78 | 1.64 | 2.31 | 0.47 | 0.25 | 0.13 | 21.63 | 0.08 | |
| X124 | wt% | 17.24 | 26.78 | 0.44 | 0.74 | 0.42 | 3.47 | 0.68 | 0.48 | 0.24 | 48.13 | 0.22 |
| at% | 30.33 | 39.21 | 0.53 | 0.83 | 0.57 | 2.26 | 0.57 | 0.45 | 0.11 | 23.16 | 0.10 | |
| H128 | wt% | 12.43 | 23.63 | 0.45 | 0.76 | 0.41 | 1.64 | 0.63 | 0.52 | 0.23 | 43.84 | — |
| at% | 27.76 | 39.02 | 0.56 | 0.85 | 0.59 | 1.37 | 0.58 | 0.48 | 0.11 | 20.73 | — |
| T/°C | RS/Ω·cm2 | Rct/Ω·cm2 | CPEdl/μF·cm−2 | Zw/Ω·cm2 | |
|---|---|---|---|---|---|
| Y/Sn·cm−2·Ω−1 | n | ||||
| 30 | 7.71 ± 0.11 | 232.00 ± 0.14 | 2.59 × 10⁻⁴ | 0.80 ± 0.06 | — |
| 45 | 6.97 ± 0.14 | 159.40 ± 0.21 | 4.12 × 10⁻⁴ | 0.86 ± 0.03 | — |
| 60 | 5.07 ± 0.05 | 87.94 ± 0.16 | 7.63 × 10⁻⁴ | 0.81 ± 0.05 | 24.05 ± 0.21 |
| 75 | 5.03 ± 0.09 | 52.02 ± 0.51 | 8.41 × 10⁻⁴ | 0.79 ± 0.01 | 15.99 ± 0.23 |
| 80 | 4.67 ± 0.24 | 44.13 ± 0.24 | 1.03 × 10⁻³ | 0.79 ± 0.09 | 29.04 ± 0.14 |
| 90 | 4.35 ± 0.13 | 104.8 ± 0.36 | 5.59 × 10⁻⁴ | 0.82 ± 0.05 | 24.23 ± 0.51 |
| Inhibitor | Surface Area (mm2) | Mass Loss ∆G (g) | Corrosion Rate (mm/a) | Average Corrosion Rate (mm/a) | Corrosion Inhibition Efficiency (%) |
|---|---|---|---|---|---|
| Blank | 1362.87 | 0.0198 | 0.2252 | 0.2258 ± 0.0045 | 0 |
| 1362.77 | 0.0199 | 0.2263 | |||
| KLYS-A | 1361.28 | 0.0102 | 0.1161 | 0.1225 ± 0.0045 | 46 |
| 1360.18 | 0.0113 | 0.1288 | |||
| UT2-2 | 1360.52 | 0.0062 | 0.0706 | 0.0734 ± 0.0020 | 67 |
| 1362.43 | 0.0067 | 0.0762 | |||
| KLDS-A | 1362.65 | 0.0115 | 0.1308 | 0.1292 ± 0.0011 | 43 |
| 1360.56 | 0.0112 | 0.1276 | |||
| CRS2-4 | 1360.28 | 0.0095 | 0.1082 | 0.1099 ± 0.0012 | 51 |
| 1361.84 | 0.0098 | 0.1115 | |||
| CT-2 | 1361.53 | 0.0070 | 0.0797 | 0.0814 ± 0.0012 | 64 |
| 1362.42 | 0.0073 | 0.0830 | |||
| ODD | 1361.53 | 0.0132 | 0.1503 | 0.1480 ± 0.0016 | 34 |
| 1361.98 | 0.0128 | 0.1457 | |||
| ODM | 1360.63 | 0.0121 | 0.1378 | 0.1367 ± 0.0008 | 39 |
| 1360.83 | 0.0119 | 0.1355 | |||
| KHS-1 | 1361.63 | 0.0069 | 0.1013 | 0.0991 ± 0.0016 | 56 |
| 1361.55 | 0.0065 | 0.0968 | |||
| YC-2 | 1360.63 | 0.0087 | 0.0791 | 0.0834 ± 0.0023 | 63 |
| 1361.87 | 0.0084 | 0.0856 | |||
| CT2-7 | 1360.30 | 0.0115 | 0.1310 | 0.1343 ± 0.0023 | 41 |
| 1362.63 | 0.0121 | 0.1376 |
| Parameter | Blank | CT-2:UT2-2 | CT-2:YC-2 | ||||
|---|---|---|---|---|---|---|---|
| 2:1 | 1:1 | 1:2 | 2:1 | 1:1 | 1:2 | ||
| Ecorr (mV) | −752 | −648 | −688 | −594 | −645 | −664 | −671 |
| ΔEcorr (mV) | / | 105 | 64 | 158 | 107 | 88 | 81 |
| CT-2:UT2-2 | Rs (Ω) | CPEf-T | CPEf-P | Rf (Ω·cm−2) | CPEdl-T | CPEdl-P | Rct (Ω·cm−2) | η (%) |
|---|---|---|---|---|---|---|---|---|
| 1:2 | 1.769 | 3.07 × 10⁻⁶ | 0.898 | 6.119 | 2.24 × 10⁻³ | 0.5062 | 379.6 | 20.0 |
| 1:1 | 2.211 | 1.27 × 10⁻⁵ | 0.792 | 6.779 | 1.10 × 10⁻³ | 0.5259 | 423.6 | 28.2 |
| 2:1 | 2.012 | 6.62 × 10⁻⁵ | 0.761 | 16.320 | 1.60 × 10⁻³ | 0.5896 | 493.5 | 38.4 |
| CT-2:YC-2 | Rs (Ω) | CPEf-T | CPEf-P | Rf (Ω·cm−2) | CPEdl-T | CPEdl-P | Rct (Ω·cm−2) | η (%) |
|---|---|---|---|---|---|---|---|---|
| 1:2 | 2.031 | 4.8 × 10⁻⁴ | 0.5970 | 100.7 | 3.3 × 10⁻³ | 0.5200 | 511.0 | 40.5 |
| 1:1 | 2.197 | 5.7 × 10⁻⁴ | 0.6482 | 227.3 | 4.4 × 10⁻³ | 0.6340 | 755.4 | 59.8 |
| 2:1 | 1.798 | 1.1 × 10⁻³ | 0.5000 | 191.2 | 6.3 × 10⁻³ | 0.5133 | 489.0 | 37.8 |
| Concentration (g/L) | Corrosion Rate (mm/a) | Inhibition Efficiency (%) | ||||
|---|---|---|---|---|---|---|
| J55 | N80 | Grade D | J55 | N80 | Grade D | |
| 0 | 0.1494 | 0.1833 | 0.2284 | 0 | 0 | 0 |
| 0.04 | 0.0952 | 0.1220 | 0.1402 | 36.3 | 33.4 | 38.6 |
| 0.06 | 0.0840 | 0.0954 | 0.1023 | 43.8 | 48.0 | 55.2 |
| 0.08 | 0.0641 | 0.0786 | 0.0848 | 57.1 | 57.1 | 62.9 |
| 0.1 | 0.0459 | 0.0566 | 0.0597 | 69.3 | 69.1 | 73.9 |
| 0.12 | 0.0339 | 0.0373 | 0.0426 | 77.3 | 79.7 | 81.3 |
| 0.14 | 0.0303 | 0.0357 | 0.0379 | 79.7 | 80.5 | 83.4 |
| 0.16 | 0.0293 | 0.0284 | 0.0309 | 80.4 | 84.5 | 86.5 |
| 0.18 | 0.0236 | 0.0207 | 0.0260 | 84.2 | 88.7 | 88.6 |
Disclaimer/Publisher’s Note: The statements, opinions and data contained in all publications are solely those of the individual author(s) and contributor(s) and not of MDPI and/or the editor(s). MDPI and/or the editor(s) disclaim responsibility for any injury to people or property resulting from any ideas, methods, instructions or products referred to in the content. |
© 2023 by the authors. Licensee MDPI, Basel, Switzerland. This article is an open access article distributed under the terms and conditions of the Creative Commons Attribution (CC BY) license (https://creativecommons.org/licenses/by/4.0/).
Share and Cite
Li, W.; Jing, J.; Sun, J.; Wang, S.; Zhang, F.; Wang, H. Investigation of the Corrosion Characteristics and Corrosion Inhibitor Action on J55 Steel in Produced Water. Sustainability 2023, 15, 3355. https://doi.org/10.3390/su15043355
Li W, Jing J, Sun J, Wang S, Zhang F, Wang H. Investigation of the Corrosion Characteristics and Corrosion Inhibitor Action on J55 Steel in Produced Water. Sustainability. 2023; 15(4):3355. https://doi.org/10.3390/su15043355
Chicago/Turabian StyleLi, Wangdong, Jiaqiang Jing, Jie Sun, Shuai Wang, Feng Zhang, and Hai Wang. 2023. "Investigation of the Corrosion Characteristics and Corrosion Inhibitor Action on J55 Steel in Produced Water" Sustainability 15, no. 4: 3355. https://doi.org/10.3390/su15043355
APA StyleLi, W., Jing, J., Sun, J., Wang, S., Zhang, F., & Wang, H. (2023). Investigation of the Corrosion Characteristics and Corrosion Inhibitor Action on J55 Steel in Produced Water. Sustainability, 15(4), 3355. https://doi.org/10.3390/su15043355