Abstract
The study of high-precision building change detection is essential for the sustainable development of land resources. However, remote sensing imaging illumination variation and alignment errors have a large impact on the accuracy of building change detection. A novel lightweight Siamese neural network building change detection model is proposed for the error detection problem caused by non-real changes in high-resolution remote sensing images. The lightweight feature extraction module in the model acquires local contextual information at different scales, allowing it to fully learn local and global features. The hybrid attention module consisting of the channel and spatial attention can make full use of the rich spatiotemporal semantic information around the building to achieve accurate extraction of changing buildings. For the problems of large span of changing building scales, which easily lead to rough extraction of building edge details and missed detection of small-scale buildings, the multi-scale concept is introduced to divide the extracted feature maps into multiple sub-regions and introduce the hybrid attention module separately, and finally, the output features of different scales are weighted and fused to enhance the edge detail extraction capability. The model was experimented on the WHU-CD and LEVIR-CD public data sets and achieved F1 scores of 87.8% and 88.1%, respectively, which have higher change detection accuracy than the six comparison models, and only cost 9.15 G MACs and 3.20 M parameters. The results show that our model can achieve higher accuracy while significantly reducing the number of model parameters.
1. Introduction
With the rapid development of remote sensing imaging technology, the earth observation remote sensing data provided by aviation, satellite, and other sensors are increasing, which make it no longer difficult to obtain multi-temporal remote sensing data in the same area. Remote sensing image change detection (CD) is the process of detecting and extracting the changes between the two images captured in the same area but at different time [1,2]. In recent years, remote sensing change detection technology has been widely used in many fields [3,4,5], such as urban planning and management [6,7], land-use change [8], natural resource survey [9,10], rapid assessment of disaster events [11,12], and other fields. As the main place of human activities and the representative of artificial geographic targets, the change detection of buildings has always been a research hotspot in photogrammetry, remote sensing, and artificial intelligence, and certain research results have been achieved. Due to its powerful data extraction and learning capabilities, deep learning (DL) has shown an increasingly rapid development trend in recent years. Remote sensing data are characterized by huge data volume and complex spectral information. Therefore, remote sensing technology combined with deep learning will be the mainstream development trend of remote sensing now and in the future.
The integration of computer vision and deep learning has promoted its wide application in remote sensing, and intelligent recognition models based on image spectral information and spatial features are increasingly applied to target detection and semantic segmentation tasks of remote sensing images [13,14]. Remote sensing change detection belongs to a branch of semantic segmentation, but it is quite different from traditional semantic segmentation. The traditional semantic segmentation task is a full element extraction of the target features, while change detection is a partial, non-full element extraction of the target features that have changed. Therefore, the change detection task is more complicated than the traditional semantic segmentation task because it needs to identify the target features first and then judge the changed targets based on multi-temporal images. This process attempts to distinguish between change and non-change pixels in bi-temporal remote sensing images [15,16,17].
Early remote sensing images are mostly low and medium resolution, which can only provide macro and coarse baseline data for Earth observation. Many traditional methods of change detection have been proposed on that basis. The difference image (DI) [18] is used to subtract the corresponding pixel values of two images to weaken the similar part of the image and highlight the changed part of the image. This method is easy and effective to operate, but accuracy in complex scenes is lower. Change vector analysis (CVA) [19,20] uses the vector magnitude of the dual-time phase image to show the degree of change, and determines whether the change has occurred by setting a threshold value. This method has some progress compared to difference image, by introducing change intensity and change direction to calculate the probability of change, but the threshold value needs to be set manually with certain relevant experience, which has limitations. The subsequent development of principal component analysis (PCA) [21] and Kmeans [21] can obtain effective results in simple scenes, but they do not perform well in complex remote sensing scenes. In addition, the above methods partly rely on manually constructed feature representation, which has limited ability to model complex deep-level change information and has certain limitations.
Recently, there has been a massive development in Earth observation technology. More and more new remote sensing sensors have been designed and used to acquire high-resolution images [22]. Compared with low and medium-resolution images, high-resolution images have richer features. Compared with traditional methods, deep learning can better handle massive amounts of information in high-resolution images. Zhang et al. [23] proposed a deep learning change detection method using the isolated forest algorithm to optimize the change detection results. The improved change vector analysis algorithm and gray level co-occurrence matrix algorithm are used to obtain the image spectrum and texture difference features, and then a deep confidence network model is used for training, which finally achieved better results. Duan et al. [24] proposed a deep learning image change detection framework based on FFDNet, which improved the denoising process of SAR image change detection and achieved a good compromise between inference speed and denoising performance. Chen et al. [22] proposed a general deep Siamese Convolutional Multi-layer Recurrent Neural Network (SiamCRNN), which combines the features of convolutional neural networks (CNN) and RNN for change detection of both homogeneous and heterogeneous VHR images, increasing the flexibility of model applications. Zhu et al. [25] proposed a Siamese Global Learning (Siam GL) framework, which utilizes a Siamese architecture with shared parameters to extract bi-temporal remote sensing image features, the global hierarchical (G-H) sampling mechanism to address the imbalanced training sample problem with insufficient samples.
At present, change detection methods based on deep learning often focus on extracting deep semantic features while ignoring the rich spatiotemporal information between pixels, resulting in changes in imaging illumination and registration errors that can easily affect the model’s accuracy. In addition, with the development of deep learning, more complex model structures hinder its application in large-scale remote sensing image processing. Based on the above analysis, we adopt a lightweight feature extraction module to obtain the feature information of the input image pair. We then use the hybrid attention to capture the rich spatiotemporal information to obtain the features of illumination invariant and registration error. At the same time, considering that the changing objects have different scales, to extract the features of each level better, a multi-scale hybrid attention module is proposed to obtain edge detail features of different scales and enhance the accuracy and robustness of the model. The main contributions of the study are as follows:
- (1)
- A novel lightweight Siamese convolutional network is proposed. It consists of a lightweight backbone network constructed using parallel dilated convolutions and contextual semantic-guided module. The Parallel dilated convolution is calculated in a depth-separable manner, i.e., RGB channels are grouped, and convolution operations are performed in each independent group, which greatly reduces the number of model parameters and improves model efficiency compared with standard convolution. Compared with traditional lightweight models that only use depth-separable convolution operations, we combine dilated convolution and depth-separable manner to further reduce the number of model parameters. In addition, the context semantic guidance module effectively aggregates the global features of input remote sensing images and enhances feature extraction capabilities.
- (2)
- To fully use the contextual feature information of the input image pair, we introduce a hybrid attention mechanism based on the backbone network, which enhances the model’s ability to recognize edge details of changing buildings. In addition, due to the large scale span of change buildings, a hybrid attention module that fuses channel attention and spatial attention cannot effectively deal with this challenge. Therefore, we construct a multi-scale hybrid attention module to generate multi-scale attention feature tensors by aggregating spatiotemporal information at different scales, and to improve the model’s ability to recognize fine details and small-scale buildings. In addition to theoretical analysis, the proposed method was tested on the change detection standard datasets (WHU-CD [26], LEVIR-CD [27]) and compared with other change detection models to demonstrate its feasibility and superiority.
2. Related Work
With the development of change detection technology, it can be roughly divided into traditional methods, deep learning methods, and a combination of various algorithms [28]. Compared to conventional methods, deep learning can effectively process complex and massive remote sensing data. It has a more robust feature extraction capability and higher model accuracy. As an essential part of deep learning, convolutional neural networks (CNN) are increasingly widely used in remote sensing image processing [29]. Long et al. [30] proposed an end-to-end fully convolutional neural network structure based on CNN. The structure can accept inputs of any size and produce correspondingly-sized output with efficient inference and learning. Daudt et al. [31] proposed three network structures, FC-EF, FC-Siam-conc, and FC-Siam-diff, based on the fully convolutional network. The user selects the corresponding model according to the category of the input image to make it better to handle the change detection task. Inspired by the FCN (fully convolutional neural network) structure, Ji et al. [26] proposed a SiU-Net for building extraction, where images of different sizes are fed into the model to identify buildings at different scales better. Although these methods above can effectively handle the change detection task, there are still some disadvantages. For example, the edge detection of changing buildings is rough, and obtaining a clear and well-detected building edge change map is difficult. In addition, ground objects with similar spectral and morphological characteristics to buildings may be falsely reported as buildings, and will affect the model detection accuracy.
With the development of deep learning, more and more methods have been proposed, such as adversarial learning, self-attentive learning, weakly supervised learning, and various attention mechanisms. Liu et al. [32] proposed a CNN transformer network with multiscale context aggregation (MSCANet) to address the problem that traditional CNN-based models suffer from the loss of remote contextual information and high computational complexity brought by deep layers. The attention mechanism is widely used in deep learning as an effective tool to improve network accuracy. Liu et al. [33] proposed to build a new residual ASPP by embedding the attention module and the residual structure into the ASPP, which both obtained important semantic information and reduced the complexity of the network. Bhujel et al. [34] designed a lightweight convolutional neural network by combining different attention modules and finally showed that the convolutional block attention module (CBAM) is the best, followed by the self-attention (SA) mechanism. Liu et al. [35] proposed an automatic unsupervised change detection method based on multi-time full PolSAR images, which combines the advantages of test statistics, generalized statistical region merging (GSRM), and generalized Gaussian mixture model (GMM) techniques to solve the problems of incomplete use of polarization information and susceptibility to noise interference. Yan et al. [36] proposed a new method of unsupervised change detection based on the hybrid spectral difference that fuses the change detection of spectral shape (CDSS) and change detection of spectral value (CDSV) to generate different images. Zhang et al. [37] proposed a deep multiscale multi-concentration Siamese transformer network that combines self-attentive modules and convolution and introduces them into twin transformer networks, enhancing the ability of encoders and feature extractors to extract features. Chen et al. [38] proposed an unsupervised CD method that uses self-supervised learning to pre-train the neural network; in this method, contrast loss and regression loss are used to compute different and similar images.
In recent years, the Siamese neural network has been recognized as an effective structure for handling bi-temporal remote sensing tasks and is widely used in the field of change detection. Fang et al. [39] proposed a densely connected Siamese network(SNUNet). The network adopts a densely connected pyramid feature fusion method, which alleviated the problem of the loss of localization information in the deep layers of the neural network. Nevertheless, at the same time, dense connections cause unreasonable feature flow and redundant connections. Hafner et al. [40] proposed a semi-supervised learning method based on the Siamese network structure, which employed a two-task Siamese difference network for urban change detection. Peng et al. [41] proposed an end-to-end change detection method based on an encoder–decoder architecture. The model structure is similar to SNUNet-CD; both belong to densely connected networks. Chen et al. [42] applied the transformer technique to the field of computer vision and proposed a bi-temporal image transformer. This module can learn rich contextual semantic information to enhance the model’s effectiveness. Zheng et al. [43] proposed a high-frequency attention-guided Siamese network (HFA-Net), which mainly acquires high-frequency information about building changes to optimize building edge detection. Most of the above methods improved model accuracy by stacking more complex modules, which leads to low model efficiency and reduces model practicability.
3. Materials and Methods
In this section, we introduce the proposed change detection network in detail. First, the overall architecture of the proposed model is illustrated. Then, we detail our designed lightweight feature extraction module and multi-scale hybrid attention module. Finally, the proposed network’s metric module and loss function is introduced.
3.1. Overview
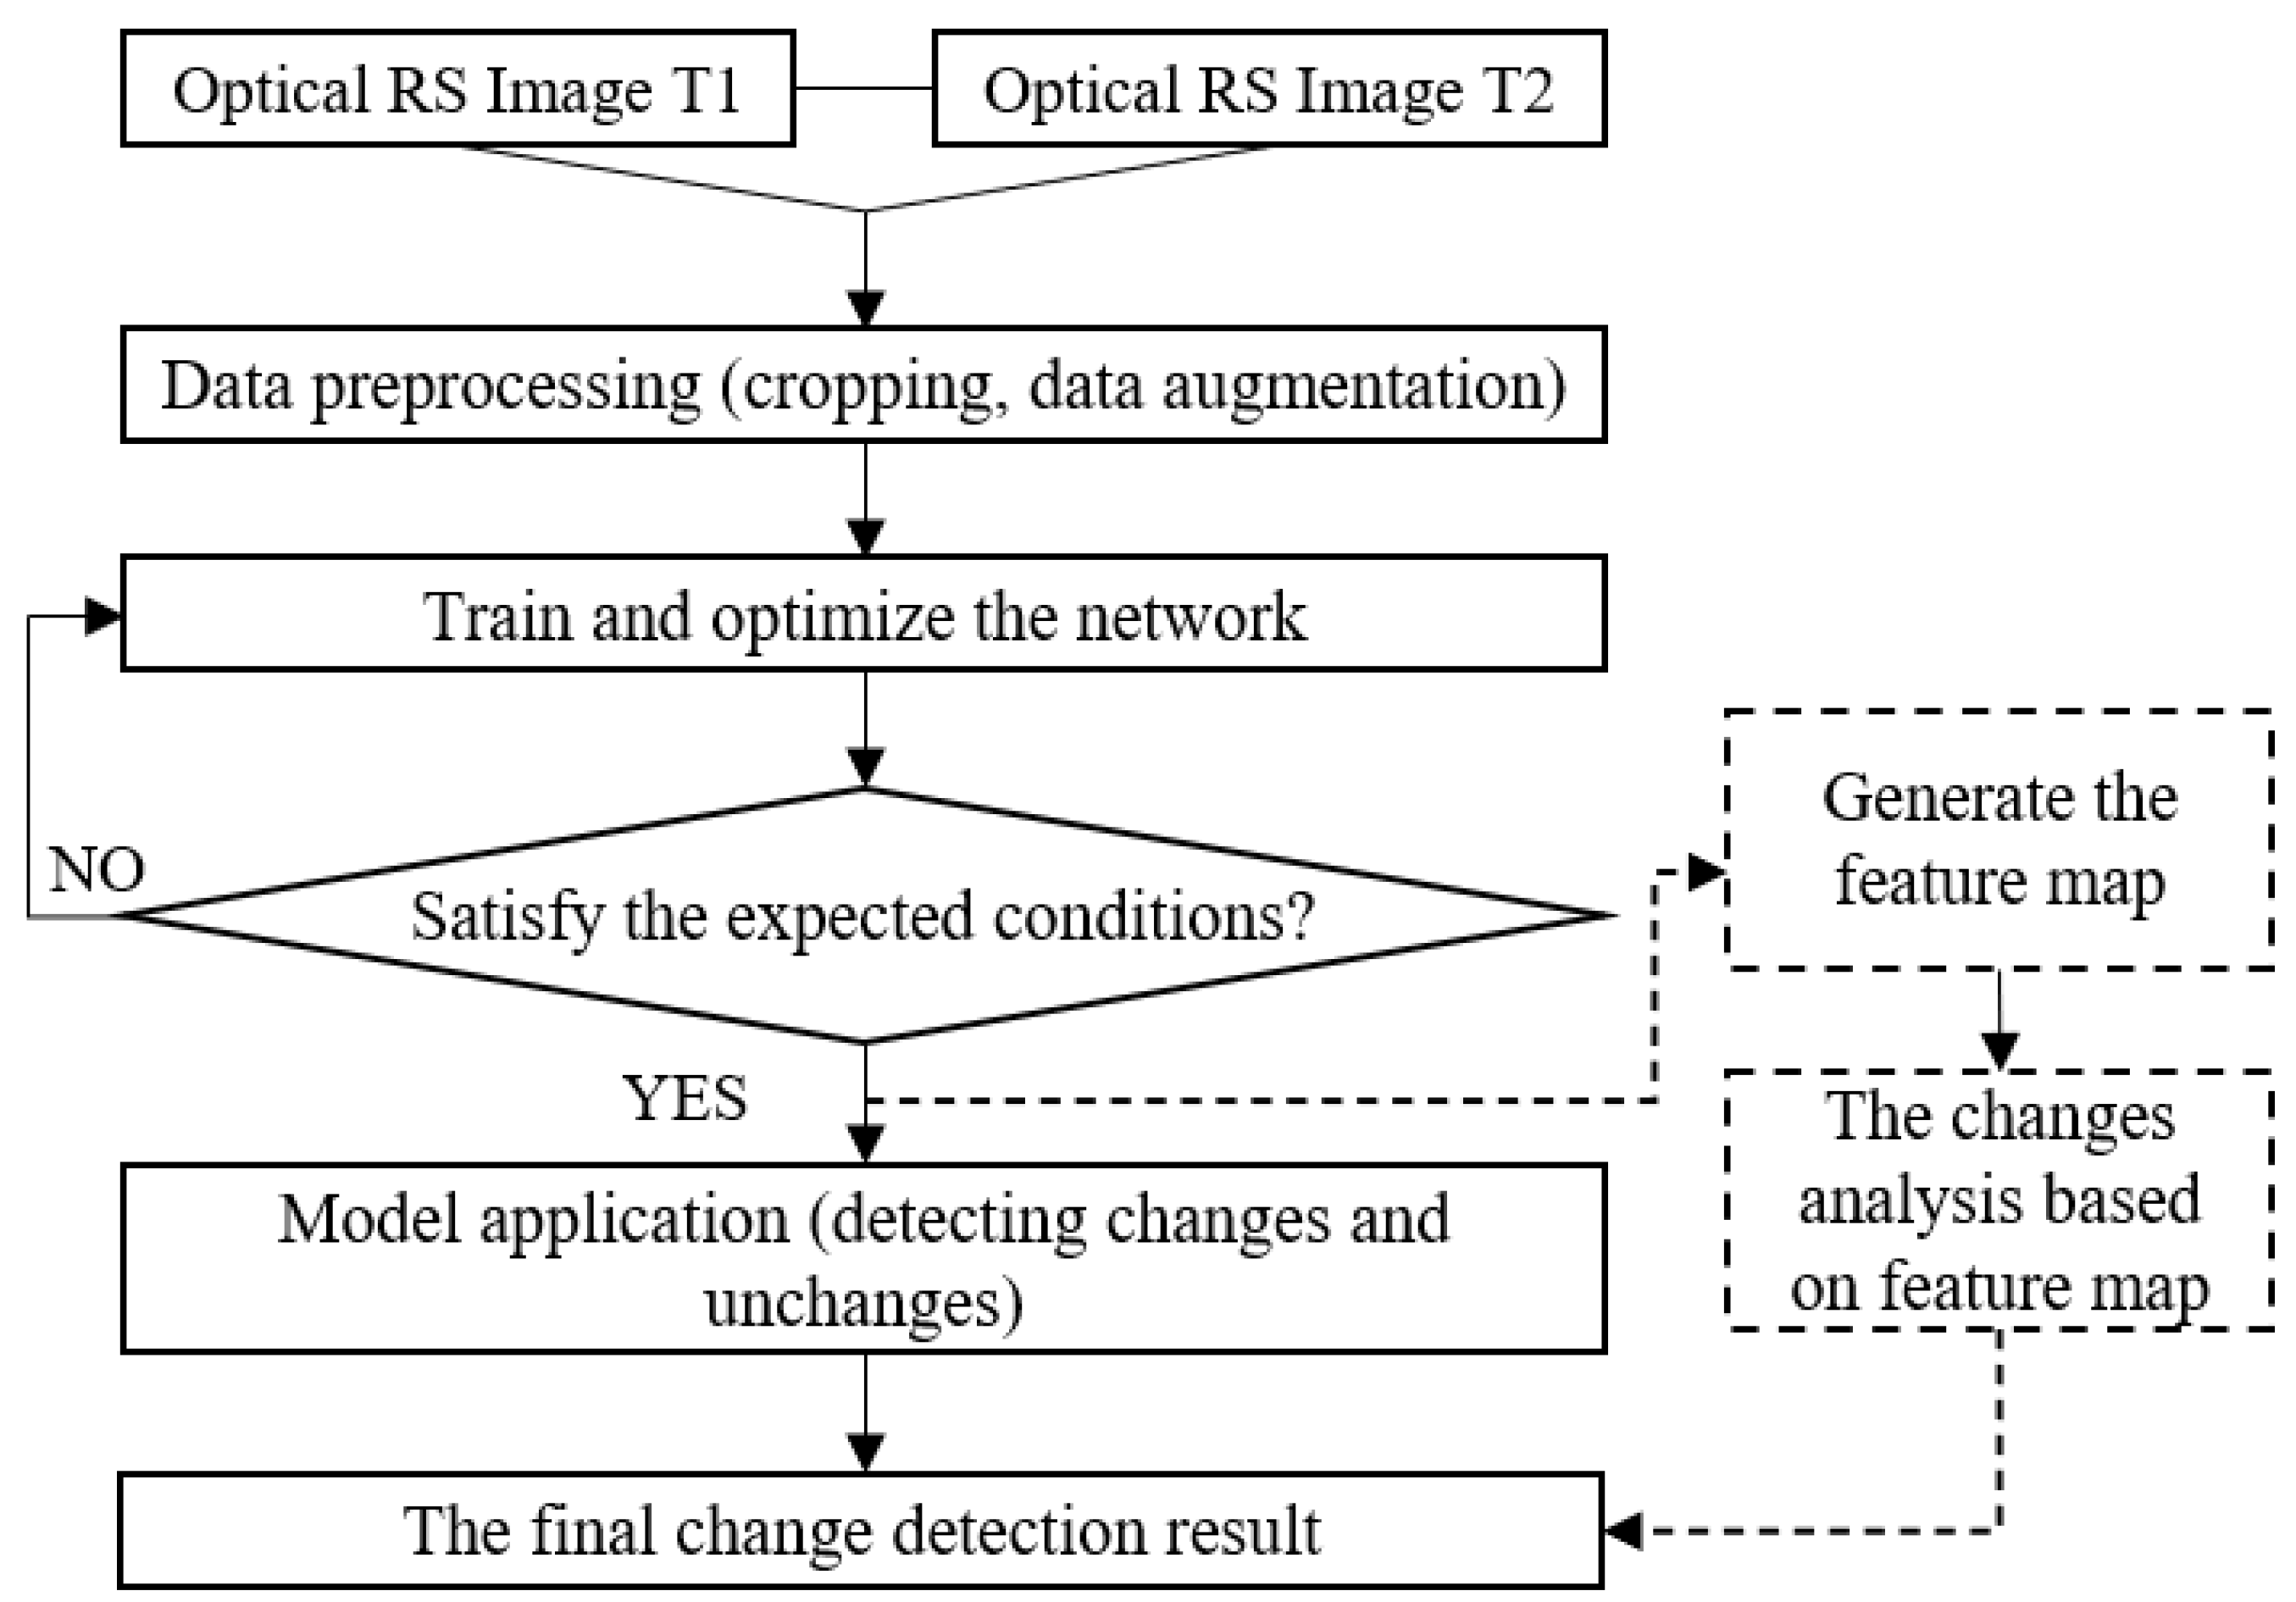
The complete building change detection process can be divided into three steps, as shown in Figure 1: (1) Data preprocessing, the acquired raw data needs to be segmented first to meet the limitations of computer hardware. At the same time, data enhancement (flip, rotation, Gaussian fuzzy) needs to be performed to meet the data required for model training; (2) Training and optimizing the network model, optimizing the network model by gradient update and back propagation algorithms; (3) Model testing and generalization experiments are performed on the trained model to verify its effectiveness.
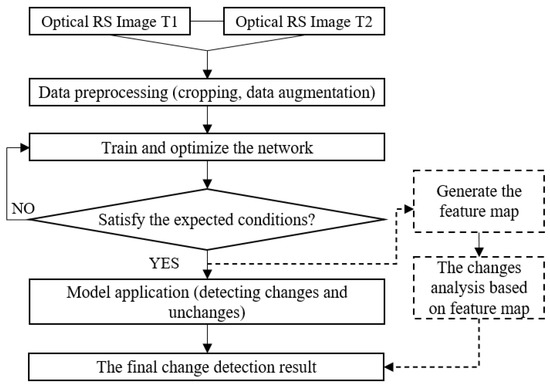
Figure 1.
The workflow of the building change detection algorithm.
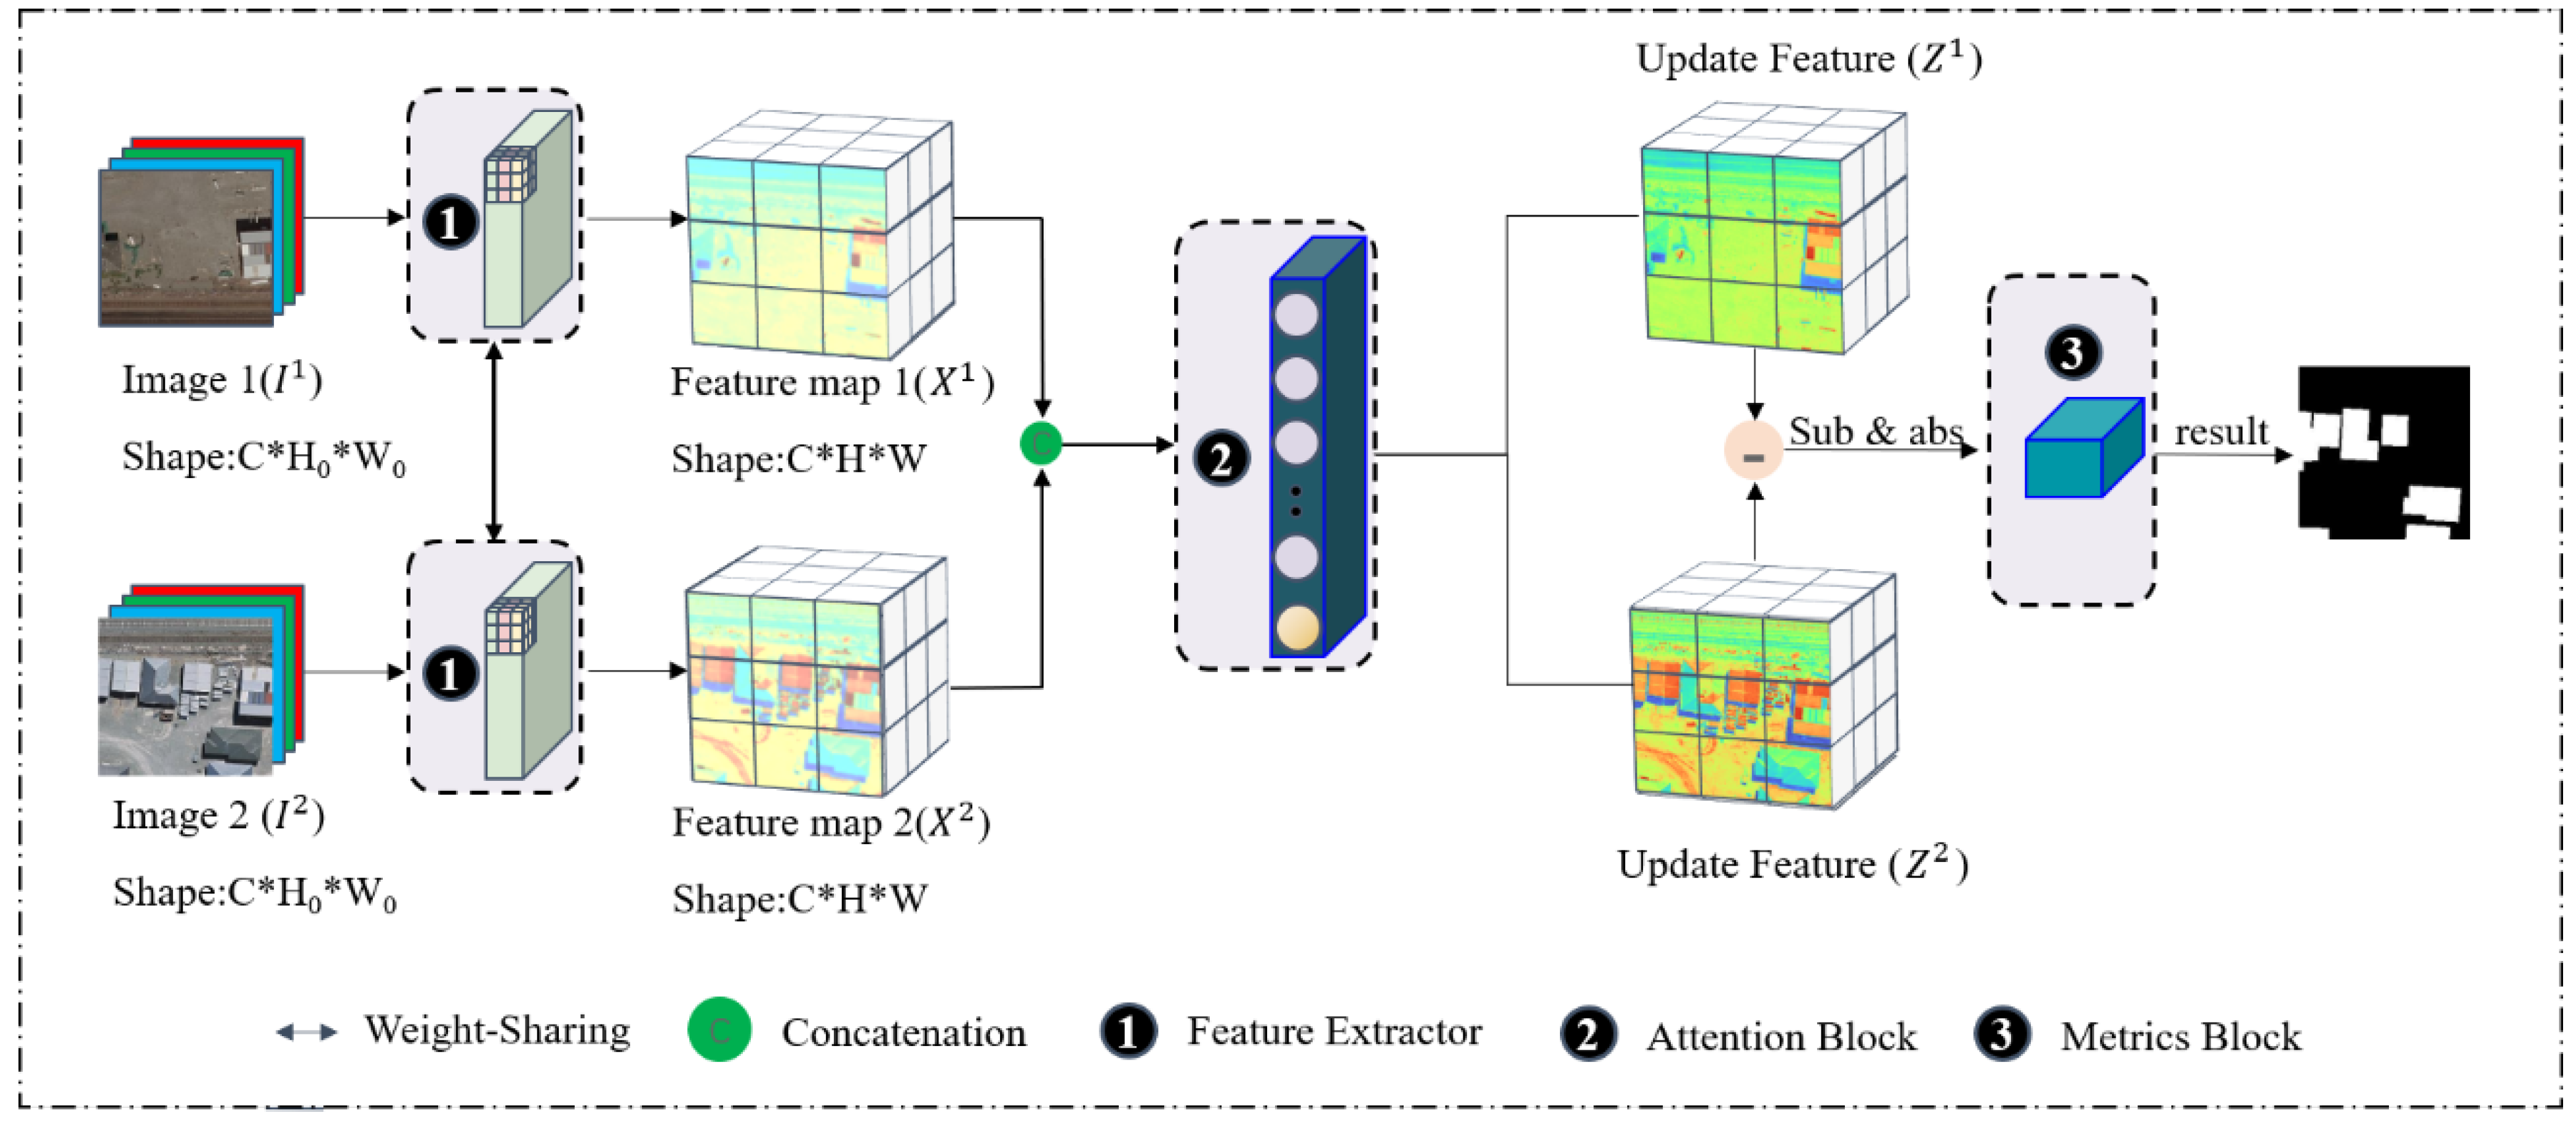
We design a method for building change detection. Figure 2 and Algorithm 1 show an overview of the proposed method. The model includes three parts, feature extraction module, hybrid attention module, and metric module. The feature extraction module acquires feature maps and from the input high-resolution remote sensing image pair. Feature maps and , where C is the number of channels of each feature map, and H and W are the height and width of the feature map. Then, the acquired feature map is fused into X and sent to the hybrid attention module; this module calculates the attention matrix A, and the updated feature map Z is finally obtained. The updated feature map Z is calculated by the metric module to obtain the Euclidean distance map and compared with the threshold to obtain the binary map.
| Algorithm 1: The process of building change detection method. |
input: Bitemporal RS images and . output: CDM:The final binary result L. // 1: read VHR images; 2: compute the feature matrix , // 3: compute the value of attention matrix A: 4: compute the value of matrix 5: Updata feature matrix Z: // 6: compute distance map 7: compute global threshold value according to attention matrix A;
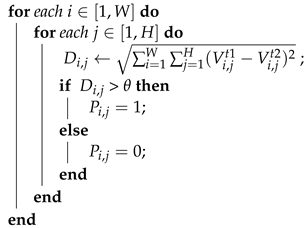 |
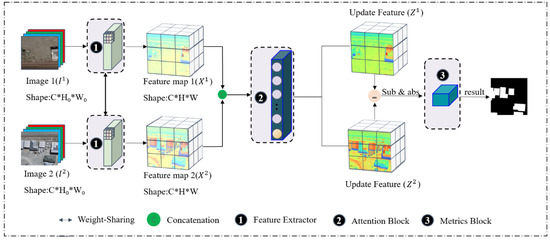
Figure 2.
Illustration of the proposed building change detection architecture.
3.2. Lightweight Siamese Feature Extraction Backbone
Change detection in remote sensing images is a binary classification (changed, unchanged) task based on pixel-level prediction. In the feature extraction structure (see Figure 3), the context semantic guidance block (CGB) uses parallel dilated convolutions to replace standard convolutions. It uses a depthwise separable manner for computation, which significantly reduces the number of model parameters and improves model efficiency. At the same time, the context semantic guidance block can obtain local context semantic information in different scopes. Since the high-level features in the network contain rich semantic information, but the location information is relatively rough, the low-level features have rich location and fine-grained information but lack semantic information. Therefore, the paper fuses deep semantic information and shallow spatial information to generate more refined feature representations. The lightweight Siamese feature extraction network consists of four composite layers; each contains [3, 3, 8, 12] CGBs, respectively. First, local and global semantic information extraction is performed on the input data X. Then, the fused features are fed into a structure consisting of an average pooling layer, a nonlinear layer, and a sigmoid layer for channel interaction and global information extraction. It can be expressed as Equation (1):
where H and W represent the height and width of the input feature map, denotes the pixels of the image, and c represents the number of feature channels.
Figure 3.
Description of the Siamese feature extractor structure.
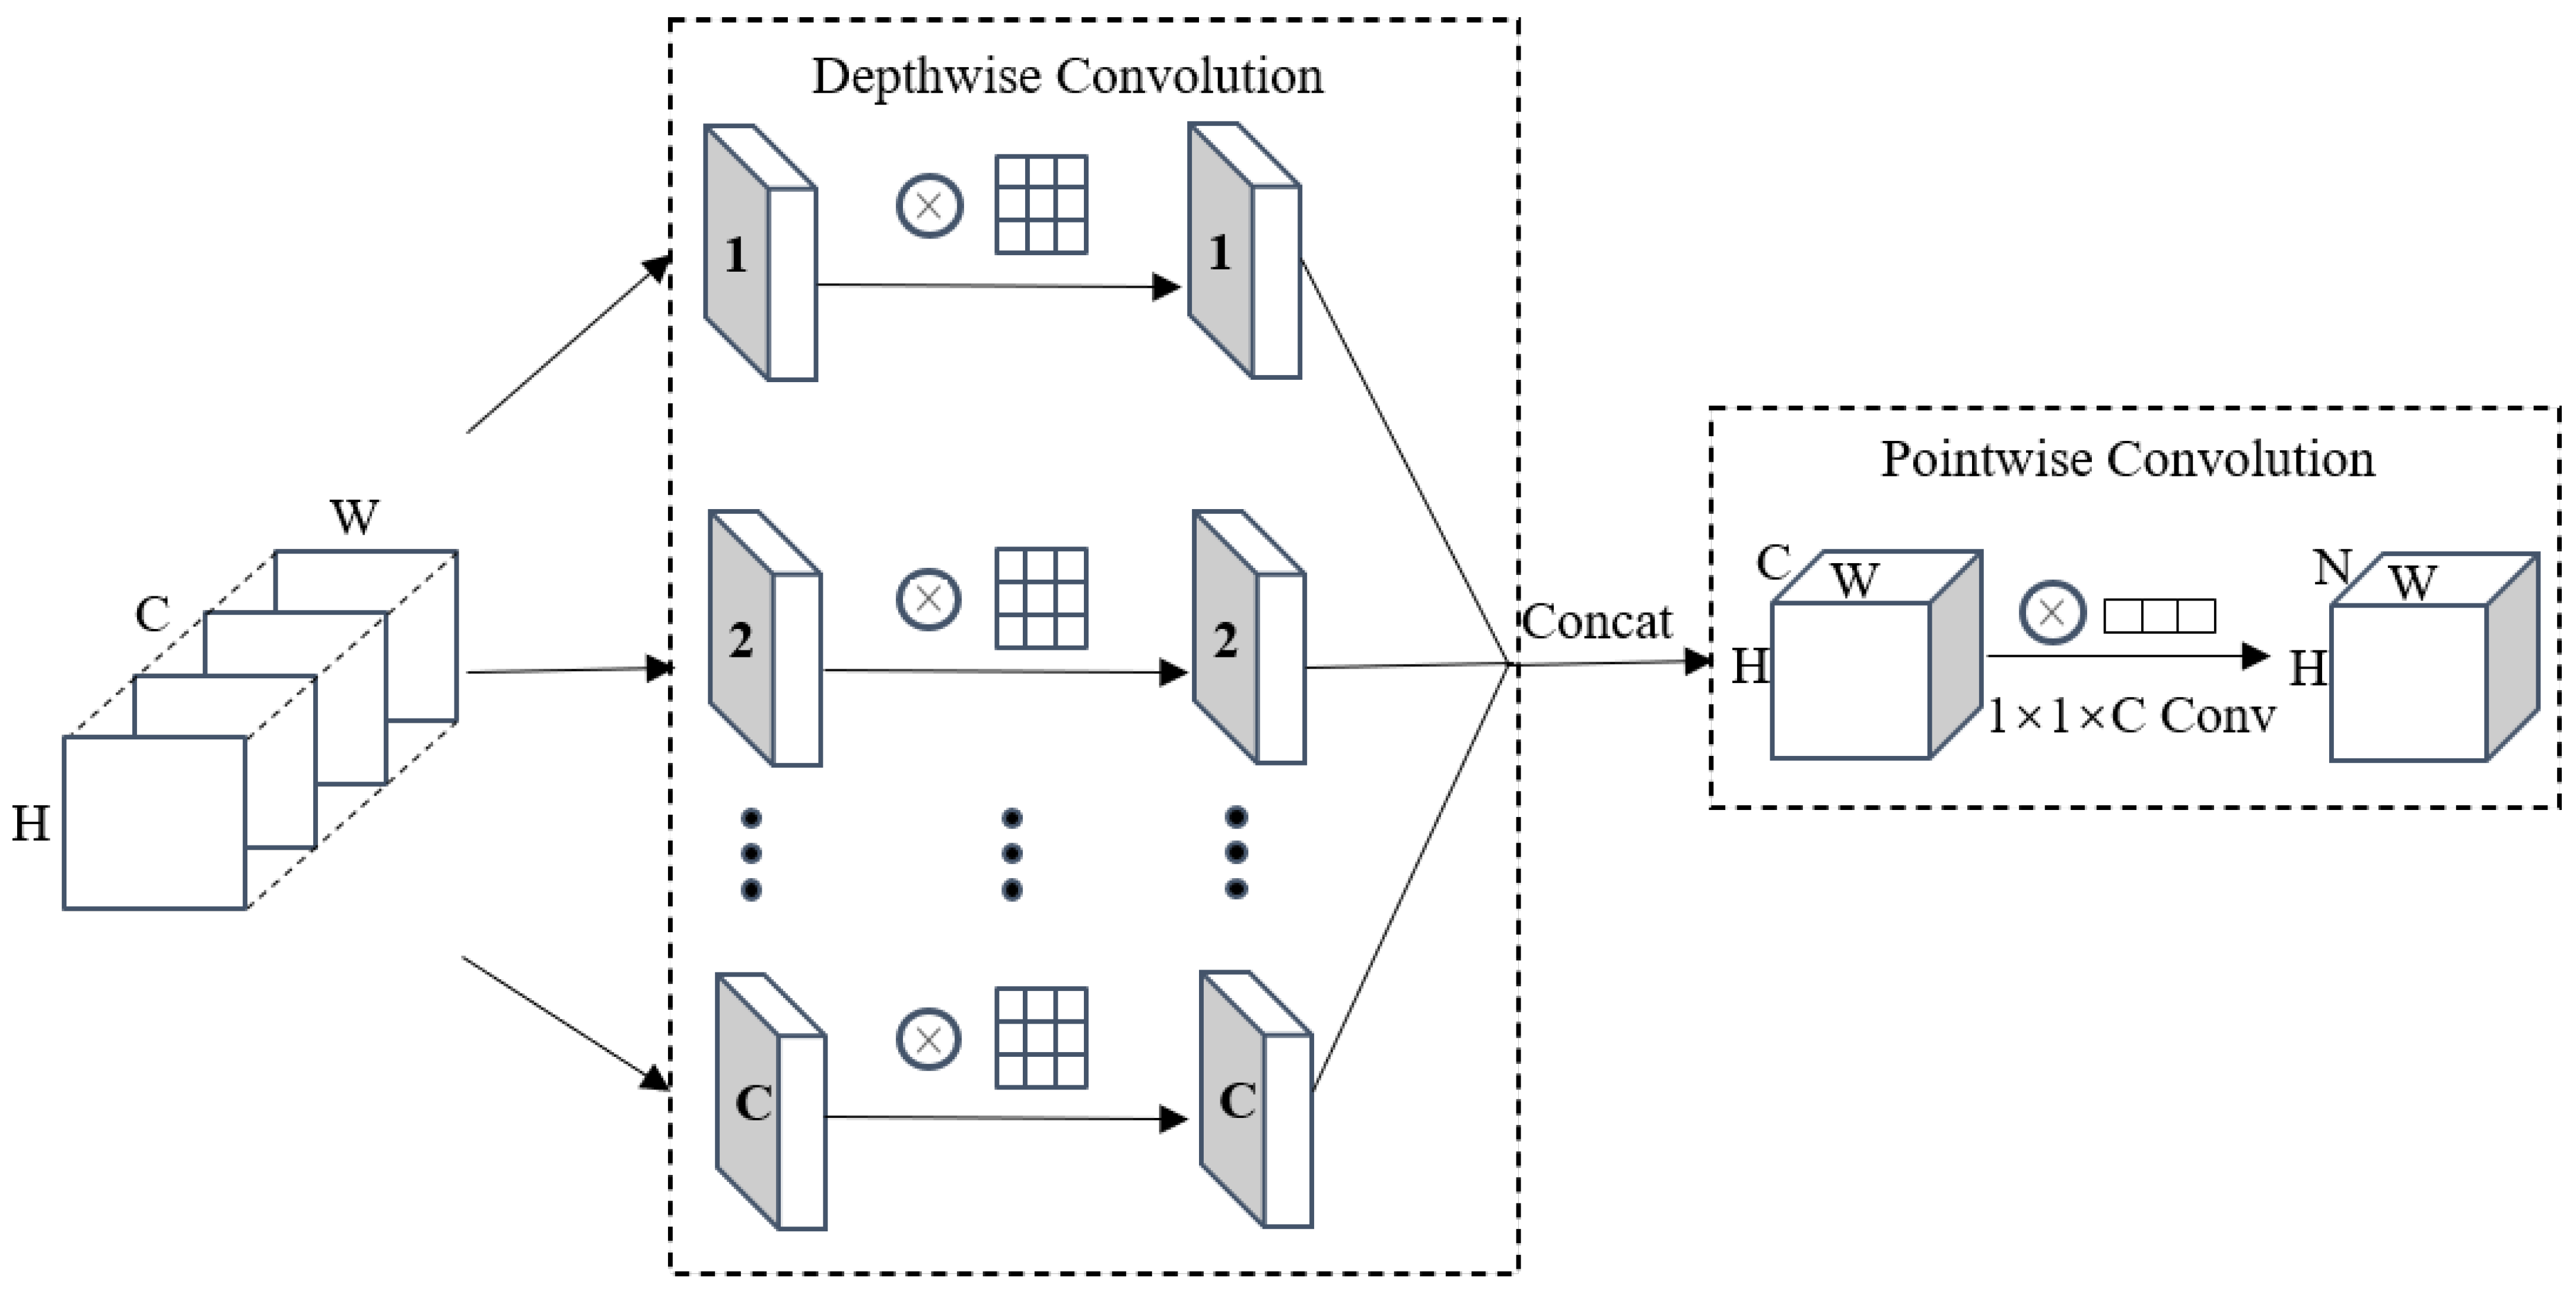
Depthwise separable convolution (DSC) [44] consists of two parts: depthwise Convolution and pointwise Convolution (see Figure 4). First, depthwise Convolution is performed, which uses a convolution kernel for each channel of the input feature map, then splices the outputs of all convolution kernels, and finally obtains the fusion feature map of this part. Next, perform the pointwise convolution operation. In this part, we need to use the convolution kernel of to calculate the depthwise Convolution output result, and C is the number of channels of the upper layer output result. Pointwise Convolution allows the DSC to freely change the number of output channels and also performs channel fusion on the feature maps output by the upper layer.
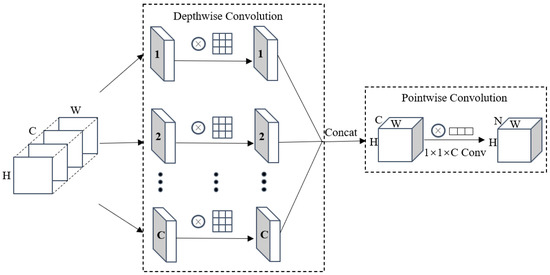
Figure 4.
Depthwise Separable Convolutional Structure Diagram. 1, 2, ..., C is the number of channels.
The calculation formulas for the parameter quantities of standard convolution, Depthwise Convolution, Pointwise Convolution, and depthwise separable convolution are in Equations (2)–(5). It can be seen from the formula that the ratio of the depthwise separable convolution to the standard convolution parameter is , and N denotes the number of channels of the output feature map. It shows that DSC’s computational efficiency is better than standard convolution:
where X is the input data, y is the convolution kernel of size , C denotes the number of the input data channels, and is the pixels of each image.
3.3. Multiscale Hybrid Attention Module
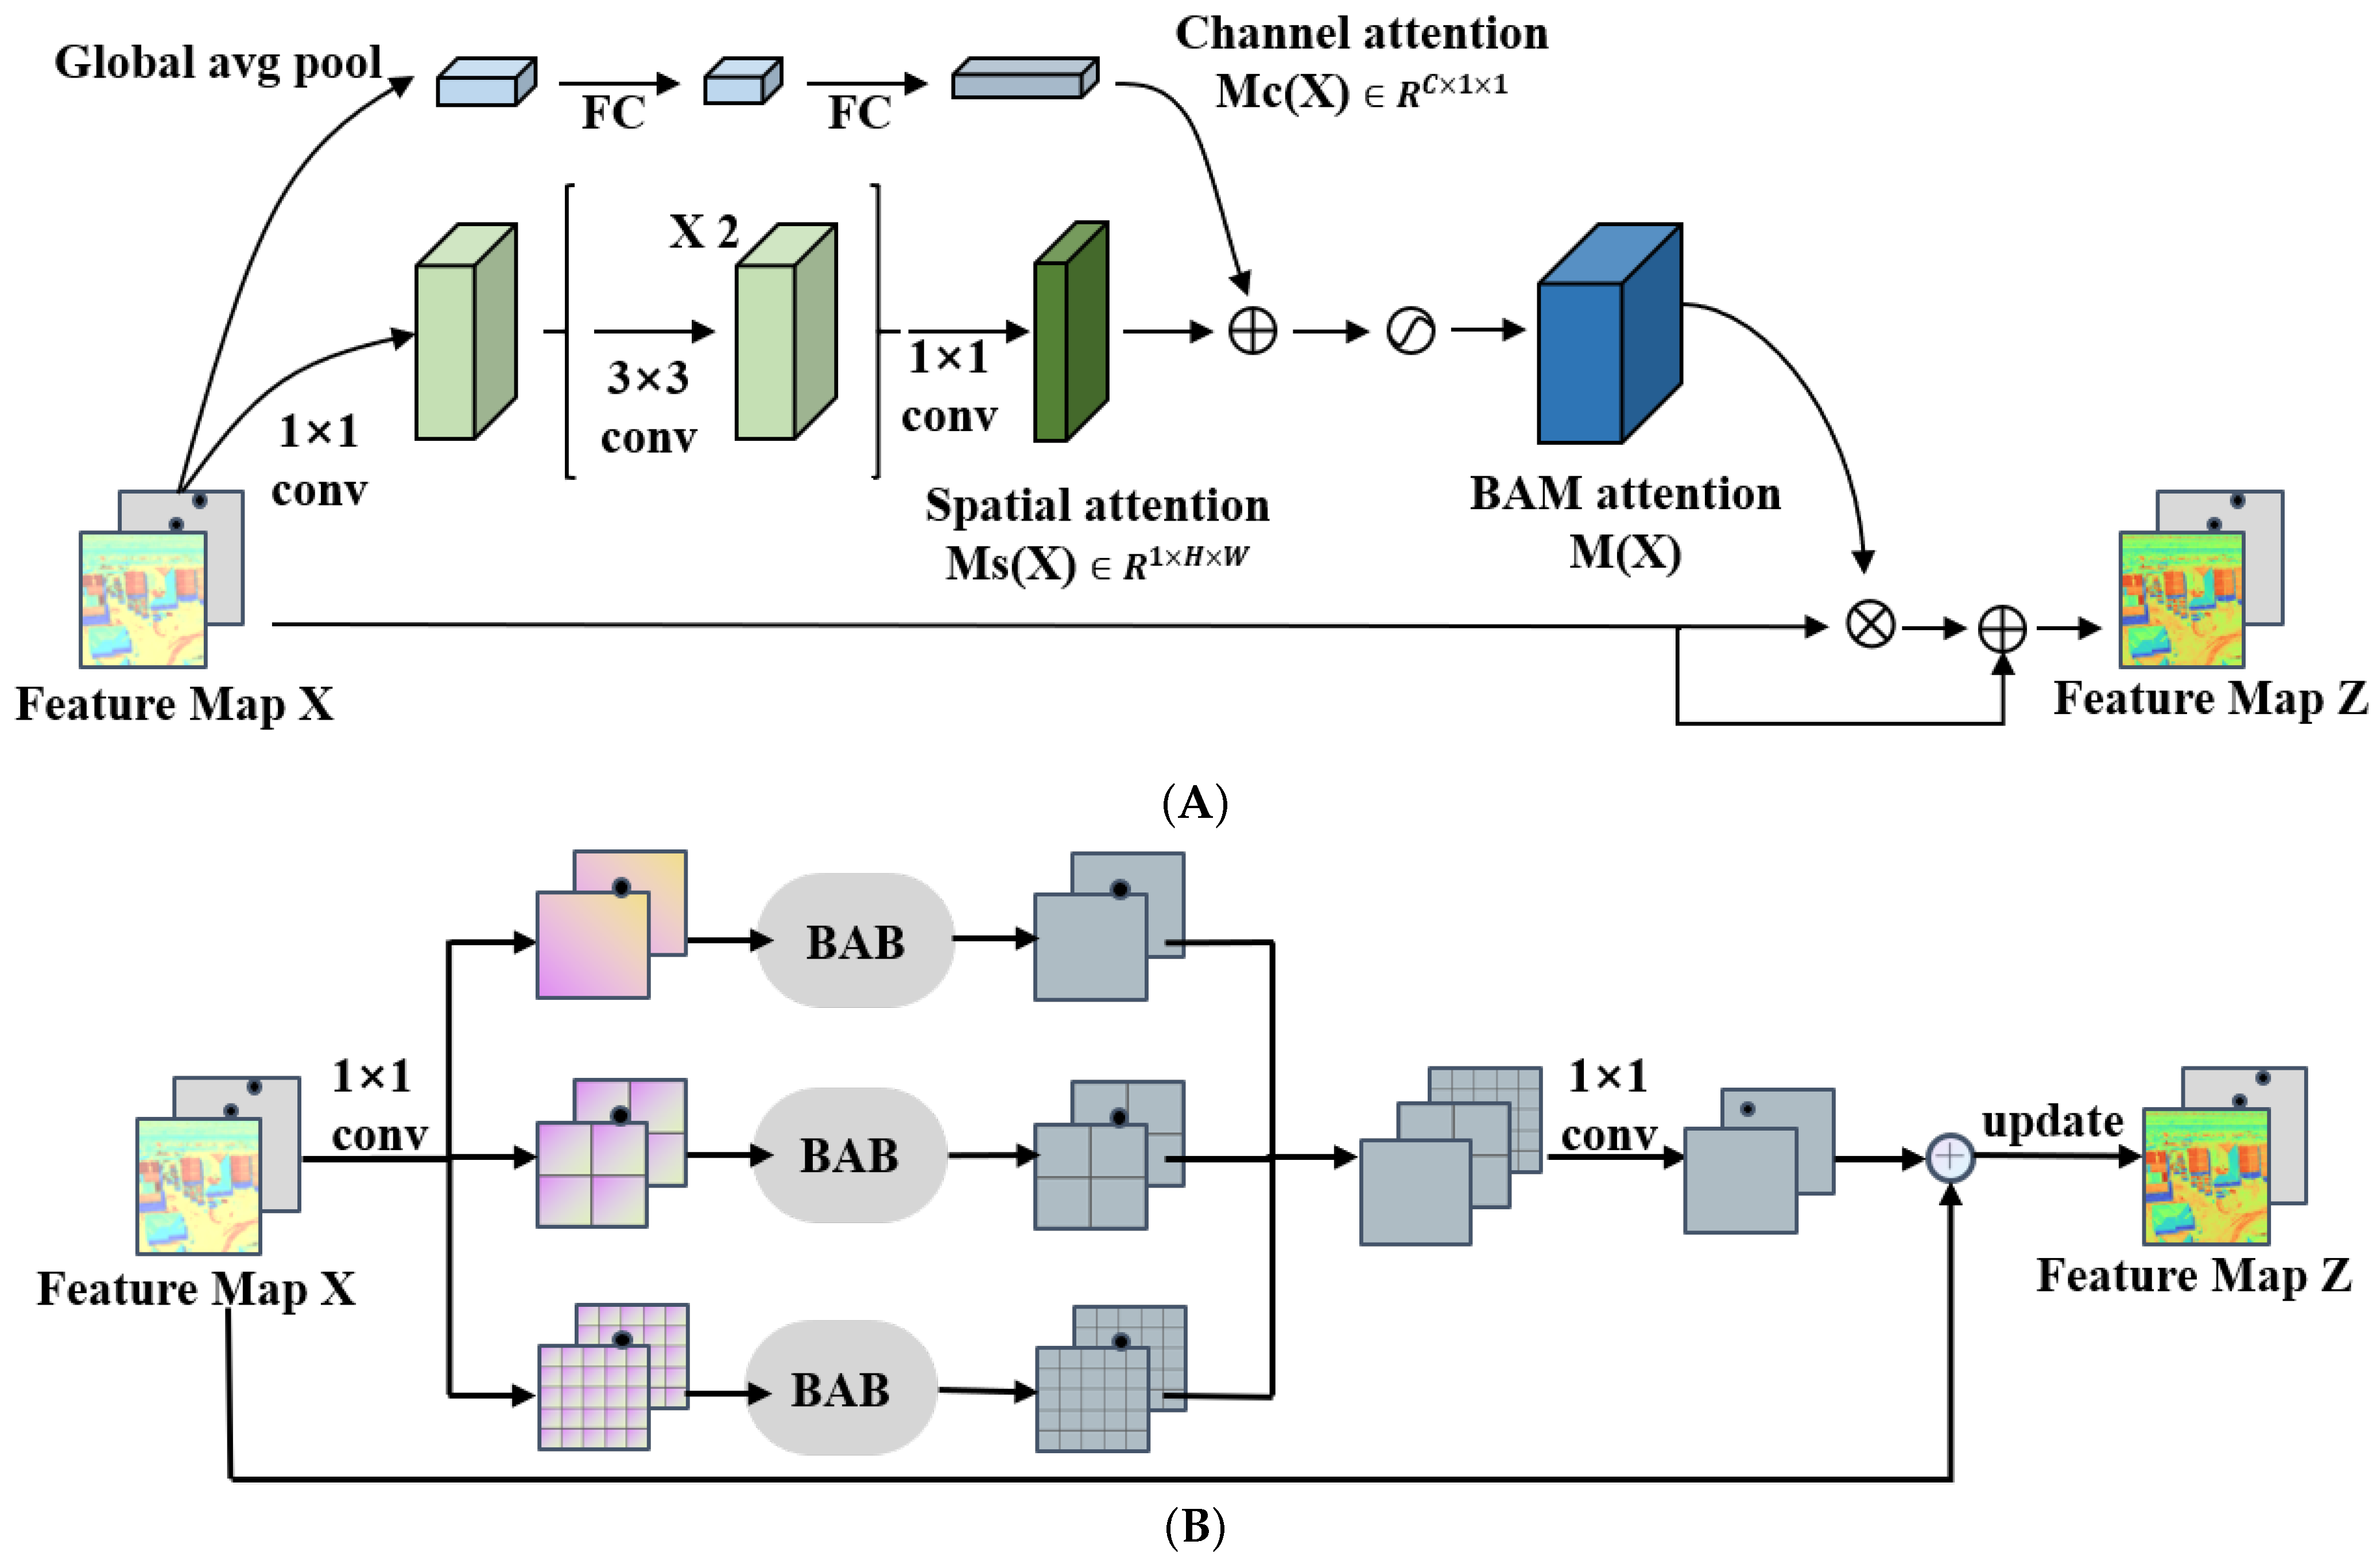
We construct a multi-scale hybrid attention block (MSAB) in this paper to fully utilize the contextual information of input images. This module generates a multi-scale attention feature matrix by aggregating channel-spatial information at different scales, improving the model’s ability to recognize fine details. In the multi-scale hybrid attention module, each branch divides the feature map into sub-regions of a specific scale and introduces a BAB (Basic Attention Block) module in each sub-region to obtain the attention features of each sub-region. Then, the attention feature tensors of different scales generated by each branch are fused to create multi-scale attention feature tensors and spliced.
As shown in Figure 5A, the feature map obtained by the feature extractor is sent to the hybrid attention module, which consists of two parts, namely the spatial attention module and the channel attention module.
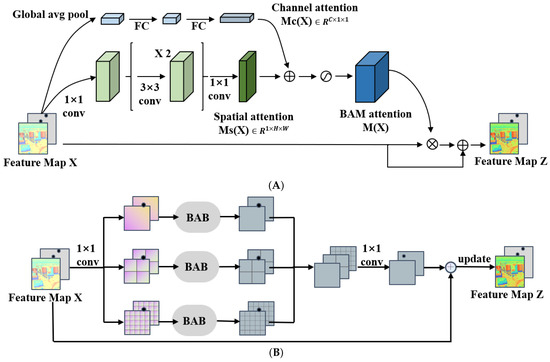
Figure 5.
The details of Basic Attention Block (BAB) and Multi-Scale Attention Block (MSAB) are illustrated in (A,B).
- (1)
- First, perform a global average pooling operation on the input feature map X to aggregate the feature maps of different channels. At the same time, the channel vector will encode each channel’s feature information and obtain the channel attention matrix (Equation (6)). To verify the effect of channel attention, we evaluate it using a multilayer perceptron (MLP) and add a batch normalization (BN) layer after the MLP to adjust the output size:
- (2)
- The spatial attention module utilizes 1 × 1 convolution to reduce the dimensionality of the input feature map X and merge and compress it across the entire channel dimension. Then, two 3 × 3 dilated convolutions are used to expand the receptive field (RF) to fully utilize the contextual spatiotemporal semantic information while reducing the number of model parameters. Finally, a 1 × 1 convolution is used to reduce the feature map to a spatial attention map , and a BN layer is applied at the end of the spatial attention branch to adjust the size of the output result. The spatial attention calculation is shown in Equation (7):
In this paper, we make the structure combining the above two modules as the change detection model’s basic attention block (BAB). The final 3D attention map is obtained by fusing the channel attention map and the spatial attention map . Since the sizes of and are different, we first expand the shape of the two attention maps to and then combine them by element-wise addition, which is more helpful for the gradient Update spread. Finally, we use a nonlinear function to obtain the attention feature map in the range of [0, 1] and add to the input feature map element-wise to obtain the updated feature map Z. The formula for calculating and Z is as follows:
where represents the sigmoid nonlinear activation function. ⊗ denotes element-wise multiplication.
As shown in Figure 5B, we first concatenate the feature maps obtained by the feature extractor into a feature matrix in the multi-scale attention block (MSAB). Then, the feature map X is fed into three branches. Each branch divides the feature tensor into d × d sub-regions, d belongs to [1, 2, 4], and the BAB module is introduced to each branch to generate the attention of different scale features to enhance the ability to recognize fine features. After feature fusion and 1 × 1 convolution operation, a new feature map is generated. Then, the feature map and the original feature map X are added element-wise to generate an updated feature map Z. The convolution operation and nonlinear mapping in the downsampling stage extract the salient features of the changing regions. The max pooling layer is used to reduce the feature map’s resolution while increasing the feature map’s receptive field. With the increase of the number of downsampling layers, the receptive field will gradually increase, and the discriminative ability of the feature map will increase progressively; the upsampling uses bilinear interpolation to restore the feature map to the original size gradually.
3.4. Evaluation Metrics Module
To evaluate the similarity between feature maps (Z1, Z2) extracted by the feature extraction module and updated by the multi-scale attention module, the paper uses the Contrastive Loss function as the evaluation metric. Contrastive Loss can effectively deal with data pairs in Siamese neural networks. The expression is as follows:
where and represent the input data pair. indicates whether the data pair has changed, Y = 0 means no change, and Y = 1 implies change. is the Euclidean distance between the pixels of the input data feature map. W is the parameter to be learned; m represents the margin.
First, the updated feature maps Z1 and Z2 are adjusted to the same size by bilinear interpolation and input to the evaluation metric module as a bit-time image. The Euclidean distance between the modified feature maps is then calculated from the pixel pairs to generate a distance map:
where is the position of the corresponding pixel. is the Euclidean distance of the pixel pair. When the pixel pair corresponding to the feature map is greater than the threshold , it means that the pixel has changed; otherwise, there is no change.
4. Experiments
In this section, we provide multiple comprehensive evaluations to demonstrate the excellent performance of our proposed method on relevant datasets. We implement all tests in the Ubuntu18.04.5LTS operating system and PyTorch1.6, Facebook (Meta), Menlo Park, CA, USA, python3.6 deep learning framework. Regarding computer hardware, we used NVIDIA GeForce RTX2080ti GPU, NVIDIA, Santa Clara, CA, USA to train, validate and test it. We employed the Adam optimizer in this experiment and set the initial learning rate to . When the epoch is greater than 100, the learning rate is decreased by a linear decay strategy. The batch size and epoch were 4 and 200, respectively. The weight with the highest validation F1 score will be saved as the checkpoint for testing.
4.1. Data Sets
To verify our proposed method’s effectiveness and generality, we used two public datasets widely used in the field of building change detection, namely WHU-CD [43] and LEVIR-CD [44], in the experiment.
4.1.1. Dataset Introduction
- The study area selected for the WHU-CD [26] dataset is Christchurch, New Zealand. The dataset consists of high-resolution aerial imagery covering an area of a magnitude 6.3 earthquake in February 2011 and reconstructed in subsequent years, containing 12,796 buildings over 20.5 square kilometers (16,077 buildings of the same place in the 2016 dataset). The original dataset size is 32,507 × 15,354, contains three channels of RGB, and the spatial resolution is 0.075 m.
- LEVIR-CD [27] is a large-scale remote sensing dataset for building change detection provided by the LEVIR Laboratory of Beihang University. The dataset uses Google Earth API to obtain 637 high-resolution remote sensing image pairs. The image size is 1024 × 1024, contains three channels of RGB, and the spatial resolution is 0.5 m. The dataset spans 5 to 14 years, during which there are significant changes in land use, especially building additions. LEVIR-CD covers various types of buildings, and the size of the changing objects spans a large scale, which can effectively test the performance of the change detection method.
4.1.2. Data Preprocessing
Due to the computer GPU memory capacity limitation, the high-resolution remote sensing images in the original data set cannot be directly used for the training of the change detection model, and the data need to be preprocessed. The processing flow is as follows.
First, we slice the remote sensing image and set the slice size to 256 × 256 and the overlap to 0. Then, to enhance the model’s generalization ability, we perform appropriate data augmentation processing on the data. Data enhancement methods include: flip, rotate, and Gaussian blur. Finally, divide the dataset after data enhancement, of which the training set accounts for 70%, the validation set accounts for 10%, and the test set accounts for 20%.
4.2. Experimental Metrics
We adopt F1-score, mean intersection over union (MIoU), Precision, Recall, and overall accuracy (OA) as the evaluation indicators of experimental results, and use them for building change detection analysis. The F1-score can comprehensively consider the precision rate and recall rate to make it more representative. The formula is as follows:
In Equation (11), TP is True Positives, representing the number of correctly predicted changed pixels. TN is True Negatives, which denotes the number of correctly predicted unchanged pixels. FP is False Positives, which means the number of incorrectly predicted changed pixels. FN is False Negatives, representing the number of mispredicted unchanged ‘pixels.
4.3. Comparative Methods
To demonstrate the superiority of the method proposed in this paper, the following six excellent change detection methods are compared:
- Fully Convolutional-Early Fusion (FC-EF) [31]: FC-EF is a Fully convolutional neural network based on UNet structure. This structure fuses bitemporal images in the channel dimension before feeding them into the network, treating them as different channels of an image.
- Fully Convolutional-Siamese-Concatenation (FC-Siam-conc) [31]: FC-Siam-conc is a Siamese neural network structure based on FC-EF, which skip-connects three feature maps from two encoder branches and the corresponding layers of the decoder, and finally generates a change map.
- Fully Convolutional-Siamese-Difference (FC-Siam-diff) [31]: FC-Siam-diff is similar to FC-Siam-conc, both based on the Siamese neural network structure of FC-EF. The difference is that the structure first obtains the absolute value of the difference between the feature maps of the two decoder branches and then performs a skip connection with the corresponding layer of the decoder.
- Bitemporal Image Transformer (BIT) [42]: BIT uses a transformer to build a network consists of a Siamese semantic tagger, a transformer encoder, and a decoder.
- Deeply Supervised Image Fusion Network (IFNet) [45]: IFNet applies channel attention to each level of feature extraction of the decoder and calculates the supervision loss at each level.
- Deeply Supervised Attention Metric-based Network (DSAMN [46]: DSAMNet is a deep supervised metric learning network model that integrates CBAM, which can obtain more representative features and achieve better model effects.
4.4. Results Evaluation
In this subsection, we verify the overall performance of the proposed method and the comparison methods. Table 1 and Table 2 summarize the quantitative results of all methods on the WHU-CD and LEVIR-CD test sets. As shown in Table 1 and Table 2, the proposed method achieves better performance on the WHU-CD and LEVIR-CD benchmark datasets compared with other methods.

Table 1.
Comparison results of different change detection methods on the WHU-CD dataset.
Table 2.
Comparison results of different change detection methods on the LEVIR-CD dataset.
As shown in Table 1, compared with six change detection models, this paper adopts a lightweight model incorporating multi-scale mixed attention for building change detection, which achieves better detection and segmentation results. Tested on the WHU-CD dataset, the method proposed in this paper has the highest MIOU, OA, Recall, and F1-score of 87.6%, 97.0%, 90.9%, and 87.8%, respectively, which is better than other comparable models. It can be observed that the deep supervised metric learning network DSAMNet integrated with CBAM has achieved the best performance in the comparison model, with F1 reaches 86.2%. Benefiting from the transformer application in the image processing, BIT has achieved the highest Score in precision, reaching 86.6%, but F1 is only limited to 85.9%. FC-EF, FC-Siam-Conc, and FC-Siam-Diff, which adopt early and late fusion strategies, have the worst model performance due to their relatively simple structure. Table 2 shows the test results based on the LEVIR-CD dataset. Compared with Table 1, all methods have better test results on the LEVIE-CD dataset. This is mainly because the data volume of LEVIR-CD is larger than that of WHU-CD. It can be seen from Table 1 and Table 2 that the comparison model is more sensitive to the change in data volume, and the performance suffers different degrees of loss. At the same time, the method proposed in this paper has stronger robustness in the test with low data volume. In this paper, the lightweight change detection method integrating a multi-scale hybrid attention module has different degrees of leadership in Recall, MIoU, and F1-score. This shows that fusing the multi-scale mixed attention mechanism can effectively improve the model’s ability to identify small-scale changing buildings and false changing features caused by registration errors. This is mainly because the method can take into account the processing characteristics of multi-level details and make full use of rich contextual spatiotemporal semantic information to achieve the purpose of effective change detection.
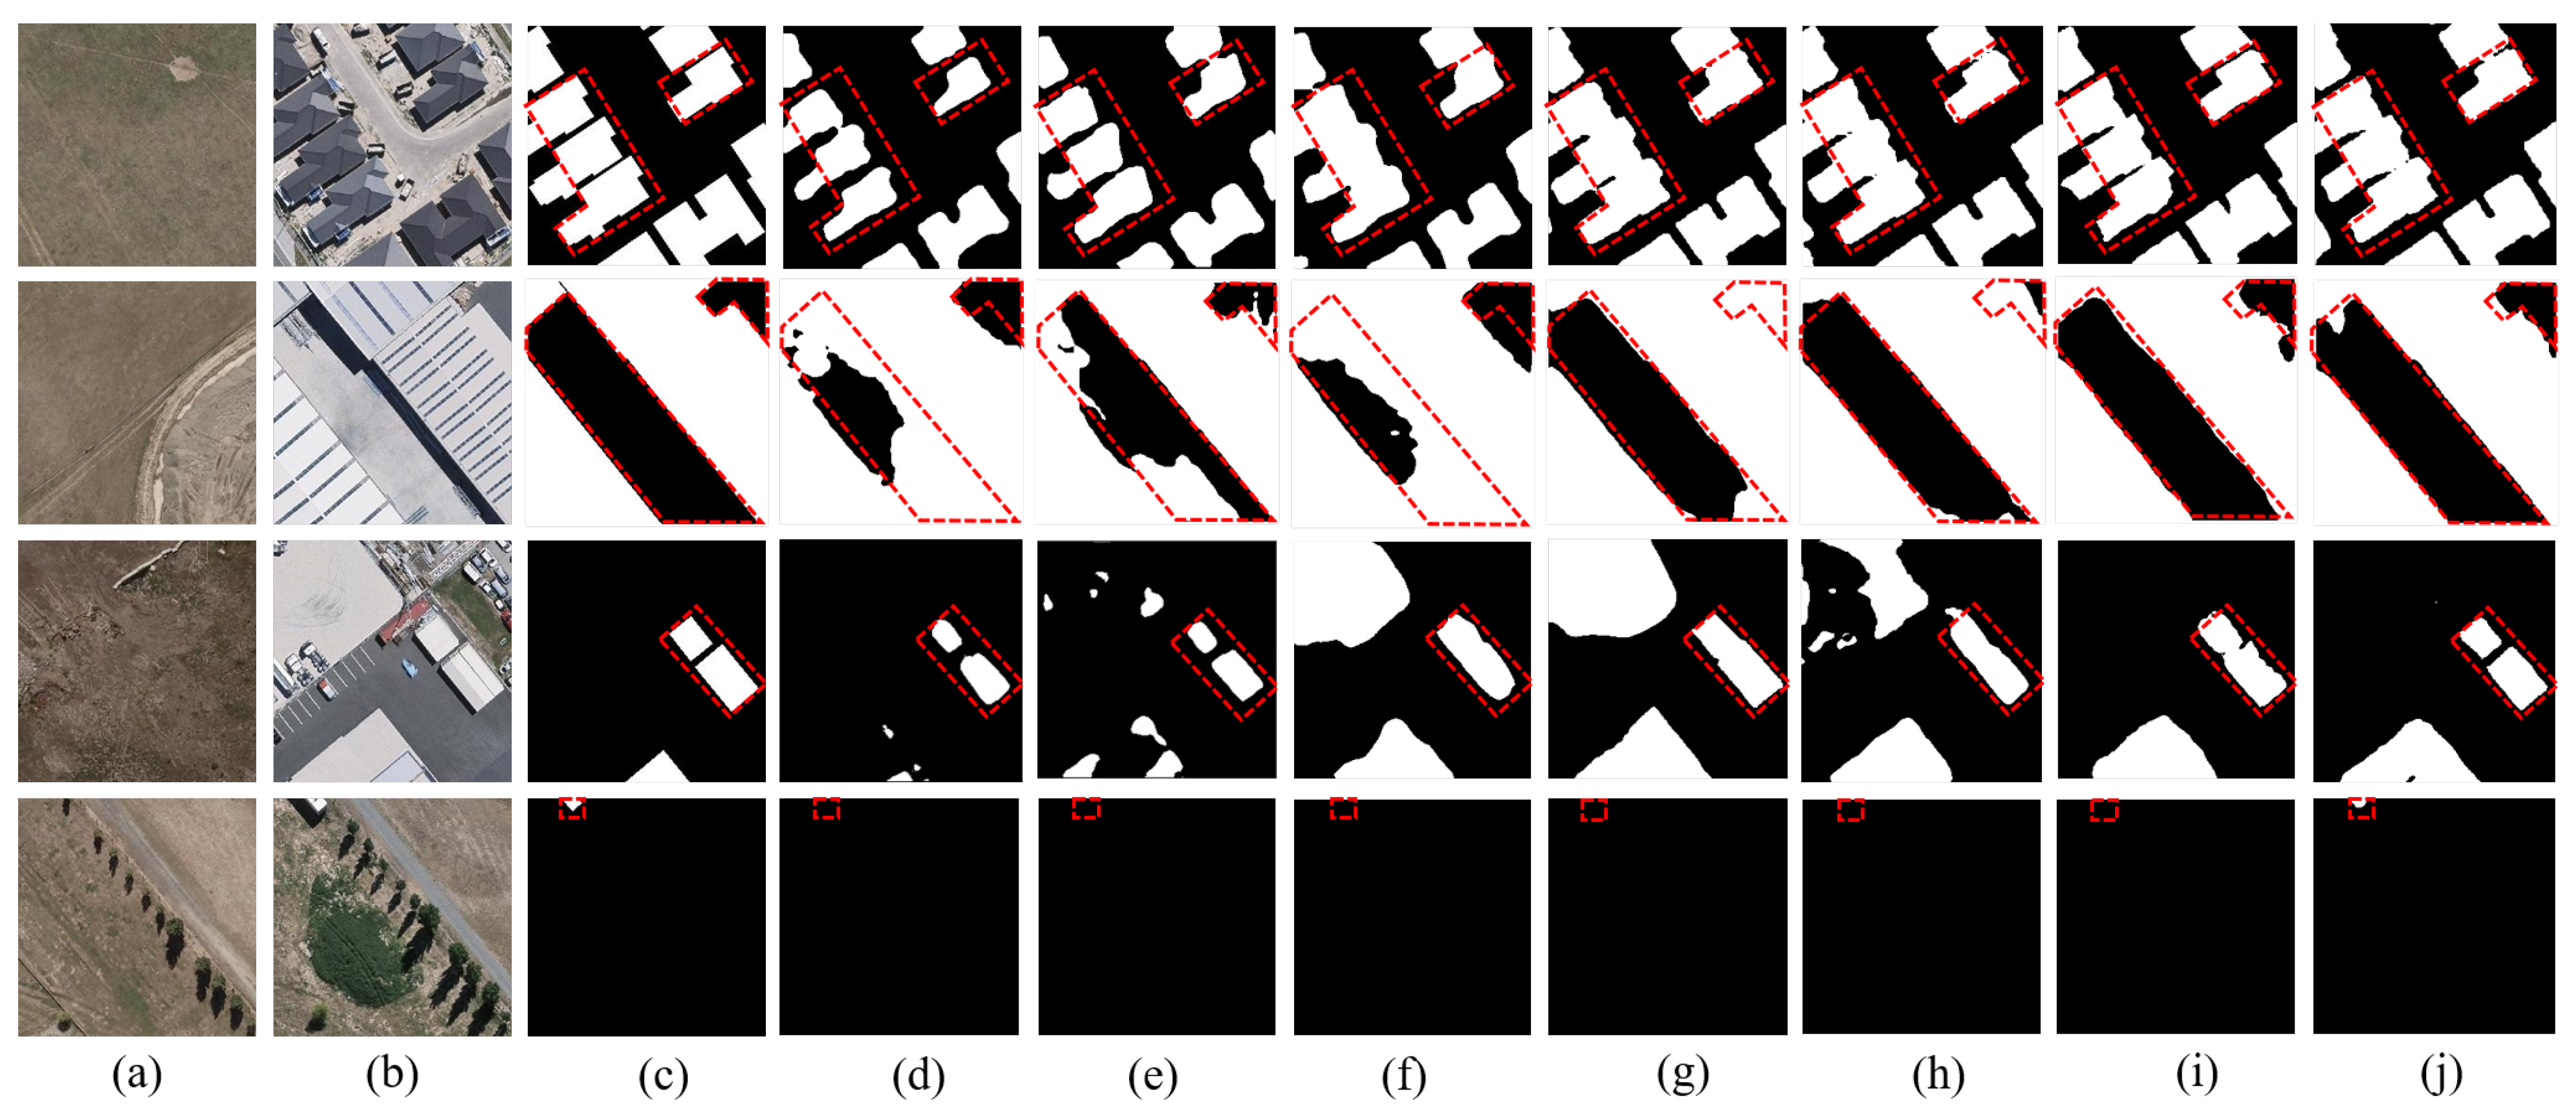
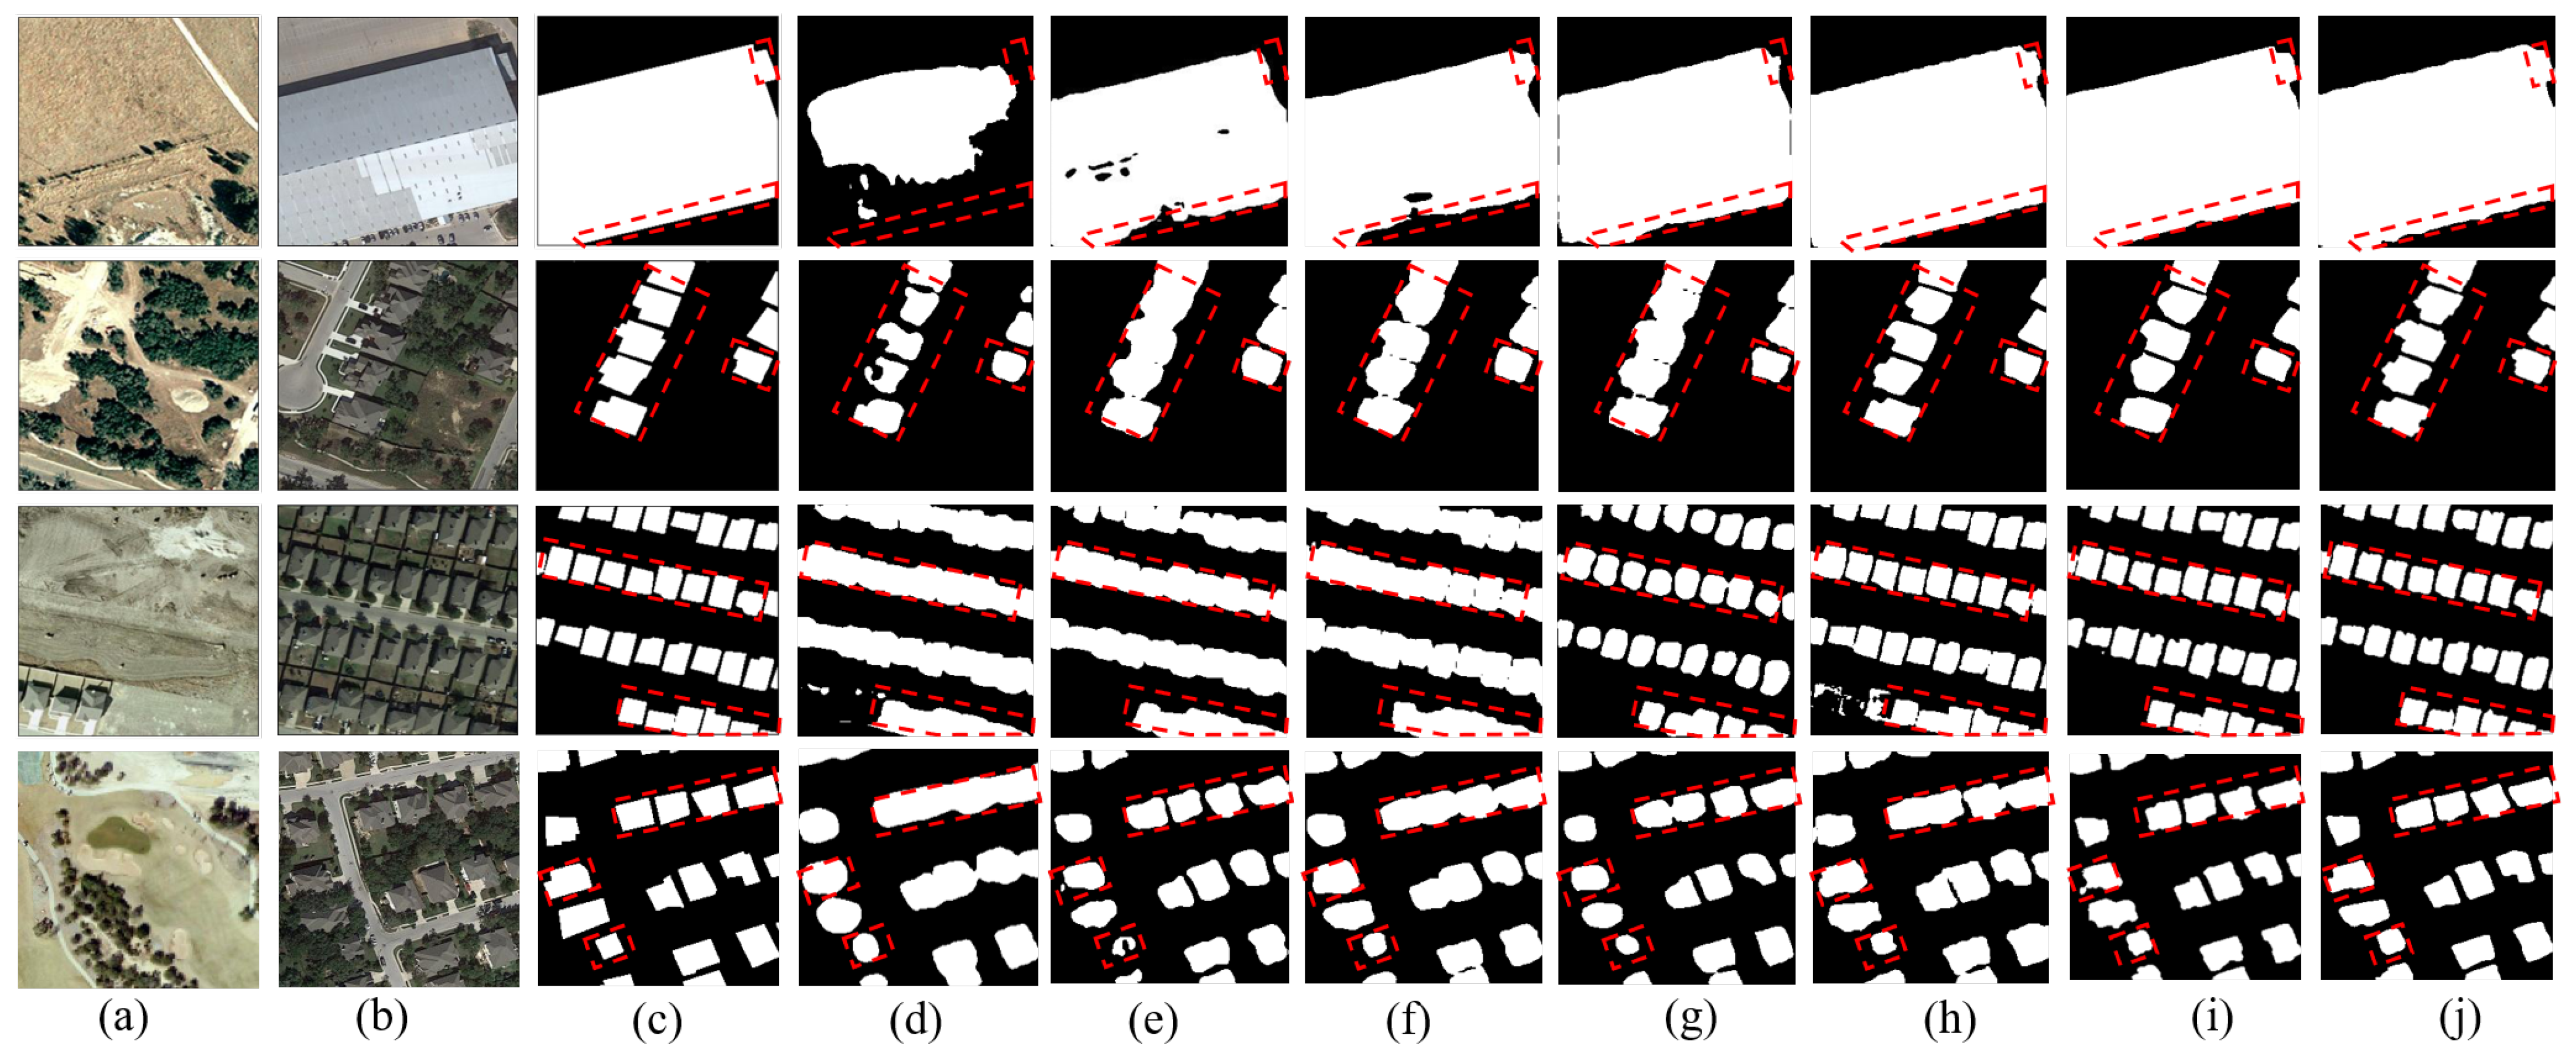
The inference results on the WHU-CD test set are shown in Figure 6 and Figure 7. The comparison chart includes three types of buildings of a large, medium, and minor scales. We can see that the performance of the method proposed in this paper is better than that of the comparison model in complex scenes. Specifically, in small-scale dense buildings, FC-EF, FC-Siam Conc, and FC-Siam diff detect the roughest building edges with low accuracy, as shown in Figure 6 (first row). Since IFNet applies channel attention to each level of feature extraction in the decoder, the edge precision of the prediction results is better than the previous three models. The BIT model first uses the CNN backbone network for feature extraction and then sends it to the transformer structure for processing. The multi-head attention in the transformer block can better identify the edge details of buildings, which is improved compared to the IFNet model. The DSAMNet model integrates CBAM blocks to obtain more discriminative features at both spatial and channel levels and integrates deep supervision layers for better feature extraction. The final result is slightly improved compared to BIT. Furthermore, in Figure 7, the comparison model produced more false positives and false negatives. Especially in the first row of Figure 7, the comparison models produce more false positives (marked in blue), mainly because the remote sensing images of different phases cause changes in the texture and color of buildings at the same location (but not the changes buildings) due to the changes in imaging illumination. These pseudo changes have a greater impact on the comparison model, leading to the wrong prediction of the comparison model. We add a multi-scale hybrid attention structure based on the lightweight feature extractor of the aggregated context semantic guidance block so that the model can well identify pseudo-variations due to remote sensing imaging illumination changes and obtain its features while enhancing the recognition of building edge features to enable finer prediction of labels. In addition, the comparison model has a certain false alarm rate. The main reason is that roads or other ground objects have a similar color and texture features as buildings. Due to the comparison model’s limited receptive field (RF), it is difficult to distinguish these false changes. Finally, it can be seen from Figure 6 (fourth row) that the comparison model is not sensitive to the changes of tiny scales, and it is easy to cause the problem of missing detection of buildings with minor changes.

Figure 6.
Visual results on WHU-CD. (a) T1 images; (b) T2 images; (c) Ground truth; (d) FC-EF; (e) FC-Siam-Conc; (f) FC-Siam-Diff; (g) IFNet; (h) BIT; (i) DSAMNet; (j) the proposed.

Figure 7.
Comparison of Error Maps Based on WHU-CD. (a) T1 images; (b) T2 images; (c) FC-EF; (d) FC-Siam-Conc; (e) FC-Siam-Diff; (f) IFNet; (g) BIT; (h) DSAMNet; (i) the proposed (Black, green: correct detection, red: missed detection, blue: over detection).
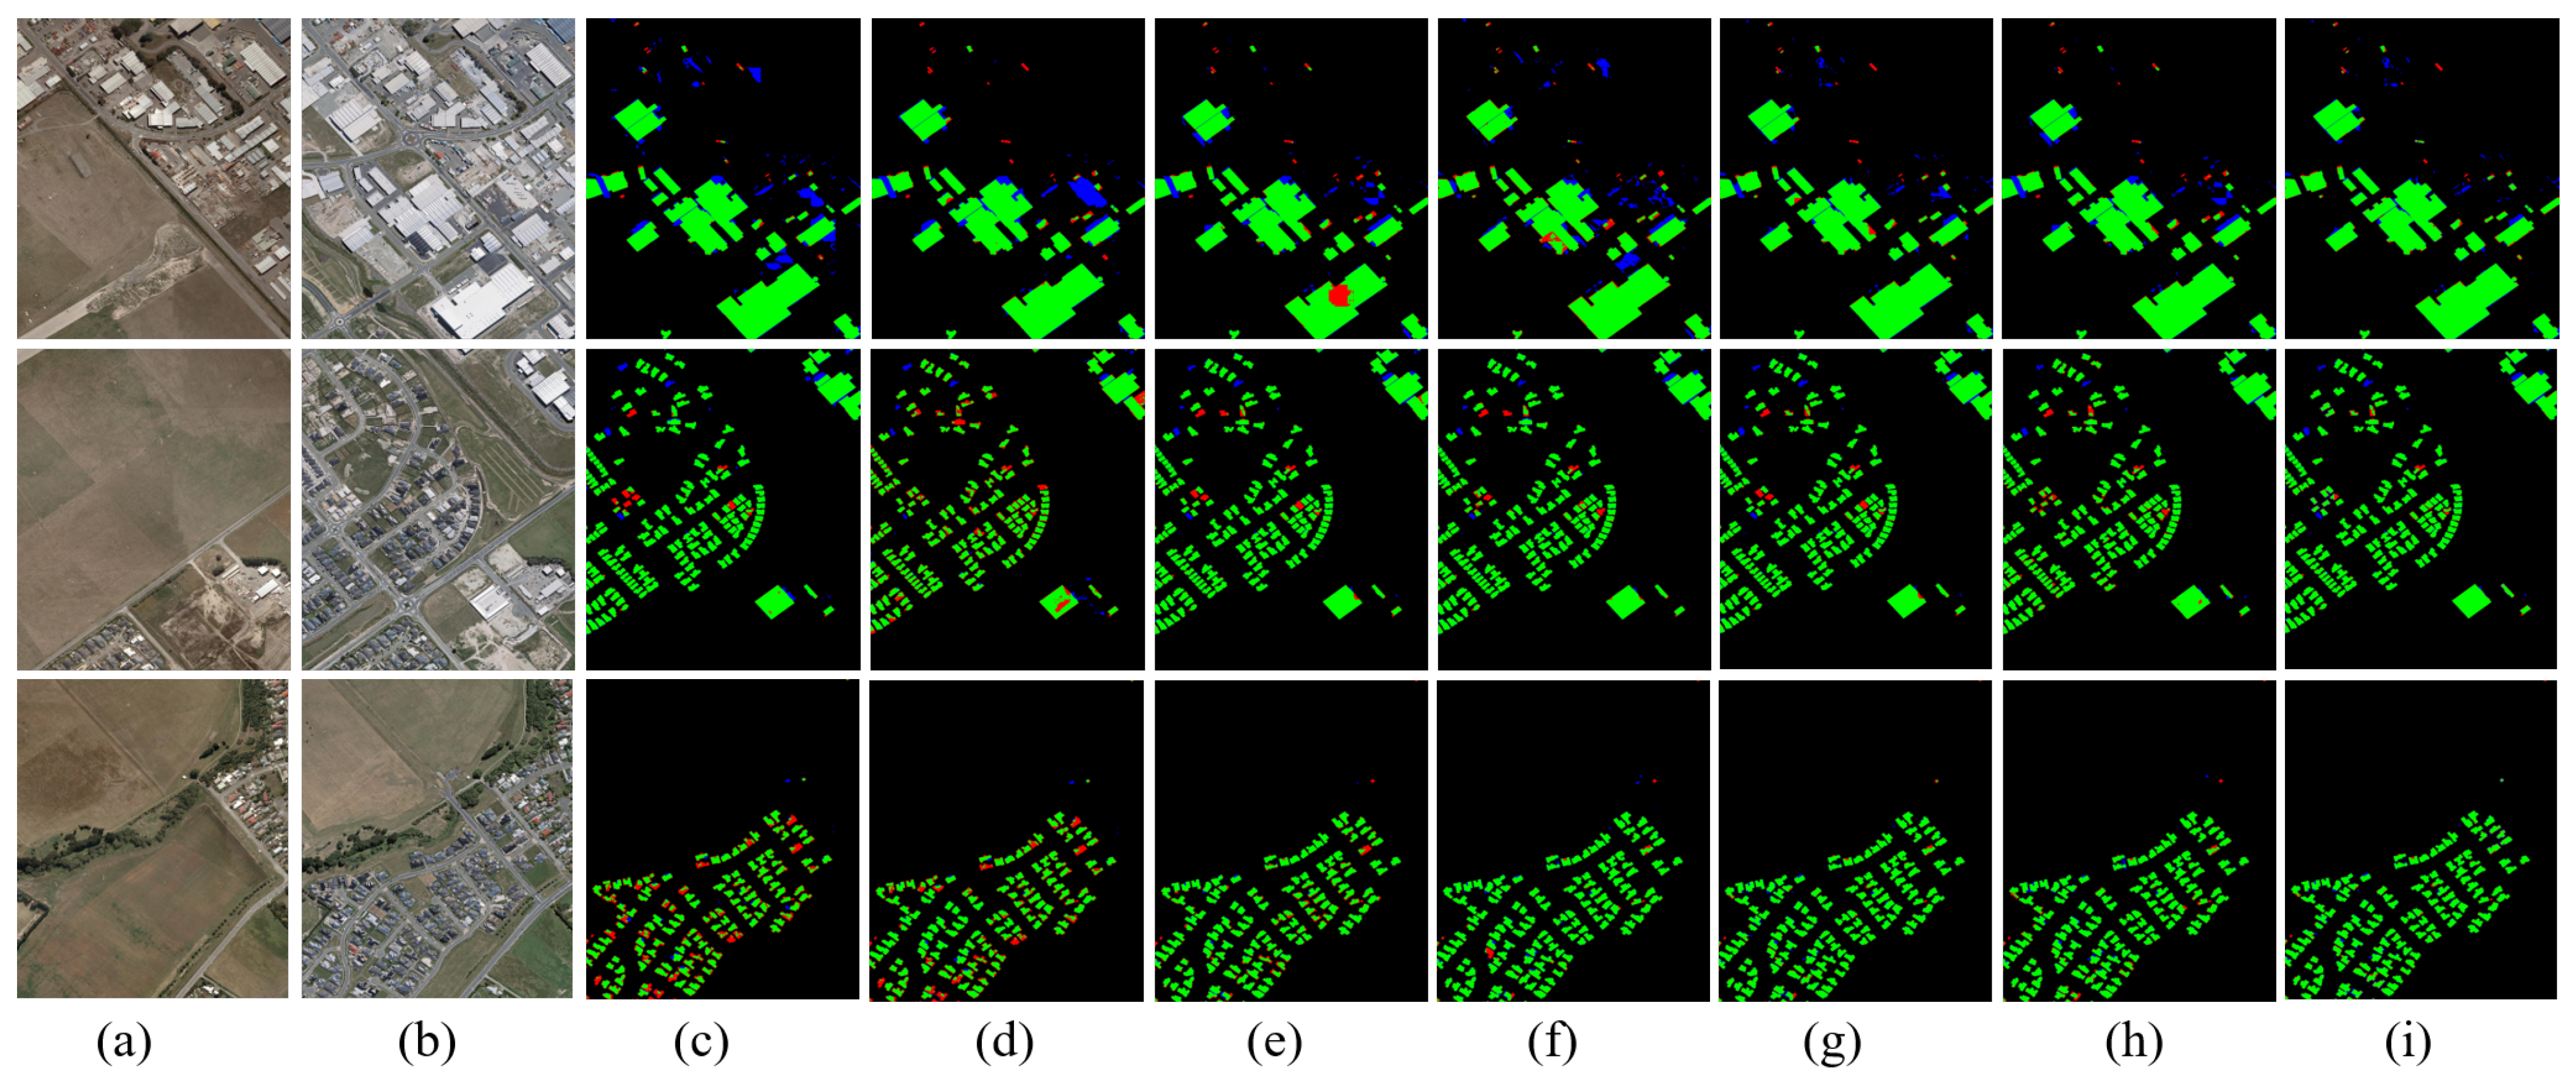
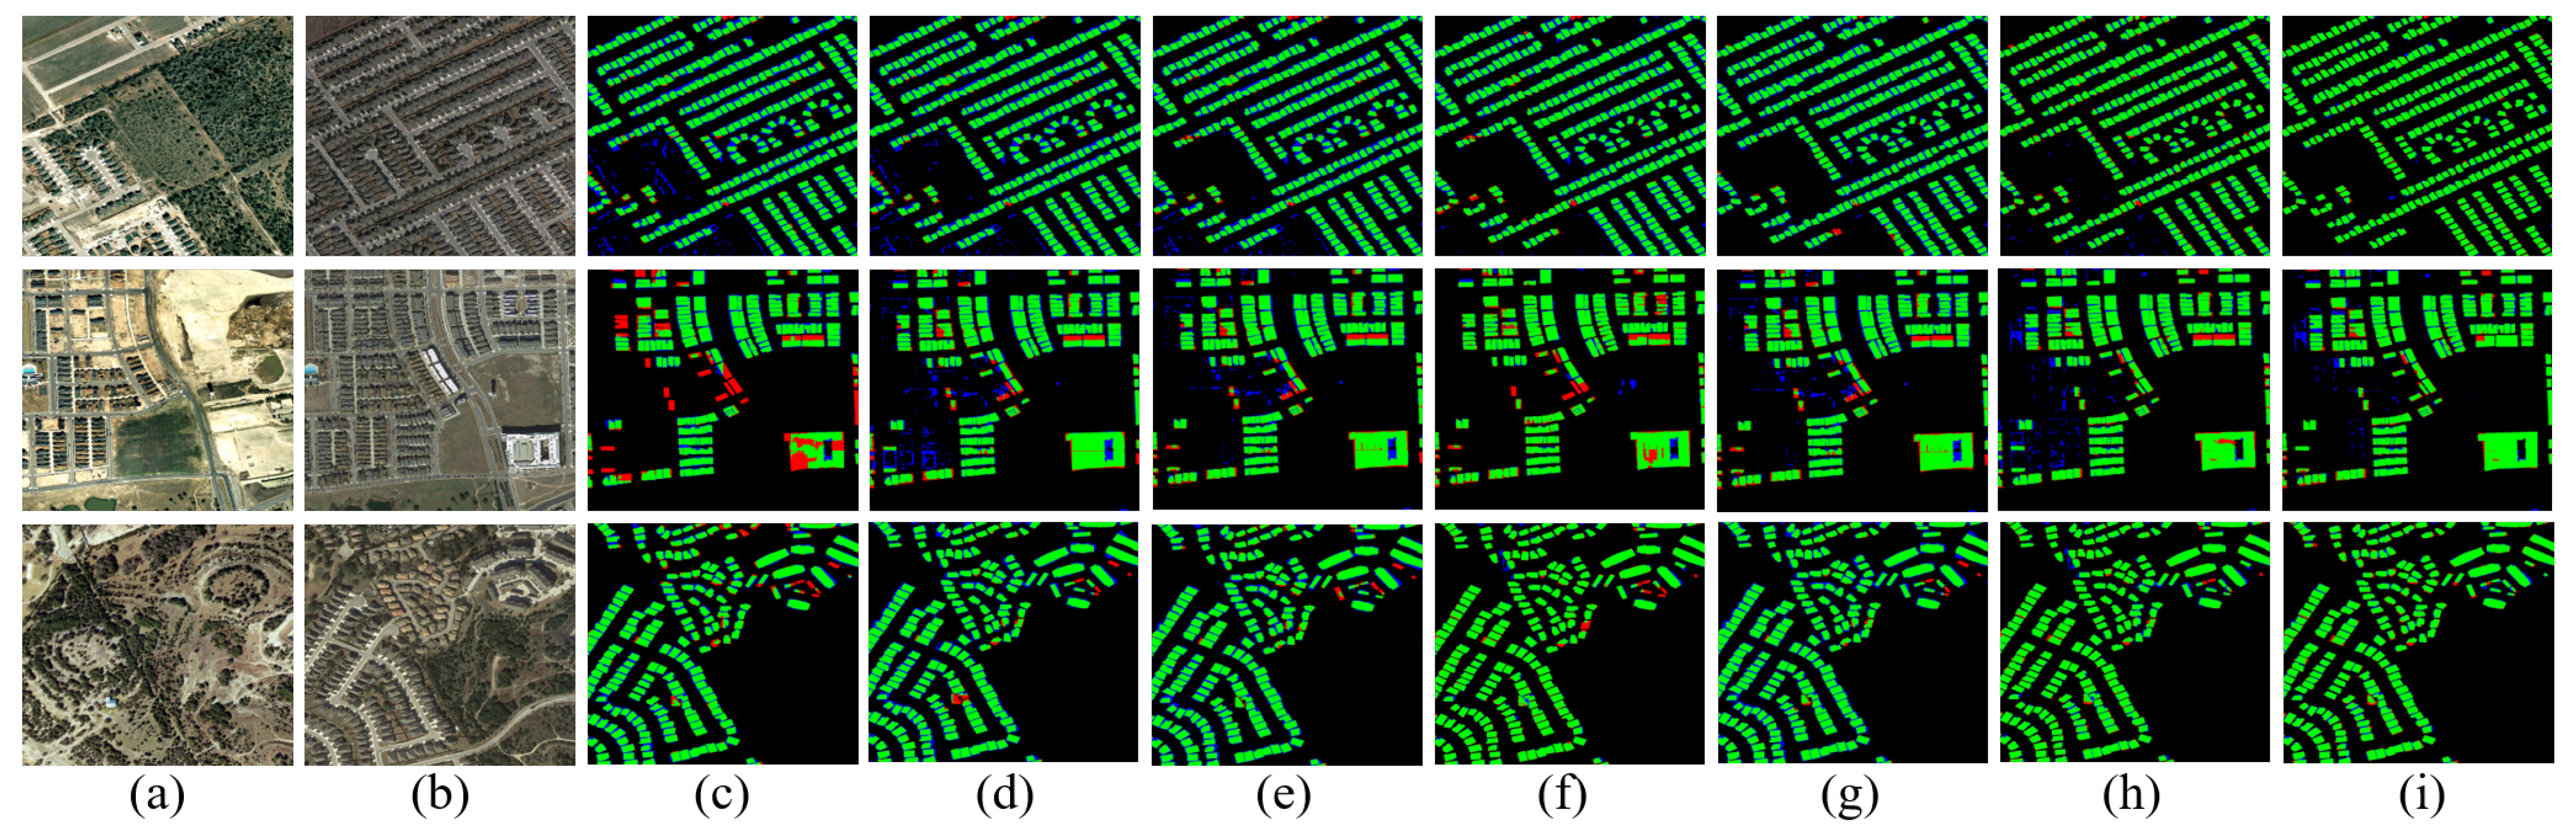
Figure 8 and Figure 9 provide visual plots of the performance of the compared methods on the LEVIR-CD test set. As shown in Figure 8, BIT, DSAMNet, and our proposed method maintain good performance on the test set, but our method generates results that are closer to the ground truth labels. The building labels generated by our method are more refined and perform optimally on objects that vary across multiple scales. In particular, in the first row of Figure 9, the contrast models produce more stripes of fine noise, mainly because there is a certain registration error in the bitemporal remote sensing images. Although this error is subtle, it still has an enormous impact on the contrast models, and the variation of the change caused by the registration error is not the target of our attention. We obtain the features of the registration error by using a multi-scale hybrid attention mechanism, which is used to capture rich spatial-temporal information so that the model can better identify this pseudo-variation. As shown in Figure 9 (second row), FC-EF is not robust in large variation regions and produces more false negatives. At the same time, FC-Siam-Conc cannot detect the shape of the changed area well, thus generating more false positives. Our method can accurately detect the boundaries of changing buildings, as shown in Figure 9 (first and third rows). At the same time, compared with other methods, our method has the lowest false alarms and performs best in complex scenes.
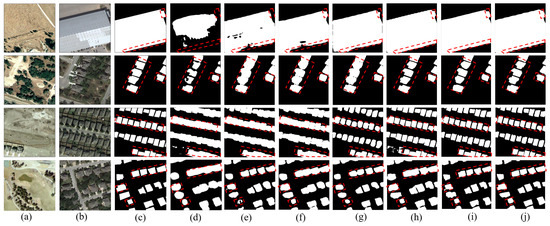
Figure 8.
Visual results on LEVIR-CD. (a) T1 images; (b) T2 images; (c) Ground truth; (d) FC-EF; (e) FC-Siam-Conc; (f) FC-Siam-Diff; (g) IFNet; (h) BIT; (i) DSAMNet; (j) the proposed.
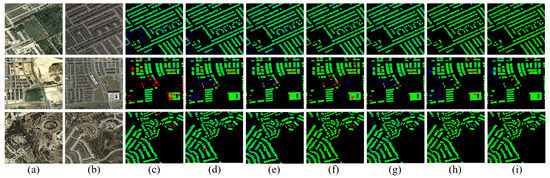
Figure 9.
Comparison of Error Maps Based onLEVIR-CD. (a) T1 images; (b) T2 images; (c) FC-EF; (d) FC-Siam-Conc; (e) FC-Siam-Diff; (f) IFNet; (g) BIT; (h) DSAMNet; (i) the proposed (Black, green: correct detection, red: missed detection, blue: over detection).
4.5. Model Computation Complexity
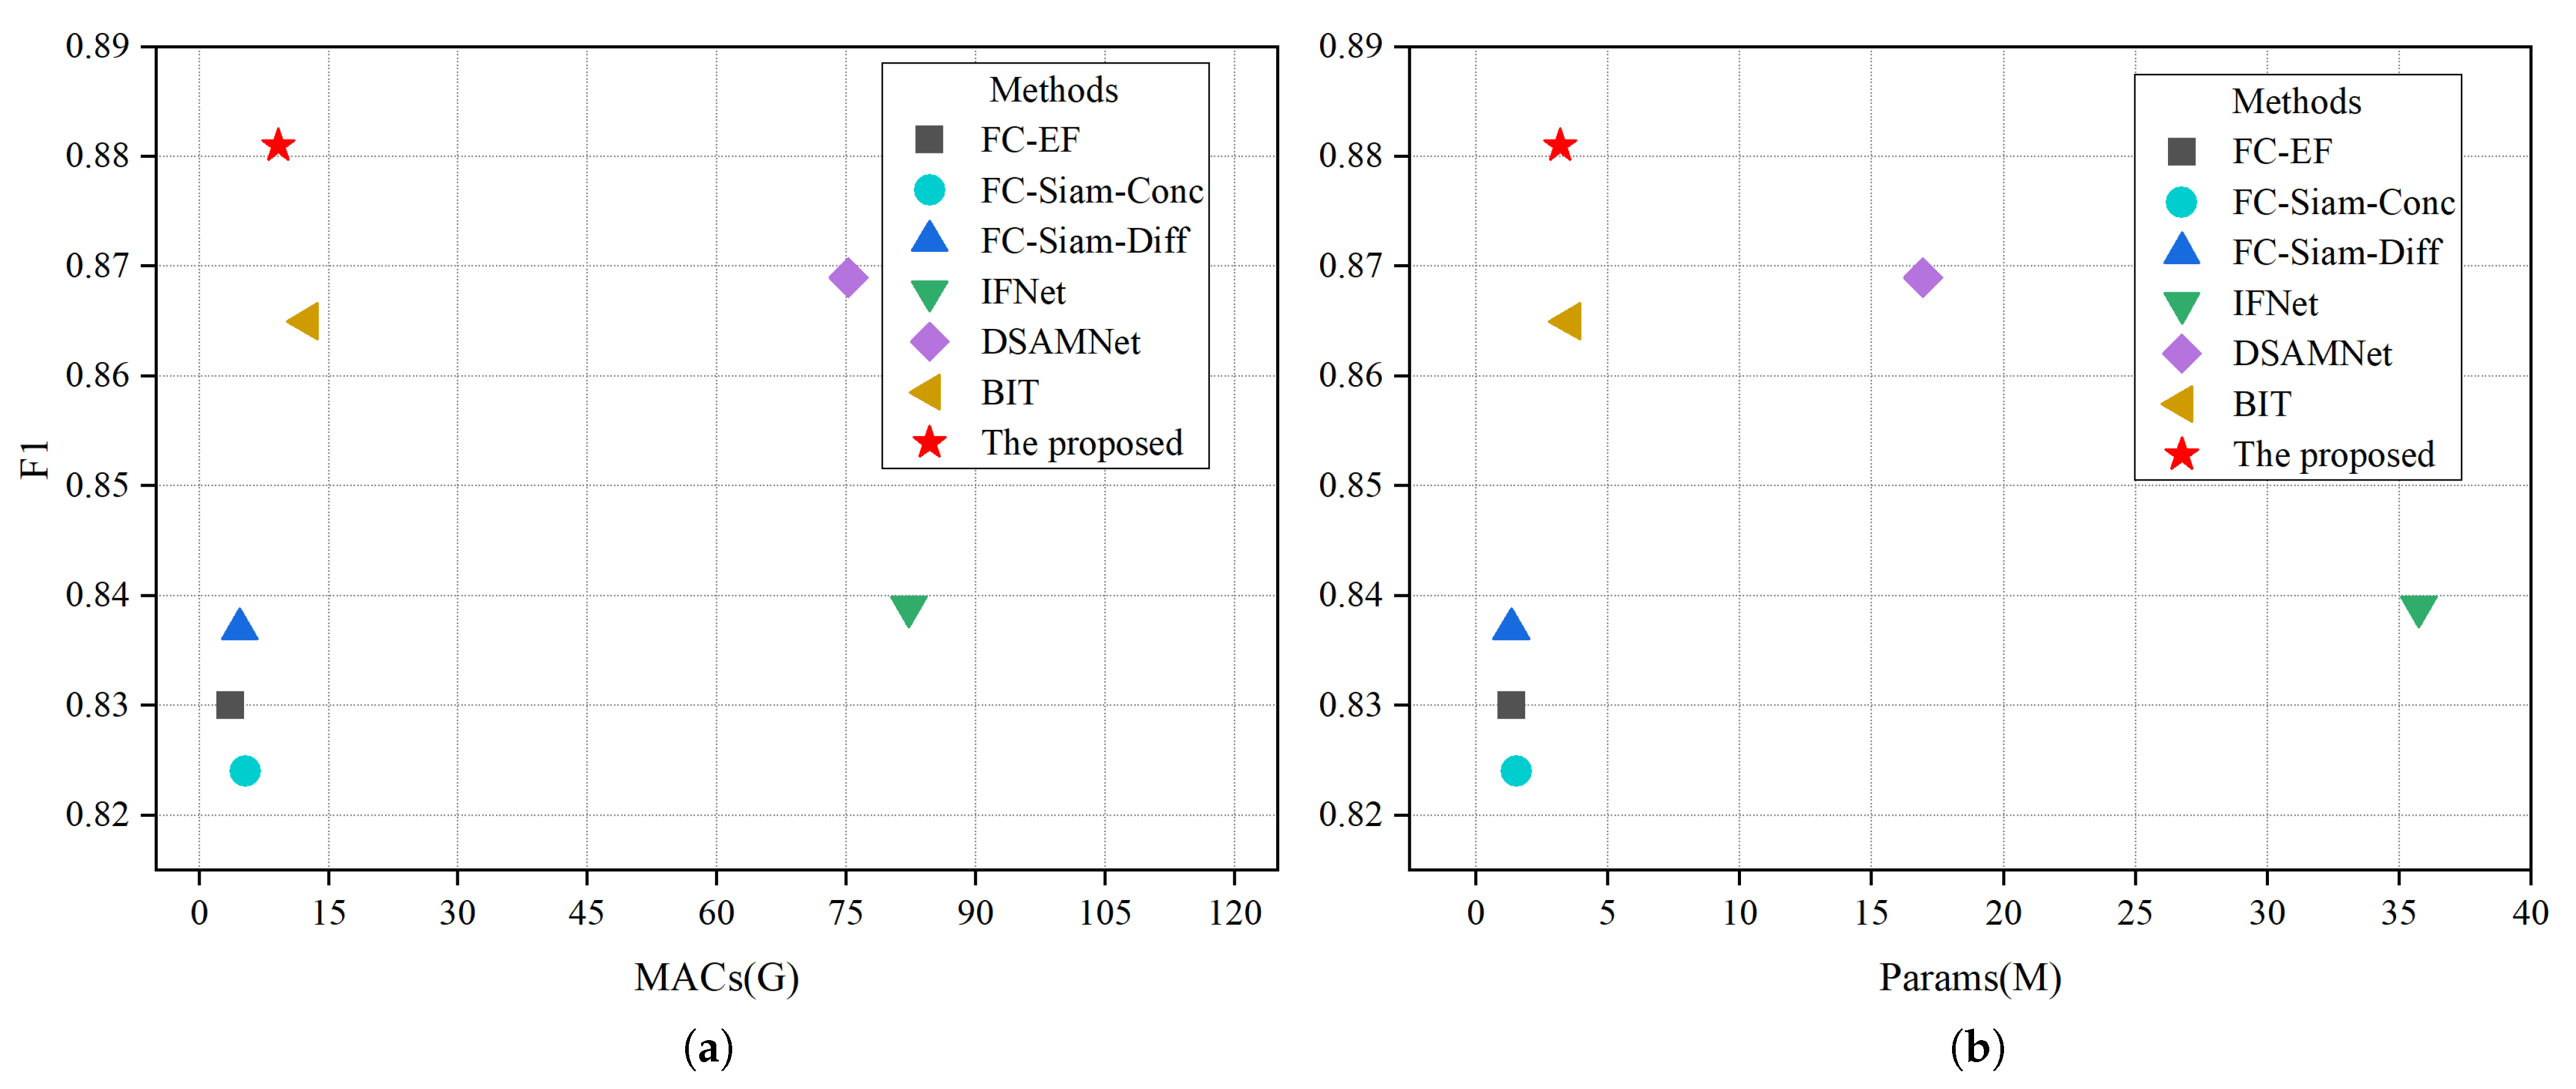
In addition, the computational efficiency of the model is evaluated by comparing the amount of parameter calculation of different models. To better compare the relationship between model complexity and model performance, we report the F1 vs. multiply accumulate operations (MACs) and F1 vs. the number of parameters (Params) trade-offs for the LEVIR-CD test set in Table 3. Among them, MACs can more comprehensively describe computational complexity from a mathematical perspective. It can be seen that our proposed method achieves the highest F1 score (88.1%) with a complexity of 9.15 G MACs and 3.20 M parameters. Figure 10 makes a visual comparison, and our proposed method has the lowest computational cost, which is more efficient than other models. Through the comparison of the above evaluation indicators, the results show that our method has advantages in predicting label edge fineness, false positive rate, and recall rate. At the same time, this model is more lightweight and more efficient. In summary, our proposed method has more model efficiency and accuracy advantages to achieve better change detection effects.
Table 3.
Performance-complexity trade-off for change detection on the LEVIR-CD dataset.
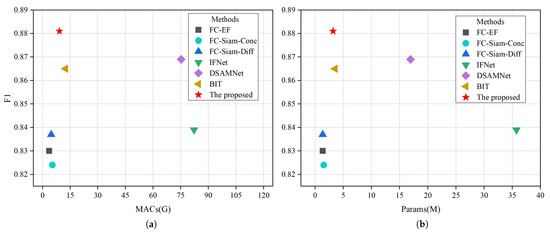
Figure 10.
Illustration comparison of performance, measured by F1 score. (a) an illustration comparison of performance and MACs, and (b) illustration comparison of performance and parameters.
5. Discussion
To verify the impact of different modules on the performance improvement of the network model, we use ablation experiments for comparative analysis. The comparison objects include the backbone network model without attention module (Base), the fusion basic hybrid attention block model (BAB), and the fusion multi-scale hybrid attention block model (MSAB). The experimental dataset adopts WHU-CD and LEVIR-CD.
First of all, compared with the baseline model (Base), composed of only a lightweight feature extraction module and a metric module, the BAB model incorporating the hybrid attention module can make full use of the channel information and spatial information of the input data, reduce the error detection caused by changes of image pairs in color and texture due to changes in illumination, and enhance the recognition ability of the model for changing features. Based on the BAB model, we introduce the multi-scale concept to form the multi-scale hybrid attention block (MSAB) and add the hybrid attention block to each sub-region of the feature map to further enhance the model’s ability to recognize and extract small-scale changing building features. In addition, after adding multi-scale segmentation, the model can identify the slight band-like noise on the edge caused by the registration error of the image pair so that the edge of the generated changing building label is smoother, and the misjudgment caused by the registration error is alleviated.
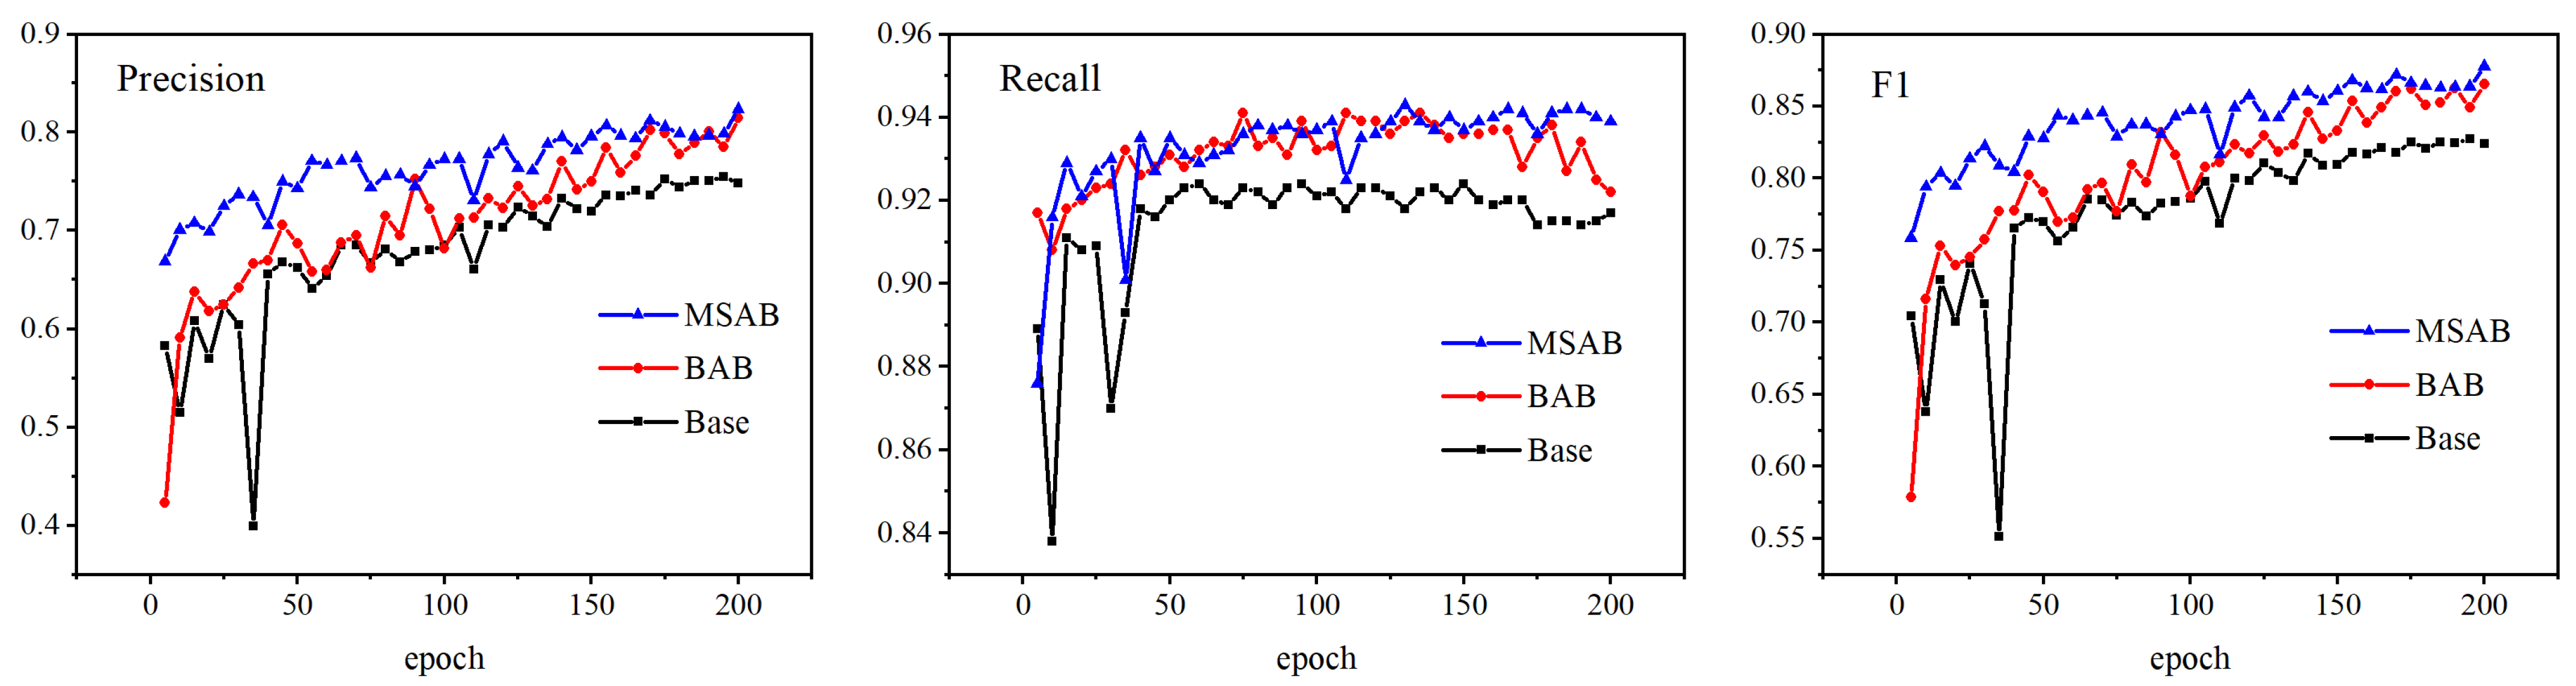
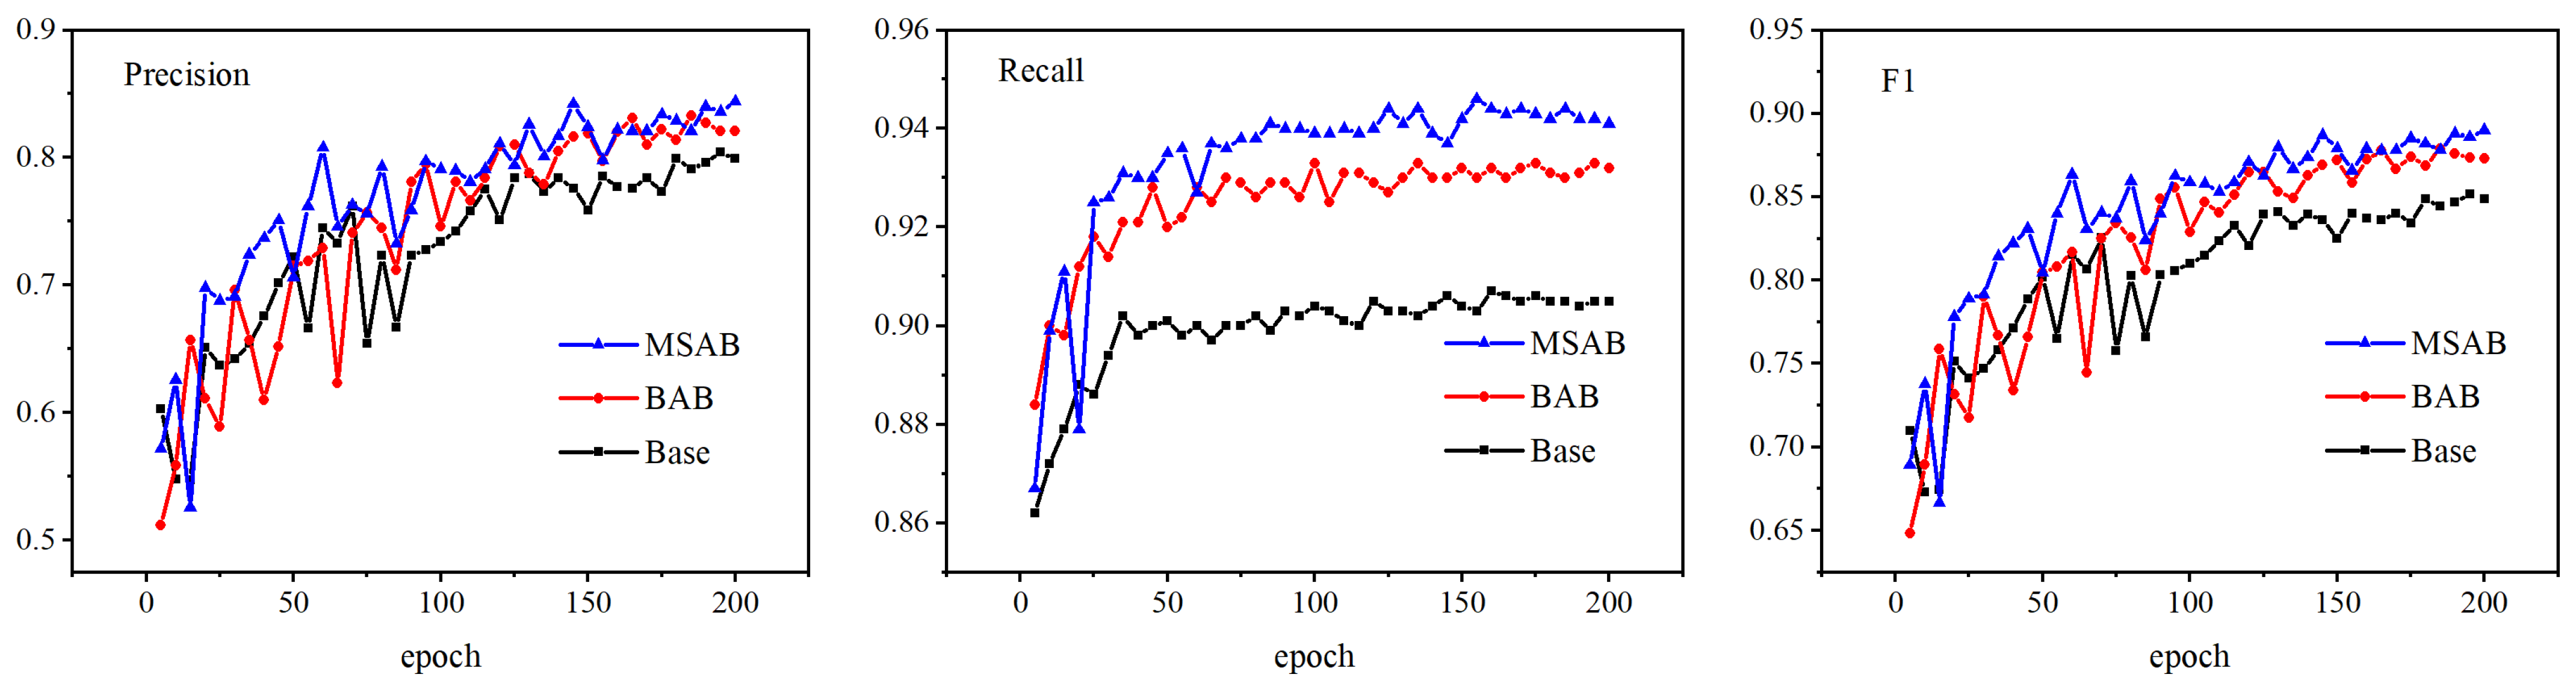
Figure 11 and Table 4 show the detection performance of our proposed module. In Figure 11, we select three representative evaluation indicators, Precision, Recall, and F1, to observe the changing trend of our proposed module on the WHU-CD validation set. By comparison, the baseline model lags behind BAB and MSAB regarding precision, recall, and F1 value. Compared with the baseline model and BAB model, MSAB incorporates a multi-scale hybrid attention module, which improves its ability to extract and process small-scale change building features, reduces the situation of roughness edge and missing prediction labels caused by the lack of explicit recognition of change features, and improves the model accuracy. Table 4 shows the experimental results of our model testing on the WHU-CD test set. Compared with the baseline model, the BAB model in the test set improves Precision, MIoU, and F1-score by 6%, 2.1%, and 3.9%, respectively. MSAB adds the concept of multi-scale based on BAB, which not only enhances the ability to recognize changing pixels but also increases the receptive field and further improves the model’s ability to recognize fine features. According to the changing trend of the evaluation index of the validation set, it can be seen that MSAB has obvious advantages compared with BAB and Base. At the same time, in the test set, compared with BAB, the Precision, MIoU, and F1-score of MSAB are improved by 3.8%, 3.6%, and 2.5%, respectively, which proves the effectiveness of our proposed module.

Figure 11.
Comparison results of different modules in the WHU-CD validation set.
Table 4.
Results of ablation study on the WHU-CD test set.
We also conduct ablation experiments on the LEVIR-CD dataset to ensure that our proposed method has good generality. The experimental results are shown in Figure 12 and Table 5. Figure 12 illustrates the changing trend of the results based on the LEVIR-CD validation set. It can be seen from the model that fusion of the multi-scale hybrid attention module is still better than the baseline model and the BAB model in the evaluation indicators of Precision, Recall, and F1-score. From the test set results in Table 5, it can be seen that the model after integrating the BAB module is better than the baseline model, the MIoU is increased by 2.2%, and the F1-score is increased by 2.8%. In addition, after integrating the MSAB module, each evaluation index has improved, of which the MIoU reaches 87.9%, and the F1-score reaches 88.1%, which are 5.6% and 5.4% higher than the baseline model, respectively. The experimental results show that the fusion of the multi-scale hybrid attention module enhances the ability to identify changing pixels. At the same time, it improves the receptive field and further enhances the model’s ability to identify fine features. Finally, increasing the experimental data set shows that the method proposed in this paper has good generalization ability.
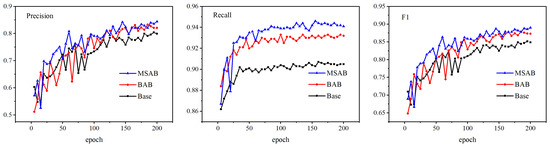
Figure 12.
Comparison results of different modules in the LEVIR-CD validation set.
Table 5.
Results of ablation study on the LEVIR-CD test set.
6. Conclusions
This study proposes a new lightweight building change detection model. The feature extraction module of the model is composed of CGB structures that aggregate contextual semantic information. The input data pass through parallel dilate convolutions and are calculated in a depthwise separable manner to obtain local contextual information in different ranges. This module fully learns the local and global salience features of change buildings, ensures that critical information is transmitted as efficiently as possible, and significantly reduces the number of model parameters and computation, improving the efficiency of building change detection tasks. In addition, we introduce a hybrid attention module composed of channel attention and spatial attention in the model. The fusion of the hybrid attention mechanism enhances the model’s ability to capture the spatial-temporal semantic information of remote sensing images. At the same time, the ability to identify pseudo-change features caused by image pair illumination changes and registration errors is improved. In addition, considering the scale difference of changing objects, to better extract features at each level, we construct a multi-scale hybrid attention module, which divides the input feature map at different scales and introduces a Hybrid attention mechanism to obtain detailed features at different scales and enhance model generalization ability and robustness. This study also confirms the feasibility and effectiveness of our proposed method by conducting experiments on two different datasets, WHU-CD and LEVIR-CD. Through many experiments, we have proved the superiority of this method, which is mainly reflected in the more refined edge prediction of changing buildings, which effectively reduces the missed detection rate of small buildings and the false detection caused by unreal changes.
Author Contributions
Conceptualization, Z.H.; methodology, Z.H.; software, Z.H., P.J. and C.S.; formal analysis, Z.H.; investigation, Z.H. and S.X.; resources, Z.H.; data curation, Z.H. and S.X.; writing—original draft preparation, Z.H.; writing—review and editing, Z.H., H.Y., P.J., C.S. and S.X.; visualization, Z.H. and P.J.; supervision, H.Y. All authors have read and agreed to the published version of the manuscript.
Funding
This research was funded by the National Natural Science Fundation of China under Grant No. U1304402.
Institutional Review Board Statement
Not applicable.
Informed Consent Statement
Not applicable.
Data Availability Statement
Not applicable.
Conflicts of Interest
The authors declare no conflict of interest.
References
- Singh, A. Review article digital change detection techniques using remotely-sensed data. Int. J. Remote Sens. 1989, 10, 989–1003. [Google Scholar] [CrossRef]
- Dong, H.; Ma, W.; Wu, Y.; Gong, M.; Jiao, L. Local descriptor learning for change detection in synthetic aperture radar images via convolutional neural networks. IEEE Access 2018, 7, 15389–15403. [Google Scholar] [CrossRef]
- Zhang, J.; Pan, B.; Zhang, Y.; Liu, Z.; Zheng, X. Building Change Detection in Remote Sensing Images Based on Dual Multi-Scale Attention. Remote Sens. 2022, 14, 5405. [Google Scholar] [CrossRef]
- Liu, R.; Jiang, D.; Zhang, L.; Zhang, Z. Deep depthwise separable convolutional network for change detection in optical aerial images. IEEE J. Sel. Top. Appl. Earth Obs. Remote Sens. 2020, 13, 1109–1118. [Google Scholar] [CrossRef]
- Patil, P.S.; Holambe, R.S.; Waghmare, L.M. EffCDNet: Transfer learning with deep attention network for change detection in high spatial resolution satellite images. Digit. Signal Process. 2021, 118, 103250–103262. [Google Scholar] [CrossRef]
- Luo, H.; Liu, C.; Wu, C.; Guo, X. Urban change detection based on Dempster–Shafer theory for multitemporal very high-resolution imagery. Remote Sens. 2018, 10, 980. [Google Scholar] [CrossRef]
- Wu, J.; Xie, C.; Zhang, Z.; Zhu, Y. A Deeply Supervised Attentive High-Resolution Network for Change Detection in Remote Sensing Images. Remote Sens. 2022, 15, 45. [Google Scholar] [CrossRef]
- Wang, Q.; Yuan, Z.; Du, Q.; Li, X. GETNET: A general end-to-end 2D CNN framework for hyperspectral image change detection. IEEE Trans. Geosci. Remote Sens. 2018, 57, 3–13. [Google Scholar] [CrossRef]
- Li, H.; Xiao, P.; Feng, X.; Yang, Y.; Wang, L.; Zhang, W.; Wang, X.; Feng, W.; Chang, X. Using land long-term data records to map land cover changes in China over 1981–2010. IEEE J. Sel. Top. Appl. Earth Obs. Remote Sens. 2017, 10, 1372–1389. [Google Scholar] [CrossRef]
- Li, Z.; Shi, W.; Myint, S.W.; Lu, P.; Wang, Q. Semi-automated landslide inventory mapping from bitemporal aerial photographs using change detection and level set method. Remote Sens. Environ. 2016, 175, 215–230. [Google Scholar] [CrossRef]
- Azzouzi, S.A.; Vidal-Pantaleoni, A.; Bentounes, H.A. Desertification monitoring in Biskra, Algeria, with Landsat imagery by means of supervised classification and change detection methods. IEEE Access 2017, 5, 9065–9072. [Google Scholar] [CrossRef]
- Lv, Z.; Liu, T.; Wan, Y.; Benediktsson, J.A.; Zhang, X. Post-processing approach for refining raw land cover change detection of very high-resolution remote sensing images. Remote Sens. 2018, 10, 472. [Google Scholar] [CrossRef]
- Yu, L.; Wang, Z.; Tian, S.; Ye, F.; Ding, J.; Kong, J. Convolutional neural networks for water body extraction from Landsat imagery. Int. J. Comput. Intell. Appl. 2017, 16, 1750001–17500013. [Google Scholar] [CrossRef]
- Kemker, R.; Salvaggio, C.; Kanan, C. Algorithms for semantic segmentation of multispectral remote sensing imagery using deep learning. ISPRS J. Photogramm. Remote Sens. 2018, 145, 60–77. [Google Scholar] [CrossRef]
- Yang, G.; Li, H.C.; Wang, W.Y.; Yang, W.; Emery, W.J. Unsupervised change detection based on a unified framework for weighted collaborative representation with RDDL and fuzzy clustering. IEEE Trans. Geosci. Remote Sens. 2019, 57, 8890–8903. [Google Scholar] [CrossRef]
- Ma, W.; Yang, H.; Wu, Y.; Xiong, Y.; Hu, T.; Jiao, L.; Hou, B. Change detection based on multi-grained cascade forest and multi-scale fusion for SAR images. Remote Sens. 2019, 11, 142. [Google Scholar] [CrossRef]
- Kit, O.; Lüdeke, M. Automated detection of slum area change in Hyderabad, India using multitemporal satellite imagery. ISPRS J. Photogramm. Remote Sens. 2013, 83, 130–137. [Google Scholar] [CrossRef]
- Qiu, L.; Gao, L.; Ding, Y.; Li, Y.; Lu, H.; Yu, W. Change detection method using a new difference image for remote sensing images. In Proceedings of the 2013 IEEE International Geoscience and Remote Sensing Symposium-IGARSS, Melbourne, Australia, 21–26 July 2013; pp. 4293–4296. [Google Scholar]
- Bruzzone, L.; Prieto, D.F. Automatic analysis of the difference image for unsupervised change detection. IEEE Trans. Geosci. Remote Sens. 2000, 38, 1171–1182. [Google Scholar] [CrossRef]
- Malila, W.A. Change vector analysis: An approach for detecting forest changes with Landsat. LARS Symp. 1980, 1, 385–397. [Google Scholar]
- Celik, T. Unsupervised change detection in satellite images using principal component analysis and k-means clustering. IEEE Geosci. Remote Sens. Lett. 2009, 6, 772–776. [Google Scholar] [CrossRef]
- Chen, H.; Wu, C.; Du, B.; Zhang, L.; Wang, L. Change detection in multisource VHR images via deep Siamese convolutional multiple-layers recurrent neural network. IEEE Trans. Geosci. Remote Sens. 2019, 58, 2848–2864. [Google Scholar] [CrossRef]
- Zhang, W.; Fan, H. Application of isolated forest algorithm in deep learning change detection of high resolution remote sensing image. In Proceedings of the 2020 IEEE International Conference on Artificial Intelligence and Computer Applications (ICAICA), Dalian, China, 27–29 June 2020; pp. 753–756. [Google Scholar]
- Duan, H.; Dong, X.; You, S.; Han, S. A Deep Learning Denoising Framework Based on FFDNet for SAR Image Change Detection. In Proceedings of the 2021 IEEE 11th International Conference on Electronics Information and Emergency Communication (ICEIEC) 2021 IEEE 11th International Conference on Electronics Information and Emergency Communication (ICEIEC), Beijing, China, 18–20 June 2021; pp. 1–4. [Google Scholar]
- Zhu, Q.; Guo, X.; Deng, W.; Guan, Q.; Zhong, Y.; Zhang, L.; Li, D. Land-use/land-cover change detection based on a Siamese global learning framework for high spatial resolution remote sensing imagery. ISPRS J. Photogramm. Remote Sens. 2022, 184, 63–78. [Google Scholar] [CrossRef]
- Ji, S.; Wei, S.; Lu, M. Fully convolutional networks for multisource building extraction from an open aerial and satellite imagery data set. IEEE Trans. Geosci. Remote Sens. 2018, 57, 574–586. [Google Scholar] [CrossRef]
- Chen, H.; Shi, Z. A spatial-temporal attention-based method and a new dataset for remote sensing image change detection. Remote Sens. 2020, 12, 1662. [Google Scholar] [CrossRef]
- REN, Q.; YANG, W.; WANG, C.; WEI, W.; QIAN, Y. Review of remote sensing image change detection. J. Comput. Appl. 2021, 41, 2294–2307. [Google Scholar]
- Zhao, J.; Liu, S.; Wan, J.; Yasir, M.; Li, H. Change detection method of high resolution remote sensing image based on DS evidence theory feature fusion. IEEE Access 2020, 9, 4673–4687. [Google Scholar] [CrossRef]
- Long, J.; Shelhamer, E.; Darrell, T. Fully convolutional networks for semantic segmentation. In Proceedings of the IEEE Conference on Computer Vision and Pattern Recognition, Boston, MA, USA, 7–12 June 2015; pp. 3431–3440. [Google Scholar]
- Daudt, R.C.; Le Saux, B.; Boulch, A. Fully convolutional Siamese networks for change detection. In Proceedings of the 2018 25th IEEE International Conference on Image Processing (ICIP), Athens, Greece, 7–10 October 2018; pp. 4063–4067. [Google Scholar]
- Liu, M.; Chai, Z.; Deng, H.; Liu, R. A CNN-transformer network with multiscale context aggregation for fine-grained cropland change detection. IEEE J. Sel. Top. Appl. Earth Obs. Remote Sens. 2022, 15, 4297–4306. [Google Scholar] [CrossRef]
- Liu, R.; Tao, F.; Liu, X.; Na, J.; Leng, H.; Wu, J.; Zhou, T. RAANet: A Residual ASPP with Attention Framework for Semantic Segmentation of High-Resolution Remote Sensing Images. Remote Sens. 2022, 14, 3109. [Google Scholar] [CrossRef]
- Bhujel, A.; Kim, N.E.; Arulmozhi, E.; Basak, J.K.; Kim, H.T. A lightweight Attention-based convolutional neural networks for tomato leaf disease classification. Agriculture 2022, 12, 228. [Google Scholar] [CrossRef]
- Liu, W.; Yang, J.; Zhao, J.; Yang, L. A novel method of unsupervised change detection using multi-temporal PolSAR images. Remote Sens. 2017, 9, 1135. [Google Scholar] [CrossRef]
- Yan, L.; Xia, W.; Zhao, Z.; Wang, Y. A novel approach to unsupervised change detection based on hybrid spectral difference. Remote Sensing 2018, 10, 841. [Google Scholar] [CrossRef]
- Zhang, M.; Liu, Z.; Feng, J.; Liu, L.; Jiao, L. Remote Sensing Image Change Detection Based on Deep Multi-Scale Multi-Attention Siamese Transformer Network. Remote Sens. 2023, 15, 842. [Google Scholar] [CrossRef]
- Chen, Y.; Bruzzone, L. Self-supervised remote sensing images change detection at pixel-level. arXiv 2021, arXiv:2105.08501. [Google Scholar]
- Fang, S.; Li, K.; Shao, J.; Li, Z. SNUNet-CD: A densely connected Siamese network for change detection of VHR images. IEEE Geosci. Remote Sens. Lett. 2021, 19, 1–5. [Google Scholar] [CrossRef]
- Hafner, S.; Ban, Y.; Nascetti, A. Urban Change Detection Using a Dual-Task Siamese Network and Semi-Supervised Learning. arXiv 2022, arXiv:2204.12202. [Google Scholar]
- Peng, D.; Zhang, Y.; Guan, H. End-to-end change detection for high resolution satellite images using improved UNet++. Remote Sens. 2019, 11, 1382. [Google Scholar] [CrossRef]
- Chen, H.; Qi, Z.; Shi, Z. Remote sensing image change detection with transformers. IEEE Trans. Geosci. Remote Sens. 2021, 60, 1–14. [Google Scholar] [CrossRef]
- Zheng, H.; Gong, M.; Liu, T.; Jiang, F.; Zhan, T.; Lu, D.; Zhang, M. HFA-Net: High frequency attention Siamese network for building change detection in VHR remote sensing images. Pattern Recognit. 2022, 129, 108717–108728. [Google Scholar] [CrossRef]
- Chollet, F. Xception: Deep learning with depthwise separable convolutions. In Proceedings of the IEEE Conference on Computer Vision and Pattern Recognition, Honolulu, HI, USA, 21–26 July 2017; pp. 1251–1258. [Google Scholar]
- Zhang, C.; Yue, P.; Tapete, D.; Jiang, L.; Shangguan, B.; Huang, L.; Liu, G. A deeply supervised image fusion network for change detection in high resolution bi-temporal remote sensing images. ISPRS J. Photogramm. Remote Sens. 2020, 166, 183–200. [Google Scholar] [CrossRef]
- Shi, Q.; Liu, M.; Li, S.; Liu, X.; Wang, F.; Zhang, L. A deeply supervised attention metric-based network and an open aerial image dataset for remote sensing change detection. IEEE Trans. Geosci. Remote Sens. 2021, 60, 1–16. [Google Scholar] [CrossRef]

Disclaimer/Publisher’s Note: The statements, opinions and data contained in all publications are solely those of the individual author(s) and contributor(s) and not of MDPI and/or the editor(s). MDPI and/or the editor(s) disclaim responsibility for any injury to people or property resulting from any ideas, methods, instructions or products referred to in the content. |
© 2023 by the authors. Licensee MDPI, Basel, Switzerland. This article is an open access article distributed under the terms and conditions of the Creative Commons Attribution (CC BY) license (https://creativecommons.org/licenses/by/4.0/).